
95% of researchers rate our articles as excellent or good
Learn more about the work of our research integrity team to safeguard the quality of each article we publish.
Find out more
ORIGINAL RESEARCH article
Front. Virtual Real. , 26 October 2023
Sec. Technologies for VR
Volume 4 - 2023 | https://doi.org/10.3389/frvir.2023.1253155
This article is part of the Research Topic Beyond audiovisual: novel multisensory stimulation techniques and their applications View all 11 articles
 Ramy Kirollos1,2*
 Chris M. Herdman2
Introduction: The present study sets out to determine which sensory system mostly influences self-motion perception when visual and vestibular cues are in conflict. We paired caloric vestibular stimulation that signaled motion in either the clockwise or counter-clockwise direction with a visual display that indicated self-rotation in either the same or opposite directions.
Methods: In Experiment 1 (E1), caloric vestibular stimulation was used to produce vestibular circular vection. In Experiment 2 (E2), a virtual optokinetic drum was used to produce visual circular vection in a VR headset. Vection speed, direction, and duration were recorded using a potentiometer knob the participant controlled in E1 and E2. In Experiment 3 (E3), visual and vestibular stimuli were matched to be at approximately equal speeds across visual and vestibular modalities for each participant setting up Experiment 4 (E4). In E4, participants observed a moving visual pattern in a virtual reality (VR) headset while receiving caloric vestibular stimulation. Participants rotated the potentiometer knob while attending to visual–vestibular stimuli presentations to indicate their perceived circular vection. E4 had two conditions: 1) A congruent condition where calorics and visual display indicated circular vection in the same direction; 2) an incongruent condition where calorics and visual display indicated circular vection in opposite directions.
Results and discussion: There were equal reports of knob rotation in the direction consistent with the visual and vestibular self-rotation direction in the incongruent condition of E4 across trials. There were no significant differences in knob rotation speed and duration in both conditions. These results demonstrate that the brain appears to weigh visual and vestibular cues equally during a visual–vestibular conflict of approximately equal speeds. These results are most consistent with the optimal cue integration hypothesis.
Vection is commonly defined as the illusory experience of self-motion while an individual is stationary (Dichgans and Brandt, 1978; Palmisano et al., 2015). An example of vection is sitting at a red light while an adjacent large vehicle such as a bus or truck pulls forward, creating the compelling illusion that the driver is moving backward despite being stationary. Circular vection is the illusion of perceived spinning about the yaw axis. Vection in all planes of motion such as illusory linear self-translation, or linear vection, and in the roll axis, referred to as tumbling, has also been produced and studied (Mach, 1875; Howard and Childerson, 1994; Riecke and Schulte-Pelkum, 2013). Vection is usually studied in the visual modality. However, there is research on vection in the auditory (Riecke et al., 2008; Keshavarz et al., 2014; Campos et al., 2018) and vestibular modalities (Fischer and Wodak, 1924; Cress et al., 1997; Fitzpatrick et al., 2002; St George et al., 2011; Fitzpatrick and Watson, 2015; Weech and Troje, 2017; Gallagher et al., 2020; Kirollos and Herdman, 2023).
Vection adds realism and immersion in training scenarios such as military and commercial flight simulation-based training, entertainment, and gaming (Riecke and Schulte-Pelkum, 2013). Understanding the behavioral (Brandt et al., 973; Gibson, 1966; Mach, 1875; Palmisano et al., 2000) and neurophysiological (Brandt et al., 1998; Nishiike et al., 2002; Kirollos et al., 2017; Berti et al., 2019) characteristics of vection has been of theoretical interest to researchers for over a century because of the sensory conflicts that can occur despite the illusion (Reason, 1978; Palmisano et al., 2000). An example of a sensory conflict from vection is any time visual displays, indicating acceleration/deceleration or direction change occurring with no corroborating information from other sensory systems, primarily the vestibular system, or vice versa.
The visual system excels in the detection of constant velocity motion and can also detect accelerations and decelerations (Howard, 1982). The vestibular system can detect accelerations/decelerations but cannot distinguish between constant velocity motion and being stationary because of the inertial properties of the endolymph fluid (Lishman and Lee, 1973). The peripheral vestibular apparatus is located in the inner ear and is made up of two otolith organs that detect linear accelerations (Purves et al., 2001). These are the saccule and the utricle. The semi-circular canals (SCCs) detect angular accelerations in the yaw, pitch, and roll axes. The horizontal SCC in each ear is positioned 30° below Earth’s horizontal axis and specializes in detecting velocity change in the yaw axis (Baloh, 2003). The superior SCC is optimized for detecting the pitch-axis rotation velocity change and the posterior SCC detects the roll-axis velocity change (Rabbitt, 2019). The posterior and superior SCCs are both positioned in the vertical plane but are orthogonally configured. SCCs contain the cupular membrane in which hair cells are embedded within the endolymph fluid and housed in the ampullae. When the head rotates left to right, the endolymph fluid and embedded hair cells lag. This lag due to inertia is complimentary in the left and right horizontal SCCs and signals motion direction detection to the brain via the 8th cranial nerve (Bordoni et al., 2021).
There are various methods that can be used to stimulate and examine the peripheral vestibular organs’ function without the individuals moving their heads. These include moving the individual (e.g., Barany chair and motion platform) and methods that do not require moving the individual. For instance, galvanic vestibular stimulation (GVS) uses electrodes that act on vestibular afferents when placed on the mastoid processes behind the ear. Some researchers have reported that GVS produces vestibular illusions of self-motion or vection (Fitzpatrick et al., 2002; Fitzpatrick and Day, 2004; St George et al., 2011; Fitzpatrick and Watson, 2015). However, vection generated by GVS can be brief and has been reported to produce a sudden tilting sensation rather than robust self-motion experience through space (Bense et al., 2001; Moore et al., 2011; Dilda et al., 2014; Aoyama et al., 2015).
Another method used to produce vestibular vection while an individual is stationary is by caloric vestibular stimulation (CVS). CVS alters the temperature of the endolymph fluid primarily in the horizontal SCC by administering a current of cool or warm air or water relative to body temperature via the external auditory canal (Barany, 1906). The air or water is preset to be different than body temperature, thus creating a thermal gradient that changes the endolymph fluid’s density. A convection current produces a pressure change across the cupula after the endolymph fluid is sufficiently heated or cooled. The endolymph fluid shifts, resulting in perceived spinning and resembling what happens during the yaw motion of the head or vestibular vection.
CVS has seldom been used to study vestibular vection (Kirollos and Herdman, 2023). In contrast, CVS has primarily been used to assess vestibular health and function (Barany, 1906; Coats et al., 1976; Jacobson, 1993; Gonçalves et al., 2008; Sluga et al., 2021). The direct link between extra ocular muscles and SCCs allows for the use of CVS to trigger an eye movement called the vestibular ocular reflex (VOR) to assess vestibular health (Högyes, 1913; Goldberg et al., 1987). The VOR keeps the image steady on the retina when the head moves. CVS has also been used to study fluid dynamic properties in the inner ear (Meiry and Young, 1967; Kassemi et al., 2004; Kassemi et al., 2005; Santos et al., 2017; Rabbitt, 2019; Wu et al., 2021), assess spatial orientation in vestibular patients (Karnath, 1994; Moon et al., 2006), for neuroimaging of vestibular cortical regions (Frank et al., 2014; Frank and Greenlee, 2014; Frank et al., 2016; Klaus et al., 2020), and as a clinical intervention in patients with schizophrenia, psychosis, and psychopathy (Levy et al., 1983; Jones and Pivik, 1985).
A minority of studies on visual–vestibular sensory integration have found evidence supporting the notion of visual dominance during a conflict, specifically demonstrating that visual displays can influence posture in the absence of the vestibular input (Berthoz et al., 1975; Lee and Lishman, 1975; Lishman and Lee, 1973; Warren, 1895). Some studies have also demonstrated vestibular dominance during a conflict. For instance, Butler et al. (2010) found heading (i.e., the ability to perceive and distinguish the implied direction of self-motion from an optic flow pattern) to be more consistent with vestibular cues than with visual cues. Moreover, Harris et al. (2000) found that estimations of a person’s traversed distance were more consistent with vestibular cues than with visual cues. However, most studies on visual–vestibular sensory integration have demonstrated that information from different sensory systems is fused in a statistically optimal fashion to reduce perceptual uncertainties, consistent with the optimal cue integration hypothesis (Clarke and Yuille, 1990; Telban and Cardullo, 2001; Ernst and Banks, 2002; Reymond et al., 2002; Gu et al., 2008; de Winkel et al., 2010; Fetsch et al., 2010; Jürgens and Becker, 2011; de Winkel et al., 2013; Jürgens et al., 2016; Rohde et al., 2016). The optimal cue integration hypothesis posits that the brain will rely on the sensory cue, providing the most reliable information, where “reliability” is defined as the inverse of a cue’s variability (Fetsch et al., 2010). Some studies have reported deviations from the optimal cue integration hypothesis (de Winkel et al., 2010; Fetsch et al., 2012; de Winkel et al., 2015) and that cue reliability can be dynamic (Fetsch et al., 2009). Many of these studies pair a visual pattern of dots with a motion platform that moves linearly or angularly, generating congruent and incongruent conditions to study the heading and vection directions.
Weech and Troje (2017) showed that visual vection onset times are significantly reduced when noisy GVS (i.e., GVS signaling motion in no particular direction) is administered while viewing a visual display signaling vection. Visual vection has also been shown to be stronger when noisy vestibular signals are applied simultaneously compared to visual vection with no noisy GVS (Weech et al., 2018; Weech et al., 2020). Cress et al. (1997) reported significantly more convincing vection by participants when GVS that induced the roll axis tilt was combined with a visual display, indicating a tilt in the same direction compared to only viewing the visual display in the absence of GVS. The common finding between these three studies is that the reliability of the vestibular cue is decreased by noisy GVS and that the visual cues become relied upon by the individual. In all these studies, the unreliable vestibular signal generated by noisy GVS appears to cause a sensory reweighting to favor the visual cue, consistent with predictions made by the optimal cue integration hypothesis.
Kirollos and Herdman (2023) extended these findings using CVS in a recent experiment. In the first condition, participants received CVS with eyes closed. In the second condition, participants received CVS with eyes open, while they observed a stationary display signaling no self-motion in a virtual reality (VR) headset. Participants rotated a potentiometer knob that recorded the direction, speed, and duration of vection. Findings from the first condition indicated that circular vection can be induced in the vestibular system using CVS. In the second condition, participants still experienced vection despite a visual–vestibular conflict (i.e., visual cues signaling no motion while calorics acted as vestibular cues signaling spinning). However, vection was significantly shorter and slower during a conflict (Condition 2) than during no conflict (Condition 1). Kirollos and Herdman (2023) concluded, based on their results, that neither the visual nor vestibular systems dominated self-motion during a conflict and that the results were most consistent with the optimal cue integration hypothesis.
In the present study, we extended findings of Kirollos and Herdman (2023) by presenting participants with a visual display that moved during CVS administration. This is in contrast to the stationary display used in Kirollos and Herdman (2023). A visual–vestibular conflict was created in the present study using CVS to produce vestibular vection at approximately equal speed, as in the visual modality at the same time but in the opposite direction.
Four experiments were conducted in this paper with the same participants over 10 weeks. Perceived vection speed, direction, and duration were recorded using a potentiometer knob in Experiment 1 (E1) and Experiment 2 (E2) [see Kirollos and Herdman (2021) and Kirollos and Herdman (2023) for details and validation of this method].
In E1, participants received CVS with their eyes closed to confirm that they experienced vestibular circular vection. In E1, we hypothesized that CVS would induce vection in the clockwise (CW) direction in majority of left-ear cool air irrigations and counter-CW (CCW) vection in right-ear cool air irrigations. These findings would be consistent with the finding that cold air or water CVS relative to body temperature produces eye movements in the direction opposite to the ear being irrigated and that warm air or water CVS produces eye movements in the same direction as the ear being stimulated (Jacobson, 1993; Kirollos and Herdman, 2023). Therefore, during all cold CVS trials in this study, left-ear CVS should produce CW vection in the yaw-axis and right-ear CVS should produce CCW vection in the yaw-axis accordingly. We also hypothesized that vestibular vection speeds and durations would not differ substantially across trials because factors assumed to impact vestibular vection speed and duration, including temperature and air pressure, were held constant throughout the experiment (Wu et al., 2021).
In E2, the same participants observed a virtual optokinetic drum presented in a VR headset. They did not receive CVS. We hypothesized that the participants would experience vection in the direction indicated by the visual display in E2 at a speed that was faster than that indicated by the visual display, replicating Kirollos and Herdman (2021).
In Experiment 3 (E3), participants underwent one CVS trial at the start of the experiment. They were asked to remember their speed of spinning. The method of adjustment was then used by the participants to match the speed of vection they experienced from CVS to visual vection trials.
In Experiment 4 (E4), participants underwent two conditions: a) a congruent condition where visual and vestibular vection directions were the same and b) an incongruent condition where the visual and vestibular vection directions were different. Visual and vestibular directions in E4 were set to be the same based on the method of adjustment, matching the task performed in E3 for each participant. We hypothesized that participants would experience faster vection in the congruent condition compared to the incongruent condition. We also hypothesized that visual and vestibular cues would be used equally in deciding the self-motion direction in the incongruent condition. These findings would be consistent with the optimal cue integration hypothesis and findings from Kirollos and Herdman (2023).
The objective of E1 was to assess if participants experienced vestibular vection using CVS. CVS with cold air was used to induce vestibular vection, replicating an experiment from Kirollos and Herdman (2023).
A total of 16 participants were recruited from Carleton University in accordance with an ethics package approved by the local university ethics board. Participants who reported visual or vestibular abnormalities, history of concussion, or who did not respond to vestibular vection were excluded from this study. Of these 16 participants, three participants did not sense vestibular vection in E1 and an additional three participants were removed because they experienced discomfort from CVS and did not wish to continue. A total of 10 participants (four female and three left-handed, MAGE = 26.2, SDAGE = 3.1) were included in the final analysis from E1. All participants were paid and agreed to participate in experiments 1–4.
The irrigator shown in Figure 1 delivered air via a glass speculum fitted with a disposable rubber tip to a participant’s ear.
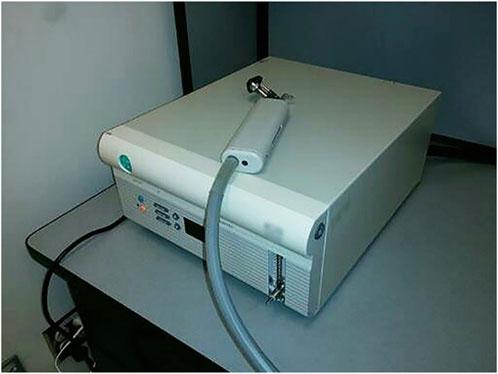
FIGURE 1. ICS Air Caloric Irrigator. Photo credit: Ramy Kirollos.
The SpinTrak rotary potentiometer knob shown in Figure 2 was used to record circular vection speed, direction, and duration previously developed, validated, and used in Kirollos and Herdman (2021) and Kirollos and Herdman (2023). The knob was circular, had a diameter of 4.4 cm, and could only be turned CW or CCW indefinitely. It had a tachometer and a high-resolution pulse rate of 1,200 units over 360° for precise knob position tracking and recording. The knob was USB-integrated with custom software that logged turn rates in °/s at 75 Hz. It was housed in a custom-built wooden box and rested on the participant’s stomach during testing.
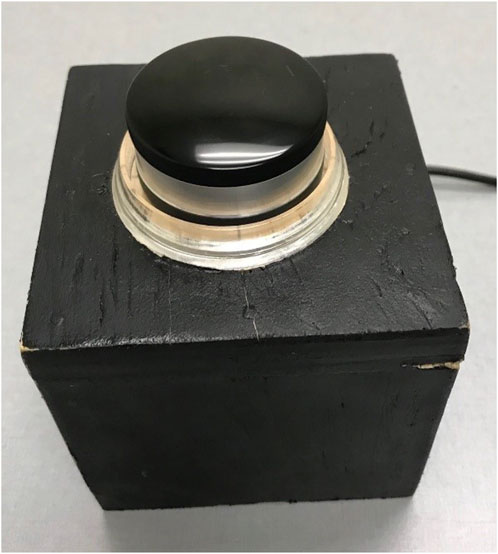
FIGURE 2. Potentiometer knob used by participants to index vection. Photo credit: Ramy Kirollos.
The computer logging knob data comprised an Intel Core i7 processor, an NVIDIA GeForce GTX980 graphics card, and 16 GB RAM.
CVS trials were performed monaurally or one ear at a time. All CVS trials were performed at the same and constant temperature of 18°C and a constant air pressure of 10 L/min in all trials. These values were chosen to maximize chances of inducing vestibular vection. The participants underwent two left-ear and two right-ear irrigations, totaling four trials per participant. Each irrigation lasted between 90 and 180 s depending on when participants reported experiencing a robust spinning sensation in either the CW or CCW direction.
The participants were tested individually in a dark and quiet room with eyes closed and wore a blindfold. They laid down in the supine posture on a table with their heads rested on a 30°-angle wedge pillow to optimally stimulate horizontal SCC by ensuring it is parallel with Earth’s horizontal axis (Baloh, 2003). The participants rested the potentiometer knob on their stomach and had their dominant hand’s index finger positioned on the knob. They held the wooden box containing the knob with their non-dominant hand, as shown in Figure 3. The experimenter visually inspected the participants’ ear for any obstruction that may reduce the efficacy of CVS before the experiment began.
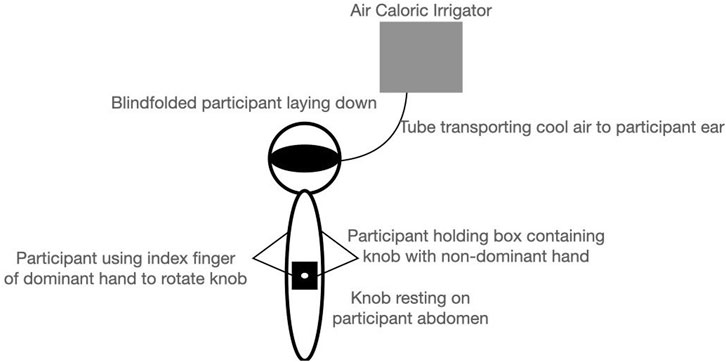
FIGURE 3. Schematic representation of a participant laying down in the supine posture blindfolded and holding a knob on their abdomen during CVS trials in E1.
The participants were asked to demonstrate CW and CCW rotation of the knob with their dominant index finger to the experimenter to avoid confusion about the direction during trial response periods. When irrigation began, the participants verbally described the self-motion direction and strength to the experimenter. Once a robust spinning sensation was reported, the participant rotated the knob in the direction and at the speed of the vection continuously for the length of the trial as long as they experienced a robust and consistent spinning sensation to match the speed of their vection. The knob had little friction, so the participant could easily continuously rotate it. The experimenter was in the room for the duration of the experimenter and observed the participant spinning the knob with their index finger. The experimenter ensured the knob direction was consistent with the verbally reported vection direction. The participants were instructed to verbally report when they no longer experienced vection and to stop spinning the knob, prompting the experimenter to end the trial. If participants reported swaying, rotation but with no precise direction, or no self-rotation, they were instructed not to rotate the knob. The participants were given at least 10-min breaks between CVS trials to allow time for endolymph fluid in the inner ear to reach the normal body temperature and resulting vestibular circular vection to subside. During breaks, the participants kept their eyes closed for the first 2 min to avoid any possible nausea and disorientation resulting from any lingering vection. This procedure was repeated four times, alternating left and right ear CVS. The experiment lasted approximately 90 min.
Vection direction data were analyzed with a McNemar test. Vection speed and duration data were analyzed using within-subjects t-tests.
The participants experienced vection on 33 of 40 trials (82.5%). Of the 20 left-ear irrigation trials, the participants reported experiencing CW rotation on 12 trials and reported experiencing CCW rotation on four trials. Of the 20 right-ear irrigation trials, the participants reported experiencing CW rotation on 10 trials and reported experiencing CCW rotation on seven trials. A McNemar test revealed that there was no significant difference for the ear irrigated in the direction of perceived vection, p = 0.50.
The mean speed (°/s) from each trial in the left (M = 125.7, SD = 116.9) vs. right (M = 130.6, SD = 100.7) ear was compared with a within-subjects t-test. The effect of the ear irrigated on the speed of knob rotation was not significantly different (t < 1, df = 9).
The mean vection duration (s) from each trial in the left (M = 46.9, SD = 20.7) vs. right (M = 48.2, SD = 19.9) ear was compared with a within-subjects t-test. The effect of the ear irrigated on the duration of rotation was not significant (t < 1, df = 9).
A difference was expected in the vection direction between the left- and right-ear irrigations. This is because according to the eye movement data in Jacobson (1993), cool air calorics in the left ear should result in vection in the CW direction and cool air calorics in the right ear should result in vection in the CCW direction, but we did not find this to be the case. This also conflicts with the findings from Kirollos and Herdman (2023), where cool air irrigation was used and majority of left-ear irrigations resulted in CW vection and majority of right-ear irrigations resulted in CCW vection. Although a significant difference in directions was found in Kirollos and Herdman (2023), there was variability in directions. Moreover, the sample was smaller in the current study (n = 10), compared to Kirollos and Herdman (2023) (n = 24), likely contributing to the variability in current results.
There were no significant differences between the left- and right-ear trials in the vection speed and duration. It was expected that there would be no difference in the vection speed and duration because temperature and air pressure were held constant throughout trials. Importantly, long vestibular vection durations upward of 45 s on average were observed, replicating findings from Kirollos and Herdman (2023).
We confirmed that vestibular vection can be experienced as demonstrated by the majority of trials in E1. However, the vection direction varied more than anticipated. It was important to confirm vestibular vection in E1 because vestibular vection is more variable and difficult to induce than visual vection, better ensuring that participants in E4 would experience a visual–vestibular conflict.
The objective of E2 was to ensure participants from E1 experienced visual vection. The 10 participants from E1 returned to the laboratory for E2. The participants viewed a vertical-striped virtual cylinder presented in a VR headset at three distinct constant velocities in the CW and CCW directions, totaling six conditions. We predicted that participants would experience visual vection and that the speed of knob rotation would be linked to the display speed. Based on findings from Kirollos and Herdman (2021), we predicted that participants would rotate the knob faster than the speed of the display and that the display speed would result in significantly different knob rotation speeds.
An Oculus Rift DK2 VR headset provided a 110° diagonal visual angle, a native resolution of 960 × 1,080 pixels per eye, and a 75 Hz refresh rate. The left- and right-eye displays presented the same image at different perspectives, promoting a 3D perception of the stimuli. Other apparatus used were the knob and computer, as in E1.
The graphics display presented in the VR headset simulated a drum with a 200-cm diameter, as shown in Figure 4. When wearing the VR headset, the observer’s viewpoint was set to the center of the virtual drum. The participant’s body was aligned vertically with the cylinder and the stripes. Each stripe in the display corresponded to a width of 33 cm in the virtual graphics environment and subtended a horizontal visual angle of 10.85° at a virtual viewing distance of 100 cm. The vertical stripe pattern that was presented on the VR display moved in the CW or CCW directions at one of the three distinct speeds, 37.5°/s (“slow”), 56.25°/s (“medium”), and 75°/s (“fast”), resulting in six conditions. These speeds were chosen based on pilot tests from Kirollos and Herdman (2021) and replicate speeds used for experiments in that work.
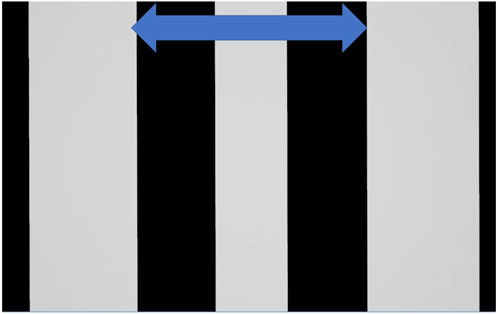
FIGURE 4. Virtual optokinetic drum presented in the VR headset in E2. The drum was presented in the VR headset and appeared in 3D while the participant lay supine with their heads tilted slightly forward on the wedge pillow. Stripes moved either CW or CCW.
The six conditions were presented six times each, totaling 36 trials that were presented in a random order to each participant. The 36 trials were split across four blocks (nine randomized trials per block). Each block lasted approximately 5 min and was followed by a 5-min break. The experiment lasted a total of 30 min.
The participants laid supine in a dark room with their heads pitched forward on the 30° wedge pillow, as in E1. Once the participants were ready, the display was adjusted in the VR headset such that they were positioned in the center of the drum with the vertical lines of the drum being parallel to their body axis. The VR headset display was mirrored on a monitor for the experimenter to have the same view as the participant. The participants observed 3–5 practice trials and rotated the knob at the speed, in the direction, and for the duration they experienced visual vection to become familiarized with the VR headset, stimulus, task, and potentiometer knob before the experiment began.
Vection speed and duration were analyzed in separate 3 (drum speed: 37.5°/s vs. 56.25°/s vs. 75°/s) by 2 (direction: CW vs. CCW) repeated measures ANOVA. Post hoc comparisons were made using 95% confidence intervals (Jarmasz and Hollands, 2009).
Vection speed data are shown in Figure 5. There was a significant main effect of drum speed, F(2, 18) = 4.96, p < .05, and R2 = 0.36, where faster drum speeds resulted in faster knob rotations. There was no significant main effect of direction (F < 1) on the knob rotation speed and no significant interaction between the drum speed and direction (F < 1) on the knob rotation speed. As shown in Figure 5, 95% confidence intervals indicated a significant difference between slow–fast and medium–fast conditions in the CW direction. In the CCW direction, there was a difference between all drum speed conditions.
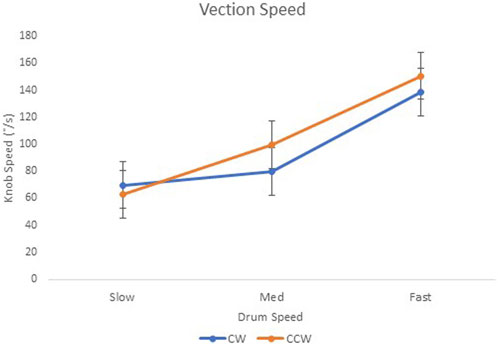
FIGURE 5. E2 knob rotation speed (°/s) when viewing three drum speeds in the clockwise (“CW”) and counter-clockwise (“CCW”) directions. Error bars represent 95% confidence intervals for the analysis.
Vection duration data are shown in Figure 6. There was a significant main effect for drum speed on vection duration, F(2, 18) = 4.98, p < .05, and R2 = .36. The 95% confidence intervals indicated that there was a significant difference between the slow–medium and slow–fast conditions in the CW direction. There was a significant difference for slow–fast and medium–fast conditions in the CCW direction. There were no observed interaction effects between the drum speed and direction (F < 1).
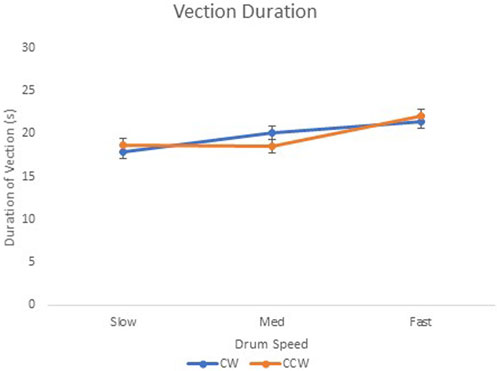
FIGURE 6. E2 vection duration (s) when viewing the three drum speeds (slow, medium, and fast) in the clockwise (“CW”) and counter-clockwise (“CCW”) directions. Error bars represent 95% confidence intervals for the analysis.
E2 showed that participants experienced visually induced vection when viewing a rotating virtual drum. As found previously, a faster drum speed resulted in faster and longer vection in E2 (Melcher and Henn, 1981; Palmisano and Gillam, 1998; Owens et al., 2018; Bos et al., 2019; Kirollos and Herdman, 2021). The results from E1 and E2 helped ensure that participants would perceive self-rotation in both the vestibular and visual modalities in E4.
The objective of E3 was to determine an approximately equal vection speed across the visual and vestibular modalities for each participant. This was to ensure that both visual and vestibular cues were perceived as equal in speed and, therefore, reliable when used in E4. In the current experiment, the participants from E1 and E2 underwent a vestibular–visual vection speed-matching task using the method of adjustment (Gescheider, 1997).
The ICS 200 Air Caloric Irrigator was set to 18°C and 10 L/min. One CVS trial was performed on each participant in either the left or right ear randomly while in the supine posture with their heads pitched forward at 30° on the wedge pillow. The irrigation lasted 90–180 s depending on when the participants reported vection, which they described to the experimenter verbally. The participants were instructed to monitor and remember the speed of vestibular vection from CVS while their eyes were closed. The participants were then given a 10-min break.
After the CVS trial and follow-on break, the participants wore the VR headset and observed the optokinetic drum. The drum rotated in the CW or CCW directions 18 times each, totaling 36 trials. The participants were tasked with identifying a visual vection speed that best matched their vestibular vection speed from the CVS trial. Although the method used herein relies on participants remembering the stimulus, the participants were familiar with the process and experience of vestibular vection from E1. Thus, we anticipated participants could accurately perform this task, given the instructions and their previous experience with the stimuli from E1. Speeds of the drum varied from 20° to 350°/s randomly across trials. An Xbox 360 controller was used by the participant for them to select the visual drum speed that produced visual vection most similar to vestibular vection experienced during the caloric irrigation trial, as shown in Figure 7. The participants were instructed to use the left and right shoulder buttons of the Xbox 360 controller on each of the 36 trials to slow down (left shoulder button) or speed up (right shoulder button) the optokinetic drum by speed increments of 5°/s on each trial until they matched it to the vestibular vection speed experienced. When the participants identified the visual display that induced vection at the same speed experienced during CVS, they pressed the “A” button on the Xbox controller to log their response, ending the trial. The participants could only select a visual speed after a 10-s onset to ensure they experienced visual vection because the visual vection onset typically requires a few seconds to experience (Allison et al., 2012; Weech and Troje, 2017). The 36 trials were evenly split over four blocks each containing nine trials. Each block was separated by 5-min breaks to limit potential cybersickness. The experiment lasted approximately 45 min.
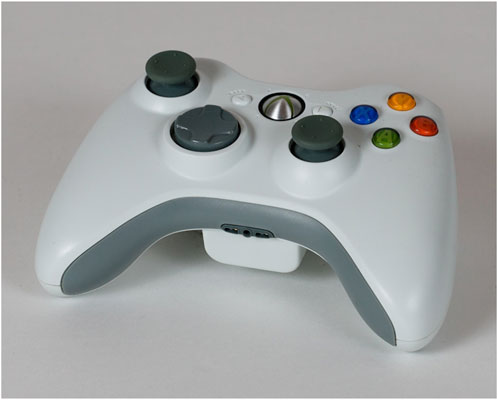
FIGURE 7. “Xbox 360 Controller” by Benjamin (2008). Licensed under CC BY-SA 2.0.
Participants’ mean visual vection speed matching their vestibular vection speed is shown in Figure 8. There was little within-subjects variability as the error bars representing standard deviations in Figure 8 indicate, implying that the participants were reasonably sure of the speed at which they felt they were moving during vestibular vection trials. The results highlight the substantial between-subjects variability in perceived self-rotation perception by air caloric vestibular stimulation, emphasizing the importance of performing the present experiment as visual–vestibular vection matching is experienced differently between individuals. The mean visual speeds for each participant obtained in this experiment were used as the preset visual display speed for that specific participant in E4. Vection after-effects were presumed to be negligible because of the random trial direction that should have cancelled out any such effects.
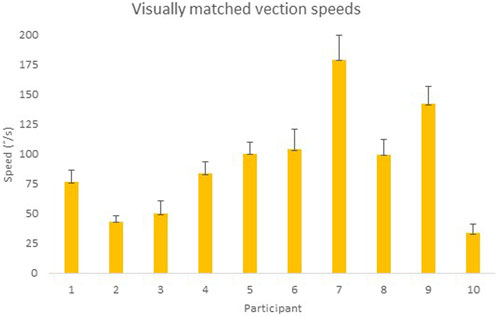
FIGURE 8. Means of the visual display speed that best represented each participant’s vestibular vection experience in °/s. Error bars represent standard deviations.
The main experiment in this study was E4. Based on the E3 results, we assumed that participants would perceive both visual and vestibular cues as equally reliable in E4 as their speeds were made similar. The goal of E4 was to determine how self-motion is decided when visual and vestibular signals are in conflict but approximately equal in terms of reliability. In the current experiment, the average visual vection speed each participant selected in E3 was set as the drum speed for that participant. There was a congruent condition and an incongruent condition. In the congruent condition, vection was signaled in the same direction in the visual and vestibular modalities. In the incongruent condition, vection was signaled in the opposite direction in the visual and vestibular modalities.
We hypothesized that the participants would experience faster and longer vection in the congruent condition than in the incongruent condition. We also hypothesized that the participants would use visual and vestibular cues approximately equally to judge their vection direction in the incongruent condition consistent with the optimal cue integration hypothesis (Fetsch et al., 2012). However, it was not clear how cue reliability might be expressed in our experiment using the potentiometer knob. For instance, it was possible that participants use the visual direction in one half and vestibular motion in the other half of incongruent trials. In addition, cue reliability in the incongruent condition could have resulted in vection cancelling out and participants not turning the knob. We did not anticipate that visual cues or vestibular cues would dominate a large majority of the incongruent condition directions as this would be inconsistent with the optimal cue integration hypothesis literature.
The apparatus used were the Oculus VR headset, the ICS 200 Air Caloric Irrigator, and the potentiometer knob from E1 and E2. The vestibular stimulus was 18°C air caloric irrigation administered at 10 L/min. The Oculus DK2 device was used to present the optokinetic drum to the participant. The experimenter set the speed of the visual display for each participant at the start of the experiment based on the participant’s mean drum speed obtained in E3. Each participant underwent two congruent trials and two incongruent trials. Left- and right-ear irrigations were alternated across trials, and the congruent and incongruent conditions were counter-balanced, as in E1. The participants were naïve as to whether they were in a congruent or incongruent trial.
The procedure was identical to that in E1 (Section 2.1.4). However, when the participants verbally reported the direction of vestibular vection, the experimenter set the motion of the virtual drum in either the direction congruent with participant’s reported vestibular vection direction or opposite to the direction of their vestibular vection based on whether the participant was in a congruent or incongruent condition. The participants opened their eyes and viewed the moving drum in the VR headset and rotated the knob in the direction and at the speed at which they felt they were moving. The experiment lasted approximately 90 min.
Exactly equal numbers of visual and vestibular direction reports were found in the 16 incongruent trials. Vection speed and duration data were analyzed with four within-subjects t-tests. The first two t-tests compared congruent vs. incongruent responses for speed and duration data, respectively, to determine if the vection speed and duration were different. The third and fourth t-tests compared visual vs. vestibular responses for speed and duration, respectively, to determine if one modality yielded different vection results.
Two of the 10 participants did not experience vestibular vection and were, therefore, excluded from the analysis. Each of the remaining eight participants completed four trials: two congruent and two incongruent trials. This totaled 32 trials in the experiment: 16 congruent trials and 16 incongruent trials. Self-rotation was reported on 31 of the 32 trials (97%): one congruent trial did not yield a response by a participant. The vection direction data are summarized in Table 1. In the incongruent condition, the participants reported vection in the direction indicated by vestibular stimulation on eight trials and reported vection in the visual direction on the remaining eight trials. Of the eight participants, three reported vection consistent with the visual cues for vection on both incongruent trials and three reported vection consistent with the vestibular cues for vection on both incongruent trials. The two remaining participants experienced vection consistent with the visual direction of vection in one trial and based on the vestibular direction of motion in the other trial.
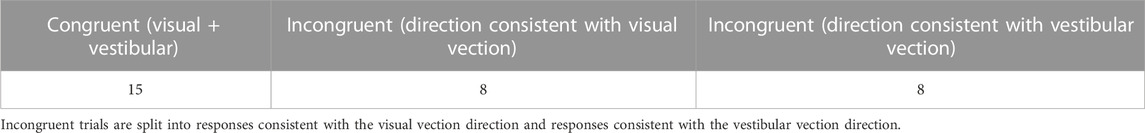
TABLE 1. Vection direction frequency counts during congruent and incongruent conditions by trials across participants in E4.
A within-subjects t-test for speed for the congruent (M = 177.3, SD = 145.5) vs. incongruent (M = 164.6, SD = 152) condition revealed no significant difference, t(7) = 5.70, and p = .587. The within-subjects t-test for vection speed responses in the incongruent condition, comparing the visual vection direction (M = 137.2, SD = 95.7) to vestibular vection direction (M = 147.8, SD = 190.5), indicated no significant difference, t(4) = −0.176, and p = .869.
A within-subjects t-test for duration (s) for the congruent (M = 99.3, SD = 34.2) vs. incongruent (M = 82.9, SD = 35.8) condition revealed no significant difference, t(7) = 1.194, and p = .271. A within-subjects t-test for vection duration responses in the incongruent condition, comparing the visual vection direction (M = 91.2, SD = 31.5) to vestibular vection direction (M = 69, SD = 45.7), indicated no significant difference, t(4) = 1.010, and p = .37.
The objective of E4 was to determine the self-motion direction when the visual and vestibular systems received cues that are in conflict but approximately equally reliable. The results for the incongruent condition showed that three participants used visual cues to indicate self-motion, three participants used vestibular cues, and the remaining two participants used visual cues on one incongruent trial and vestibular cues on the other incongruent trial. Therefore, visual and vestibular self-motion were split evenly across trials and participants.
We predicted that the vection speed and duration would be slower in the incongruent condition than in the congruent condition. Slower and shorter vection would be consistent with our previous findings wherein vestibular vection from CVS was experienced during the visual–vestibular conflict when showing a stationary visual display compared to when there is no conflicting visual display (Kirollos and Herdman, 2023). However, there were no significant differences for the vection speed and duration in the congruent and incongruent conditions of the current experiment. In this experiment, both the visual and vestibular cues signaled vection. This is in contrast to our previous experiment, in which the visual display did not signal vection but the vestibular stimulus did (Kirollos and Herdman, 2023). It could be the case that the stationary display in Kirollos and Herdman (2023) was a) easier to perceive as conflicting than the incongruent condition in the present study and/or b) the stationary display acted as a reference to attenuate fixations and vection. Moreover, the findings here may come as a result of the smaller sample size compared to that of Kirollos and Herdman (2023).
We also compared the vection speed and duration in the incongruent responses, categorizing responses by whether the participant vection direction was consistent with the visual or vestibular cues. We did not predict that there would be significant differences between the visual and vestibular speeds and durations because visual and vestibular speeds were set to be approximately equal. The results were consistent with this prediction.
The goal of the present study was to examine how a visual–vestibular conflict is resolved during perceived self-motion. Sixteen participants were tested over the span of 10 weeks. Of these 16 participants, three participants were removed because they did not sense vestibular vection and additional three participants were removed because they experienced discomfort and did not wish to continue in E1. An additional two participants were removed in E4 because they did not sense vestibular vection.
In E1, vestibular vection was induced with CVS. Vestibular vection direction, speed, and duration were measured with the potentiometer knob. Long vestibular vection durations were observed, replicating the findings from Kirollos and Herdman (2023). However, vection direction findings did not replicate those in our previous study. In E2, a virtual optokinetic drum was used to induce and record visual vection in a VR headset. As in Kirollos and Herdman (2021), virtual drum speeds significantly impacted visual vection speeds. In E3, the goal was to identify vection speeds for the visual and vestibular systems that were approximately equal for each participant with the method of adjustment. Visual vection speeds from E3 for each participant were then used in E4.
The results from E4 showed that visual cues were used for deciding self-motion on one half of the trials and that vestibular cues were used in the other half of the trials. Therefore, there was no evidence for either visual or vestibular dominance. The results are most consistent with the optimal cue integration hypothesis, where it was predicted that participants would use the most reliable cue (visual or vestibular) in each trial to determine the self-motion direction. The equal number of responses indicating visual and vestibular cue reliance suggests that the cue matching from E3 successfully attained equal speeds of vection, as intended. The visual and vestibular vection speeds in the incongruent condition in E4 were not significantly different from each other, demonstrating that vection speeds were approximately equal across modalities.
Although not significant, vection speed was the fastest in the congruent condition and slowest in the visual incongruent condition. These data follow a trend consistent with the results in Kirollos and Herdman (2023): vection is faster when there is no visual–vestibular conflict and suggests that visual and vestibular dominance hypotheses cannot explain the results.
In a study on heading perception by Fetsch et al. (2009), cue reliability was directly manipulated. Fetsch et al. looked at the heading responses during a conflict with varying levels of coherence or cue reliability, where coherence was changed every trial. They found that heading responses were mediated by the level of coherence of the visual display. Therefore, the more coherent the visual display, the more heading reports were based on the visual stimulus-heading direction. The less coherent the visual display, the more the vestibular heading direction was relied upon across trials. These findings demonstrate that cue reliability is a representation of the strength of a cue. In Fetsch et al. (2009), reliability and, therefore, stimulus strength were mediated by manipulating the coherence of the elements in the optic flow display. In E4 of the current study, reliability was modulated by setting the speed to be perceptually equal across the visual and vestibular systems in all trials. The results from our current study extend findings by Fetsch et al. (2009) and others on the optimal cue integration hypothesis as they indicate that when reliability or strength is characterized by the speed of the stimuli and those speeds are approximately equal, visual and vestibular cues are used to decide the self-motion direction equally, represented by the direction frequency count.
Debate regarding visual dominance, vestibular dominance, and optimal cue integration can analogously be found in the neuroimaging literature. A brain imaging study by positron emission topography by Brandt et al. (1998) found that during a conflict generated from visual vection, metabolic activity in vestibular cortical-processing regions such as the insula becomes inhibited. Brandt and colleagues reported that activity in visual cortical regions increased significantly during visual vection. The authors suggested that these results provide neurophysiological support for visual dominance hypotheses for resolving a conflict during vection. Nishiike et al. (2002) used a brain-imaging method called magnetoencephalography during visual vection displays and showed that both vestibular and visual regions became more active during vection. Therefore, the findings from Brandt et al. and Nishiike et al. appear to contradict one another. In a functional magnetic resonance imaging study, Kirollos et al. (2017) found that vestibular regions called the posterior insular cortex (PIC) and parieto-insular vestibular cortex (PIVC) became active during high-conflict visual displays inducing vection but not low-conflict visual displays inducing vection, potentially explaining the difference between the findings of Brandt et al. and Nishiike et al. In Kirollos et al. (2017), high-conflict displays simulated forward vection with an up–down oscillation component, thereby creating a sustained visual–vestibular conflict throughout the display presentation. Low-conflict displays simulated smooth forward vection and therefore did not create a continuous visual–vestibular conflict. Frank et al. (2016) showed that PIC activity correlated with both visual and vestibular stimulation, whereas PIVC activity correlated with vestibular self-motion stimuli only. The results from Kirollos et al. agree with those of Nishiike et al. and Frank et al. (2016) as they all show that some vestibular processing areas (PIC and/or PIVC) become active during visual vection processing. These findings are consistent with the behavioral findings from E4 that showed that during conflict, the visual and vestibular cues are used to determine the self-motion direction [see Frank and Greenlee. (2018) for a review of visual–vestibular cortical interaction during conflict]. These findings are also consistent with a cybersickness study (Weech et al., 2018; Weech et al., 2020), indicating that unreliable vestibular signals result in a sensory down-weighting of vestibular cue reliability, producing a less sensory conflict and, therefore, less sickness. The vection literature also provides examples of sensory down-weighting of unreliable vestibular cues (Cress et al., 1997; Gallagher et al., 2020).
In summary, the findings of the present study were consistent with the neuroimaging results, showing that both visual and vestibular systems and their neural correlates are involved in processing and deciding the self-motion direction rather than cortical areas associated with one system becoming inhibited. It was unclear whether vestibular dominance or optimal cue integration explained the results during a conflict, where the visual display signaled no motion in Kirollos and Herdman (2023) as the visual cue signaled no motion but the vestibular cue did. However, in the present study, E4 showed that when the visual stimulus is matched for the vection speed to the vestibular stimulus, both visual and vestibular systems are used to determine self-motion equally.
Converging evidence from our study, recent optimal cue integration findings, and adjacent literature reports on neuroimaging and motion sickness appear to oppose dominance hypotheses. Our research has demonstrated the ability to produce circular vection using CVS. However, the use of monaural CVS presents variability and proved to be a less-specific stimulus to isolate self-motion perception in horizontal SCC than expected. For instance, a limitation to our findings is that E1 results were inconsistent with the expected vestibular vection direction from our previous study and eye movement data (Jacobson, 1993; Kirollos and Herdman, 2023). Future research should replicate methods used herein using binaural CVS, stimulating one ear with cool air and the other ear with warm air simultaneously to produce more consistent vestibular vection in the yaw-axis with a larger sample. Future research can also record eye movements during CVS to correlate vection speed from the knob data with nystagmus data and compare it to visual vection eye movement data. Adding binaural CVS and eye movement recording can provide a more robust testbed to replicate and expand on the current findings. Finally, altering caloric vestibular irrigation air temperatures can help identify the correlation between the temperature speed and perceived CVS, and can produce a broader range of vestibular vection for applications requiring it, such as spatial disorientation training for aviators.
The raw data supporting the conclusion of this article will be made available by the authors, without undue reservation.
The studies involving humans were approved by the Carleton University Human Ethics Committee. The studies were conducted in accordance with the local legislation and institutional requirements. The participants provided their written informed consent to participate in this study.
RK: conceptualization, data curation, formal analysis, investigation, methodology, project administration, resources, software, visualization, writing–original draft, and writing–review and editing. CH: supervision and resources. All authors contributed to the article and approved the submitted version.
The authors declare that the research was conducted in the absence of any commercial or financial relationships that could be construed as a potential conflict of interest.
All claims expressed in this article are solely those of the authors and do not necessarily represent those of their affiliated organizations, or those of the publisher, the editors, and the reviewers. Any product that may be evaluated in this article, or claim that may be made by its manufacturer, is not guaranteed or endorsed by the publisher.
Allison, R. S., Zacher, J. E., Kirollos, R., Guterman, P. S., and Palmisano, S. (2012). Perception of smooth and perturbed vection in short-duration microgravity. Exp. Brain Res. 223 (4), 479–487. doi:10.1007/s00221-012-3275-5
Aoyama, K., Iizuka, H., Ando, H., and Maeda, T. (2015). Four-pole galvanic vestibular stimulation causes body sway about three axes. Sci. Rep. 5 (1), 10168–8. doi:10.1038/srep10168
Baloh, R. W. (2003). “Vestibular system,” in Encyclopedia of the neurological sciences. Editors M. J. Aminoff, and R. B. Daroff (Waltham MA: Elsevier), 661–671.
Barany, R. (1906). Untersuchungen über den vom Vestibularapparat des Ohres reflektorisch ausgelösten rhythmischen Nystagmus und seine Begleiterscheinungen. Oscar Coblentz.
Benjamin, N. (2008). XBOX 360 controller. Avaliable At: https://www.flickr.com/photos/28526479@N02/2902721172; Licensed under CC BY-SA 2.0.
Bense, S., Stephan, T., Yousry, T. A., Brandt, T., and Dieterich, M. (2001). Multisensory cortical signal increases and decreases during vestibular galvanic stimulation (fMRI). J. neurophysiology 85 (2), 886–899. doi:10.1152/jn.2001.85.2.886
Berthoz, A., Pavard, B., and Young, L. R. (1975). Perception of linear horizontal self-motion induced by peripheral vision (linearvection) basic characteristics and visual-vestibular interactions. Exp. Brain Res. 23 (5), 471–489. doi:10.1007/bf00234916
Berti, S., Haycock, B., Adler, J., and Keshavarz, B. (2019). Early cortical processing of vection-inducing visual stimulation as measured by event-related brain potentials (ERP). Displays 58, 56–65. doi:10.1016/j.displa.2018.10.002
Bordoni, B., Mankowski, N. L., and Daly, D. T. (2021). “Neuroanatomy, cranial nerve 8 (vestibulocochlear),” in StatPearls (Treasure Island, FL: StatPearls Publishing).
Bos, J. E., van den Berg-Kroon, E. L., Houben, M. M., and Kuiper, O. O. (2019). In-car speed estimations with real, virtual, and no view. Displays 58, 66–70. doi:10.1016/j.displa.2019.01.001
Brandt, T., Bartenstein, P., Janek, A., and Dieterich, M. (1998). Reciprocal inhibitory visual-vestibular interaction. Visual motion stimulation deactivates the parieto-insular vestibular cortex. Brain a J. neurology 121 (9), 1749–1758. doi:10.1093/brain/121.9.1749
Brandt, T., Dichgans, J., and Koenig, E. (1973). Differential effects of central versus peripheral vision on egocentric and exocentric motion perception. Exp. Brain Res. 16 (5), 476–491. doi:10.1007/bf00234474
Butler, J. S., Smith, S. T., Campos, J. L., and Bülthoff, H. H. (2010). Bayesian integration of visual and vestibular signals for heading. J. Vis. 10 (11), 23. doi:10.1167/10.11.23
Campos, J., Ramkhalawansingh, R., and Pichora-Fuller, M. K. (2018). Hearing, self-motion perception, mobility, and aging. Hear. Res. 369, 42–55. doi:10.1016/j.heares.2018.03.025
Clarke, J. J., and Yuille, A. L. (1990). Data fusion for sensory information processing. Boston, MA: Kluwer Academic, 978–971.
Coats, A. C., Hebert, F., and Atwood, G. R. (1976). The air caloric test: a parametric study. Archives Otolaryngology 102 (6), 343–354. doi:10.1001/archotol.1976.00780110055005
Cress, J. D., Hettinger, L. J., Cunningham, J. A., Riccio, G. E., Haas, M. W., and McMillan, G. R. (1997). Integrating vestibular displays for VE and airborne applications. IEEE Comput. Graph. Appl. 17 (6), 46–52. doi:10.1109/38.626969
de Winkel, K. N., Katliar, M., and Bülthoff, H. H. (2015). Forced fusion in multisensory heading estimation. PLoS One 10 (5), e0127104. doi:10.1371/journal.pone.0127104
de Winkel, K. N., Soyka, F., Barnett-Cowan, M., Bülthoff, H. H., Groen, E. L., and Werkhoven, P. J. (2013). Integration of visual and inertial cues in the perception of angular self-motion. Exp. Brain Res. 231 (2), 209–218. doi:10.1007/s00221-013-3683-1
de Winkel, K. N., Weesie, J., Werkhoven, P. J., and Groen, E. L. (2010). Integration of visual and inertial cues in perceived heading of self-motion. J. Vis. 10 (12), 1. doi:10.1167/10.12.1
Dichgans, J., and Brandt, T. (1978). “Visual-vestibular interaction: effects on self-motion perception and postural control,” in Perception (Springer), 755–804.
Dilda, V., Morris, T. R., Yungher, D. A., MacDougall, H. G., and Moore, S. T. (2014). Central adaptation to repeated galvanic vestibular stimulation: implications for pre-flight astronaut training. PLoS One 9 (11), e112131. doi:10.1371/journal.pone.0112131
Ernst, M. O., and Banks, M. S. (2002). Humans integrate visual and haptic information in a statistically optimal fashion. Nature 415 (6870), 429–433. doi:10.1038/415429a
Fetsch, C. R., DeAngelis, G. C., and Angelaki, D. E. (2010). Visual–vestibular cue integration for heading perception: applications of optimal cue integration theory. Eur. J. Neurosci. 31 (10), 1721–1729. doi:10.1111/j.1460-9568.2010.07207.x
Fetsch, C. R., Pouget, A., DeAngelis, G. C., and Angelaki, D. E. (2012). Neural correlates of reliability-based cue weighting during multisensory integration. Nat. Neurosci. 15 (1), 146–154. doi:10.1038/nn.2983
Fetsch, C. R., Turner, A. H., DeAngelis, G. C., and Angelaki, D. E. (2009). Dynamic reweighting of visual and vestibular cues during self-motion perception. J. Neurosci. 29 (49), 15601–15612. doi:10.1523/jneurosci.2574-09.2009
Fischer, M. H., and Wodak, E. (1924). Unbekannte vestibulariseffekte bei gleichzeitiger äqualer doppelspülung. Klin. Wochenschr. 3 (31), 1406–1407. doi:10.1007/bf01852444
Fitzpatrick, R. C., and Day, B. L. (2004). Probing the human vestibular system with galvanic stimulation. J. Appl. Physiology 96 (6), 2301–2316. doi:10.1152/japplphysiol.00008.2004
Fitzpatrick, R. C., Marsden, J., Lord, S. R., and Day, B. L. (2002). Galvanic vestibular stimulation evokes sensations of body rotation. Neuroreport 13 (18), 2379–2383. doi:10.1097/00001756-200212200-00001
Fitzpatrick, R. C., and Watson, S. R. (2015). Passive motion reduces vestibular balance and perceptual responses. J. physiology 593 (10), 2389–2398. doi:10.1113/jp270334
Frank, S. M., Baumann, O., Mattingley, J. B., and Greenlee, M. W. (2014). Vestibular and visual responses in human posterior insular cortex. J. neurophysiology 112 (10), 2481–2491. doi:10.1152/jn.00078.2014
Frank, S. M., and Greenlee, M. W. (2014). An MRI-compatible caloric stimulation device for the investigation of human vestibular cortex. J. Neurosci. Methods 235, 208–218. doi:10.1016/j.jneumeth.2014.07.008
Frank, S. M., and Greenlee, M. W. (2018). The parieto-insular vestibular cortex in humans: more than a single area? J. neurophysiology 120 (3), 1438–1450. doi:10.1152/jn.00907.2017
Frank, S. M., Wirth, A. M., and Greenlee, M. W. (2016). Visual-vestibular processing in the human Sylvian fissure. J. neurophysiology 116 (2), 263–271. doi:10.1152/jn.00009.2016
Gallagher, M., Choi, R., and Ferrè, E. R. (2020). Multisensory interactions in virtual reality: optic flow reduces vestibular sensitivity, but only for congruent planes of motion. Multisensory Res. 1, 625–644. doi:10.1163/22134808-20201487
Gibson, J. J. (1966). The senses considered as perceptual systems. Boston: Houghton Mifflin Company.
Goldberg, J., Highstein, S. M., Moschovakis, A. K., and Fernandez, C. (1987). Inputs from regularly and irregularly discharging vestibular nerve afferents to secondary neurons in the vestibular nuclei of the squirrel monkey. I. An electrophysiological analysis. J. neurophysiology 58 (4), 700–718. doi:10.1152/jn.1987.58.4.700
Gonçalves, D. U., Felipe, L., and Lima, T. M. A. (2008). Interpretation and use of caloric testing. Rev. Bras. Otorrinolaringol. 74, 440–446. doi:10.1016/s1808-8694(15)30580-2
Gu, Y., Angelaki, D. E., and DeAngelis, G. C. (2008). Neural correlates of multisensory cue integration in macaque MSTd. Nat. Neurosci. 11 (10), 1201–1210. doi:10.1038/nn.2191
Harris, L. R., Jenkin, M., and Zikovitz, D. C. (2000). Visual and non-visual cues in the perception of linear self motion. Exp. Brain Res. 135 (1), 12–21. doi:10.1007/s002210000504
Högyes, A. (1913). Über den Nervenmechanismus der assoziierten Augenbewegungen: von Andreas Högyes. Übers. von Martin Sugár. Urban & Schwarzenberg.
Howard, I. P., and Childerson, L. (1994). The contribution of motion, the visual frame, and visual polarity to sensations of body tilt. Perception 23 (7), 753–762. doi:10.1068/p230753
Jacobson, G. P., and Newman, C. W. (1993). “Background and technique of caloric testing,” in Handbook of balance function testing. Editors G. P. Jacobson, C. W. Newman, and J. M. Kartush (Mosby, St. Louis, MO: Singular Publishing Group), 156–192.
Jarmasz, J., and Hollands, J. G. (2009). Confidence intervals in repeated-measures designs: the number of observations principle. Can. J. Exp. Psychol. 63 (2), 124–138. doi:10.1037/a0014164
Jones, A., and Pivik, R. (1985). Vestibular activation, smooth pursuit tracking, and psychosis. Psychiatry Res. 14 (4), 291–308. doi:10.1016/0165-1781(85)90097-6
Jürgens, R., and Becker, W. (2011). Human spatial orientation in non-stationary environments: relation between self-turning perception and detection of surround motion. Exp. Brain Res. 215 (3), 327–344. doi:10.1007/s00221-011-2900-z
Jürgens, R., Kliegl, K., Kassubek, J., and Becker, W. (2016). Optokinetic circular vection: a test of visual–vestibular conflict models of vection nascensy. Exp. Brain Res. 234, 67–81. doi:10.1007/s00221-015-4433-3
Karnath, H. O. (1994). Subjective body orientation in neglect and the interactive contribution of neck muscle proprioception and vestibular stimulation. Brain 117 (5), 1001–1012. doi:10.1093/brain/117.5.1001
Kassemi, M., Deserranno, D., and Oas, J. (2005). Fluid–structural interactions in the inner ear. Comput. Struct. 83 (2-3), 181–189. doi:10.1016/j.compstruc.2004.08.001
Kassemi, M., Deserranno, D., and Oas, J. G. (2004). Effect of gravity on the caloric stimulation of the inner ear. Ann. N. Y. Acad. Sci. 1027 (1), 360–370. doi:10.1196/annals.1324.030
Keshavarz, B., Hettinger, L. J., Vena, D., and Campos, J. L. (2014). Combined effects of auditory and visual cues on the perception of vection. Exp. Brain Res. 232 (3), 827–836. doi:10.1007/s00221-013-3793-9
Kirollos, R., Allison, R. S., and Palmisano, S. (2017). Cortical correlates of the simulated viewpoint oscillation advantage for vection. Multisensory Res. 30 (7-8), 739–761. doi:10.1163/22134808-00002593
Kirollos, R., and Herdman, C. M. (2023). Caloric vestibular stimulation induces vestibular circular vection even with a conflicting visual display presented in a virtual reality headset. i-Perception 14 (2), 204166952311680. doi:10.1177/20416695231168093
Kirollos, R., and Herdman, C. M. (2021). Measuring circular vection speed in a virtual reality headset. Displays 69, 102049. doi:10.1016/j.displa.2021.102049
Klaus, M. P., Wyssen, G. C., Frank, S. M., Malloni, W. M., Greenlee, M. W., and Mast, F. W. (2020). Vestibular stimulation modulates neural correlates of own-body mental imagery. J. cognitive Neurosci. 32 (3), 484–496. doi:10.1162/jocn_a_01496
Lee, D. N., and Lishman, J. (1975). Visual proprioceptive control of stance. J. Hum. Mov. Stud. 1 (2), 87–95.
Levy, D. L., Holzman, P. S., and Proctor, L. R. (1983). Vestibular dysfunction and psychopathology. Schizophr. Bull. 9 (3), 383–438. doi:10.1093/schbul/9.3.383
Lishman, J., and Lee, D. (1973). The autonomy of visual kinaesthesis. Perception 2 (3), 287–294. doi:10.1068/p020287
Meiry, J., and Young, L. (1967). Biophysical evaluation of the human vestibular system Semiannual status report. Report.
Melcher, G. A., and Henn, V. (1981). The latency of circular vection during different accelerations of the optokinetic stimulus. Percept. Psychophys. 30 (6), 552–556. doi:10.3758/bf03202009
Moon, S., Lee, B., and Na, D. (2006). Therapeutic effects of caloric stimulation and optokinetic stimulation on hemispatial neglect. J. Clin. Neurology 2 (1), 12–28. doi:10.3988/jcn.2006.2.1.12
Moore, S. T., Dilda, V., and MacDougall, H. G. (2011). Galvanic vestibular stimulation as an analogue of spatial disorientation after spaceflight. Aviat. space, Environ. Med. 82 (5), 535–542. doi:10.3357/asem.2942.2011
Nishiike, S., Nakagawa, S., Nakagawa, A., Uno, A., Tonoike, M., Takeda, N., et al. (2002). Magnetic cortical responses evoked by visual linear forward acceleration. Neuroreport 13 (14), 1805–1808. doi:10.1097/00001756-200210070-00023
Owens, D. A., Gu, J., and McNally, R. D. (2018). Perception of the speed of self-motion vs. object-motion: another example of two modes of vision? Conscious. cognition 64, 61–71. doi:10.1016/j.concog.2018.07.006
Palmisano, S., Allison, R. S., Schira, M. M., and Barry, R. J. (2015). Future challenges for vection research: definitions, functional significance, measures, and neural bases. Front. Psychol. 6, 193. doi:10.3389/fpsyg.2015.00193
Palmisano, S., Gillam, B. J., and Blackburn, S. G. (2000). Global-perspective jitter improves vection in central vision. Perception 29 (1), 57–67. doi:10.1068/p2990
Palmisano, S., and Gillam, B. (1998). Stimulus eccentricity and spatial frequency interact to determine circular vection. Perception 27 (9), 1067–1077. doi:10.1068/p271067
Purves, D., Augustine, G., Fitzpatrick, D., Katz, L., LaMantia, A., McNamara, J., et al. (2001). The Otolith organs: the utricle and sacculus. Neuroscience 4, 777–778. doi:10.1038/90470
Rabbitt, R. D. (2019). Semicircular canal biomechanics in health and disease. J. neurophysiology 121 (3), 732–755. doi:10.1152/jn.00708.2018
Reason, J. T. (1978). Motion sickness adaptation: a neural mismatch model. J. R. Soc. Med. 71 (11), 819–829. doi:10.1177/014107687807101109
Reymond, G., Droulez, J., and Kemeny, A. (2002). Visuovestibular perception of self-motion modeled as a dynamic optimization process. Biol. Cybern. 87 (4), 301–314. doi:10.1007/s00422-002-0357-7
Riecke, B. E., Feuereissen, D., and Rieser, J. J. (2008). “Auditory self-motion illusions (" circular vection") can be facilitated by vibrations and the potential for actual motion,” in Proceedings of the 5th symposium on applied perception in graphics and visualization (ACM).
Riecke, B. E., and Schulte-Pelkum, J. (2013). Perceptual and cognitive factors for self-motion simulation in virtual environments: how can self-motion illusions (“vection”) be utilized? Hum. Walk. virtual Environ. Percept. Technol. Appl., 27–54. doi:10.1007/978-1-4419-8432-6
Rohde, M., van Dam, L. C., and Ernst, M. O. (2016). Statistically optimal multisensory cue integration: a practical tutorial. Multisensory Res. 29 (4-5), 279–317. doi:10.1163/22134808-00002510
Santos, C. F., Belinha, J., Gentil, F., Parente, M., and Jorge, R. N. (2017). An alternative 3D numerical method to study the biomechanical behaviour of the human inner ear semicircular canal. Acta Bioeng. biomechanics 19 (1), 3–15. doi:10.5277/ABB-00444-2015-02
Sluga, M., Hribar, M., and Battelino, S. (2021). Funkcionalni testi za oceno ravnotežnega organa. Slovenian Med. J. - Neurobiol. 90 (1-2), 54–73. doi:10.6016/zdravvestn.2985
St George, R. J., Day, B. L., and Fitzpatrick, R. C. (2011). Adaptation of vestibular signals for self-motion perception. J. physiology 589 (4), 843–853. doi:10.1113/jphysiol.2010.197053
Telban, R., and Cardullo, F. (2001). An integrated model of human motion perception with visual-vestibular interaction. AIAA Modeling and Simulation Technologies Conference and Exhibit, Warren, H. (1895). Sensations of rotation. Psychol. Rev. 2 (3), 273. doi:10.2514/6.2001-4249
Weech, S., and Troje, N. F. (2017). Vection latency is reduced by bone-conducted vibration and noisy galvanic vestibular stimulation. Multisensory Res. 30 (1), 65–90. doi:10.1163/22134808-00002545
Weech, S., Varghese, J. P., and Barnett-Cowan, M. (2018). Estimating the sensorimotor components of cybersickness. J. neurophysiology 120 (5), 2201–2217. doi:10.1152/jn.00477.2018
Weech, S., Wall, T., and Barnett-Cowan, M. (2020). Reduction of cybersickness during and immediately following noisy galvanic vestibular stimulation. Exp. Brain Res. 238, 427–437. doi:10.1007/s00221-019-05718-5
Keywords: virtual reality, visual–vestibular sensory integration, caloric vestibular stimulation, vection, optokinetic drum
Citation: Kirollos R and Herdman CM (2023) Visual–vestibular sensory integration during congruent and incongruent self-rotation percepts using caloric vestibular stimulation. Front. Virtual Real. 4:1253155. doi: 10.3389/frvir.2023.1253155
Received: 04 July 2023; Accepted: 02 October 2023;
Published: 26 October 2023.
Edited by:
Orestis Georgiou, Ultraleap Ltd., United KingdomReviewed by:
Juno Kim, University of New South Wales, AustraliaCopyright © 2023 Kirollos and Herdman. This is an open-access article distributed under the terms of the Creative Commons Attribution License (CC BY). The use, distribution or reproduction in other forums is permitted, provided the original author(s) and the copyright owner(s) are credited and that the original publication in this journal is cited, in accordance with accepted academic practice. No use, distribution or reproduction is permitted which does not comply with these terms.
*Correspondence: Ramy Kirollos, cmFteS5raXJvbGxvc0BkcmRjLXJkZGMuZ2MuY2E=
Disclaimer: All claims expressed in this article are solely those of the authors and do not necessarily represent those of their affiliated organizations, or those of the publisher, the editors and the reviewers. Any product that may be evaluated in this article or claim that may be made by its manufacturer is not guaranteed or endorsed by the publisher.
Research integrity at Frontiers
Learn more about the work of our research integrity team to safeguard the quality of each article we publish.