 Edtson Emilio Herrera-Valencia1*
 Luis Antonio Ramírez-Torres1
 Catalina Soriano-Correa2Mayra Luz Sánchez-Villavicencio1
 Oscar Bautista3Vicente Jesús Hernández-Abad4
 Fausto Calderas1*
- 1Unidad de Bioingeniería UI-FESZ-110323, FES Zaragoza, UNAM, Carrera de Ingeniería Química, Laboratorio de Reología y Fenómenos de Transporte, Unidad Multidisciplinaria de Investigación Experimental Zaragoza (UMIEZ), Ciudad de México, Mexico
- 2Unidad de Química Computacional, Facultad de Estudios Superiores (FES)-Zaragoza, Universidad Nacional Autónoma de México (UNAM), Ciudad de México, Mexico
- 3ESIME Azcapotzalco, Instituto Politécnico Nacional, Ciudad deMéxico, Mexico
- 4Laboratorio de Investigación Farmacéutica, Facultad de Estudios Superiores Zaragoza, Universidad Nacional Autónoma de México, Ciudad deMéxico, Mexico
This study investigates the electro-osmotic flow of a biological fluid (blood with varying cholesterol levels) in annular flow to simulate a first approximation to arterial occlusion. The fluid´s rheology is characterized by a multi-modal convected Maxwell model equation. The charge density follows the Boltzmann distribution, governing the electrical field. Mathematically, this scenario can be modeled by the Poisson–Boltzmann partial differential equation. Assuming a small zeta potential (less than 25 mV) using the Debye–Huckel approximation and considering a pulsatile electrical field, analytical solutions are derived using the Fourier transform formalism. These solutions, expressed in terms of the modified Bessel function, provide transfer functions for axial velocity and volumetric flow as functions of material parameters represented by characteristic dimensionless numbers. This study further analyzes thermal, electric, inertial, viscoelastic, and various interactions within the plasma, hematocrit, hematocrit–cholesterol, and cholesterol–cholesterol as well as weight concentration through numerical simulations. Finally, the flow and rheology predictions are validated using experimental data on human blood with varying cholesterol levels. The obtained transfer functions reveal that the electric–thermal–viscoelastic effects and the multiple geometric relationships contribute to the dynamic response of the interactions between the input electrical field and output volumetric flow and shear stress functions, leading to and evolution of resonance curves. It is noteworthy that electro-osmotic flow in blood with pathologies associated with low and high cholesterol has been scarcely reported in the literature on rheology. Thus, this work represents a significant contribution to the field.
1 Introduction
1.1 Electro-osmotic flow
The research on nano-microfluidics has received much attention from specialists in the field of momentum transport and rheology of complex fluids (Teodoro et al., 2023). Microfluidics has utmost priority in rheology and non-Newtonian fluid mechanics, especially in lab-on-a-chip (LOC)-based microfluidics applications (Afonso et al., 2009). In recent years, it has become well-established as a micro-pumping technique that is used in many biological devices, material physics, sample testing, intravenous delivery systems, electrophoresis, electrochemistry, medical diagnostics, and lab-on-a-chip biochemical reactive platforms (Alfonso et al., 2013; Ali et al., 2020).
The combined effect of fluid mechanics and electrodynamics, especially electro-osmotic flow, plays an important role in the field of electro-osmotic flow (EOF) Arulanandam and Li, 2000).
EOF is the motion of the fluid adjacent to a charged surface due to an externally imposed electric field (Baños et al., 2021). In EOF, the surface charge always contains a solution of ions, and overall charge neutrality is satisfied (Berli and Olivares 2008). The main applications of the EOF are as follows: i) micro-flow injection analysis, ii) microfluidic chromatography, iii) micro-reactors, iv) micro-energy, and v) micro-electronic cooling systems, micro-mixing, bio-rheology, and physiology of human blood (Burgreen and Nakache 1964).
In this context, electro-osmosis is widely used for manipulating and controlling fluid flows in channels with lengths of less than a millimeter and is achieved by means of electrostatic interaction between an external constant and the pulsating electric field and electric double layer (EDL) (Chakraborty, 2005).
Capillary electrophoresis is a technique in which electric fields are used to separate chemicals according to their electrophoretic mobility by applying an electric field to a narrow capillary, usually made of silica (Chakraborty, 2007).
In electrophoretic separations, EOF affects the elution time of the analyses (Chakraborty and Srivastava 2007).
It is projected that microfluidic devices utilizing EOF will have great application in medical research (Teodoro et al., 2024). Controlling this flow will require a better understanding to implement it in drug delivery systems (Das and Chakraborty 2006). Mixing fluids at the microscale is currently troublesome. It is believed that electrically controlling fluids will be the method by which small fluids will be successfully mixed (Dhinakaran et al. 2010).
Electro-osmotic pumping is an important mechanism for transport and control of flows (Dutta, and Beskok 2011). Typically, the key parameters that determine the pumping performance are i) the magnitude of the electrical field that is externally applied (Dutta and Beskok 2011), ii) the cross-sectional dimensions of the microchannel (Ferras et al. 2016), iii) the surface charge density of the microchannel surface (Levine et al., 1975), and iv) the ion density and pH of the fluid system (Mahapatra and Bandopadhyay 2020).
One method to enhance the volumetric flow rate in a microchannel is to increase the magnitude of the applied electrical field (Mederos et al., 2020); however, this can cause an increase in the temperature of the fluid as a result of the Joule heating effect, which is undesirable (Medina et al., 2018).
Therefore, other mechanisms must be used to achieve higher volumetric flow rates (Peralta et al., 2020). To this end, another technique for controlling fluid flow is to use pulsatile or oscillating flow (Herrera-Valencia et al., 2023). Enhancement of the volumetric flow by the time-pulsating force has found application in different branches of science, such as DNA dynamics (Jendrejack et al., 2013), microcapillaries with slip conditions (Sanchez et al., 2013), blood with cholesterol (Herrera-Valencia et al., 2017), structured fluids (Herrera-Valencia et al., 2019), flexoelectric membranes (Herrera-Valencia and Rey 2023), and mass transfer (Mederos et al., 2020).
The majority of the approaches have been focused on the study of i) distributions of ions (Medina et al. 2018), ii) geometry of the material (Peralta et al., 2020), and iii) the rheological nature of the fluid (Mahapatra and Bandopadhyay 2021). The theoretical analysis of EOF of Newtonian and non-Newtonian fluids in microchannels (slit and capillary) has been the subject of several mathematical and physical studies (Ribau et al., 2021).
The mathematical techniques used to solve the equations involve i) linear ordinary and partial differential equations with different boundary conditions (Sadek and Pinho, 2019), ii) numerical methods such as finite differences (Rojas et al., 2019), finite element and finite volume (Mahapatra and Bandopadhyay 2021), and iii) regular and irregular perturbation techniques (Vargas et al., 2019).
Bandopadhyay et al. (2013a) analytically studied the impact of finite-sized ions in cylindrical nanopores and their effects on the thickening mechanism. Additionally, Bandopadhyay et al. (2016) investigated the pulsating effect of pulsating EOF and its influence on the volumetric flow rate as the function of the material properties of the system.
The study also explored the role of energy in electrodynamic energy conversion, focusing on the dissipation and storage mechanisms within viscoelastic fluids in narrow channels, which can be correlated with small coaxial cylinders (Bandopadhyay and Chakraborty, 2012a, Bandopadhyay and Chakraborty, 2012b; Bandopadhyay et al., 2013a, Bandopadhyay et al., 2013b).
Bazant et al. (2009) examined the effects of electrokinetics and large applied voltages on concentrated solutions. To comprehend the influence of material properties on EOF in nanochannels, Gogoi et al. (2021) conducted molecular dynamics simulations to investigate the impact of surface charge. Additionally, Iglič et al. (2010) explored the effects of excluded volume and orientational ordering near a charged surface in solutions of ions and Langevin dipoles. In a similar vein, Kilic et al. (2007) investigated the steric effects and the impact of large voltages on complex electrolytes, particularly their influence on double-layer charging.
Silva et al. (2020), Silva et al. (2022) have explored the combined effects of unsteady electromagnetic mechanisms and coupled stress liquids in microchannel hydrodynamics.
Kumar-Metha and Kumar Mondal (2023a), Kumar-Metha and Kumar Mondal (2023b) investigated the impact of electrothermal mechanisms on enhancing solute mixing in a wavy microchannel within a 3D numerical framework. Their findings indicate that the wave amplitude of the mixer affects the Peclet number, and the absence of vortices, particularly in non-Newtonian inelastic shear-thinning mechanisms, plays a crucial role in the design of novel micromixers.
Additionally, Kumar Metha et al. (2021) investigated the effects of vortices in electro-osmotic mixing of non-Newtonian bio-fluids by using numerical methods. Their research focused on the impact of a non-uniformly charged wavy channel and the effect of finite ion size.
Sanjav et al. (2020) investigated the importance of a patterned soft layer in enhancing mixing efficiency in electro-osmotic systems. Kaushik et al. (2019) explored the effects of a rotating electro-osmotic system in polyelectrolyte-grafted microchannels through direct analytical solutions.
Sarma et al. (2018) examined the non-Newtonian behavior of an electro-osmotic complex fluid using the Phan–Thien and Tanner model, particularly at high zeta potential. Their results highlight the influence of rheological parameters and electro-thermal mechanisms on the system.
Kaushick et al. (2017) studied the rotational electrohydrodynamics of a non-Newtonian fluid in the presence of electrical double layer phenomenon.
Kumar Mondal et al. (2013), Kumar Mondal et al. (2014) investigated the effect of contact line dynamics and the electrical double layer phenomenon in immiscible binary systems under a pulsating electric field in narrow channels.
1.2 Bio-fluids
Bio-fluids are often solutions of macromolecules that impart a non-Newtonian rheological behavior characterized by variable viscosity, memory effects, normal stress effect, yield stress, and hysteresis of fluid properties (Moyers-Gonzalez and Owens 2010; Moreno et al., 2015). These fluids are encountered in chips used for chemical and biological analysis or in micro-rheometers (Stone et al., 2004). The theoretical research work of EOFs characterized by non-Newtonian fluids has been previously reported by several research groups (Peralta et al., 2018; Ribau et al., 2021).
Recent experimental and theoretical works on complex fluids (Castillo and Wilson 2018; Ferras et al., 2019) have found that the dynamic permeability can increase orders of magnitude at certain frequencies; the dynamic permeability is an intrinsic property of the system viscoelastic fluid-confining media (Flores et al., 2016), such as electrorheological fluids under a magnetic field in annular ducts and pulsatile and longitudinally vibrating tubes (Del Rio et al., 1998; Corvera Poiré and Hernández-Machado 2016; Torres Rojas et al., 2017).
The dynamic permeability is the response to different signals of the pressure gradient (Flores et al., 2016). It can be considered a measure of the resistance to flow; the larger the dynamic permeability, the less resistance to flow (Flores et al., 2019, Flores et al., 2021). The maximum peak shown in the dynamic permeability at certain frequencies suggests that the magnitude of the flow might be increased by driving the fluid with a pressure gradient that contains the frequency maximizing the dynamic permeability (Ledesma-Aguilar et al., 2007). It has been investigated that imposing a periodic pressure gradient at the frequency that maximizes the dynamic permeability for the pressure gradient with a properly chosen frequency provides a way of controlling the magnitude of flow (Flores et al., 2019).
It was demonstrated that when an obstruction occurs, it is clear that if one recovers the value of the real part of the dynamic permeability (by driving the fluid at proper frequency), one eliminates one of the two factors that provoke the dramatic decrease in flow (de la Guerra and Corvera-Poiré 2022).
1.3 Human blood
Blood flow represents a challenge for theorists and experimentalists due to the particular phenomena exhibited, such as pseudoplasticity, coagulation (blood clotting) in the presence of oxygen, and hemoglobin oxidation (Sousa et al., 2016). In many cases, the flow of blood within vessels is strongly affected by cholesterol levels and hyperglycemia in the veins (Apostolidis, and Beris, 2016). In the past decade, attention has been paid to the study of blood with different pathologies (Liu et al., 2022). From a mathematical and physical point of view, the study of the pulsatile flow is a complex problem due to the rheology and transport phenomena embedded in the physics description (Moyers-Gonzalez and Owens, 2010; Apostolidis and Beris, 2014; Apostolidis et al., 2015; Herrera-Valencia and Rey, 2023). The combination of cholesterol and calcium is one of the most common consequences, leading to peripheral and central occlusions (Apostolidis et al., 2016). In physics and engineering, the presence of an obstacle in the fluid pumping system results in partial or total failure of a process (Collepardo-Guevara and Corvera-Poiré, 2007). In particular, the occlusion of veins and arteries in the human body represents an important issue in many diseases (Siddiqui et al., 2009).
For instance, during arterial occlusion, the blood flow decreases in velocity, and in critical cases, is effectively unable to flow through the remaining space (Flore et al., 2016). Such a lack of movement provokes tissue death (Neofytou and Tsangaris, 2006). Chronic hypercholesterolemia can lead to accelerated atherosclerosis angina pectoris, heart stroke, stenosis, obesity, and type 2 diabetes, caused due to eating disorders and genetic predispositions (Beidokhti et al., 2017). In this context, mathematical modeling can help in developing more efficient anticoagulants, which can be an alternative for these diseases (Bouchnita et al., 2022). The effect of these anticoagulants can be predicted through constitutive modeling of blood (Moyers-Gonzalez et al., 2008). The complex circulatory system (heart, vein, and artery) can be modeled, at a first approach, as a capillary flow under a simple stochastic pulsating-pressure gradient (Herrera-Valencia et al., 2017, Herrera-Valencia et al., 2019). The occlusions are proposed here as a concentric cylinder system, where the central cylinder represents the occlusion and the diameter of such a cylinder represents the size of the occlusion, which is a simplification of the real case to study the analytical relations between the different variables involved as a first approximation to study this complex system, and flow is considered completely developed with no transitions (Collepardo-Guevara and Corvera-Poiré, 2007). Though very approximate to the real case, this approach can shed some light on the optimization of human valve prostheses for patients with blood diseases (Sacks and Yoganathan, 2007). It can also pave the way to more realistic approaches in blood flow simulations (Sun et al., 2022). Recent reports have analyzed and studied at length the effect of varying viscosity of a two-fluid model of pulsatile flow through blood vessels with a porous region near walls (Tiwari and Chauhan, 2019).
There are open questions and a lack of theoretical studies on analytical solutions of pulsating EOF applied to human blood with specific pathologies, in this case human blood with low and high cholesterol (Moreno et al., 2015).
However, the first approach to model the pulsating EOF is to consider the system in the regime of linear viscoelasticity (small deformation gradients) and to model it using the Maxwell or Jeffreys fluid models (Jiang et al., 2017). The Jeffreys constitutive equation separates the contribution of the solvent (plasma) and the viscoelastic polymer forces associated with the erythrocytes (Horner et al., 2018).
One important contribution on the regime of small deformations is the effect of cholesterol content (Horner et al., 2018). This effect is associated with the formation of a blood clot and is related to the occurrence of occlusions (Armstrong et al., 2016). The effect of plasma (P), hematocrit (H), and the interaction between hematocrit–cholesterol (HC) and cholesterol–cholesterol (CC) in blood has been reported elsewhere (Armstrong et al., 2016; Horner et al., 2018).
Here, our objective is to predict the complex transfer function of EOF considering the viscoelastic properties of blood containing varying cholesterol levels, while also incorporating the effects of electro-osmotic forces. We model the biological viscoelastic fluids using the multi-modal convected Maxwell rheological equation of state (Armstrong et al., 2016; Saengow et al., 2019).
These predictions involve determining the viscoelastic complex transfer function between volumetric flow and the electric field, taking into account the contributions of inertia, bulk viscosity, viscoelasticity, electro-osmotic force, and indirectly the effect of multiple relaxation times, which can significantly alter flow rates. As a first approximation to model this complex system, we have omitted the interactions between red blood cells (RBCs) and ions of varying sizes. We will demonstrate that the resonance of average power dissipation depends on material properties, as discussed by Horner et al. (2019).
To achieve this, we utilize reliable rheometric data on blood samples with varying cholesterol levels obtained from Moreno et al. (2015).
It is important to clarify several aspects that are not addressed in the present research:
(A) The interactions between red blood cells (RCBs) and electrolytes under electric forces are not considered in our study.
(B) The effect of the excluded volume is not included in our analysis.
(C) Non-Newtonian effects such as i) thixotropy, ii) rheopexy, iii) first normal stress difference, iv) second normal stress difference, and v) flow instabilities are not taken into account in this analysis.
The primary objectives of this original research are as follows:
(a) To investigate momentum transfer and rheology of the dynamic response of human blood with low and high cholesterol levels when subjected to an external time-pulsating electric field in an annular region.
(b) To derive analytical expressions for the flow and stress transfer functions.
(c) To analyze the thermal–electric–inertial–viscoelastic mechanism using dimensionless characteristic groups associated with each mechanism.
(d) To examine the dynamical response of the transfer functions using rheometric data of human blood samples with low and high cholesterol levels.
This paper is organized as follows: Section 1 introduces the problem and provides an overview of the previous work. Section 2 presents the constitutive rheological equation of state (mathematical and physical properties). Section 3 shows the mathematical modeling of the EOF. Section 4 describes the potential field within the electric double layer, while Section 5 describes the nondimensional variables and groups. The governing nondimensional equations are presented in Section 6. Analytical results are presented in Section 7. Finally, the concluding remarks are provided in Section 8, and the proposed future work is provided in Section 9, Figure 1 shows the article outline.
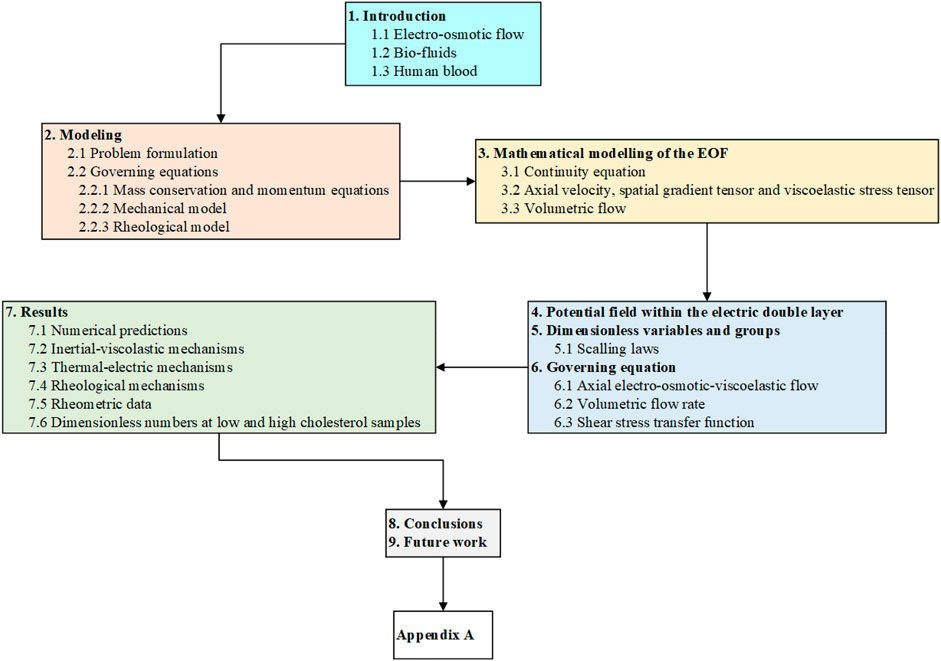
Figure 1. Flow chart of the paper’s organization.
2 Modeling
2.1 Problem formulation
The depicted geometry in Figure 2 illustrates a viscoelastic electrolyte fluid in a circular microchannel featuring a hydrophobic surface with a uniform zeta potential, ψa. The length of the microchannel, denoted as L, greatly exceeds the radii, r = R1 and r = R2. Isothermal rectilinear flow is propelled by pulsatile electro-osmotic force, induced by the combined effects of the electrical double layer (EDL) formed at the liquid–microchannel interface and the sudden imposition of an external time-dependent electric field, as expressed by the following equation:
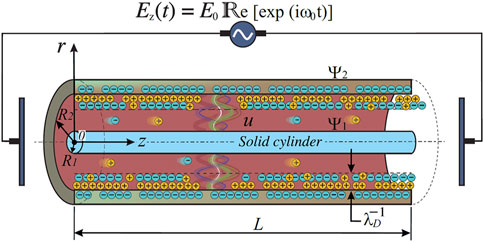
Figure 2. Charge distribution at the wall when the time-pulsating applied electric field is oriented in the axial direction.
Here, n(t) is an oscillatory function, a subset of random stochastic functions representing the change in the electrical field over time, and can be simplified to a sinusoidal oscillatory function as follows (Eq. 2):
In Eq. 1, E0 represents the amplitude of the oscillatory function, ω0 is the frequency, and t represents the process time. A 2D cylindrical coordinate system (r, z) is adopted, with the origin situated at the lower left end of the capillary geometry. Furthermore, the following assumptions are made:
(i) The Debye length, denoted as λD = (kBT/2e2z2n∞ε)1/2, is significantly smaller than r0, i.e., λD/r0 <<1. Here, ε, kB, T, e, z, and n∞ represent the dielectric permittivity of the solvent, Boltzmann constant, absolute temperature, elementary charge, valence, and bulk concentrations, respectively.
(ii) The net charge density within EDL follows the well-known Boltzmann distribution, remaining valid if the frequency of the external electric field is not very high (e.g., less than 1 MHz).
(iii) Interactions between the red blood cells (RBCs) and electrolytes are not considered in our system.
(iv) The gravitational and pressure gradient mechanisms are neglected. In this context, the system is sheared by a pulsating electro-osmotic force.
(v) The electrolyte is symmetric, i.e., we have the same number of ions and counterions.
(vi) The effects of the excluded volume are disregarded in this theory, along with slip mechanisms.
(vii) Joule heating and mass transfer mechanisms are not pertinent in this initial approach.
2.2 Governing equations
2.2.1 Mass conservation and momentum equation
The governing equations that describe the physical system are the mass balance equation without reaction and the Cauchy equation
In addition, the total stress tensor T is given by the following expression:
The material derivative of the velocity field vector is
In Eqs 3–5a, ρ is the density of the liquid, ∇ is the spatial nabla operator, v is the velocity vector, ∂/∂t represents the time partial derivative, T is the total stress tensor, p is the scalar pressure, g is the acceleration of the gravitational forces, σ is a viscoelastic stress tensor, E(t) is the input electrical field, and ρe is the electric charge density of the liquid.
2.2.2 Mechanical model
The rheological model proposed here is a linear Burgers model, which incorporates four material properties related to the polymer–polymer contribution and relaxation mechanisms. The mechanical analogy of the model is shown in Figure 3.
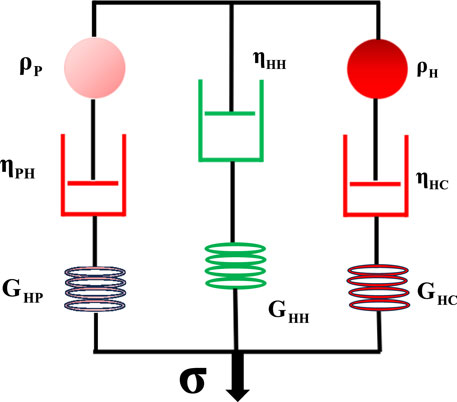
Figure 3. Mechanical configuration depicted features of three parallel Maxwell elements. The first element (left side) represents the plasma contribution, the middle element (center) represents the contribution of the hematocrit, and the last one (right side) is associated with the contributions of both hematocrit and cholesterol.
2.2.3 Rheological model
This constitutive equation contains three Maxwell models associated with the plasma–hematocrit (PH), hematocrit–hematocrit (HH), and hematocrit–cholesterol (HC) interactions. The total deviatoric stress tensor can be represented in the following analytical form:
Then, the contributions from the hematocrit and cholesterol interaction can be expressed in the following analytical form (Eq. 79):
The constitutive rheological equation of state for plasma–hematocrit is given by the following upper-convective Maxwell equation:
The contribution from the hematocrit–hematocrit interaction is given by the following upper-convected Maxwell equation:
The contribution from the hematocrit–cholesterol interactions is given by the following upper-convected Maxwell equation:
The nonlinear time upper-convected Maxwell operator is given by the following equations:
In addition, the time substantial derivatives of the shear stress for the three interactions (PH, HH, and HC) are given by the following analytical expressions:
The shear strain tensor is denoted by D, which is the symmetric part of the spatial velocity gradient tensor; i.e., D = ∇vS.
By combining Eqs 6–15, a generalized rheological equation of state is obtained, which describes all the interactions in the system as follows (Eq. 16):
In the regime of viscoelasticity (small deformations), the rheological equation of state can be simplified to the well-known family of Burgers rheological models:
In Eq. 17, the fluidity operator OΦMM (∂/∂t) proposed by Herrera-Valencia and Rey (2018), Herrera-Valencia et al. (2023) is defined as follows:
In Eq. 18, the combination of all material properties has been defined through the following quantities as follows:
In Eq. 19, Ση is the total bulk viscosity, Σλ is the total relaxation time, ΣG is the total bulk elasticity, Πλ and Pλ are the quadratic and cubic interaction between polymer–hematocrit/hematocrit–hematocrit/hematocrit–cholesterol, respectively, and finally, ΣλJ denotes the total retardation time.
3 Mathematical modeling of the EOF
3.1 Continuity equation
Assuming that the liquid is incompressible, meaning the density is not a function of the position and time, the material time derivative is given by the following equation:
Equation 20 implies that the axial velocity does not depend on the z coordinate, i.e., ∂zvz = 0, and assumes that the cylindrical symmetry ∂θvz = 0.
3.2 Axial velocity, spatial gradient tensor, and viscoelastic stress tensor
Additionally, assuming that it is an isothermal process and the flow is only in the z-direction, the components of the velocity are as follows:
The velocity gradient tensor ∇ v is given by the following Eq. 22:
In addition, the second-order shear strain D tensor can be calculated through Eq. 23.
The viscoelastic shear stress tensor σ is given by the following Eq. 24:
3.3 Volumetric flow
The volumetric flow rate can be calculated through a double integral with respect to the radial and polar coordinates, so the following equation is admitted:
In Eqs 25, 28, the non-slip velocity condition at the wall was used.
4 Potential field within the electric double layer
Following the formalism proposed by Rojas et al. (2017), the flow investigated is steadily and fully developed, and the electric double layers (EDLs) are thin so that there is no interference from one wall into the other. These conditions simplify the Nernst–Planck equations governing the ionic and electric potential field
Assuming mass conservation over the positive and negative ions, the following expression is obtained (Eq. 27):
In the steady state, and assuming only changes in the axial directions, and the axial velocity Viz = μiEz, then the z-potential is defined by Ψ(r) = μiEz. Thus, the ions’ function is given by the following analytical function:
So the total ion and counterions is given by the next Eq. 29:
Then Eq. 30 is obtained,
Here, the space charge density of the mobile ions can be expressed in terms of a hyperbolic function (Eq. 31)
Assuming that the electrical fields are smaller zeψ(r)/kBT << 1, and taking the Taylor expansion to first-order (Sinh(x) ≅ x), Eq. 34 can be simplified in the following form:
If the applied electrical potential Φe satisfies the Laplace equation ∇2Φe = 0, and invoking this principle, the Poisson–Boltzmann equation resulting from substitution of Eq. 32 into Eq. 26 takes the following simpler linear form:
In Eq. 33, the contribution of ψ(r) in the axial and angular directions {z, θ} is neglected with respect to the radial position (L/a << 1), so the following assumption was made: r−1∂/∂r{r∂ψ(r)/∂r} >> ∂2/∂z2ψ(r).
In Eq. 34, the following parameter α2 = 2n0e2z2/(εkBT) is the Debye–Hückel parameter, which is related to the thickness of the Debye layer, λD = 1/α (normally referred to as the EDL thickness). This approximation is valid when the Debye length thickness is small but finite, i.e., for a/λD ∈ [101, 103]. Consequently, the induced potential is limited so that its energy does not exceed the thermal energy in a similar way, as reported by Rojas et al. (2017).
The general solution of Eq. 34 is given in terms of a linear combination of the modified Bessel functions (Eq. 35)
The two boundaries’ conditions are given by the following expressions: ψ(R1) = ψ1 and ψ(R2) = ψ2. The solution of Eq. 38 is given in terms of the modified Bessel functions (Eqs 36, 37):
Here, the reduced z-potential is given by the following equation:
Finally, the net charge density distribution Eq. 32 reduces to (Eq. 39)
and
Equation 40 is a measure of the bulk electronical density distribution in the system.
5 Dimensionless variables and groups
5.1 Scaling laws
To facilitate the physical analysis, the following dimensionless variables are suggested: i) axial velocity, ii) shear stress, iii) radial coordinate, iv) volumetric flow, v) process-time, vi) transfer function, vi) fluidity operator, vii) frequency, viii) beta function, and ix) alpha parameter (Eq. 41).
Additionally, material properties of the rheological constitutive equation are as follows (Eq. 42):
Note that the characteristic dimensionless variables are as follows: i) axial velocity, ii) rz-shear stress, iii) radial coordinate, iv) volumetric flow rate, v) process time, vi) complex transfer function, vii) complex fluidity operator, viii) frequency, ix) external frequency, and x) beta and alpha functions. In particular, the characteristic variables are given by the following expressions (Eq. 43):
The characteristic velocity is the Helmholtz–Smoluchowski (HS) velocity, the characteristic radial coordinate is R2, the characteristic fluidity is the inverse of the product of the total relaxation time and total bulk elasticity, and the characteristic frequency is the inverse of the total relaxation times. All other variables are a combination of these variables (shear stress and volumetric flow rate).
Once the dimensionless variables are substituted into the dynamical equations, the following dimensionless groups, which describe all the macroscopical mechanisms, are obtained. The first dimensionless group is the alpha parameter, which is given by the following Eq. 44:
The second group is total bulk viscosity, which is the sum of all viscosities in the system (Eq. 45)
The third group is the total retardation time, which can be interpreted as average relaxation time, weighted with the viscosities (Eq. 46).
The fourth group is the oscillatory Weissenberg number, which is the product of the total relaxation Σλ and the external frequency ω0 Eq. 47
The fifth group is associated with the inertial Deborah numbers, which are given by the following expressions (Eq. 48):
The sixth and seventh groups are related with geometric Deborah numbers (Eqs 49, 50)
In addition, the following restrictions associated with i) geometry, ii) Maxwell relaxation times, and iii) bulk elasticity are found:
In Eq. 51, R = R1/R2 is ratio of two characteristic lengths. This number determines the level of occlusion in the capillary system. Eqs 52, 53 are the Lagrange multipliers for the material restrictions of the equations and are the starting point for the numerical calculations. These dimensionless numbers describe a material space where the dynamical response between the input force (electrical force) and the output volumetric flow is maximized.
6 Governing equation
In the dimensionless form, the axial component of the momentum equation, which includes the inertial, viscoelastic, and electrolyte distributions, is given by the following linear differential equation:
The parameter β, as defined in Eq. 54, is expressed in the following form, which encapsulates its significance in the context of the analysis:
In Equation 55, the fluidity operator in the Fourier space is given by the following analytical equation:
Equation 56 is derived from Eq. 18 by expressing it in a dimensionless form and utilizing the dimensionless variables and numbers introduced in the preceding section. This transformation allows for a more generalized analysis and facilitates the understanding of the underlying dynamics.
6.1 Axial electro-osmotic-viscoelastic flow
The general solution of the linear partial differential (Eq. 54) can be decomposed into two contributions. The homogeneous contribution is obtained by solving the parametric differential equation.
The solution of Eq. 57 is given in terms of the modified Bessel functions of the first and second class to zero order, denoted as {I0, K0}.
The particular solution for the axial velocity Vpz(r,ω) must satisfy the linear partial differential equation, and it can be written in the following form:
To solve Eq. 59, a solution is assumed for vpz(r,ω) in the following form:
In Eq. 60, the letters A and B represent constants that need to be calculated once the particular velocity profile Vp is substituted into the partial linear differential equation (Eq. 59). Additionally, Eq. 60 satisfies the following linear differential Bessel equation:
When Eq. 61 is substituted into Eq. 59, the following algebraic equation is obtained:
Substituting the particular axial profile Eq. 60 into Eq. 62 yields the following analytical expression (Eq. 63):
When equating coefficients in Eq. 72, it becomes clear that the constants A and B have the following closed form:
and
Equations 64 and 65 satisfy the following restriction (Eq. 66):
Subsequently, the particular axial velocity can be determined
The total axial velocity is obtained as the sum of the homogeneous and particular solutions provided by Eqs 58 and 67, which can be further simplified as follows:
The function f (r,ω) is defined as follows (Eq. 69):
Applying the boundary conditions: i) at r = R1, vz = 0, and ii) at r = R2, vz = 0, the constants C1 y C2 take the following form:
Upon solving Eq. 70, we obtain the constants C3(ω) and C4(ω) in the following analytical forms:
and
Here, H1(ω) and H2(ω) are given by the following expressions:
and
In addition, the functions f1(ω) and f2(ω) are defined in the following analytical expressions:
Equations 75 and 76 are substituted into Eqs 73 and 74, subsequently into Eqs 71 and 72, and finally in the axial velocity profile Eq. 68, arriving at the following simplified nonhomogeneous transfer function for the axial velocity profile:
Equation 77 defines the following non-homogeneous transfer function:
6.2 Volumetric flow rate
Integrating the complex velocity profile over a cross-sectional area, the volumetric flow rate Q(ω) can be expressed in the following analytical form (Eq. 79):
The flow transfer function TF (ω) is given by the following expression:
Equation 80 relates the electrically driven force (input) with the volumetric flow rate (output). Finally, the flow transfer function is given by the following expression:
6.3 Shear stress transfer function
The rz-component of the shear stress tensor can be calculated from the following constitutive equation:
Substituting the axial velocity Eq. 68 into Eq. 82, the following expression is obtained (Eq. 83):
Once the velocity transfer function is substituted into Eq. 83
As a partial summary, Eq. 78 represents the non-homogenous transfer function for the axial velocity profile (VTF). This complex transfer function was integrated to obtain the flow transfer function (FTF), as shown in Eq. 81. By taking the radial spatial derivative of the complex velocity transfer function, we arrive at the stress transfer function (STF), which is shown in Eq. 84. It is worth noting that all transfer functions are analytical, which is one of the objectives of this work, and they depend on the rheology through the fluidity operator ΟΦMM (iω), geometry occlusions through R, and inertial, electric–thermal, and viscoelastic forces. Furthermore, the solution for this particular configuration is expressed in terms of oscillatory complex Bessel functions of the first and second order to zero order. These equations contain seven dimensionless numbers, associated with inertia, electric–thermal effects, geometry, and viscoelastic mechanisms, as defined in Section 5.1.
7 Results
7.1 Numerical predictions
In this section, we present the main results of this research, which are based on the complex transfer function derived from the analysis. Programming was conducted using the software application Mathematica version 13.3, and the results were exported to a graphical program.
7.2 Inertial–viscoelastic mechanisms
In Figures 4A, B, the norm of the flow transfer function is plotted against frequency as a function of the Deborah number. The dimensionless numbers used in the simulation are shown inside the chart. In Figure 4A, the parameter α = 1 indicates that the electrical and thermal mechanisms are equal. At low frequencies, the flow transfer function does not exhibit any resonance curves, indicating that there are critical resonance frequencies where the system shows resonance peaks, where the maximum of the peak is determined by coupled mechanisms associated with electrical–thermal–inertial and viscoelastic forces. The highest response is observed for case “a,” while for increasing inertial Deborah number, the maximum of the resonance peak is greatly diminished, which is associated with the reduced elasticity of the system. At certain frequencies, the system exhibits a train of secondary peaks, which asymptotically decrease to 0 as the frequency increases. The inset of Figure 4A shows the dynamic response of the flow transfer function with different values of the Deborah number. In Figure 4B, the value of the alpha number is α = 10−4, indicating that thermal forces dominate over the electrical processes. Unlike Figure 4A, the first resonance peak is not observed for the case “a,” maintaining all the other resonance peaks almost the same, suggesting that the first resonance is determined by a competition between thermal and electrical mechanisms. Lastly, Figure 4C shows the stress transfer function plotted against frequency as a function of the Deborah number. Here, several secondary peaks are observed, indicating that the interaction between the solid wall and the viscoelastic liquid induces more resonant behavior.
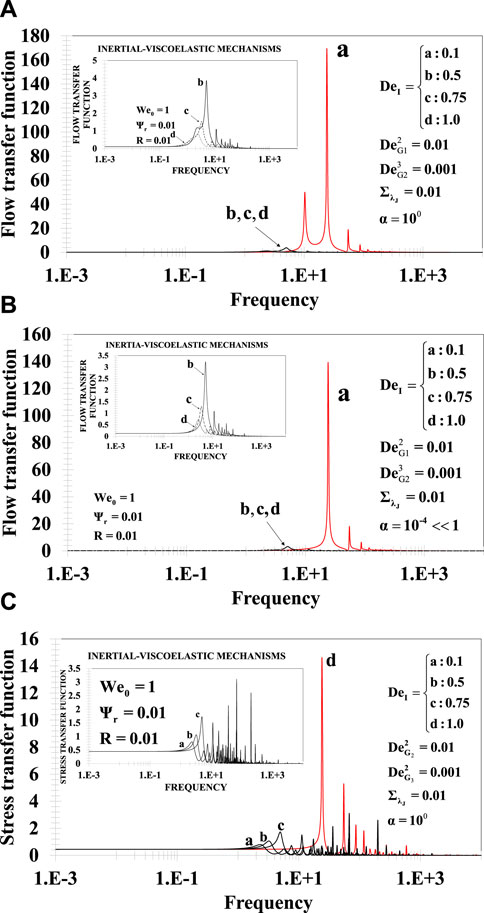
Figure 4. Flow transfer function vs. frequency as a function of the Deborah number and (A) α = 1 and (B) α = 10−4. In Panel (C), the stress transfer function vs. frequency is shown.
7.3 Thermal–electric mechanisms
In Figure 5, both transfer functions (flow a–b, stress c) are plotted against frequency. The effect of the electrical and thermal mechanisms is analyzed as follows. The parameter a represents the competition between electrical and thermal forces. The other parameters employed in the simulation are given by i) DeI = 1.0, ii) SlJ = 0.01, DeG12 = 0.01, and DeG13 = 0.001. In Figures 5A, B, all curves exhibit a plateau where the flow transfer function is independent of the frequency; the value of this plateau depends on the parameter a, i.e., for low a values, the plateau value tends to be 0 (thermal forces dominate over electrical ones), while the value of the plateau increases for increasing values of a (thermal and electrical forces are in balance). At a critical frequency, a maximum resonance peak is observed, and the value of this peak is also dependent on a; the maximum peak decreases for decreasing a, which indicates that thermal forces tend to decrease the maximum resonance value and electrical forces tend to increase it. This peak occurs at a specific frequency called the resonant frequency.
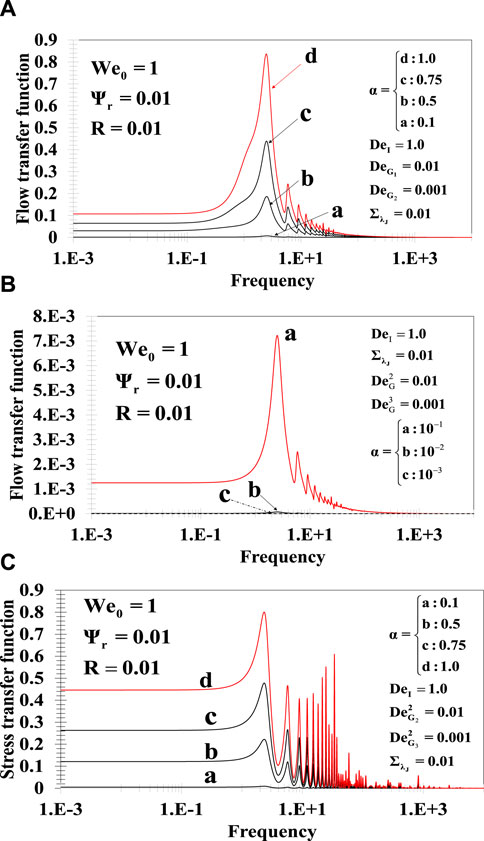
Figure 5. (A–C). Flow transfer function (A, B) vs. frequency as a function of electric–thermal mechanisms associated with α number. (C) Frequency response of the stress transfer function with the same material conditions.
The maximum resonance is reached due to coupled mechanisms associated with inertial–viscoelastic, thermal–electric, and multiple relaxation times in the system. At a second critical frequency beyond the resonance frequency, the system undergoes transitions from higher to lower resonance states, followed by a significant train of secondary peaks.
The important findings of Figures 5A, B are summarized as follows:
(A) The effect of the inertial–viscoelastic mechanisms influences the resonance response in the system. The system requires storage mechanisms through the material parameters to exhibit resonance.
(B) The effect of the parameter a is similar to that of thixotropy in complex fluids.
(C) The electrical forces augment the value of the peak, while thermal forces decrease it.
(D) The interactions between stress transfer functions show an intensity of secondary peaks, some of which do not decrease with frequency. This may be due to multiple interactions with relation times (see, for example, Figure 7C).
7.4 Rheological mechanisms
In the case of three modes, the dimensionless numbers that describe the physics in the system are the following:
(A) Materials: i) total bulk-viscosity (Sh), ii) inertia (DeI), iii) first geometric Deborah (DeG1), iv) second geometric Deborah (DeG2), and v) retardation mechanisms (SlJ).
(B) Electrical–thermal: i) electric–thermal (α) and ii) reduced wall electric potential (ψr).
(C) Geometry: i) occlusion geometry (R).
These eight numbers control the flow and rheology in the physical system, and they are the key parameters for the dynamical response of the flow and stress transfer functions. In the upcoming simulations, the following numerical values are fixed: a) asymmetry wall electric potential, ψr = 0.01, and b) small occlusion, R = 0.01.
According to our material analysis (see, for example, Supplementary Appendix SA), the system can be classified into the following important modes. These modes are linked to the Lagrange multipliers and were previously studied by Herrera-Valencia et al. (2017), Herrera-Valencia et al. (2019), Herrera-Valencia et al. (2023).
(a) First parametric material mode: i) small inertial Deborah number (0 < DeI < ∞), ii) small bulk-viscosity (Sh = 10−4), iii) small geometric Deborah numbers (DeG1 = 10−4 and DeG2 = 10−5 DeG2 < DeG1), and iv) small retardation mechanisms (SlJ = 10−4).
(b) Second parametric material mode: i) small inertial Deborah number (0 < DeI < ∞), ii) large bulk-viscosity (Sh = 1), iii) small geometric Deborah numbers (DeG1 = 10−4 and DeG2 = 10−5; DeG2 < DeG1), and iv) small retardation mechanisms (SlJ = 10−4).
(c) Third parametric material mode: i) small inertial Deborah number (0 < DeI < ∞), ii) equal bulk-viscosity (Sh at 1/3), iii) first geometric Deborah numbers (DeG1 = 1/3 and DeG2 = 1/27; DeG2 < DeG1), and iv) small retardation mechanisms (SlJ = 2/3).
Figure 6 shows the effect of rheology on the dynamical response of the system. It is clear that a large viscosity induces a small dynamical response in the EOF (α = 0.1). Additionally, the α number related to electrical and thermal mechanisms is crucial in the resonance behavior of the viscoelastic electrolyte.
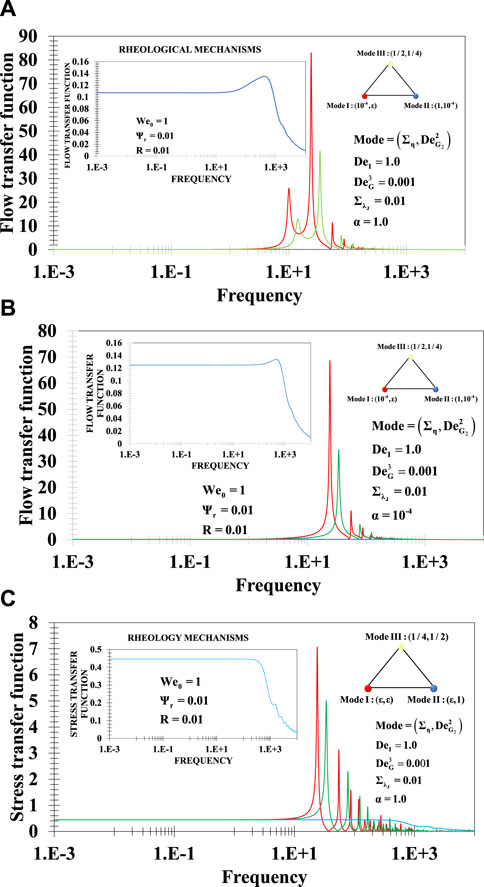
Figure 6. (A–C). Flow and stress (c) transfer functions vs. frequency for different rheological conditions: i) mode I: small viscoelasticity and small bulk viscosity, ii) mode II: high viscosity and small viscoelasticity, and III) mode III: intermediate viscosity and high viscoelasticity.
Noticeably, when the system is dominated by electrical forces, several secondary resonance peaks appear, which is a consequence of the orientation (Figure 6A), whereas when the electrical mechanisms decrease, the system shows a dominant resonance peak with smaller secondary resonance peaks (Figure 6B).
Figure 6C shows the interaction between the wall stress and the electro-viscoelastic fluid. At small frequencies, the dynamical response is constant, and for a critical frequency, the system shows a dominant resonance peak followed by a secondary train of peaks, which are damped by the effect of intermediate and high frequencies.
In partial conclusion, in both systems, the maximum resonance peak is reached through the following important issues: a) low viscosity, b) small memory, and c) small retardation times. In other cases, the linear dynamical response is much lower due to the interaction with other mechanisms, such as i) viscous (dissipation), ii) elastic (storage), and iii) retardation (multiple relaxation times) contributions.
7.5 Rheometric data
The experimental section, including rheological characterization of blood with low and high cholesterol material properties, is given in Table 1 and taken from Moreno et al. (2015). The main assumptions of the rheometric data are summarized as follows:
(a) The parameters correspond to a total cholesterol sample, where the values of low and high cholesterol in human blood are around 187 mg/dL and 400 mg/dL, respectively.
(b) The hematocrit in all the samples was approximately constant at 48%.
(c) The temperature was kept at 37°C to emulate the conditions of blood within the human body.
(d) The fitting of the rheometric data was performed using a Wolfram Mathematica code with a multi-modal Maxwell model, employing three modes.
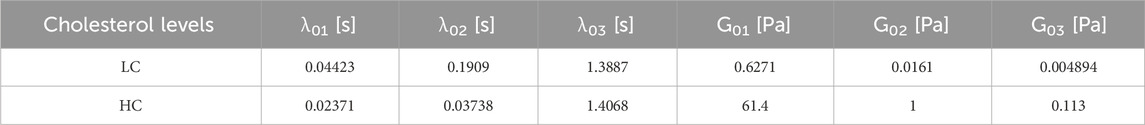
Table 1. Material properties of blood with high cholesterol.
In Figure 7 storage and loss moduli vs. frequency as a function of low and high cholesterol are shown. At intermediate frequency, blood with high cholesterol exhibits a predominantly viscous mechanism associated with dissipation processes, while elastic forces are associated with the storage modulus. The effect of low cholesterol induces a predominantly viscous-dissipation behavior; however, the system shows a predominant viscoelastic relaxation associated with a possible crossover frequency close to 100 rad/s. Moreno et al. (2015) demonstrated that as the cholesterol macromolecule increases, the system induces a transition from fluid-like to solid-like behavior associated with an elastic–plastic behavior. The dimensionless equations for electrolytic distribution, axial profile velocity, and volumetric flow rate are given in the upcoming section, where we delve into the mathematical formulations governing these parameters.
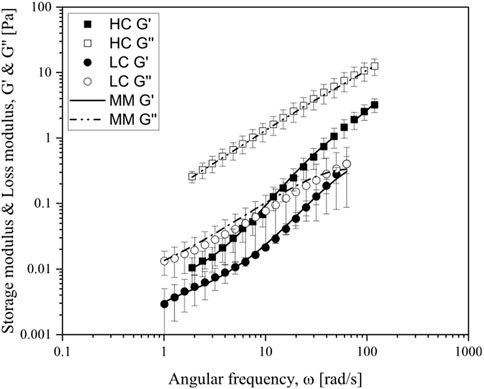
Figure 7. Storage and loss modulus vs. frequency for the rheometric data of human blood with cholesterol. The experimental data were fitted by the four multimodal Maxwell rheological equations to take into account the plasma–hematocrit–cholesterol interaction.
7.6 Dimensionless numbers at low- and high-cholesterol samples
In this section, we utilize both low and high human blood rheometric data to calculate the flow and stress transfer functions (Moreno et al., 2015). To model the data, we employ the multi-modal Maxwell equation to determine the fluidity function (Eq. 21). The simulation also incorporates the following parameters:
(a) The ratio wall potential, i.e., Yr = Y2/Y1 = 0.01.
(b) The total blood density, i.e., r = rP + rH ∼ (1,060, 1,088) kg/m3.
(c) The average ratio of the vein: (2 × 10⁻⁵ £ R2 £ 3.5 × 10⁻⁴) m.
(d) Oscillatory Weissenberg number We0 = 0.1.
(d) Maxwell relaxation times LC: Sl = l1 +l2 + l3 = 1.6383 s.
(e) Maxwell relaxation times HC: Sl = l1 +l2 + l3, = 1.4695 s.
(f) Bulk elasticity LC: (SG)LC = G1 +G2 + G3 = 0.6523 Pa.
(g) Bulk elasticity HC: (SG)HC = G1 +G2 + G3 = 62.521 Pa.
(h) Viscosity LC: (Sη)LC = l1G1 + l2G2 + l3G3 = 0.037582.
(i) Viscosity HC: (Sη)HC = l1G1 + l2G2 + l3G3 = 1.65214.
These geometric and rheology material properties led us to calculate the inertial-bulk elastic/viscoelastic dimensionless numbers for high and low cholesterol, which are calculated as follows:
Inertial Deborah number LC:
Inertial Deborah number HC:
Total bulk viscosity at low cholesterol:
Total bulk viscosity at high cholesterol:
Geometric Deborah numbers LC:
Geometric Deborah number HC:
Retardation mechanisms LC:
Retardation mechanisms HC:
In the following section, the dimensionless numbers for low and high cholesterol are used to obtain the resonance curves.
Figure 8A illustrates the influence of geometry, inertia, bulk elasticity, and viscoelasticity, as represented by the Deborah number, on the resonance peak for blood with low cholesterol content. A primary resonance peak is observed at a characteristic frequency for curves (a, b). However, simulations (c, d) do not exhibit resonance behavior due to geometric, internal, and bulk elastic forces. It is noteworthy that a mechanical response (plateau) is evident at low frequencies, which is a characteristic effect observed in vibratile systems within complex fluids such as micellar solutions (Herrera-Valencia et al., 2023). Figure 8B demonstrates the effect of the electric and thermal mechanisms on the resonance peak for blood with low cholesterol content. A primary resonance peak is observed at a characteristic frequency for all curves. Additionally, the influence of parameter a is evident in Figure 8B; as a decreases, the thermal mechanism predominates over the electric mechanism, leading to a reduction in the maximum value of the resonance peak.
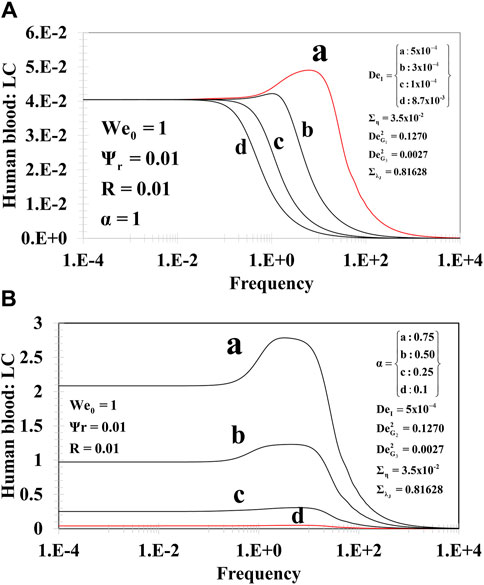
Figure 8. Flow transfer function vs. frequency for human blood with low content of cholesterol (A) and high content of cholesterol (B).
In Figures 9A, B, the impact of the inertial–viscoelastic and electric–thermal mechanisms as a function of frequency for various values of the Deborah and α numbers is analyzed. It is evident that for blood with high cholesterol, resonance peaks are not observed.
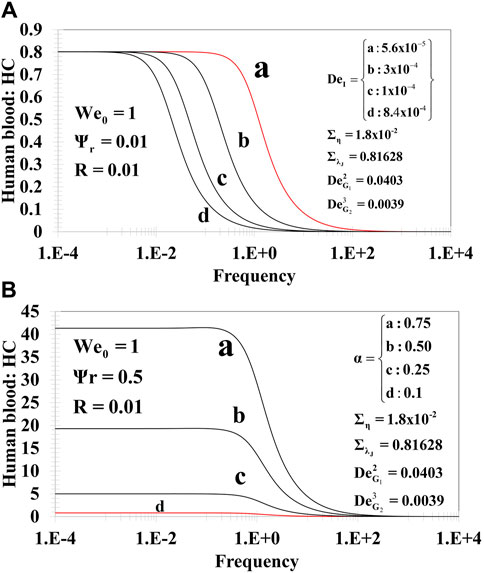
Figure 9. Flow transfer function vs. frequency for human blood with high cholesterol as a function of (A) viscoelastic and (B) electro-thermal forces.
The Deborah number tends to decrease the plateau as inertial forces increase. At a specific frequency, the transfer function relaxes, induced by the multiple Maxwell relaxation times.
This absence of resonance behavior is attributed to the high viscosity of the sample, which dominates over elastic mechanisms.
8 Conclusion
Analytical solutions were derived for annular flow involving EOF of viscoelastic fluids obeying a multi-modal Maxwell model (3-modes). Antisymmetric boundary conditions with different zeta potentials at the walls were assumed. The dynamical equations include a linearized Poisson–Boltzmann equation governing the electrical double-layer field that was included in the momentum equations.
The modified Navier–Stokes equation was solved using the Fourier transform integral, assuming non-slip conditions at the capillary. Analytical expressions for the axial velocity profile, volumetric flow rate, and wall shear stress were obtained. The important material parameters are i) electrical (ψ1,ψ2), ii) thermal (T), iii) geometric (R1, R2, and L), and iv) rheological (Gi, λi; i = 1, … , n). The adjustment of blood weight concentration is achieved through material conditions and statistical analysis using a Mathematica code.
Some of the key results are summarized below:
The physics and rheology of the system can be represented through nine dimensionless numbers associated with all the mechanisms:
(A) Viscoelastic fluid: i) total bulk viscosity (Ση), ii) inertial–viscoelastic Deborah number (DeI), ii) geometric Deborah numbers {DeG1 and DeG2}, and iii) average retardation time (ΣλJ).
(B) External viscoelastic force: We0.
(C) Electric double layer: Ψr.
(D) Geometrical constriction ratio: R.
(E) Geometrical constriction ratio: R.
The key issues include the following:
• Parameters α and β associated with the electric–thermal–inertial–bulk elastic, viscoelasticity, and compliance mechanisms control the dynamical response of the flow and stress transfer functions in the following way: elasticity and electrical mechanisms increase the resonant peak maximum value of the system, while thermal and viscous mechanisms diminish it.
• The methodology is applicable to any linear or fractional constitutive equation and can be explored with modes with several relaxation times.
• The system is described by two analytical transfer functions {TF (w) and TS (w)} governing the interactions between the driven electrical field force and the corresponding volumetric and stress–inertial outputs.
• The dominant relaxation time is related with the maximum peak resonant, while a train of secondary peaks is determined by secondary Maxwell relaxation times and the mathematical architecture of the complex Bessel functions to the zeroth and first orders.
• The electrical mechanisms are associated with the energy required to reach the resonance peak. When the electrical field mechanism is smaller, the system needs more energy to reach the maximum. In contrast, when the electrical forces dominate over the thermal mechanisms, the system needs less energy to reach the maximum peak.
• Blood with low cholesterol content exhibits a large resonant peak; while no resonance is observed for high cholesterol content due to high viscosity (low elasticity) dominance in the response.
• Resonance dominates at a critical Deborah number, while higher values lead to a train of secondary resonance peaks due to the relaxation time spectrum.
The results obtained show that the electro-thermal mechanisms induce a dynamical response in the context of oscillatory flow. When the system is dominated by electric mechanisms, the resonance is larger when compared with the thermal fluctuations. This methodology is completely general and can be fitted to any rheometric data of blood with other pathologies. For the geometric conditions explored in this research, i.e., R < 0, the system can be interpreted as an arterial central occlusion.
9 Future work
Finally, a natural extension of this work would be to study moderate and large deformations with a model developed by our research group. This model would incorporate effects such as thixotropy, rheopexy, shear-thinning, shear-thickening, and shear-banding. The present work represents a starting point to promote experimental investigations of blood flow with different cholesterol levels in EOF.
Data availability statement
The raw data supporting the conclusion of this article will be made available by the authors, without undue reservation.
Author contributions
EH-V: conceptualization, data curation, formal analysis, funding acquisition, investigation, methodology, project administration, resources, software, supervision, validation, visualization, writing–original draft, and writing–review and editing. LR-T: conceptualization, data curation, formal analysis, funding acquisition, investigation, methodology, project administration, resources, software, supervision, validation, visualization, and writing–review and editing. CS-C: conceptualization, data curation, formal analysis, funding acquisition, investigation, methodology, project administration, resources, software, supervision, validation, visualization, and writing–review and editing. MS-V: conceptualization, data curation, formal analysis, funding acquisition, investigation, methodology, project administration, resources, software, supervision, validation, visualization, and writing–review and editing. OB: conceptualization, data curation, formal analysis, funding acquisition, investigation, methodology, project administration, resources, software, supervision, validation, visualization, and writing–review and editing. VH-A: conceptualization, data curation, formal analysis, funding acquisition, investigation, methodology, project administration, resources, software, supervision, validation, visualization, and writing–review and editing. FC: conceptualization, data curation, formal analysis, funding acquisition, investigation, methodology, project administration, resources, software, supervision, validation, visualization, and writing–review and editing.
Funding
The author(s) declare that no financial support was received for the research, authorship, and/or publication of this article.
Acknowledgments
EH-V acknowledges financial support of PAPIIT-DGAPA/UNAM project IN102823 and the theoretical discussion of James McGill Professor Alejandro Rey, Chemical Engineering Department McGill University, Montreal, QC, Canada. EH-V acknowledges financial support of PAPIME-DGAPA/UNAM project PE106224. LR-T gratefully appreciates the financial support from the Consejo Nacional de Ciencia y Tecnología (CONACyT) through CVU 860719. LR-T acknowledges the support of FESZ-UNAM project FESZ-RP/23-204-02. CS-C gratefully appreciates the financial support PAPIIT-DGAPA/UNAM project IN210023 and the Dirección General de Cómputo y de Tecnologías de Información y Comunicación (DGTIC) of the UNAM for allocation of computer time on the Miztli Supercomputer. VH-A acknowledges financial support of PAPIIT-DGAPA/UNAM project IT-200323. EH-V dedicates this research to the memory of his beloved father Emilio Herrera Caballero “el ave de las tempestades.”
Conflict of interest
The authors declare that the research was conducted in the absence of any commercial or financial relationships that could be construed as a potential conflict of interest.
Publisher’s note
All claims expressed in this article are solely those of the authors and do not necessarily represent those of their affiliated organizations, or those of the publisher, the editors, and the reviewers. Any product that may be evaluated in this article, or claim that may be made by its manufacturer, is not guaranteed or endorsed by the publisher.
Supplementary material
The Supplementary Material for this article can be found online at: https://www.frontiersin.org/articles/10.3389/frsfm.2024.1385512/full#supplementary-material
References
Afonso, A. M., Alves, M. A., and Pinho, F. T. (2009). Analytical solution of mixed electro-osmotic/pressure driven flows of viscoelastic fluids in microchannels. J. Newt. Fluid Mech. 159, 50–63. doi:10.1016/j.jnnfm.2009.01.006
Afonso, A. M., Alves, M. A., and Pinho, F. T. (2013). Analytical solution of two fluid electro-osmotic flows of viscoelastic fluids. J. Coll. Interface Sci. 395, 277–286. doi:10.1016/j.jcis.2012.12.013
Ali, N., Hussain, S., and Ullah, K. (2020). Theoretical analysis of two-layered electro-osmotic peristaltic flow of FENE-P fluid in an axisymmetric tube. Phys. Fluids 32, 023105. doi:10.1063/1.5132863
Apostolidis, A. J., Armstrong, M. J., and Beris, A. N. (2015). Modeling of human blood rheology in transient shear flows. J. Rheol. 59, 275–298. doi:10.1122/1.4904423
Apostolidis, A. J., and Beris, A. N. (2014). Modeling of the blood rheology in steady-state shear flows. J. Rheol. 58, 607–633. doi:10.1122/1.4866296
Apostolidis, A. J., and Beris, A. N. (2016). The effect of cholesterol and triglycerides on the steady state shear rheology of blood. Rheol. Acta 55, 497–509. doi:10.1007/s00397-015-0889-0
Apostolidis, A. J., Moyer, A. P., and Beris, A. N. (2016). Non-Newtonian effects in simulations of coronary arterial blood flow. J. Newt. Fluid Mech. 233, 155–165. doi:10.1016/j.jnnfm.2016.03.008
Armstrong, M. J., Beris, A. N., Rogers, S. A., and Wagner, N. J. (2016). Dynamic shear rheology of a thixotropic suspension: comparison of an improved structure-based model with large amplitude oscillatory shear experiments. J. Rheol. 60, 433–450. doi:10.1122/1.4943986
Arulanandam, S., and Li, D. (2000). Liquid transport in rectangular microchannels by electro-osmotic pumping. Colloids Surf. A 161, 89–102. doi:10.1016/S0927-7757(99)00328-3
Bandopadhyay, A., and Chakraborty, S. (2012a). Giant augmentations in electro-hydro-dynamic energy conversion efficiencies of nanofluidic devices using viscoelastic fluids. Appl. Phys. Lett. 101 (4), 043905. doi:10.1063/1.4739429
Bandopadhyay, A., and Chakraborty, S. (2012b). Giant augmentations in electro-hydro-dynamic energy conversion efficiencies of nanofluidic devices using viscoelastic fluids. Appl. Phys. Lett. 101 (4), 043905. doi:10.1063/1.4739429
Bandopadhyay, A., and Chakraborty, S. (2012c). Electrokinetically induced alterations in dynamic response of viscoelastic fluids in narrow confinements. Phys. Rev. E 85 (5), 056302. doi:10.1103/physreve.85.056302
Bandopadhyay, A., and Chakraborty, S. (2012d). Electrokinetically induced alterations in dynamic response of viscoelastic fluids in narrow confinements. Phys. Rev. E 85 (5), 056302. 056302. doi:10.1103/physreve.85.056302
Bandopadhyay, A., Ghosh, U., and Chakraborty, S. (2013a). Time periodic electroosmosis of linear viscoelastic liquids over patterned charged surfaces in microfluidic channels. J. Newt. Fluid Mech. 202, 1–11. doi:10.1016/j.jnnfm.2013.09.001
Bandopadhyay, A., Ghosh, U., and Chakraborty, S. (2013b). Time periodic electroosmosis of linear viscoelastic liquids over patterned charged surfaces in microfluidic channels. J. Newt. Fluid Mech. 202, 1–11. doi:10.1016/j.jnnfm.2013.09.001
Bandopadhyay, A., Goswami, P., and Chakraborty, S. (2013c). Regimes of streaming potential in cylindrical nano-pores in presence of finite sized ions and charge induced thickening: an analytical approach. J. Chem. Phys. 139 (22), 224503. doi:10.1063/1.4837195
Bandopadhyay, A., Tripathi, D., and Chakraborty, S. (2016). Electroosmosis-modulated peristaltic transport in microfluidic channels. Phys. Fluids 28 (5). doi:10.1063/1.4947115
Baños, R., Arcos, J., Bautista, O., and Méndez, F. (2021). Steric and slippage effects on mass transport by using an oscillatory electroosmotic flow of power-law fluids. Micromachines 12, 539–630. doi:10.3390/mi12050539
Bazant, M. Z., Kilic, M. S., Storey, B. D., and Ajdari, A. (2009). Towards an understanding of induced-charge electrokinetics at large applied voltages in concentrated solutions. Adv. Colloid Interface Sci. 152 (1-2), 48–88. doi:10.1016/j.cis.2009.10.001
Beidokhti, M. N., Andersen, M. V., Eid, H. M., Sanchez-Villavicencio, M. L., Staerk, D., Haddad, P., et al. (2017). Investigation of antidiabetic potential of Phyllanthus niruri L. using assays for α-glucosidase, muscle glucose transport, liver glucose production, and adipogenesis. Biochem. Biophys. Res. Comm. 493, 869–874. doi:10.1016/j.bbrc.2017.09.080
Berli, C. L. A., and Olivares, M. L. (2008). Electrokinetic flow of non-Newtonian fluids in microchannels. J. Coll. Interface Sci. 320, 582–589. doi:10.1016/j.jcis.2007.12.032
Bouchnita, A., Nony, P., Llored, J. P., and Volpert, V. (2022). Combining mathematical modeling and deep learning to make rapid and explainable predictions of the patient specific response to anticoagulant therapy under venous flow. Math. Biosci. 349, 108830. doi:10.1016/j.mbs.2022.108830
Burgreen, D., and Nakache, F. R. (1964). Electrokinetic flow in ultrafine capillary slits. J. Phys. Chem. 68, 1084–1091. doi:10.1021/j100787a019
Castillo, H., and Wilson, H. (2018). Elastic instabilities in pressure-driven channel flow of thixotropic viscoelasto-plastic fluids. J. Newt. Fluid Mech. 261, 10–24. doi:10.1016/j.jnnfm.2018.07.009
Chakraborty, S. (2005). Dynamics of capillary flow of blood into a microfluidic channel. Lab. chip 5, 421–430. doi:10.1039/B414566F
Chakraborty, S. (2007). Electroosmotically driven capillary transport of typical non-Newtonian biofluids in rectangular microchannels. Anal. Chim. Acta 605, 175–184. doi:10.1016/j.aca.2007.10.049
Chakraborty, S., and Srivastava, A. K. (2007). Generalized model for time periodic electroosmotic flows with overlapping electrical double layers. Langmuir 23, 12421–12428. doi:10.1021/la702109c
Collepardo-Guevara, R., and Corvera-Poiré, E. (2007). Controlling viscoelastic flow by tuning frequency during occlusions. Phys. Rev. E 76, 026301. doi:10.1103/PhysRevE.76.026301
Corvera Poiré, E., and Hernández-Machado, A. (2016). Frequency-induced stratification in viscoelastic microfluidics. Langmuir 26, 15084–15086. doi:10.1021/la1024422
Das, S., and Chakraborty, S. (2006). Analytical solutions for velocity, temperature and concentration distribution in electroosmotic microchannel flows of a non-Newtonian bio-fluid. Anal. Chim. Acta 559, 15–24. doi:10.1016/j.aca.2005.11.046
De la Guerra, P. A., and Corvera Poiré, E. (2022). Pulsatile parallel flow of air and a viscoelastic fluid with multiple characteristic times. An application to mucus in the trachea and the frequency of cough. J. Phys. 34, 314003. doi:10.1088/1361-648X/ac6fa7
Del Rio, J. A., López de Haro, M., and Whitaker, S. (1998). Enhancement in the dynamic response of a viscoelastic fluid flowing in a tube. Phys. Rev. E 58, 6323–6327. doi:10.1103/PhysRevE.58.6323
Dhinakaran, S., Afonso, M. M., Alves, M. A., and Pinho, F. T. (2010). Steady viscoelastic fluid flow between parallel plates under electro-osmotic forces: Phan-Thien–Tanner model. J. Coll. Interface Sci. 344, 513–520. doi:10.1016/j.jcis.2010.01.025
Dutta, P., and Beskok, A. (2011). Analytical solution of combined electroosmotic/pressure driven flows in two-dimensional straight channels: finite Debye layer effects. Ana. Chem. 73, 1979–1986. doi:10.1021/ac001182i
Ferrás, L. L., Afonso, M. A., Nóbrega, J. M., and Pinho, F. T. (2016). Electro-osmotic and pressure-driven flow of viscoelastic fluids in microchannels: analytical and semi-analytical solutions. Phys. Fluids 28, 093102. doi:10.1063/1.4962357
Ferrás, L. L., Morgado, M. L., Rebelo, M., McKinley, G. H., and Afonso, A. M. (2019). A generalised Phan-Thien-Tanner model. J. Newt. Fluid Mech. 269, 88–99. doi:10.1016/j.jnnfm.2019.06.001
Flores, J., Alastruey, J., and E. Corvera Poiré, E. (2016). A novel analytical approach to pulsatile blood flow in the arterial network. Ann. Biom. Eng. 44, 3047–3068. doi:10.1007/s10439-016-1625-3
Flores, J., Corvera Poiré, E., Chowienczyk, P., and Alastruey, J. (2021). Estimating central pulse pressure from blood flow by identifying the main physical determinants of pulse pressure amplification. Front. Physiol. 23, 608098. doi:10.3389/fphys.2021.608098
Flores, J., Hernández-Machado, A., and Corvera Poiré, E. (2019). Enhanced imbibition from the cooperation between wetting and inertia via pulsatile forcing. Phys. Fluids 31, 032107. doi:10.1063/1.5086028
Gogoi, A., Anky Reddy, K., and Kumar Mondal, P. (2021). Electro-osmotic flow through nanochannel with different surface charge configurations: a molecular dynamics simulation study. Phys. Fluids 33 (pg.1-12), 092115. doi:10.1063/5.0062031
Herrera-Valencia, E. E., Calderas, F., Medina-Torres, L., Pérez-Camacho, M., Moreno, L., and Manero, O. (2017). On the pulsating flow behavior of a biological fluid: human blood. Rheol. Acta 56, 387–407. doi:10.1007/s00397-017-0994-3
Herrera-Valencia, E. E., and Rey, A. D. (2023). Fluctuating flexoelectric membranes in asymmetric viscoelastic media: power spectrum through mechanical network and transfer function models. Symmetry 15, 1004–1011/36. doi:10.3390/sym15051004
Herrera-Valencia, E. E., Sánchez-Villavicencio, M. L., Medina-Torres, L., Nuñez-Ramírez, D. M., Hernández Abad, V. J., Calderas, F., et al. (2019). New simple analytical method for flow enhancement predictions of pulsatile flow of a structured fluid. Phys. Fluids 31, 063104–63111/17. doi:10.1063/1.5097867
Herrera-Valencia, E. E., Sánchez-Villavicencio, M. L., Soriano-Correa, C., Bautista, O., Ramírez-Torres, L. A., Hernández-Abad, V. J., et al. (2023). Study of the electroosmotic flow of a structured fluid with a new generalized rheological model. Rheo. Acta 63, 3–32. doi:10.1007/s00397-023-01418-8
Horner, J. S., Armstrong, M. J., Wagner, N. J., and Beris, A. N. (2018). Investigation of blood rheology under steady and unidirectional large amplitude oscillatory shear. J. Rheol. 62, 577–591. doi:10.1122/1.5017623
Horner, J. S., Armstrong, M. J., Wagner, N. J., and Beris, A. N. (2019). Measurements of human blood viscoelasticity and thixotropy under steady and transient shear and constitutive modeling thereof. J. Rheol. 63, 799–813. doi:10.1122/1.5108737
Iglič, A., Gongadze, E., and Bohinc, K. (2010). Excluded volume effect and orientational ordering near charged surface in solution of ions and Langevin dipoles. Bioelectrochemistry 79 (2), 223–227. doi:10.1016/j.bioelechem.2010.05.003
Jendrejack, R. M., Dimalanta, E. T., Schwartz, D. C., Graham, M. D., and de Pablo, J. J. (2013). DNA dynamics in a microchannel. Phys. Rev. Lett. 91, 038102. doi:10.1103/PhysRevLett.91.038102
Jiang, Y., Qi, H., Xu, H., and Jiang, X. (2017). Transient electroosmotic slip flow of fractional Oldroyd-B fluids. Microfluid Nanofluid 2, 7. doi:10.1007/s10404-016-1843-x
Kaushick, P., Mondal, P. K., and Chakraborty, S. (2017). Rotational electrohydrodynamics of a non-Newtonian fluid under electrical double layer phenomenon: the role of lateral confinement. Microfluid. Nanofluidics 21 (1-16), 122. doi:10.1007/s10404-017-1957-9
Kaushik, P., Kumar, M. P., Kundu, P., and Wongwises, S. (2019). Rotating electroosmotic flow through a polyelectrolyte-grafted microchannel: an analytical solution. Phys. Fluids 31 (1-12), 022009. doi:10.1063/1.5086327
Kilic, M. S., Bazant, M. Z., and Ajdari, A. (2007). Steric effects in the dynamics of electrolytes at large applied voltages. I. Double-layer charging. Phys. Rev. E 75 (2), 021502. doi:10.1103/physreve.75.021502
Kumar Metha, S., and Kumar Mondal, P. (2023a). AC electrothermal effect promotes enhanced solute mixing in a wavy microchannel. Langmuir 39, 16797–16806. doi:10.1021/acs.langmuir.3c02150
Kumar Metha, S., and Kumar Mondal, P. (2023b). Vortex-assisted electroosmotic mixing of Carreau fluid in a microchannel. Electrophoresis 44 (21-22), 1629–1636. doi:10.1002/elps.202200258
Kumar Metha, S., Pati, S., and Kumar Mondal, P. (2021). Numerical study of the vortex induced electroosmotic mixing of non-Newtonian biofluids in a non-uniformly charged wavy microchannel: effect of finite ion size. Electrophoresis. doi:10.1002/elps.202000225
Kumar Mondal, P., Ghosh, U., Bandopadhyay, A., DasGupta, D., and Chakraborty, S. (2013). Electric-field-driven contact-line dynamics of two immiscible fluids over chemically patterned surfaces in narrow confinements. Phys. Rev. E 88 (1-13), 023022. doi:10.1103/PhysRevE.88.023022
Kumar Mondal, P., Ghosh, U., Bandopadhyay, A., DasGupta, D., and Chakraborty, S. (2014). Pulsating electric field modulated contact line dynamics of immiscible binary systems in narrow confinements under an electrical double layer phenomenon. Soft Matter 10 (42), 8512–8523. doi:10.1039/C4SM01583E
Ledesma-Aguilar, R., Pagonabarraga, I., and Hernández-Machado, A. (2007). Three-dimensional aspects of fluid flows in channels. I. Meniscus and thin film regimes. Phys. Fluids 19, 102112. doi:10.1063/1.2801511
Levine, S., Marriot, J. R., Neale, G., and Epstein, N. (1975). Theory of electrokinetic flow in fine cylindrical capillaries at high zeta-potentials. J. Coll. Interface Sci. 52, 136–149. doi:10.1016/0021-9797(75)90310-0
Liu, T. T., Wong, W., Hou, M., Lin, H., Chang, F., and Lee, S. (2022). Hemorheology in patients with liver cirrhosis: special emphasis on its relation to severity of esophageal variceal bleeding. J. Gastroenterol. Hepatol. 21, 908–913. doi:10.1111/j.1440-1746.2006.04266.x
Mahapatra, B., and Bandopadhyay, A. (2020). Electroosmosis of a viscoelastic fluid over non-uniformly charged surfaces: effect of fluid relaxation and retardation time. Phys. Fluids 32, 032005. doi:10.1063/5.0003457
Mahapatra, B., and Bandopadhyay, A. (2021). Numerical analysis of combined electroosmotic-pressure driven flow of a viscoelastic fluid over high zeta potential modulated surfaces. Phys. Fluids 33, 012001. doi:10.1063/5.0033088
Mederos, G., Arcos, J., Bautista, O., and Méndez, F. (2020). Hydrodynamics rheological impact of an oscillatory electroosmotic flow on a mass transfer process in a microcapillary with a reversible wall reaction. Phys. Fluids 32, 122003. doi:10.1063/5.0027818
Medina, I., Toledo, M., Méndez, F., and Bautista, O. (2018). Pulsatile electroosmotic flow in a microchannel with asymmetric wall zeta potentials and its effect on mass transport enhancement and mixing. Chem. Eng. Sci. 184, 259–272. doi:10.1016/j.ces.2018.03.051
Moreno, L., Calderas, F., Sánchez-Olivares, G., Medina-Torres, L., Sánchez-Solís, A., and Manero, O. (2015). Effect of cholesterol and triglycerides levels on the rheological behavior of human blood. J. Korea-Aust Rheol. 27, 1–10. doi:10.1007/s13367-015-0001-4
Moyers-Gonzalez, M. A., Owens, R. G., and Fang, J. (2008). A non-homogeneous constitutive model for human blood. J. Newt. Fluid Mech. 155, 161–173. doi:10.1016/j.jnnfm.2008.04.001
Moyers-Gonzalez, M. M., and Owens, R. G. (2010). Mathematical modelling of the cell-depleted peripheral layer in the steady flow of blood in a tube. Biorheology 47, 39–71. doi:10.3233/BIR-2010-0558
Neofytou, P., and Tsangaris, S. (2006). Flow effects of blood constitutive equations in 3D models of vascular anomalies. Int. J. Numer. Meth. Fluids 51, 489–510. doi:10.1002/fld.1124
Peralta, M., Arcos, J. C., Méndez, F., and Bautista, O. (2020). Mass transfer through a concentric-annulus microchannel driven by an oscillatory electroosmotic flow of a Maxwell fluid. J. Newt. Fluid Mech. 279, 104281. doi:10.1016/j.jnnfm.2020.104281
Peralta, M., Bautista, O., Méndez, F., and Bautista, E. (2018). Pulsatile electroosmotic flow of a Maxwell fluid in a parallel flat plate microchannel with asymmetric zeta potentials. Appl. Math. Mech. 39, 667–684. doi:10.1007/s10483-018-2328-6
Ribau, A. M., Ferrás, L. L., Morgado, M. L., Rebelo, M., Alves, M. A., Pinho, F. T., et al. (2021). A study on mixed electro-osmotic/pressure-driven microchannel flows of a generalised Phan-Thien–Tanner fluid. J. Eng. Math. 127, 7. doi:10.1007/s10665-020-10071-6
Rojas, G., Arcos, J., Peralta, F., Méndez, F., and Bautista, O. (2019). Pulsatile electroosmotic flow in a microcapillary with the slip boundary condition. Colloids Surf. A Physicochem 513, 57–65. doi:10.1016/j.colsurfa.2016.10.064
Sacks, M. S., and Yoganathan, A. P. (2007). Heart valve function: a biomechanical perspective. Phil. Trans. R. Soc. B Biol. Sci. 362, 1369–1391. doi:10.1098/rstb.2007.2122
Sadek, S. H., and Pinho, F. T. (2019). Electro-osmotic oscillatory flow of viscoelastic fluids in a microchannel. J. Newt. Fluid Mech. 266, 46–58. doi:10.1016/j.jnnfm.2019.01.007
Saengow, C., Giacomin, A. J., and Dimitrov, A. S. (2019). Unidirectional large-amplitude oscillatory shear flow of human blood. Phys. Fluids 31, 111903. doi:10.1063/1.5127868
Sánchez, S., Arcos, J., Bautista, O., and Méndez, F. (2013). Joule heating effect on a purely electroosmotic flow of non-Newtonian fluids in a slit microchannel. J. Newt. Fluid Mech. 192, 1–9. doi:10.1016/j.jnnfm.2012.09.014
Sanjav, G. H., Kumar, G., and Mondal, P. (2020). Efficient electroosmotic mixing in a narrow-fluidic channel: the role of a patterned soft layer. Soft Matter 16 (27), 6304–6316. doi:10.1039/D0SM00890G
Sarma, R., Deka, N., Sarma, K., and Modal, P. (2018). Electroosmotic flow of Phan-Thien-Tanner fluids at high zeta potentials: an exact analytical solution. Phys. Fluids 30 (1-10), 062001. doi:10.1063/1.5033974
Siddiqui, S. U., Verma, N. K., Mishra, S., and Gupta, R. S. (2009). Mathematical modelling of pulsatile flow of Casson’s fluid in arterial stenosis. Appl. Math. Comp. 210, 1–10. doi:10.1016/j.amc.2007.05.070
Silva, T., Jangili, S., Kumbhakar, B., and Kumar Mondal, P. (2022). Unsteady electromagnetohydrodynamic flow of couples stress fluid through a microchannel: a theoretical analysis. Eur. J. Mech.B/Fluids (95), 83–93. doi:10.1016/j.euromechflu.2022.04.007
Silva, T., Kumbhakar, B., Jangili, S., and Kumar Mondal, P. (2020). Unsteady electro-osmotic flow of couple stress fluid in a rotating microchannel: an analytical solution. Phys. Fluids 32 (1-12), 102013. doi:10.1063/5.0023747
Sousa, P. C., Pinho, F. T., Alves, M. A., and Oliveira, M. S. N. (2016). A review of hemorheology: measuring techniques and recent advances. Korea-Aust Rheol. J. 28, 1–22. doi:10.1007/s13367-016-0001-z
Stone, H. A., Stroock, A. D., and Ajdari, A. (2004). Engineering flows in small devices: microfluidics toward a Lab-on-a-Chip. Annu. Rev. Fluid Mech. 36, 381–411. doi:10.1146/annurev.fluid.36.050802.122124
Sun, Y., Liu, M., Xiao, Y., and Chen, Y. (2022). A novel molecular communication inspired detection method for the evolution of atherosclerosis. Com. Meth. Pro. Bio. 219, 106756. doi:10.1016/j.cmpb.2022.106756
Teodoro, C., Arcos, J., Bautista, O., and Mendez, F. (2024). Electro-poroelastohydrodynamics of the endothelial glycocalyx layer and streaming potential in wavy-wall microvessels. Phys. Rev. Fluids 9, 013101. doi:10.1103/PhysRevFluids.9.013101
Teodoro, C., Bautista, O., Méndez, F., and Arcos, J. (2023). Mixed electroosmotic/pressure-driven flow for a generalized Phan-Thien-Tanner fluid in a microchannel with nonlinear Navier slip at the wall. Eur. Mech/B Fluids 159, 70–77. doi:10.1016/j.euromechflu.2022.09.006
Tiwari, A., and Chauhan, S. S. (2019). Effect of varying viscosity on two-fluid model of pulsatile blood flow through porous blood vessels: a comparative study. Microvasc. Res. 123, 99–110. doi:10.1016/j.mvr.2019.01.003
Torres Rojas, A. M., Pagonabarraga, I., and Corvera Poiré, E. (2017). Resonances of Newtonian fluids in elastomeric microtubes. Phys. Fluids 29, 122003. doi:10.1063/1.5001061
Vargas, C., Bautista, O., and Méndez, F. (2019). Effect of temperature-dependent properties on electroosmotic mobility at arbitrary zeta potentials. Appl. Math. Model 68, 616–628. doi:10.1016/j.apm.2018.11.050
Glossary
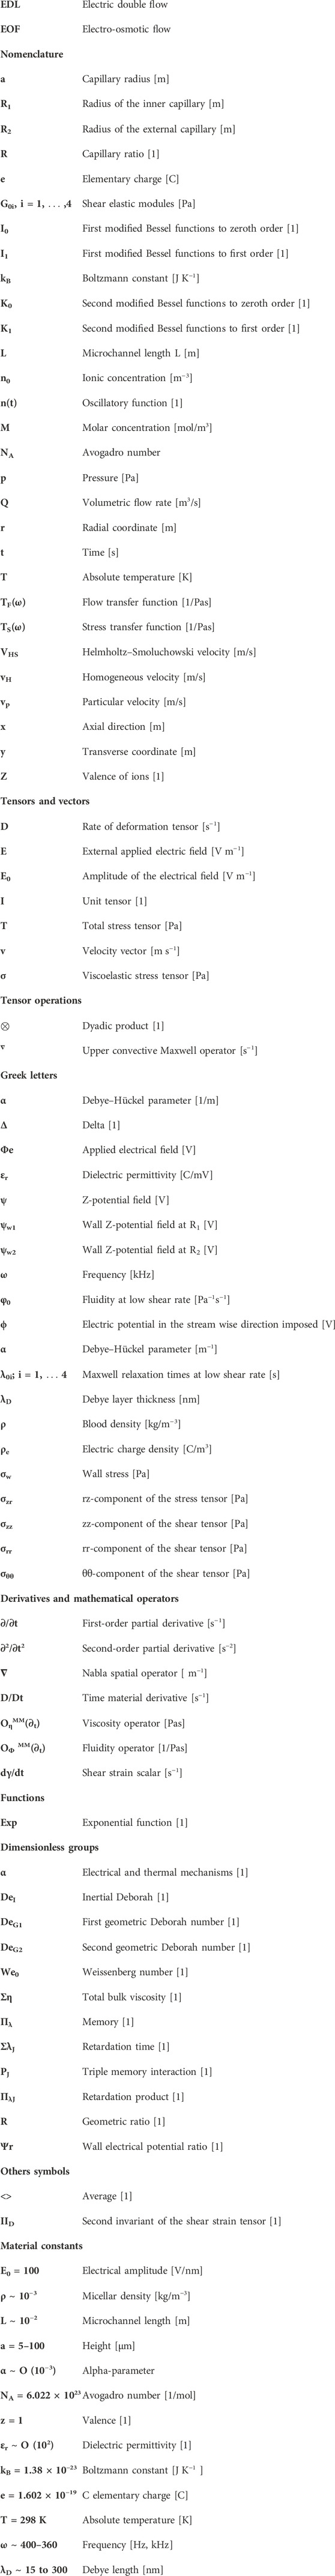
Keywords: rheology, human blood with cholesterol, transport phenomena analysis, electro-osmotic flow, mathematical modeling
Citation: Herrera-Valencia EE, Ramírez-Torres LA, Soriano-Correa C, Sánchez-Villavicencio ML, Bautista O, Hernández-Abad VJ and Calderas F (2024) Effects of multiple relaxation times in the annular flow of pulsatile electro-osmotic flow of a complex biological fluid: blood with low and high cholesterol. Front. Soft Matter 4:1385512. doi: 10.3389/frsfm.2024.1385512
Received: 13 February 2024; Accepted: 27 May 2024;
Published: 17 June 2024.
Edited by:
Tommy Nylander, Lund University, SwedenReviewed by:
Aditya Bandopadhyay, Indian Institute of Technology Kharagpur, IndiaPranab K. Mondal, Indian Institute of Technology Guwahati, India
Copyright © 2024 Herrera-Valencia, Ramírez-Torres, Soriano-Correa, Sánchez-Villavicencio, Bautista, Hernández-Abad and Calderas. This is an open-access article distributed under the terms of the Creative Commons Attribution License (CC BY). The use, distribution or reproduction in other forums is permitted, provided the original author(s) and the copyright owner(s) are credited and that the original publication in this journal is cited, in accordance with accepted academic practice. No use, distribution or reproduction is permitted which does not comply with these terms.
*Correspondence: Edtson Emilio Herrera-Valencia, ZWR0c29uaHZAY29tdW5pZGFkLnVuYW0ubXg=; Fausto Calderas, ZmF1c3RvY2dAdW5hbS5teA==