 Gaia Gleratti
 Victor Martinez-Vicente
 Elizabeth C. Atwood
 Stefan G. H. Simis
 Thomas Jackson
- 1School of Marine Science and Engineering, University of Plymouth, Plymouth, United Kingdom
- 2Now at A-2-Sea Solutions Ltd., Romsey, United Kingdom
- 3Plymouth Marine Laboratory, Plymouth, United Kingdom
- 4European Organisation for the Exploitation of Meteorological Satellites (EUMETSAT), Darmstadt, Germany
Estuarine and coastal transitional waters present a challenge for the interpretation of radiometric remote sensing. Neighbouring water masses have strongly contrasting optical properties at small spatial scales. Adjacency of land adds optical contaminations (adjacency effect) and further complicates satellite use in near-shore waters. In these areas, the lack of in situ observations has been the bottleneck for the characterisation of the uncertainty of satellite products. Radiometric underway measurements (e.g., ferries, ships of opportunity, autonomous vehicles) produce large volumes of in situ observations that can be used for radiometric validation. In this study, we evaluate the performance of the POLYMER atmospheric correction algorithm for the Ocean and Land Colour Instrument (OLCI) onboard Sentinel-3 (S3) for the retrieval of remote sensing reflectance Rrs(λ) in the transitional waters of Plymouth, United Kingdom using hyperspectral radiometric underway measurements. We explored the effect of the selection of time window, averaged areas around the in situ measurement and quality control flags into the matchup procedure. We selected matchups only within 1 pixel and ±30 min of the satellite overpass. Accuracy (RMSD) decreased spectrally from blue to red wavelengths (from 0.0015 to 0.00025 sr−1) and bias (Median Percentage Difference) was mostly positive (up to more than 100%) in relation to in situ observations. We segregated the dataset with respect to optical water types and distance to shore. Although no statistically significant difference was observed among those factors on the measures of performance for the reflectance retrieval, RMSD was the most sensitive metric. Our study highlights the potential to use OLCI full resolution imagery in nearshore areas and the need for more in situ data to be collected in the more turbid waters.
1 Introduction
Spaceborne data collection offers a cost-effective solution to global scale monitoring to complement in situ efforts. Ocean colour remote sensing using coarse and medium resolution optical sensors is especially relevant for monitoring water quality. Water quality indicators (i.e., chlorophyll-a, suspended particulate matter, coloured dissolved organic matter) derived from satellite remote sensing reflectance (Rrs) are used to monitor changes in the coastal zone. Some of these indicators are used for enabling the monitoring of compliance with international agreements (e.g., OSPAR) and would benefit from the daily revisit times of imaging spectrometers such as OLCI on Sentinel-3.
Despite improvements in the spectral, temporal, and spatial resolutions of optical sensors over time, environmental variability poses challenges in the interpretation of the remote sensing signal when studying the aquatic environment, particularly close to the shore (Hieronymi et al., 2017). Accurate atmospheric correction remains an essential component towards reliable remote sensing of ocean colour since 80%–90% of the measured signal comes from the atmosphere, primarily caused by molecular and aerosol scattering (IOCCG, 2010). Other factors such as Sun glint and whitecaps pose further challenge to remote sensing of ocean colour, and in coastal waters, the adjacency of land also needs to be considered (Bulgarelli and Zibordi, 2018; Warren et al., 2019; Vanhellemont and Ruddick, 2021). These effects represent the bulk of estimated ocean colour product uncertainty, while optical complexity of the water column is non-negligible (Mélin and Vantrepotte, 2015; Spyrakos et al., 2018). Optically active constituents such as phytoplankton, phytodetritus, colour dissolved organic matter (CDOM) and suspended sediments contribute to the bulk optical properties. Optical water types, each one representing the different contributions of the optically active constituents (Moore et al., 2001; Jackson et al., 2017; Spyrakos et al., 2018), may provide an avenue to disentangle the effects of in-water optical complexity from the artefacts produced by contamination outside the water (i.e., adjacency of land, complex changes in aerosols) in satellite ocean colour products near the coasts (Pahlevan et al., 2021).
To assess the reliability of remotely sensed products over gradients of optical diversity, validation of the atmospherically corrected signal with concurrent field measurements is usually done. Although a great effort has been put into estimating uncertainty of ocean colour products, validation is still limited by the scarcity of validation data. Consequently, taking advantage of automated platforms will help to increase the amount of field observations (Zibordi et al., 2006; Simis and Olsson, 2013; Vansteenwegen et al., 2019; Goyens et al., 2022).
Past research has successfully exploited the Aerosol Robotic Network-Ocean Colour (AERONET-OC) dataset to validate ocean colour products in offshore waters (Zibordi et al., 2006; Mélin et al., 2016). From a combination of automatic and cruise measurements, the uncertainty in Rrs mainly in the open ocean has been estimated per optical water type (Moore et al., 2015). More work is required in specific areas, particularly optically complex coastal waters, where uncertainties in blue and red bands are still in the order of 10%–20% (Moore et al., 2015). Over lakes, rivers, and coastal waters, a similar exercise has been conducted to assess atmospheric correction methods for Landsat-8, MODIS-Aqua, VIIRS, Sentinel-2 and Sentinel-3 using AERONET-OC data (Liu et al., 2021; Pahlevan et al., 2021; Tilstone et al., 2022; Arena et al., 2024). Several recent studies have concentrated efforts on the Sentinel-3 OLCI in a range of optically complex water bodies through ground station and shipborne data, including turbid waters such as the Eastern English Channel (Mograne et al., 2019; Vanhellemont and Ruddick, 2021) and British Columbia (Giannini et al., 2021), or CDOM-dominated waters like the Baltic Sea (Alikas et al., 2020). Compared to phytoplankton-dominated waters where atmospheric correction uncertainties are highest in the blue-green bands, documented uncertainty from remote sensing reflectance (Rrs) measurements in optically complex waters is particularly high in the red and near-infrared (NIR; Morel and Prieur, 1977).
High uncertainty in the red and near-infrared documented in optically complex waters can be explained by the adjacent land as it is the spectral region where the contrast between land and water is the highest, with water efficiently absorbing light whilst land is highly reflective (Bulgarelli and Zibordi, 2018). The adjacency effect has been shown to be a significant issue at distances of up to 25 km for SeaWiFS and 30 km for MODIS observations in the Northern Adriatic Sea. When considering mid-latitude coastal regions, it is expected to be more pronounced in summer months, for off-nadir views, for observations from over the land and for a lower aerosol optical thickness (Bulgarelli et al., 2014). Whilst the effect is strong in the NIR (865 nm) due to significant differences between the respective reflectance of the terrestrial and the marine environments, additional uncertainty in the blue-green region (412–510 nm) originates from a difference in the angular distribution of the water-leaving radiance (Bulgarelli and Zibordi, 2018). High dependence on the reflectance of the neighbouring land has been demonstrated, further affecting its sensitivity to the viewing geometry and the optical water type. Whilst it tends to be a serious concern for inland water bodies, it also poses a significant challenge to nearshore coastal environments (Warren et al., 2019). In addition, unlike clear oceanic waters, no assumption can be made about total absorbance of seawater in the NIR in these waters (Ruddick et al., 2000; Goyens et al., 2013). In order to reduce these uncertainties in near coastal waters, in situ observations automated systems from vessels have been recently deployed (Martinez-Vicente et al., 2013; Giannini et al., 2021; Wang and Costa, 2022).
Despite all these difficulties, it is important to persevere on efforts to quantify uncertainty in Rrs in coastal waters on medium resolution satellite radiometers as their daily revisit times allow for monitoring of coastal processes in SPM flows that could be linked to novel pollutants (Sullivan et al., 2023), as well as to extend the climate quality datasets to coastal waters such as the Ocean Colour Climate Change initiative (Sathyendranath et al., 2019) and develop further products to support biodiversity monitoring.
The present study aims to quantify the uncertainty in Rrs satellite data in the optically complex waters surrounding the Tamar Estuary, Plymouth (Western English Channel) and identify its potential sources in the context of optimising ocean colour products in optically complex waters. The focus is on the role of optical water types and distance from land on the discrepancies between satellite and in situ Rrs. This is achieved by comparing shipborne and remotely sensed reflectance from Sentinel-3 OLCI at full resolution (300 m).
2 Materials and methods
2.1 Study area
The coastal waters surrounding Plymouth (United Kingdom) are located on the North Western European Continental Shelf, a dynamic environment heavily influenced by freshwater, tidal and marine currents (Figure 1). The tidal cycle of the estuary governs hydrodynamic processes in the area (Siddorn et al., 2007). In combination with biological seasonality, these influence the dynamics of the optically active constituents (total suspended matter concentration, TSM; coloured dissolved organic matter, CDOM and phytoplankton chlorophyll concentration, Chla; Doxaran et al., 2006). Offshore, in coastal waters around station L4 (water column depth 55 m, Figure 1), optically active constituents are mostly influenced by biological seasonality and river outflows. Phytoplankton dominates during spring/summer bloom events and TSM (mainly made of inorganic particles) and/or CDOM in winter (Groom et al., 2009; Martinez-Vicente et al., 2010). Low concentrations of optically active constituents are present in the area, with concentrations of chlorophyll-a around 1.5 mg m−3, reaching 4 mg m−3 during spring bloom at L4 station and TSM concentrations generally around 1 g m−3, reaching 9.94 g m−3 in winter months (Martinez-Vicente et al., 2010).
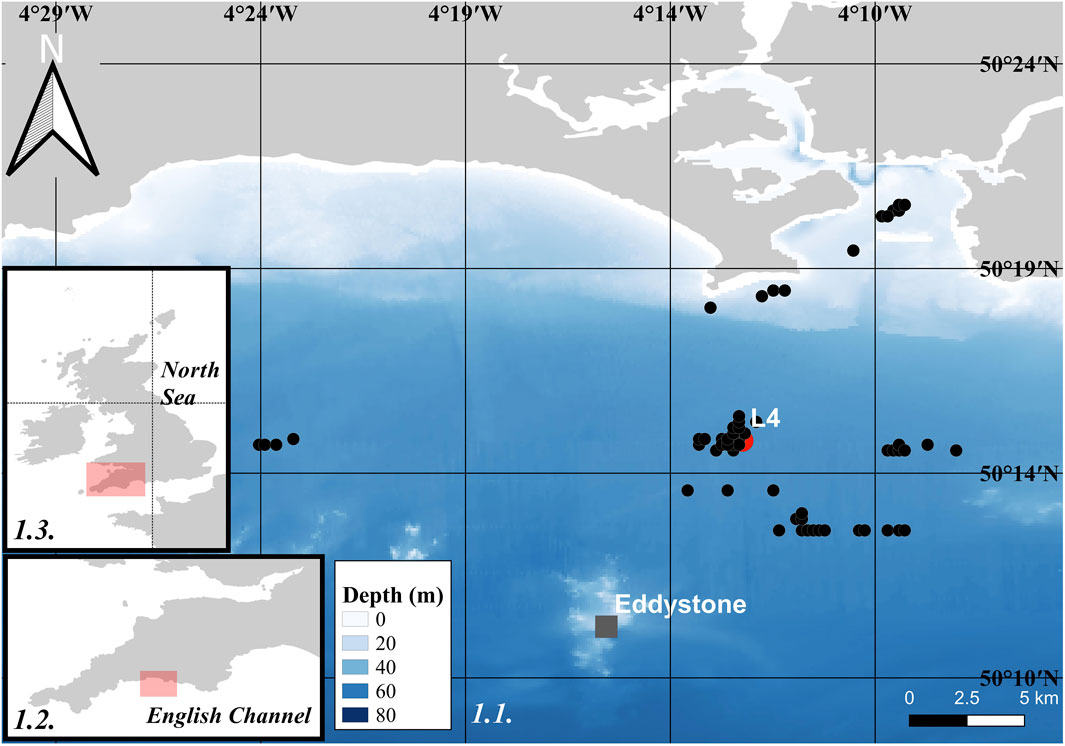
Figure 1. Location of the matchup data points from the coastal waters surrounding Plymouth (1.1.), in the Western English Channel (1.2.) in the South West of the United Kingdom (1.3.). The colour scheme represents the local bathymetry.
2.2 Earth observation data
Ocean and Land Colour Instrument (OLCI) data were acquired for the period between December 2016 and March 2021. The data evaluated in this study are the fully normalised water-leaving reflectance (ρw) full resolution (300 m × 300 m) for 15 selected bands: 400, 412, 443, 490, 510, 560, 620, 665, 674, 681, 709, 754, 779, 865 and 885 nm. For comparison to field measurements, these were then transformed to remote sensing reflectance (Rrs) by dividing by π.
The processing stages included atmospheric correction using the POLYMER v4.15 algorithm and the IDEPIX mask generation. The POLYMER atmospheric correction algorithm was originally developed for MERIS open water products to remove Sun glint (Steinmetz et al., 2011), using a BRDF correction from Park and Ruddick (2005) and selected because of its high performance for Sentinel product (Mograne et al., 2019; Giannini et al., 2021). IDEPIX (Identification of Pixel properties, in SNAP 8) masking is used to remove land, cloud and spurious data points with high uncertainty. The processing chain follows that developed in Warren et al., 2019.
For the creation of a set of optical water types (OWTs), a spatial/temporal subset of the processed satellite data acted as a training dataset to represent the observed variability in the reflectance spectra in the region of interest (Jackson et al., 2017). The optical water type classification first involved the standardisation of the output products by subtracting the mean and dividing by the standard deviation for each band. Principal component analysis was then performed on the standardised data whereby the resulting principal components were used in the cluster analysis to classify the coastal waters into OWTs. The cluster analysis consisted of a fuzzy c-means clustering procedure using a cluster validity function to generate clusters (Xie and Beni, 1991; Moore et al., 2001). The clustering approach resulted in 6 OWTs in the study area (Figure 2). Memberships to all OWT classes were calculated for every satellite data matchup and assigned a dominant OWT class based on highest membership value. The in situ spectra associated with that satellite matchup pixel were assigned the same OWT class.
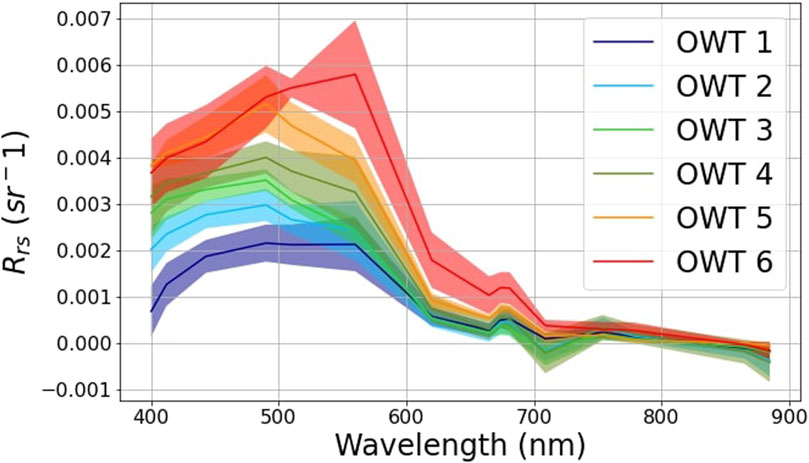
Figure 2. The reflectance (Rrs) means and standard deviation of the six optical water types represented in the selected transitional waters of Plymouth, Southwest, United Kingdom. The means were calculated from the training dataset spanning 2016 to 2021.
2.3 In situ observation data: collection, processing and quality control
During field campaigns in 2017, 2018 and 2020, above-water radiometric measurements were collected with the unsupervised Hyperspectral Sur-face Acquisition System (HSAS, SeaBird Inc.). The sky and water leaving radiance measurements were acquired from the bow of R/V Plymouth Quest at about 5 m above the water surface, whilst out at sea. R/V Plymouth Quest is a 21.5 m length scientific vessel that has been used in previous works (Martinez-Vicente et al., 2013; Jordan et al., 2023). The downward looking radiometer has a field of view of 6°, which corresponds to about 0.6 m at the sea surface. The downwelling irradiance sensor was located at the top of the wheelhouse, on the extreme side of the top of a T shaped mast, away from any superstructure. The sensors and the setup provide accuracy similar to other sensors and approaches (Tilstone et al., 2020). The system continuously recorded downwelling irradiance (Ed), sky radiance (Ls) and water leaving radiance (Lt) at 169 wavelengths with 3.3 nm spectral resolution between 340.0 and 897.7 nm. The scanning frequency was between 4 and 0.5 Hz, depending on the sensor optics. The optical data were converted to physical units and processed to Level3a using the manufacturer’s software (Prosoft v7.7.16) which merged the data to 1 Hz. Rrs was inferred following: Rrs(λ) = Lw+(λ)/Ed(λ) where Lw+(λ) = Lt(λ)–ρs Ls(λ) with Lw+ the water leaving radiance above the surface and ρs the surface reflectance factor (Martinez-Vicente et al., 2013). At the normal speed of R/V Plymouth Quest, the average number of Rrs spectra data per OLCI FR pixel (300 m) is 150. The spatial structure of reflectance dataset collected underway from R/V Plymouth Quest is discussed in detail in Jordan et al. (2023). Sensors were factory calibrated every year.
The data were then processed following the fingerprint approach (Simis and Olsson, 2013; QC0 in Table 1) to resolve ρs for each observation. Following the procedure, data flagged as valid were retained and filtered according to published recommendations. Quality control was done using characteristics of the spectral shape (Simis and Olsson, 2013; Qin et al., 2017; IOCCG, 2019; Warren et al., 2019). Quality control consisted of removing spectra affected by significantly negative values (QC1 in Table 1; Qin et al., 2017), removing spectra affected by Sun glint and whitecaps (QC2 and QC3 in Table 1; Qin et al., 2017; IOCCG, 2019), removing the effect of the oxygen absorption feature from the instrument calibration (QC4 in Table 1; Qin et al., 2017). It also consisted of accurately selecting spectra representative of the study area where dominance of mineral particles compared to coloured dissolved organic matter can be found (QC5 in Table 1; Qin et al., 2017; Warren et al., 2019). By applying those successive gating criteria, the number of observations was reduced from 174,396 to 9,065 (Table 1).
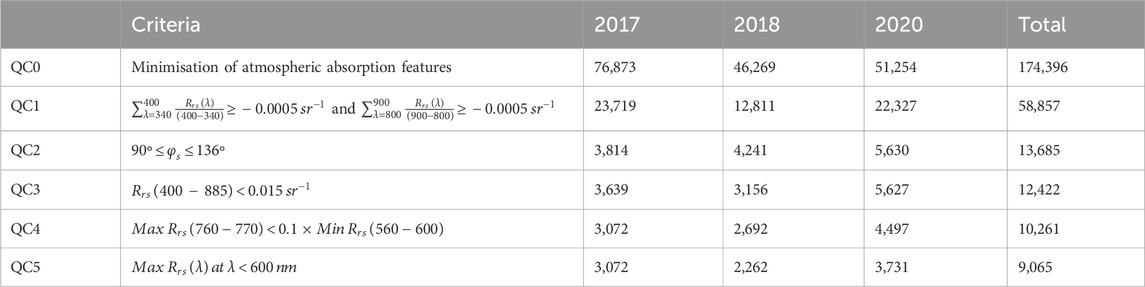
Table 1. Summary of in situ data filtering criteria with the number (N) of retained spectra per year.
In situ spectra that passed the filtering criteria were convolved to the spectral response functions of the OLCI, instrument on Sentinel-3A.
The distance to land (including smaller features such as islands and breakwaters) for each in situ measurement was computed using the great-circle distance (Distance to Nearest Hub tool in QGIS). All data points were within 15 km of land. These were grouped into three categories (namely, 0–5 km, 5–10 km, and 10–15 km), and used to investigate the effect of land adjacency on the satellite data quality as described in Section 2.5.
2.4 Extraction and matchup routine
The selection of spatial and temporal windows has been documented to potentially affect validation performance statistics (Concha et al., 2021). Therefore, different matchup selection routines were explored in this study. Two temporal windows (±30 min and ±3 h) and two spatial windows (1 pixel and 3 × 3 pixels) were considered (Table 2). In the case of the 3 × 3 pixel area, only matchups yielding a minimum of six pixels and a coefficient of variation <0.15 were retained (Brewin et al., 2016; Bailey and Werdell, 2006). The mean in situ spectra were then used to reduce the satellite data to unique validation points for comparison purposes. A detailed study on the variability within different spatial windows is not the subject of this paper and has been explored elsewhere (Nasiha et al., 2022; Jordan et al., 2023).
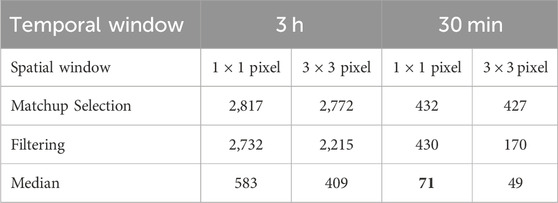
Table 2. Number of in situ spectra retained after distinct matchup selection criteria, with different spatial and temporal windows considered. Bold writing shows the number of in situ spectra used in the main analysis and discussion of this study.
The satellite matchup data points were filtered (as shown in ‘Filtering’ step in Table 2) for significantly negative values (<
For very dynamic waters or stations close to the coast, EUMETSAT (2021) states that reduction of the matchup time window to 1 hour and the spatial window to 1 pixel is acceptable. Thus, given the spatiotemporal variability in the study area, the ±30 min and 1 × 1 pixel matchup selection routine was selected. The resulting matchup in situ spectra span across 19 sampling dates, covering a transect of approximately 12 km (Respective in situ spectra retained: 0–5 km: N = 11, 5–10 km: N = 38, 10–15 km, N = 22) and spanning six optical water types. The environmental conditions for those sampling dates were clear to slightly overcast skies for all days other than 14th July 2020 showing hazy skies. Most matchups occurred in OWTs 1 and 3 with N = 23 and N = 18, respectively.
From the initial 174,396 reflectance spectra collected, 430 were preserved, and converted to 71 median spectra that were then used for the statistical matchup, coming from a temporal window of 30 min and a spatial window of 1 × 1 pixel.
2.5 Matchup metrics
A set of performance metrics was then calculated to describe the difference between the OLCI and in situ data. Root Mean Square Difference (RMSD), Median Absolute Percentage Difference (MdAPD) and Median Percentage Difference (MdPD) were computed to quantify the accuracy, dispersion and bias of the data, respectively, with x the in situ data, y the satellite data and N the number of matchups 1–3:
These metrics were chosen since they are most common in validation exercises within the Ocean Colour Radiometry community (Concha et al., 2021). In addition, the distribution of the datasets was investigated.
Data were then segregated by distance to land and by optical water types. Performance metrics were then calculated for subsets depending on the OWT and distance from land. Following a Levene’s test for heterogeneity of variance and Shapiro-Wilk test for normality of distribution, non-parametric tests were used. Mann-Whitney tests were carried out to test for statistically significant differences. A permutational analysis of variance (PERMANOVA) with 1,000 permutations based on Euclidian distances was conducted to test for differences in the performance metrics between the distinct OWTs and distance from land.
A comparison of performance metrics between the various matchup selection routines can be found in Section 3.1. Results and discussion are, however, mainly focused on the matchups with a temporal window of 30 min and a spatial window of 1 × 1 pixel, on all data and on data segregated by OWT dominance and distances to the shore. Scatterplots, histograms and descriptive statistics for the other spatial and temporal match up windows explored (as described in Section 2.4) are provided in Supplementary Materials S2–S4.
3 Results
3.1 Discrepancies between satellite and in situ data across various matchup selection routines
First, satellite and in situ data were compared using various matchup selection criteria using distinct temporal and spatial windows. The respective performance metrics were calculated across the spectrum and for each spectral band, and further displayed in Figure 3.
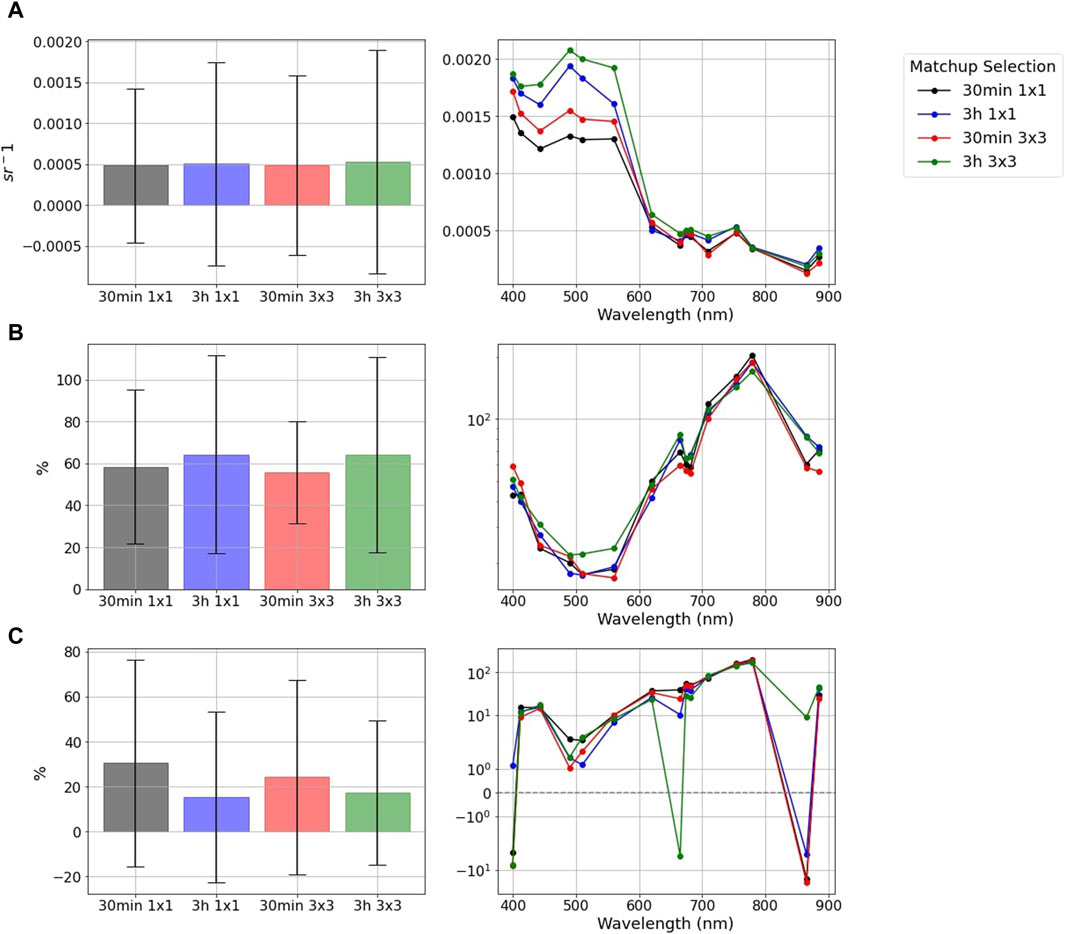
Figure 3. Performance metrics for the respective matchup selection routines averaged over the electromagnetic spectrum and represented spectrally for the selected wavelengths. (A) Root Mean Square Difference (RMSD), (B) Median Absolute Percentage Difference (MdAPD), (C) Median Percentage Difference (MdPD). The plots of MdAPD and MdPD are shown on a log scale due to the large variation between wavelengths.
The spectral distribution in the RMSD was similar across data from all matchup selection routines with a peak at 490 nm with an overall decrease with a smaller temporal and spatial window, going from 0.0021 sr−1 with a ±3 h and 3 × 3 pixel window to 0.0013 sr−1 with a ±30 min and 1 × 1 pixel window (Figure 3A). Similarly, the spectral distribution of the MdAPD was consistent across all data with a higher median value of 64% for the matchup data selected within a 3-h window (Figure 3B). On the other hand, the highest median MdPD value could be observed for the most stringent dataset (±30 min 1 × 1 pixel selection window) with a peak of 200% depicted at 779 nm (Figure 3C).
3.2 Discrepancies between satellite and in situ data for the dataset as a whole
Next, the most stringent matchup selection criteria (±30 min and 1 pixel) were delved into further. Overall, when comparing the satellite reflectance estimates with in situ measurements, small differences were observed, yet a positive bias could be seen over most of the spectral range. To illustrate any discrepancies between satellite and in situ Rrs for the whole matchup dataset (N = 71), scatter plots and histograms for each of the S3-OLCI bands are shown in Figures 4, 5. The distribution of the data can further be observed in relation to optical water types and distance to land as depicted in Figure 4. Performance metrics were then calculated for each spectral band (Table 3; Figure 6).
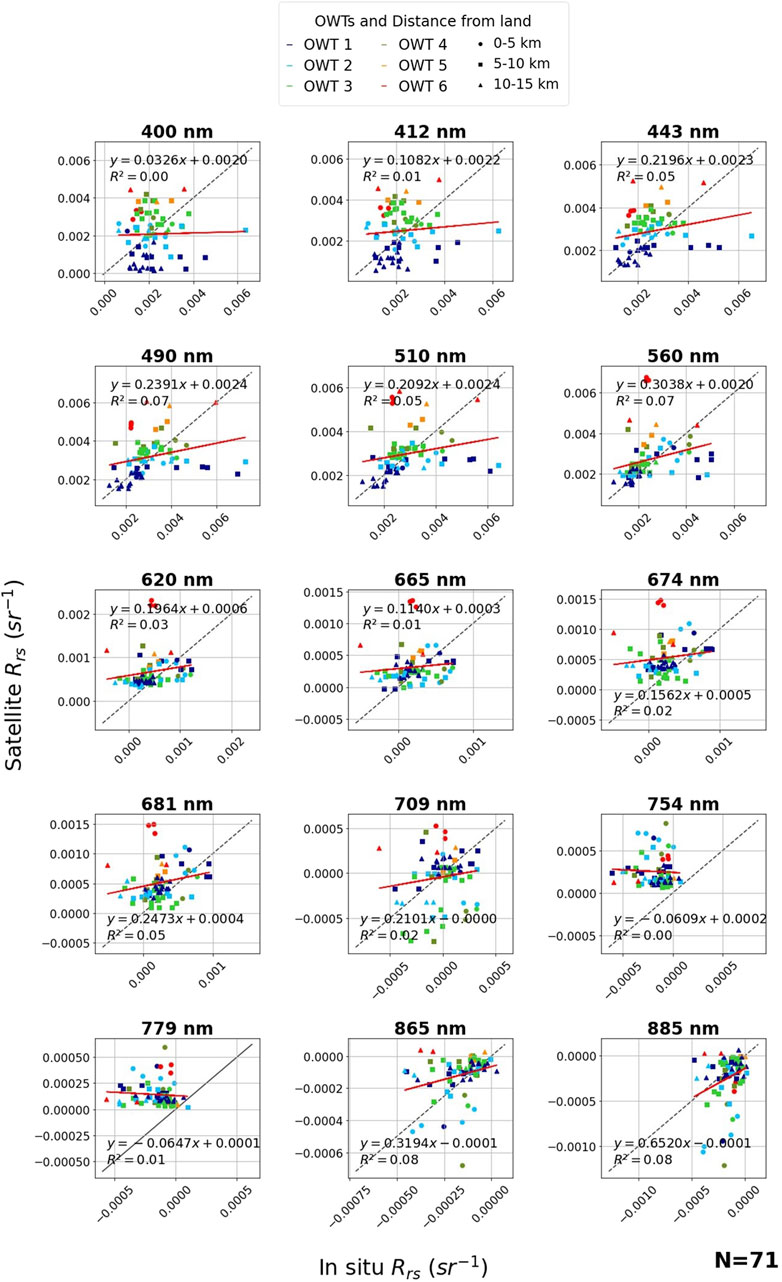
Figure 4. Per-band scatter plots. The dotted line represents the 1:1 ratio line. The red line represents the line of best fit between the satellite and in situ Rrs, with the regression equation and coefficient of determination (R2) noted in the plot. Details of the respective optical water types (OWTs) and distance to land have been included. Temporal window of 30 min and spatial window of 1 × 1 pixel (300 × 300 m).
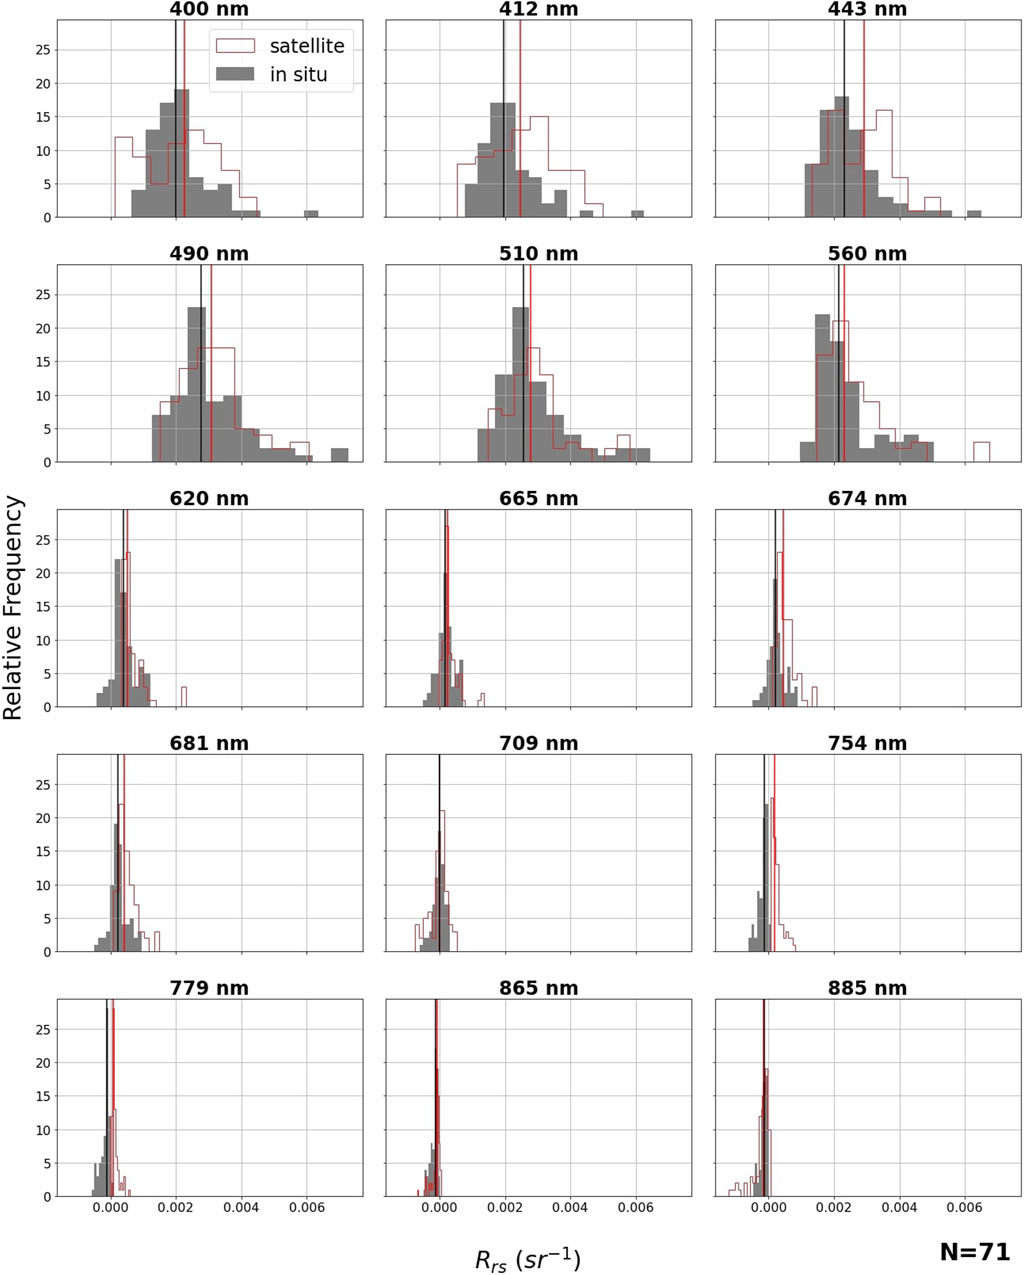
Figure 5. Relative frequency distribution of Rrs of the in situ data (grey bars) compared with Sentinel-3 OLCI data (red outline bars). Asterisks refer to statistically significant differences between the datasets (Mann-Whitney test, N = 71, p < 0.01). Median for each distribution is indicated by the solid line, grey for the in situ dataset, red for the satellite dataset. Temporal window of 30 min and spatial window of 1 × 1 pixel (300 × 300 m).
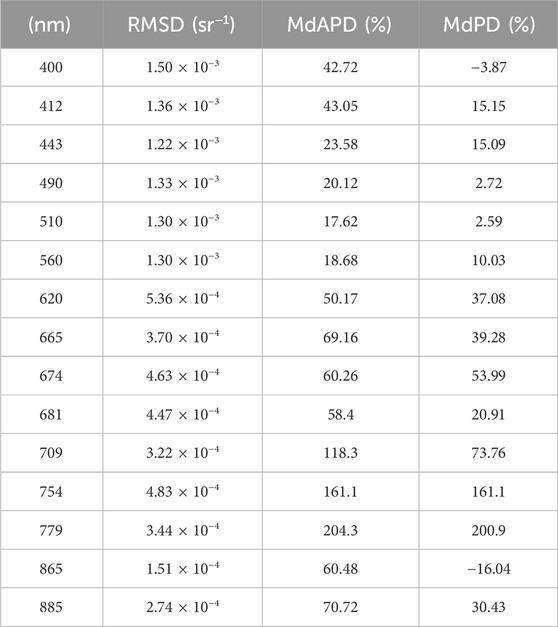
Table 3. Performance metrics over the electromagnetic spectrum: Root Mean Square Difference (RMSD), Median Absolute Percentage Difference (MdAPD), Median Percentage Difference (MdPD).
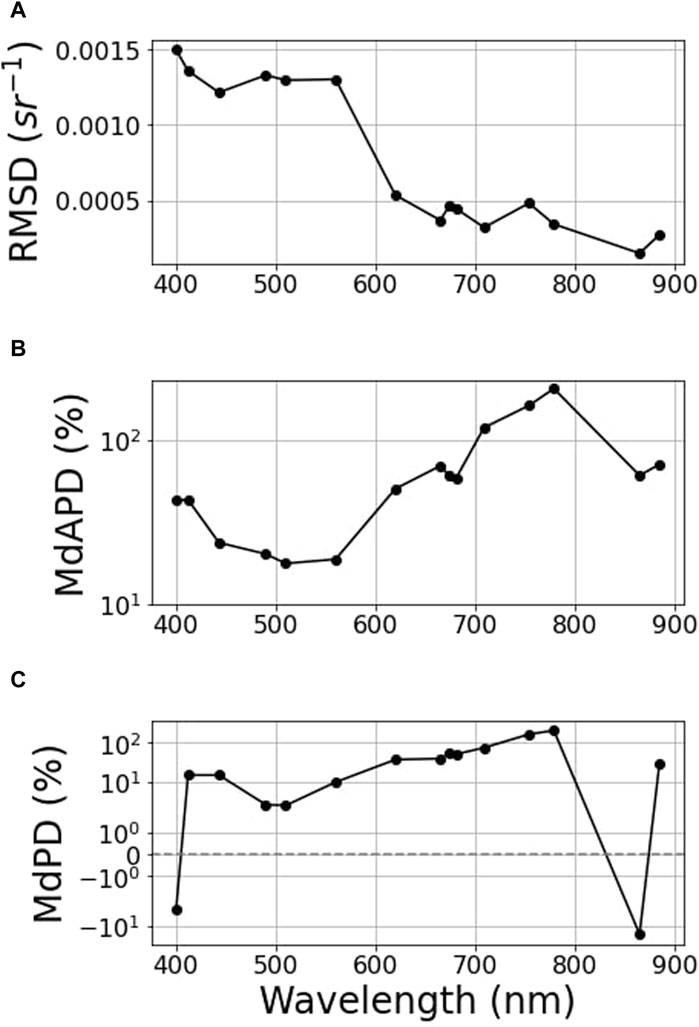
Figure 6. Performance metrics for different wavelengths: (A) Root Mean Square Difference (RMSD), (B) Median Absolute Percentage Difference (MdAPD), (C) Median Percentage Difference (MdPD). The plots of MdAPD and MdPD are shown on a log scale. Number of matchups (N) N = 71.
In general, there was a large scatter across the wavelengths, but a positive slope of the regression between satellite and in situ Rrs can be seen for all wavelengths but 754 nm and 779 nm (Figure 4). A positive bias of the satellite estimates can be observed in relation to in situ measurements for most wavelengths, except in the range from 490 to 560 nm, Figure 4. It is, however, essential to notice that the R2 values depicted are very small (≤0.08, Figure 4). It is also worth noticing, that when looking at the distribution of the data points in relation to optical water types, measurements in waters dominated by OWT 6 were particularly out of range (Figure 4).
As the range of observations is limited, another way to visualise the data is by means of histograms. The histograms show a maximum range of 0.007 sr−1 at 490 nm (Figure 5). Figure 5 shows the non-normal distribution of Rrs at most wavebands (Shapiro-Wilk normality test, p < 0.05, N = 71) except 412 nm (W = 0.98, p = 0.25) and 443 nm (W = 0.97, p = 0.11) in the satellite dataset and 665 nm (W = 0.98, p = 0.21) and 674 nm (W = 0.97, p = 0.08) in the in situ dataset. The data also showed overall positive skewness, particularly for the satellite dataset where outliers were present in three of the bands, namely, 560, 620 and 665 nm.
Testing for the differences between performance metrics, statistically, we found that significant differences between the median Rrs were shown for some of the bands (Mann-Whitney test, p < 0.05, N = 71) where there was a general shift towards higher reflectance values in the satellite dataset as suggested by the bias metric (Figure 6). This was clear at 674 nm, 681 nm, 754 nm and 779 nm where the median satellite reflectance values were at least double the in situ measurements (e.g., Median Rrs_ satellite (674) = 4.57 × 10⁻⁴ sr−1 vs. Median Rrs_ in situ (674) = 2.10 × 10⁻⁴ sr−1).
When comparing the satellite with the in situ measured reflectance, we used a set of metrics commonly used in the field. RMSD (a measure of accuracy) increased from 0.0001 to 0.001 sr−1 from the red to the blue parts of the spectrum (Figure 6A), which is small compared to the range in Rrs in the blue (i.e. 0.001 sr−1 at 490 nm; Table 3). Conversely, the MdAPD (a measure of dispersion), was lower in the green (∼30%) than in the red bands (MdAPD(779) = 204%; Table 3). This was similar to strongly negative bias at 400 nm (MdPD (400) = −4%) and 865 nm (MdPD(865) = −16%; Table 3). The rest of the wavelengths exhibited a positive bias ranging between 2.59% and 201% (Table 3). A gradual increase was observed between 510 nm and 779 nm, both in the dispersion and the bias metrics (Figures 6B, C).
Overall, this validation exercise at relatively low reflectance values in coastal waters depicted that full resolution OLCI Rrs using POLYMER produced lower accuracy and higher dispersion at shorter wavelengths than at higher wavelengths compared to underway above water Rrs. To try to disentangle the causes affecting this performance, the matchup datasets were then separated in terms of optical water types and distance to the coast.
3.3 Discrepancies between satellite and in situ data for the dataset segregated by optical water types
3.3.1 Spatial distribution of optical water types
Membership values to the optical water type clusters for the matchup Rrs spectra were calculated and spectra grouped by dominant optical water type are shown in Figure 7. All OWTs in the study area depict a peak in reflectance between 490 nm and 560 nm (Figure 7). Both OWT 1 and OWT two show a peak in Rrs at 490 nm (Rrs (490) = 0.007 sr−1; Figure 7). A seemingly good accordance between the in situ and satellite datasets can be seen for OWT 2, whilst a more defined peak can be seen in the in situ dataset for OWT 1. A peak in Rrs between 490 nm and 560 nm can be seen, once again, for OWTs 3 and 4 with, however, a smaller range of reflectances with a maximum value of 0.004–0.005 sr−1 at 490 nm (Figure 7). Despite the lack of matchup data for OWT 5, a clear peak can be observed at 490 nm whilst a defined peak at 560 nm is present for OWT 6 (Figure 7).
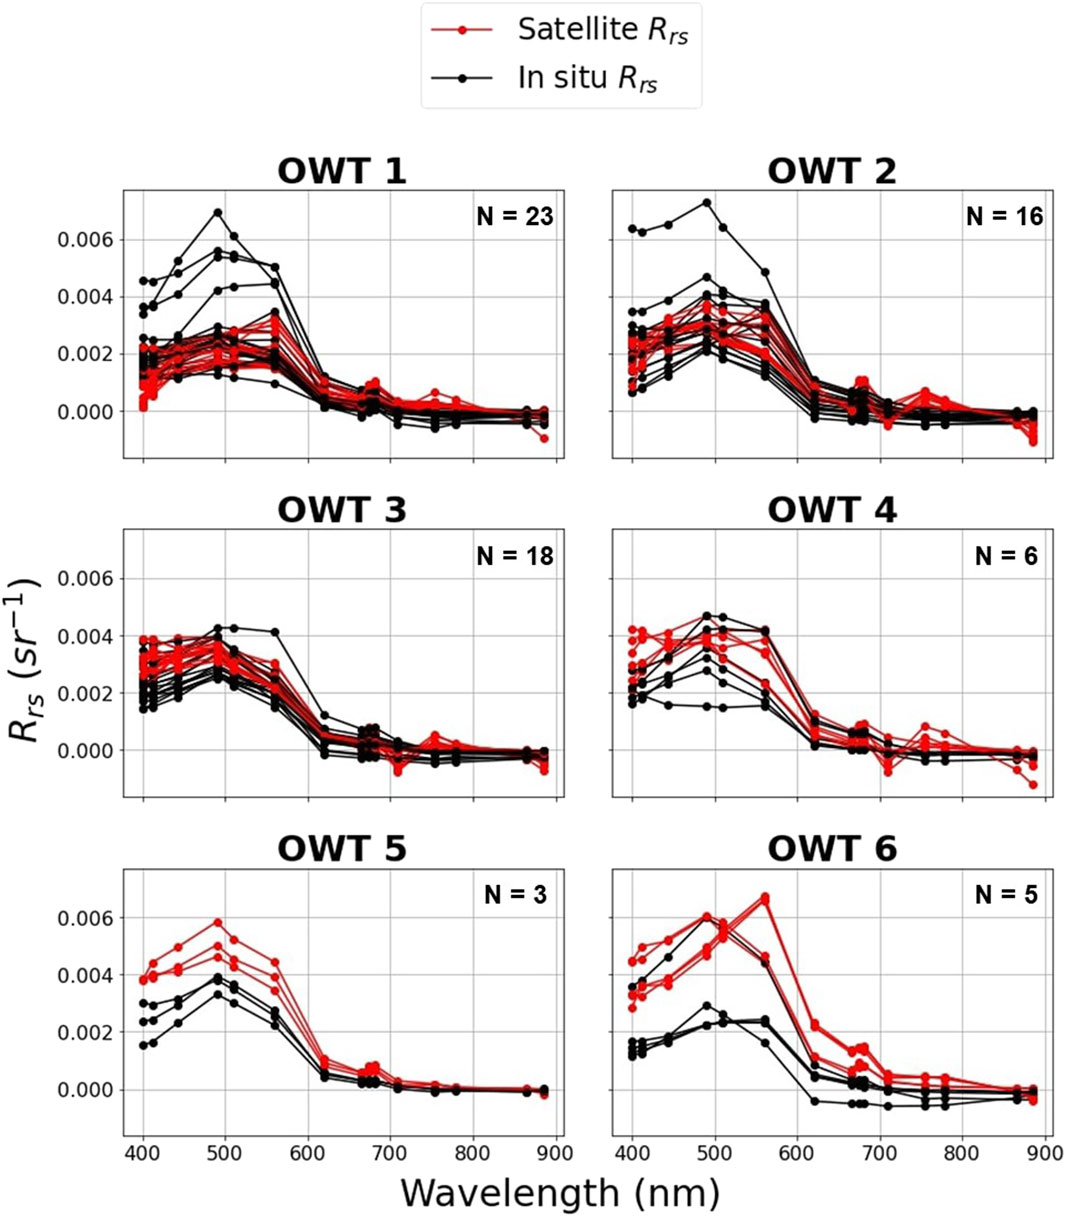
Figure 7. The reflectance (Rrs) spectra of the six optical water types represented in the selected transitional waters of Plymouth, Southwest, United Kingdom. Both satellite (red) and in situ spectra are displayed.
From the matchup dataset, the dominant OWTs found in each zone of the study area were the following: OWT 2 in 0–5 km, OWT 3 in 5–10 km and OWT 1 in 10–15 km, representing 36%, 42% and 64% of the data, respectively (Figure 8). It is also worth noticing the presence of OWTs 1 and 2 in nearshore waters (0–5 km) corresponding to two distinct days: 6th July 2017 and 26th June 2018, respectively. OWTs 5 and 6, on the other hand, were found in more offshore waters (10–15 km) corresponding to data collected on 5th April 2017 (Figure 8).
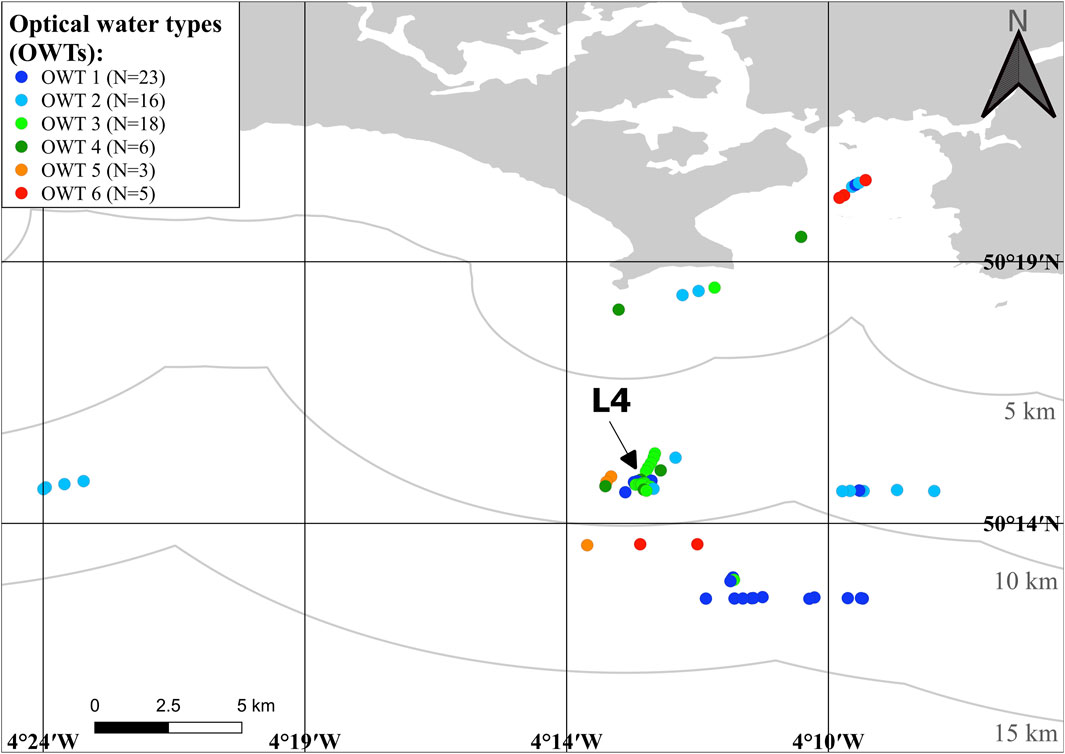
Figure 8. Location of the matchup data points from the study area with the colour scheme representing the respective optical water types (OWTs). Contour lines represent successive distance from shore (5 km, 10 km and 15 km). Location of the Western Channel Observatory station L4 is among the dots and marked with an arrow for clarity.
3.3.2 Performance metrics: dataset segregated by optical water types
The discrepancy metrics between satellite and field measurements of Rrs were investigated separating the matchups by optical water types (OWT). Although no statistically significant difference was found among the groups (PERMANOVA, F5 = 0.845, R2 = 0.063, p = 0.388), separation by the distinct OWTs was observed. Performance metrics were calculated for subsets of the matchup dataset averaged across all wavelengths (Figure 9) and on a per-wavelength basis (Figure 10). Concerning the satellite vs. in situ matchup metrics grouped by optical water types, the RMSD metric indicated higher uncertainty in the OWT 6 subset with a mean value of 0.0014 sr−1, double the RMSD for the rest of the OWTs found in the study area (Figure 9A). Spectrally, RMSD peaked at 560 nm with a value of 0.004 sr−1 (Figure 10A). The measure of dispersion per optical water type, the median MdAPD metric, was high, ranging between 60% and 91% (for OWTs 3 and 4, respectively; Figure 9B). Spectrally, peaks were present for OWTs 1-3 with a main peak at 400 nm (MdAPD = 289%) for OWT 1 followed by a second peak at 779 nm (MdAPD = 186–241%) for OWTs 1–3 (Figure 10B). OWTs 4-6 depicted a generally higher MdAPD at longer wavelengths (665–885 nm) with a peak at 865 nm (Figure 10B). Concerning the measure of bias, the MdPD metric was on average positive, ranging between 11 and 74 with a general increase from OWTs 1 towards 6 (Figure 9C). Yet, the comparison of the satellite reflectance estimates with in situ measurements revealed negative bias (negative MdPD) between 400 and 560 nm for OWT 1, only at 400 nm for OWT 2, and at 865 nm for OWTs 1, three and 6 (Figure 10C).
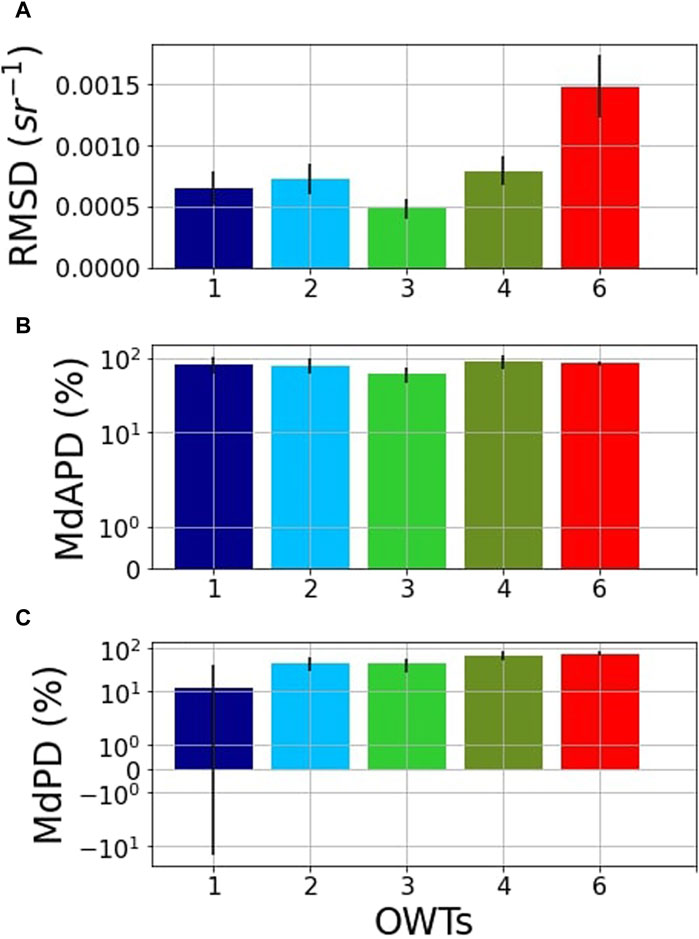
Figure 9. Spectrally averaged performance metrics per optical water types (OWTs). (A) Root Mean Square Difference (RMSD), (B) Median Absolute Percentage Difference (MdAPD), (C) Median Percentage Difference (MdPD). The plots of MdAPD and MdPD are shown on a log scale. OWT 1 N = 23, OWT 2 N = 16, OWT 3 N = 18, OWT 4 N = 6, OWT 6 N = 5. Error bars are the standard deviation.
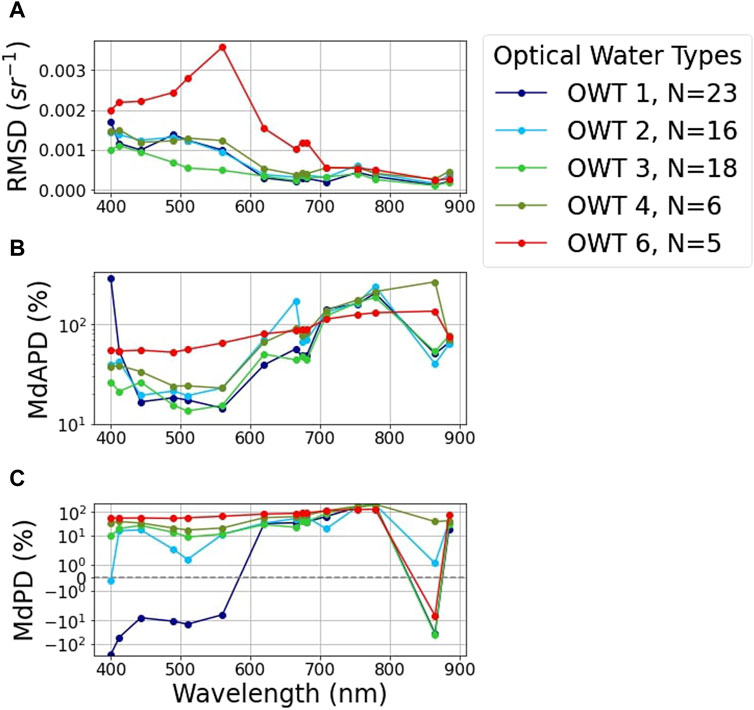
Figure 10. Spectrally resolved performance metrics for optical water types (OWTs). (A) Root Mean Square Difference (RMSD), (B) Median Absolute Percentage Difference (MdAPD), (C) Median Percentage Difference (MdPD). The plots of MdAPD and MdPD are shown on a log scale.
Overall, the dispersion measures were similar across the optical water types in this study, with the two extremes (clearest waters from OWT 1 and more turbid waters of OWT 6) being well defined spectrally. Negative bias appeared at the shorter parts of the spectrum in OWT 1, while lower accuracy (higher RMSD) was more evident in middle parts of the spectrum. On the other hand, OWTs two to 4 seemed to have similar performance statistics.
3.4 Discrepancies between satellite and in situ data for the dataset segregated by distance to land
The discrepancy metrics between satellite and field measurements of Rrs were investigated separating the matchups by their distance to land. Despite no statistically significant relationship (PERMANOVA, F2 = −0.049, R2 = −0.001, p = 0.969), the influence of varying distance from land on discrepancies was observed and summarised through performance metrics (Figure 11).
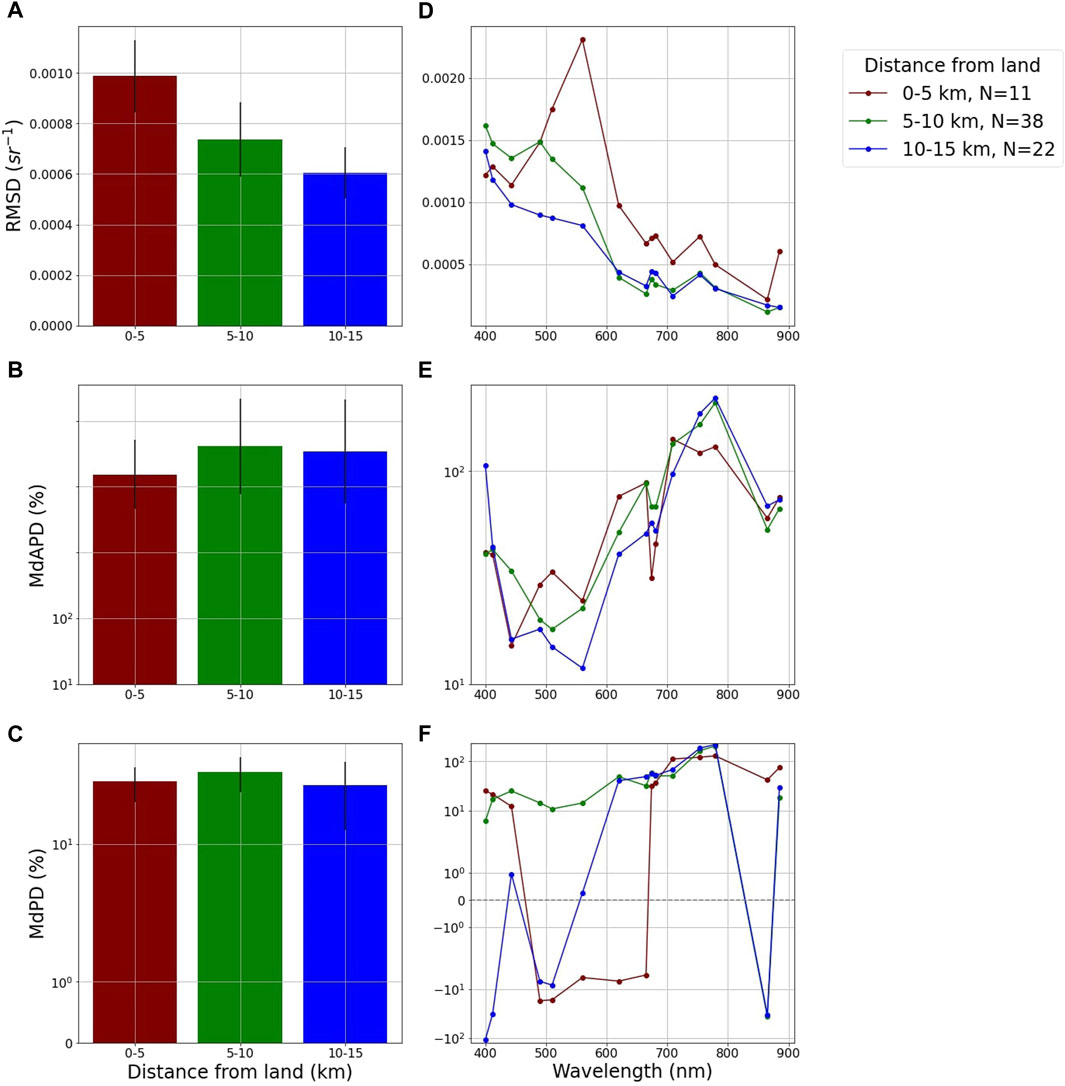
Figure 11. Spectrally averaged performance metrics with the distance from land and spectrally resolved. Averaged performance metrics in sub-figures (A–C). Per wavelength performance metrics in sub-figures (D–F). Root Mean Square Difference (RMSD), Median Absolute Percentage Difference (MdAPD), Median Percentage Difference (MdPD).
The RMSD metric had a higher mean value for measurements in the nearshore waters (RMSD = 0.001 sr−1 for 0–5 km to land) compared to more offshore waters (RMSD = 0.0006 sr−1 for 10–15 km to land; Figure 11A). A clear peak was associated with the 560 nm for the 0–5 km to land group (RMSD (560) = 0.002 sr−1; Figure 11D) coinciding with the peak observed in OWT 6 (Figure 10A). From the location of the matchups (Figure 8), OWT 6 appeared both within the <5 km to land and 10–15 km to land regions. The averaged MdAPD (dispersion) was similar for the three groups, and varied between 64% and 72% across all wavelengths (Figure 11B), with a peak at the 709 nm for waters <5 km to land (MdAPD(709) = 142%) and at 779 nm for the two groups further offshore (MdAPD(779) = 210–221%; Figure 11E). Spectrally, the minimum for this metric was found at 443 nm for 0–5 km (MdAPD(443) = 15%), at 510 nm for 5–10 km (MdAPD(510) = 18%) and at 560 nm for 10–15 km (MdAPD(560) = 12%; Figure 11E). The MdPD metric (Bias) was overall positive (MdPD = 35–46%). This indicates a positive bias of satellite estimates in relation to in situ observations across all distance partitions considered (Figure 11C). When looking at the spectral variation of this metric, however, matchups at 5–10 km from the shore were the only ones revealing a positive bias of the satellite derived reflectance (Figure 11F). At other distances (0–5 km and 10–15 km), bias was variable and sometimes negative.
4 Discussion
4.1 Performance compared to other studies for OLCI full resolution in coastal waters
Previous studies assessing the performance of atmospheric correction processors have highlighted that disparities in results between study areas arise from differences in reflectance ranges, in part due to varying degrees of turbidity (Vanhellemont and Ruddick, 2021).
The coastal areas assessed in the present study can be classed as moderately turbid, with total suspended matter concentrations between 1 and 10 g/m3 (Martinez-Vicente et al., 2010). These turbidity conditions differ substantially from those of recent studies (Mograne et al., 2019; Alikas et al., 2020; Giannini et al., 2021), which included moderately turbid to very turbid water bodies with reflectance values 10 times greater in magnitude (0.02–0.05 sr−1) than the values observed in the present study (0.003 sr−1, Figure 4). The study area, characterised by a narrow range of relatively low reflectances (Figure 4), revealed a positive bias of satellite estimates in relation to in situ observations. Although the present observations are low in magnitude, they are in line with previous measurements in the area (Martinez-Vicente et al., 2013; Jordan et al., 2023). They align with the lower end of values recorded in coastal waters by Giannini et al. (2021) (at 443 nm they report in situ Rrs less than 0.005 sr−1). They are also similar to more offshore waters in the Canadian coast (Vishnu and Costa, 2023).
When comparing the performance metrics for the whole dataset of this study to other studies, similarities arise with regards to the wavelength dependency. The dispersion and bias metrics indicated higher dispersion and bias at the edges of the spectral band range (<490 nm and >674 nm) with a peak in the red region (Figure 6C). The spectral differences in the dispersion and bias metrics are consistent with the metrics obtained by selecting different spatial or temporal windows explored in this study (Figures 3B, C). Lower performance at 400 nm and 865 nm may result from the low Rrs signal, given that there is a relationship between the dispersion metric and the intensity of the signal (Vanhellemont and Ruddick, 2021), and less likely to come from high absorption and backscattering by optically active constituents (Mograne et al., 2019). Larger uncertainties at shorter wavelengths could also be attributed to difficulties with aerosol correction (Soppa et al., 2021). Larger uncertainties at longer wavelengths, however, may instead be attributed to the small Rrs signal from increasing water absorption (Soppa et al., 2021). The positive bias of the satellite derived Rrs at 865 nm in relation to the in situ observations (Figure 6C) was also indicated by the MPD (Mean Percentage Difference) metric in Alikas et al. (2020) despite larger bias being observed (MdPDpresent = −16%, MPDAlikas = −50%).
Conversely, the RMSD metric suggested lower accuracy at shorter wavelengths than other studies (Figure 6A; Mograne et al., 2019; Vanhellemont and Ruddick, 2021). Also, the RMSD depicted strong differences with changes in the spatial and temporal matchup windows (Figure 3). An increase in RMSD (decrease in accuracy) was observed, mainly, at shorter wavelengths (<600 nm) between the strictest matchup selection routine (30 min and 1 × 1 pixel) and the most relaxed one (3 h and 3 × 3 pixels). Different causes have been proposed in the literature. Giannini et al. (2021) raise the fact that POLYMER does not consider the CDOM contribution to the optical signal adequately, leading to uncertainties in shorter wavelengths. This is particularly important in regions where the optical signal is significantly affected by CDOM absorption, e.g., British Columbia aCDOM (440) 0.23–4.91 m-1 (Giannini et al., 2021). The more offshore part of our study area is not affected by high CDOM, with aCDOM(440) 0.05–0.20 m-1 levels around L4 station (10–15 km from shore, Groom et al., 2009). Higher concentrations of CDOM are, however, expected in nearshore waters that could result in error in the shorter wavelengths. Warren et al. (2019) point out that the curve follows the wavelength dependency of the aerosol optical thickness with particular difficulty in removing aerosol contributions in shorter wavelengths, specifically at 443 nm (Pahlevan et al., 2021). Vanhellemont and Ruddick (2021) propose the under correction of the increasing atmospheric path reflectance between the NIR and the UV to be a potential cause.
Disparity between the present results and other studies can also be explained by the differences in the matchup selection criteria and in the data processing chain, including atmospheric correction methods and in situ data filtering. Not only have previous studies assessed more turbid types of coastal waters, different matchup selection routines and data filtering procedures have been used resulting in possible mismatch between satellite and field measurements. In this study we have selected the matchups very strictly (30 min difference between satellite and in situ observations), however for sun-synchronous satellites such as MERIS or Sentinel-3 OLCI, tidal dynamics are a known cause of bias in ocean colour products, for instance TSM concentrations in estuaries (Eleveld et al., 2014). Appropriate matchup selection criteria are therefore critical according to the spatiotemporal variability of the study area (Concha et al., 2021). It is also worth pointing out that the present study and previous studies cited have used different methods of atmospheric correction, with various versions of POLYMER used as well as different flags or correction methods to target bidirectional effects (Table 4).
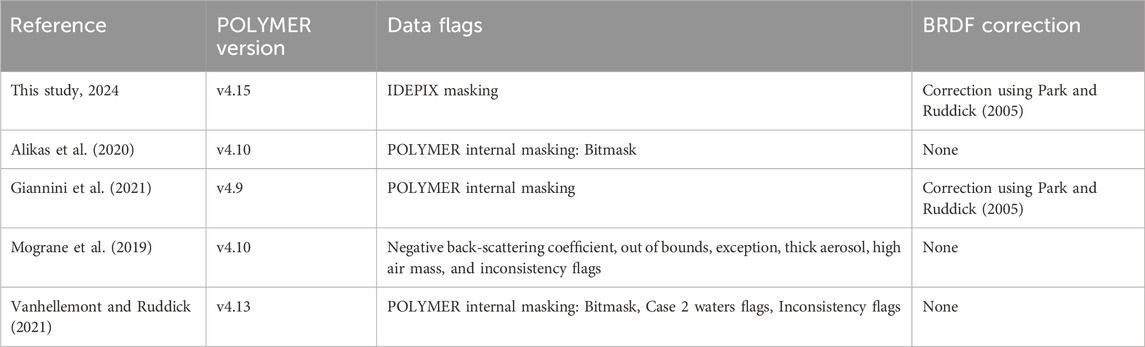
Table 4. Summary of atmospheric correction steps used in the present study compared to past research. BRDF = Bidirectional Reflectance Distribution Function.
Whilst both matchup selection and quality control are crucial for high quality data to support satellite ocean colour validation activities (IOCCG, 2019), strict criteria cause a large proportion of the acquired data to be discarded. Particular attention should be given to the sampling strategy and the validation protocol to obtain high quality ground measurements for accurate measures of performance. Users should follow accepted protocols (IOCCG, 2019; EUMETSAT, 2021).
4.2 Effects of optical water types and land adjacency on the results
Few sources in the literature describe the performance of atmospheric correction models while considering optical water types or distance from land (as proxy for adjacency effects) as potential contamination factors (Pereira-Sandoval et al., 2019; Warren et al., 2019; Pahlevan et al., 2021; Hieronymi et al., 2023).
When considering nearshore waters (0–5 km from land), the large RMSD values were present at the 560 nm band and could be a result of either nearshore enhanced TSM scattering (OWT 6) and/or adjacency from neighbouring land (Groom et al., 2009). The latter was suggested by Warren et al. (2019) when assessing the performance of atmospheric correction models for the Sentinel-2 MSI data. In their study, the RMSD at 560 nm increased by 25%–55% between the coastal and inland matchup datasets. With distance from land ranging between 0.2 and 1.2 km, this was associated with the contribution of land adjacency to the atmospheric path reflectance. The under correction of the land adjacency effect could explain the positive bias of the satellite derived reflectance in such waters. This is supported by the decreasing tendency observed in RMSD with increasing distance to land. When considering the RMSD metric, the results of the current study therefore point to the adjacency effect from neighbouring land as being a potential issue for Sentinel-3 OLCI data up to approximately 5 km from land. The dispersion (MdAPD) and bias (MdPD) metrics do, however, not show similar tendencies. This could be the result of other factors such as environmental conditions at the time of sampling such as aerosol optical depth, Sun and observation geometry. Increased efforts in the in situ Rrs sampling collocated with aerosol optical properties measurements within that distance to the shoreline would help to reduce uncertainties and improve confidence on Sentinel-3 OLCI to increase its use in water quality monitoring applications. Concerning the relationship between OWT and performance statistics, the accuracy (RMSD) and the dispersion (MdPD) measures provide the worse results, pointing to worse Rrs retrievals in more optically complex waters. This points to an application of OWT to flag coastal areas where satellite retrievals should be used with caution.
Finally, several limitations could be attributed to this analysis, in particular related to in situ data collection and analysis of radiometric data from unsupervised equipment. Non-ship superstructure, uncertainties associated with instruments and possible environmental conditions affect all measurements collected in this manner and have been discussed in specifically designed intercomparisons (e.g., Tilstone et al., 2020). In addition, some variations could come from the processing approach, which has been discussed extensively elsewhere (Groetsch et al., 2017). Ideally, optical instruments should be collected in tandem to provide closure, however, this is not always possible in the context of satellite validation from opportunistic, unsupervised platforms, which, in contrast, provide large amounts of data with the possibility to filter them. Progress could be made in the direction of improving the automatic orientation of the platform. In this way, data would be collected in the best conditions.
5 Conclusion
The present study assessed the performance of the POLYMER atmospheric correction processor for data from the Ocean and Land Colour Instrument (OLCI) onboard Sentinel-3. The focus was on the coastal regions of Plymouth Sound and the Western English Channel, dynamic ecosystems characterised by a complex geomorphology and influenced by tides. The validation activity carried out used high spatial resolution hyperspectral Rrs in situ data allowing convolution over the spectral response function of OLCI to emulate satellite data. These in situ data were strictly filtered and matched very closely to satellite data (to within 30 min and 300 m). The performance of POLYMER was evaluated by grouping matchup datasets according to optical water types and varying distance offshore.
The study demonstrated positive bias of the satellite Rrs estimates in relation to the in situ measurements collated in these relatively clear coastal waters, especially pronounced in nearshore more turbid regions. Considering that the in situ data can also have large uncertainties, and for the Near-Infrared (NIR) bands often have negative reflectance, we cannot state that this bias corresponds purely to an error in the satellite measurement. Issues related to aerosol correction by POLYMER have, however, been proposed as well as potential errors related to the adjacency of land and the low level of signal coming out of the water in nearshore regions.
Differences in the performance of POLYMER were observed across optical water types. Notably, poorer performance was observed in waters classified as OWT 6. Future sampling efforts in field campaigns should target optically active constituents to better characterise water types, specifically for OWT 6 and within 5 km of the shoreline to improve characterisation of uncertainties in those areas and improvement of products usability. These should be organised as close as possible to the satellite overpass to increase the size of the matchup dataset whilst considering the regional variability (tides, river flushing times, etc.) to limit spatial and temporal mismatch.
Data availability statement
The datasets presented in this study can be found in online repositories available at: https://github.com/ggleratti/datasets_insitu_S3_validation.git.
Author contributions
GG: Conceptualization, Formal Analysis, Investigation, Software, Visualization, Writing–original draft, Writing–review and editing. VM-V: Conceptualization, Formal Analysis, Investigation, Methodology, Project administration, Resources, Supervision, Validation, Writing–review and editing. EA: Methodology, Resources, Investigation, Writing–review and editing. SS: Data curation, Methodology, Resources, Writing–review and editing. TJ: Methodology, Resources, Writing–review and editing, Data curation.
Funding
The author(s) declare that financial support was received for the research, authorship, and/or publication of this article. This work has been supported by the CERTO project (Copernicus Evolution–Research for harmonised and Transitional water Observation) that has received funding from the European Union’s Horizon 2020 research and innovation programme under grant agreement No. 870349 and by the European Space Agency (ESA) FutureEO-1 Biodiversity + precursors Bicome project: Biodiversity of the coastal ocean: Monitoring with Earth Observation, grant number 4000135756/21/I-EF. EA was partially funded by NERC through its Earth Observation Data Acquisition and Analysis Service (NEODAAS). The publication of this research was funded by the United Kingdom Natural Environment Research Council (NERC) through its National Capability Long-term Single Centre Science Programme, Climate Linked Atlantic Sector Science, grant number NE/R015953/1, contributing to 4—Fixed Point Observations (Western Channel Observatory).
Acknowledgments
We thank the staff at the Plymouth Marine Laboratory who participated in the in situ data sampling.
Conflict of interest
Author GG is now employed at A-2-Sea Solutions Ltd.
The remaining authors declare that the research was conducted in the absence of any commercial or financial relationships that could be construed as a potential conflict of interest.
Publisher’s note
All claims expressed in this article are solely those of the authors and do not necessarily represent those of their affiliated organizations, or those of the publisher, the editors and the reviewers. Any product that may be evaluated in this article, or claim that may be made by its manufacturer, is not guaranteed or endorsed by the publisher.
Supplementary material
The Supplementary Material for this article can be found online at: https://www.frontiersin.org/articles/10.3389/frsen.2024.1359709/full#supplementary-material
References
Alikas, K., Ansko, I., Vabson, V., Ansper, A., Kangro, K., Uudeberg, K., et al. (2020). Consistency of radiometric satellite data over lakes and coastal waters with local field measurements. Remote Sens. 12, 616. doi:10.3390/rs12040616
Arena, M., Pratolongo, P., Loisel, H., Tran, M. D., Jorge, D. S. F., and Delgado, A. L. (2024). Optical water characterization and atmospheric correction assessment of estuarine and coastal waters around the AERONET-OC Bahia Blanca. Front. Remote Sens. 5, 1305787. doi:10.3389/frsen.2024.1305787
Bailey, S. W., and Werdell, P. J. (2006). A multi-sensor approach for the on-orbit validation of ocean color satellite data products. Remote Sens. Environment 102 (1-2), 12–23. doi:10.1016/j.rse.2006.01.015
Brewin, R. J. W., Dall’Olmo, G., Pardo, S., van Dongen-Vogels, V., and Boss, E. S. (2016). Underway spectrophotometry along the Atlantic Meridional Transect reveals high performance in satellite chlorophyll retrievals. Remote Sens. Environ. 183, 82–97. doi:10.1016/j.rse.2016.05.005
Bulgarelli, B., Kiselev, V., and Zibordi, G. (2014). Simulation and analysis of adjacency effects in coastal waters: a case study. Appl. Opt. 53, 1523–1545. doi:10.1364/AO.53.001523
Bulgarelli, B., and Zibordi, G. (2018). On the detectability of adjacency effects in ocean color remote sensing of mid-latitude coastal environments by SeaWiFS, MODIS-A, MERIS, OLCI, OLI and MSI. Remote Sens. Environ. 209, 423–438. doi:10.1016/j.rse.2017.12.021
Concha, J. A., Bracaglia, M., and Brando, V. E. (2021). Assessing the influence of different validation protocols on Ocean Colour match-up analyses. Remote Sens. Environ. 259, 112415. doi:10.1016/j.rse.2021.112415
Doxaran, D., Cherukuru, N., and Lavender, S. J. (2006). Apparent and inherent optical properties of turbid estuarine waters: measurements, empirical quantification relationships, and modeling. Appl. Opt. 45, 15. doi:10.1364/AO.45.002310
Eleveld, M. A., van der Wal, D., and van Kessel, T. (2014). Estuarine suspended particulate matter concentrations from sun-synchronous satellite remote sensing: tidal and meteorological effects and biases. Remote Sens. Environ. 143, 204–215. doi:10.1016/j.rse.2013.12.019
EUMETSAT (2021). Recommendations for Sentinel-3 OLCI Ocean Colour product validations in comparison with in situ measurements.
Giannini, F., Hunt, B. P. V., Jacoby, D., and Costa, M. (2021). Performance of OLCI sentinel-3A satellite in the northeast pacific coastal waters. Remote Sens. Environ. 256, 112317. doi:10.1016/j.rse.2021.112317
Goyens, C., Jamet, C., and Schroeder, T. (2013). Evaluation of four atmospheric correction algorithms for MODIS-Aqua images over contrasted coastal waters. Remote Sens. Environ. 131, 63–75. doi:10.1016/j.rse.2012.12.006
Goyens, C., Lavigne, H., Dille, A., and Vervaeren, H. (2022). Using hyperspectral remote sensing to monitor water quality in drinking water reservoirs. Remote Sens. 14, 5607. doi:10.3390/rs14215607
Groetsch, P. M. M., Gege, P., Simis, S. G. H., Eleveld, M. A., and Peters, S. W. M. (2017). Validation of a spectral correction procedure for sun and sky reflections in above-water reflectance measurements. Opt. Express. OE 25, A742–A761. doi:10.1364/OE.25.00A742
Groom, S., Martinez-Vicente, V., Fishwick, J., Tilstone, G., Moore, G., Smyth, T., et al. (2009). The western English Channel observatory: optical characteristics of station L4. J. Mar. Syst. 77, 278–295. doi:10.1016/j.jmarsys.2007.12.015
Hieronymi, M., Bi, S., Müller, D., Schütt, E. M., Behr, D., Brockmann, C., et al. (2023). Ocean color atmospheric correction methods in view of usability for different optical water types. Front. Mar. Sci. 10. doi:10.3389/fmars.2023.1129876
Hieronymi, M., Müller, D., and Doerffer, R. (2017). The OLCI neural network swarm (ONNS): a bio-geo-optical algorithm for open ocean and coastal waters. Front. Mar. Sci. 4. doi:10.3389/fmars.2017.00140
IOCCG (2010). Atmospheric correction for remotely-sensed ocean-colour products. Dartmouth, Canada: IOCCG. Available at: https://www.ioccg.org/reports/report10.pdf (Accessed October 6, 2023).
IOCCG (2019). Ocean optics and biogeochemistry protocols for satellite Ocean colour sensor validation, volume 3.0: protocols for satellite Ocean colour data validation: in situ optical Radiometry. Dartmouth, Canada: IOCCG. doi:10.25607/OBP-691
Jackson, T., Sathyendranath, S., and Mélin, F. (2017). An improved optical classification scheme for the Ocean Colour Essential Climate Variable and its applications. Remote Sens. Environ. 203, 152–161. doi:10.1016/j.rse.2017.03.036
Jordan, T. M., Simis, S. G., Selmes, N., Sent, G., Ienna, F., and Martinez-Vicente, V. (2023). Spatial structure of in situ reflectance in coastal and inland waters: implications for satellite validation. Front. Remote Sens. 4. doi:10.3389/frsen.2023.1249521
Liu, H., He, X., Li, Q., Hu, X., Ishizaka, J., Kratzer, S., et al. (2021). Evaluation of ocean color atmospheric correction methods for Sentinel-3 OLCI using global automatic in situ observations. IEEE Trans. Geoscience Remote Sens. 60, 1–19. doi:10.1109/TGRS.2021.3136243
Martinez-Vicente, V., Land, P. E., Tilstone, G. H., Widdicombe, C., and Fishwick, J. R. (2010). Particulate scattering and backscattering related to water constituents and seasonal changes in the Western English Channel. J. Plankton Res. 32, 603–619. doi:10.1093/plankt/fbq013
Martinez-Vicente, V., Simis, S. G. H., Alegre, R., Land, P. E., and Groom, S. B. (2013). Above-water reflectance for the evaluation of adjacency effects in Earth observation data: initial results and methods comparison for near-coastal waters in the Western Channel, UK. J. Eur. Opt. Soc. - Rapid Publ. 8, 13060. doi:10.2971/jeos.2013.13060
Mélin, F., Sclep, G., Jackson, T., and Sathyendranath, S. (2016). Uncertainty estimates of remote sensing reflectance derived from comparison of ocean color satellite data sets. Remote Sens. Environ. 177, 107–124. doi:10.1016/j.rse.2016.02.014
Mélin, F., and Vantrepotte, V. (2015). How optically diverse is the coastal ocean? Remote Sens. Environ. 160, 235–251. doi:10.1016/j.rse.2015.01.023
Mograne, M. A., Jamet, C., Loisel, H., Vantrepotte, V., Mériaux, X., and Cauvin, A. (2019). Evaluation of five atmospheric correction algorithms over French optically-complex waters for the sentinel-3A OLCI ocean color sensor. Remote Sens. 11, 668. doi:10.3390/rs11060668
Moore, T. S., Campbell, J. W., and Feng, H. (2001). A fuzzy logic classification scheme for selecting and blending satellite ocean color algorithms. IEEE Trans. Geosci. Remote Sens. 39, 1764–1776. doi:10.1109/36.942555
Moore, T. S., Campbell, J. W., and Feng, H. (2015). Characterizing the uncertainties in spectral remote sensing reflectance for SeaWiFS and MODIS-Aqua based on global in situ matchup data sets. Remote Sens. Environ. 159, 14–27. doi:10.1016/j.rse.2014.11.025
Morel, A., and Prieur, L. (1977). Analysis of variations in ocean color 1. Limnol. Oceanogr. 22 (4), 709–722. doi:10.4319/lo.1977.22.4.0709
Nasiha, H. J., Wang, Z., Giannini, F., and Costa, M. (2022). Spatial variability of in situ above-water reflectance in coastal dynamic waters: implications for satellite match-up analysis. Front. Remote Sens. 3, 876748. doi:10.3389/frsen.2022.876748
Pahlevan, N., Mangin, A., Balasubramanian, S. V., Smith, B., Alikas, K., Arai, K., et al. (2021). ACIX-Aqua: a global assessment of atmospheric correction methods for Landsat-8 and Sentinel-2 over lakes, rivers, and coastal waters. Remote Sens. Environ. 258, 112366. doi:10.1016/j.rse.2021.112366
Park, Y. J., and Ruddick, K. (2005). Model of remote-sensing reflectance including bidirectional effects for case 1 and case 2 waters. Appl. Opt. 44 (7), 1236–1249. doi:10.1364/AO.44.001236
Pereira-Sandoval, M., Ruescas, A., Urrego, P., Ruiz-Verdú, A., Delegido, J., Tenjo, C., et al. (2019). Evaluation of atmospheric correction algorithms over Spanish inland waters for sentinel-2 multi spectral imagery data. Remote Sens. 11, 1469. doi:10.3390/rs11121469
Qin, P., Simis, S. G. H., and Tilstone, G. H. (2017). Radiometric validation of atmospheric correction for MERIS in the Baltic Sea based on continuous observations from ships and AERONET-OC. Remote Sens. Environ. 200, 263–280. doi:10.1016/j.rse.2017.08.024
Ruddick, K. G., Ovidio, F., and Rijkeboer, M. (2000). Atmospheric correction of SeaWiFS imagery for turbid coastal and inland waters. Appl. Opt. 39, 897–912. doi:10.1364/AO.39.000897
Sathyendranath, S., Brewin, R., Brockmann, C., Brotas, V., Calton, B., Chuprin, A., et al. (2019). An Ocean-colour time series for use in climate studies: the experience of the Ocean-colour climate change initiative (OC-CCI). Sensors 19, 4285. doi:10.3390/s19194285
Siddorn, J. R., Allen, J. I., Blackford, J. C., Gilbert, F. J., Holt, J. T., Holt, M. W., et al. (2007). Modelling the hydrodynamics and ecosystem of the North-West European continental shelf for operational oceanography. J. Mar. Syst. 65, 417–429. doi:10.1016/j.jmarsys.2006.01.018
Simis, S. G. H., and Olsson, J. (2013). Unattended processing of shipborne hyperspectral reflectance measurements. Remote Sens. Environ. 135, 202–212. doi:10.1016/j.rse.2013.04.001
Soppa, M. A., Silva, B., Steinmetz, F., Keith, D., Scheffler, D., Bohn, N., et al. (2021). Assessment of polymer atmospheric correction algorithm for hyperspectral remote sensing imagery over coastal waters. Sensors 21, 4125. doi:10.3390/s21124125
Spyrakos, E., O’Donnell, R., Hunter, P. D., Miller, C., Scott, M., Simis, S. G., et al. (2018). Optical types of inland and coastal waters. Limnol. Oceanogr. 63, 846–870. doi:10.1002/lno.10674
Steinmetz, F., Deschamps, P.-Y., and Ramon, D. (2011). Atmospheric correction in presence of sun glint: application to MERIS. Opt. Express 19, 9783–9800. doi:10.1364/OE.19.009783
Sullivan, E., Cole, M., Atwood, E. C., Lindeque, P. K., Chin, P. T., and Martinez-Vicente, V. (2023). In situ correlation between microplastic and suspended particulate matter concentrations in river-estuary systems support proxies for satellite-derived estimates of microplastic flux. Mar. Pollut. Bull. 196, 115529. doi:10.1016/j.marpolbul.2023.115529
Tilstone, G., Dall’Olmo, G., Hieronymi, M., Ruddick, K., Beck, M., Ligi, M., et al. (2020). Field intercomparison of radiometer measurements for ocean colour validation. Remote Sens. 12 (10), 1587. doi:10.3390/rs12101587
Tilstone, G. H., Pardo, S., Simis, S. G., Qin, P., Selmes, N., Dessailly, D., et al. (2022). Consistency between satellite ocean colour products under high coloured dissolved organic matter absorption in the Baltic Sea. Remote Sens. 14 (1), 89. doi:10.3390/rs14010089
Vanhellemont, Q., and Ruddick, K. (2021). Atmospheric correction of Sentinel-3/OLCI data for mapping of suspended particulate matter and chlorophyll-a concentration in Belgian turbid coastal waters. Remote Sens. Environ. 256, 112284. doi:10.1016/j.rse.2021.112284
Vansteenwegen, D., Ruddick, K., Cattrijsse, A., Vanhellemont, Q., and Beck, M. (2019). The pan-and-tilt hyperspectral radiometer system (PANTHYR) for autonomous satellite validation measurements—prototype design and testing. Remote Sens. 11, 1360. doi:10.3390/rs11111360
Vishnu, P. S., and Costa, M. (2023). Evaluating the performance of Sentinel-3A OLCI products in the subarctic northeast Pacific. Remote Sens. 15 (13), 3244. doi:10.3390/rs15133244
Wang, Z., and Costa, M. (2022). Autonomous shipborne in situ reflectance data in optically complex coastal waters: a case study of the salish sea, Canada. Front. Remote Sens. 3, 867570. doi:10.3389/frsen.2022.867570
Warren, M. A., Simis, S. G. H., Martinez-Vicente, V., Poser, K., Bresciani, M., Alikas, K., et al. (2019). Assessment of atmospheric correction algorithms for the Sentinel-2A MultiSpectral Imager over coastal and inland waters. Remote Sens. Environ. 225, 267–289. doi:10.1016/j.rse.2019.03.018
Xie, X. L., and Beni, G. (1991). A validity measure for fuzzy clustering. IEEE Trans. Pattern Anal. Mach. Intell. 13, 841–847. doi:10.1109/34.85677
Keywords: reflectance, matchup, validation, Sentinel-3 OLCI, atmospheric correction, coastal waters
Citation: Gleratti G, Martinez-Vicente V, Atwood EC, Simis SGH and Jackson T (2024) Validation of full resolution remote sensing reflectance from Sentinel-3 OLCI across optical gradients in moderately turbid transitional waters. Front. Remote Sens. 5:1359709. doi: 10.3389/frsen.2024.1359709
Received: 21 December 2023; Accepted: 10 June 2024;
Published: 04 July 2024.
Edited by:
Kevin Ruddick, Royal Belgian Institute of Natural Sciences, BelgiumReviewed by:
Maycira Costa, University of Victoria, CanadaIlaria Cazzaniga, Joint Research Centre, Italy
Copyright © 2024 Gleratti, Martinez-Vicente, Atwood, Simis and Jackson. This is an open-access article distributed under the terms of the Creative Commons Attribution License (CC BY). The use, distribution or reproduction in other forums is permitted, provided the original author(s) and the copyright owner(s) are credited and that the original publication in this journal is cited, in accordance with accepted academic practice. No use, distribution or reproduction is permitted which does not comply with these terms.
*Correspondence: Victor Martinez-Vicente, dm12QHBtbC5hYy51aw==; Gaia Gleratti, Z2FpYS5nbGVyYXR0aUBnbWFpbC5jb20=