- Institute of Atmospheric Pollution Research (IIA), National Research Council, Rome, Italy
Adaptive traffic signal control (ATSC) in urban traffic networks poses a challenging task due to the complicated dynamics arising in traffic systems. In recent years, several approaches based on multi-agent deep reinforcement learning (MARL) have been studied experimentally. These approaches propose distributed techniques in which each signalized intersection is seen as an agent in a stochastic game whose purpose is to optimize the flow of vehicles in its vicinity. In this setting, the systems evolves toward an equilibrium among the agents that shows beneficial for the whole traffic network. A recently developed multi-agent variant of the well-established advantage actor-critic (A2C) algorithm, called MA2C (multi-agent A2C) exploits the promising idea of some communication among the agents. In this view, the agents share their strategies with other neighbor agents, thereby stabilizing the learning process even when the agents grow in number and variety. We experimented MA2C in two traffic networks located in Bologna (Italy) and found that its action translates into a significant decrease of the amount of pollutants released into the environment.
1. Introduction
The impact of air pollution on human health, whether due to vehicular traffic or from industrial sources, has been proven to be largely detrimental. According to WHO, the World Health Organization, in recent times (2016) there have been worldwide 4.2 million premature deaths due to air pollution (WHO, 2021). This mortality is due to exposure to small particulate matter of 2.5 microns or less in diameter (PM2.5), which cause cardiovascular and respiratory disease, and cancers. The Organization has included polluted air among the top 10 health risks of our species. Respiratory diseases kill more than alcohol and drugs and rank fourth among the leading causes of death (WHO, 2002). It is particularly blocked traffic that cause the greatest risks (Hermes, 2012). In order to avoid congestion and traffic jams, various artificial-intelligence based algorithms have been proposed. These algorithms are able to deal with the problem of managing traffic signal control to favor a smooth vehicle flow. Established approaches include fuzzy logic (Gokulan and Srinivasan, 2010), swarm intelligence (Teodorovi, 2008), and reinforcement learning (Sutton and Barto, 1998).
In the present work, we employ MA2C (Chu et al., 2019), an instance of multi-agent reinforcement learning as a signalized intersection controller, in an area located in the immediate outskirts of the city of Bologna (Italy), namely the Andrea Costa area (Fazzini et al., 2021). Our experimentation is focused on evaluating the variation of vehicle emissions when signalized intersection are coordinated with MA2C. The traffic network setting we adopted is based on (Fazzini et al., 2021).
1.1. Related Work
Traffic flow is increasing constantly with economic and social growth, and road congestion is a crucial issue in growing urban areas (Marini et al., 2015; Rizza et al., 2017). Machine learning methods like reinforcement learning (Kuyer et al., 2008; El-Tantawy and Abdulhai, 2012; Bazzan and Klgl, 2014; Mannion et al., 2016) and other artificial intelligence techniques such as fuzzy logic algorithms (Gokulan and Srinivasan, 2010) and swarm intelligence (Teodorovi, 2008) have been applied to improve the management of street intersections regulated with traffic lights (signalized intersections). Arel et al. (2010) proposed a new approach of a multi-agent system and reinforcement learning (RL) utilizing a q-learning algorithm with a neural network, and demonstrated its advantages in obtaining an efficient traffic signal control policy. Recently, a specific interest has been shown in the applications of agent-based technologies to traffic and transportation engineering. As an example, Liang et al. (2019) studied traffic signal duration with a deep reinforcement learning model. Furthermore, Nishi et al. (2018) developed an RL-based traffic signal control method that employs a graph convolutional neural network analysing a six-intersection area. In addition, Rezzai et al. (2018) proposed a new architecture based on multi-agent systems and RL algorithms to make the signal control system more autonomous, able to learn from its environment and make decisions to optimize road traffic. Wei et al. (2020) gave a complete overview on RL-based traffic signal control approaches, including the recent advances in deep RL-based traffic signal control methods. Wang et al. (2018) summarized in their review some technical characteristics and the current research status of self-adaptive control methods used so far. Yau et al. (2017) and Mannion et al. (2016), instead, provide comprehensive surveys mainly on studies before the more recent spread of deep reinforcement learning. The present work is mainly based on (Fazzini et al., 2021). For our simulations, we replicated the Andrea Costa and Pasubio areas in pseudo-random and entirely random traffic conditions. Both areas are located in the western outskirts of Bologna (Italy) (Bieker et al., 2015).
2. Materials and Methods
2.1. Overview
In this work, we experimented a multi-agent deep reinforcement Learning (MARL) algorithm called Multi-Agent Advantage Actor-Critic (MA2C) (Chu et al., 2019, 2020) in a simulated traffic settings located in the Bologna area (Fazzini et al., 2021). Our goal is to evaluate its performance in terms of amount of pollutants released in the environment. More specifically, our evaluation focus on how MA2C, by controlling the logic of traffic lights, affects the coordination among the signalized intersections and consequently influence the amount of vehicles queuing at their surroundings.
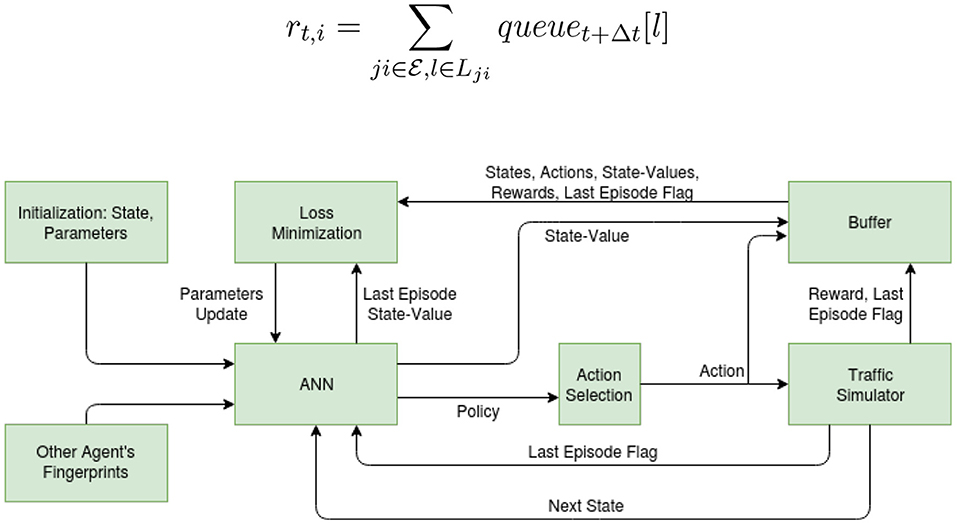
The problem of coordinating signalized intersections can be seen as a stochastic game: every agent (i.e., every signalized intersection) aims to minimize the amount of queuing vehicles (reward)1 by observing their behavior in its neighborhood (i.e., by observing its neighborhood state) and ultimately learns how to balance its action (by controlling traffic lights switching) with the other agents. Notably, MA2C couples the observation of its neighbor policy to the observation of its state, and restricts the environment reward to its neighborhood (Figure 1) (Fazzini et al., 2021) yielding a mixed cooperative-competitive stochastic game.
As shown in Figure 2, our setting is organized in a nested structure: a traffic network represents our environment, which in turn includes multiple traffic signalized intersections (agents). Every intersection contains one or more crossroads, each including a number of lanes.
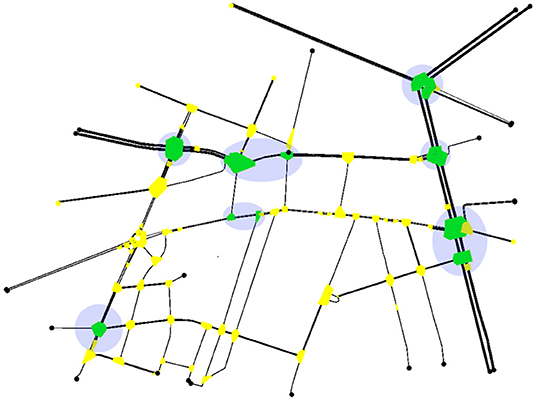
Figure 2. Traffic network: the round (translucent-purple) spots reference the signalized intersections (agents). Each signalized intersection include one or more crossroads which are highlighted in a dark (green) color. The intersection not controlled by any agent are highlighted in a lighter (yellow) color.
We start by reviewing the equations of multi-agent reinforcement learning. In Section 3, we detail our experiments and show our traffic networks. Finally (Section 4), we evaluate how the MA2C action translates in terms of pollutants released in the environment.
2.2. Multi-Agent Reinforcement Learning
As described in Fazzini et al. (2021), we refer our formalism to the framework of recurrent policy gradients (Wierstra et al., 2007): each agent learns a limited memory stochastic policy π(ut ∣ ht), mapping sufficient statistics of a sequence of states ht to probability distributions on action ut; once the optimal policy has been determined it is adopted for signalized intersection coordination.
2.2.1. Neighbor Agents
In a network symbolized by a graph , where (vertices) is the set of the agents and (edges) is the set of their connections, agent i and agent j are neighbors if the number of edges connecting them is less or equal some prefixed threshold. In the adopted formalism: (1) agents and connections refers to signalized intersections; (2) the neighborhood of agent i is denoted as and its local region is = ; and (3) the distance between any two agents is denoted as d(i, j) with d(i, i) = 0 and d(i, j) = 1 for any .
2.3. System Architecture
Figure 3 provides an overview of the system. The goal is to minimize the vehicle queues measured at signalized intersections. To this end, an agent keeps repeating the following steps (Fazzini et al., 2021): (1) the ANN provides a policy for the traffic simulator given the perceived state st of the environment; (2) given the policy, a set of consecutive actions are selected (e.g., the simulator can be instructed to switch traffic lights at signalized intersections); (3) the simulator performs a few time steps following the current policy and stores the environment rewards, corresponding to the amount of queuing vehicles in proximity of signalized intersections; and (4) the ANN uses the stored rewards to change its parameters in order to improve its policy.
Table 1 shows formally how states, actions, rewards and policies have been defined in our setting.
In Table 1, with fingerprints is intended the current policy of the neighboring agents, instantiated with the vector of probabilities of choosing one of the available actions; wave [veh] measures the total number of approaching vehicles along each incoming lane, within 50 m to a signalized intersection. The state is defined as st, i = {wavet[lji]}lji ∈ Li where Li is the set of lanes j converging at a signalized intersection (agent) i; moreover fingerprints of other agents are added to complete the observation set.
In addition to the settings in Table 1, is the set of available actions for each agent i, defined as the set of all the possible red-green-yellow transitions available to each traffic light. The reward function at time t cumulates the queues (number of vehicles with speed less than 0.1 m/s) at the lanes concurring to a certain signalized intersection computed at time t + Δt:
2.4. ANN Detail
States, actions, next states, and rewards are collected in minibatches called experience buffers, one for each agent i: Bi = {(st, ut, st+1, rt)}i. They are stored while the traffic simulator performs a sequence of actions. Each batch i reflects agent i experience trajectory. Figure 4 shows MA2C's architecture. The graph reflects the A2C formalism (Barto et al., 1983; Mnih et al., 2016), therefore, each graph represents two different networks, one for the Actor (Policy) and one for the Critic (State-Value), their respective parameters being further referred as θ and ψ. As in the graph, wave states and the fingerprint unit are fed to separated fully connected (FC) Layer with a variable number of inputs, depending by the number of lanes converging to the controlled signalized intersection. The output of the FC layer (128 units) feeds the Long Short-Term Memory module (LSTM) equipped with 64 outputs and 64 inner states (Fazzini et al., 2021). The output of the LSTM module is linked to the network output that in the Actor case is a policy vector (with softmax activation function) and in the Critic case is a State-Value (with linear activation function). All the activation functions in the previous modules are Rectification Units (ReLU). In Figure 4, the network biases are not depicted although present in each layer. For ANN training, an orthogonal initializer [43] and a gradient optimizer of type RMSprop have been used. To prevent gradient explosion, all normalized states are clipped to [0, 2] and each gradient is capped at 40. Rewards are clipped to [-2, 2].
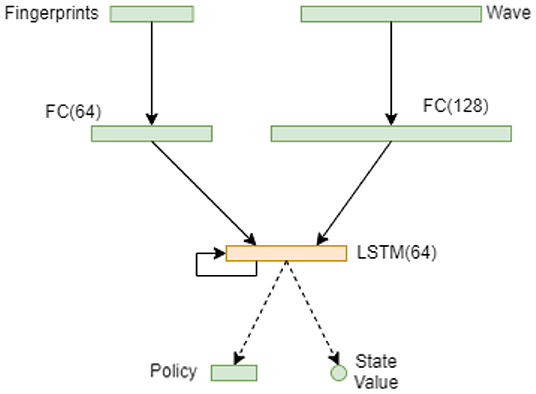
Figure 4. Scheme of the two ANNs (Actor and Critic). Apart from the output layer, the two ANNs share the same architecture but are distinct entities with different weights. The Wave and Fingerprints inputs are elaborated by two fully connected (FC) layers made by 64 and 128 units. The outputs of the FC layers feed the LSTM unit (64 inputs) whose output is in the first case a state value (first ANN, Critic) and in the second case a policy (second ANN, Actor).
2.5. Multi-Agent Advantage Actor-Critic (MA2C)
MA2C (Chu et al., 2019) is characterized by a stable learning process due to communication among agents belonging to the same neighborhood: a spatial discount factor weakens the reward signals from agents other than agent i in the loss function and agents not in are not considered in the reward computation. The relevant expressions for the Loss functions governing the training optimization algorithm are:
In the above equations:
•
•
•
•
•
•
•
•
• ⋃α{st, j}] with
Where πθi refers the policy to be learned determining the parameters θi associated with agent i, are the policies of agent i's neighbor agents at time t, ut, i is the action taken by agent i at time t, is the history of the past states of agent i at time t following the policy πθi, rt, i is an evaluation of the average queue at signalized intersection (agent) i at time t2.
The spatial discount factor α penalizes other agent's reward and Di is the limit of agent i neighborhood.
Equation (3) yields a stable learning process since (a) fingerprints are input to Vψi to bring in account , and (b) spatially discounted return is more correlated to local region observations .
3. Calculation
We trained and evaluated MA2C in two traffic environments replicating two districts in the Bologna area (Andrea Costa and the Pasubio) simulated in SUMO (Lopez et al., 2018).
3.1. Training and Evaluation
A relevant finding in Fazzini et al. (2021) is that pseudo-random training (when the same seed is applied to the random vehicle trip generation, causing vehicles repeating the same path among training episodes) shapes robust policies also able to cope with completely random trips (generated with different seeds in different episodes). In fact (Fazzini et al., 2021) reports that all the evaluations performed with various seeds (therefore, various random sequences of trips) show a consistent behavior when using MA2C both with the insertion of 2,000 and 3,600 vehicles. Moreover, such policies have proven effective even when the total number of vehicles inserted during evaluation is different from the total number of vehicles inserted during training, remarking that a learned policy doesn't show a relation with such parameter. Consequently, in the experiments detailed in this work, we adopted pseudo-training. Our setting involves that every episode of the SUMO simulation consists of 3,600 time steps; each time step a vehicle is inserted in the traffic network with a pseudo-random Origin-Destination (OD) pair until an amount of 2,000 vehicles is achieved. The criterion used to measure the algorithms performance is the vehicle queues at the intersections, which is linked to the DP reward by Equation (1). Such queues are estimated by SUMO for each crossing (reward) and then elaborated following the equations in Section 2.5. The algorithm is trained over 1 M training steps, each divided in 720 time steps; consequently every SUMO episode is made by 5 training steps. For the evaluation, we adopt the same settings as in training, although the vehicle trips are generated with a different random seed.
3.2. Initial Conditions
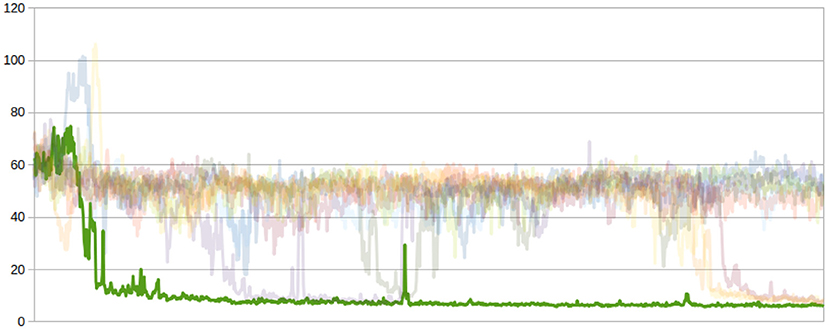
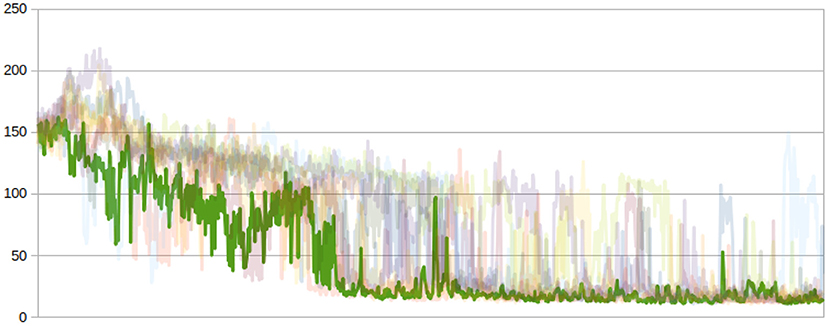
When training, being the vehicle trips generated in a pseudo-random fashion, randomness comes from the choice of the initial conditions for the ANN weights. Here, the only constraint is that such weights are initialized as orthogonal matrix (Saxe et al., 2014). Figures 5, 6 show the effect of different initial conditions on the learning process in terms of number of vehicles queuing at the controlled signalized intersection (y-axis). The opaque (green) graph shows the best learning curve among 10 training attempts, which are shown in translucent shades.
In the following evaluations the best learnt policies are adopted to operate synchronization among the agents (signalized interceptions).
3.3. Parameter Settings
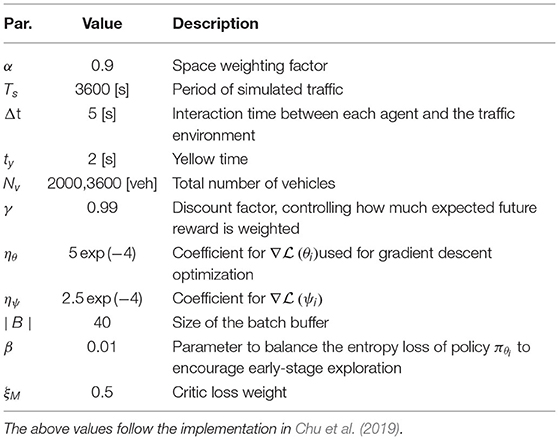
The DP is finally instantiated with the settings listed in Table 2.
The size of the batch indirectly sets up the n parameter of the n-step return appearing in Equations (2) and (3) and has been chosen balancing the complementing characteristics of TD and Monte-Carlo methods (Sutton and Barto, 1998).
3.4. Traffic Networks
Our experimentation have been conducted in the following traffic networks (Fazzini et al., 2021).
3.4.1. Bologna - Andrea Costa
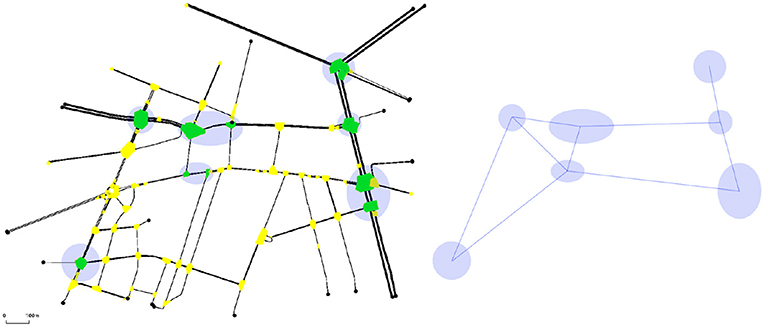
Figure 7 (left) shows the Bologna—Andrea Costa neighborhood (Bieker et al., 2015).
The round (translucent purple) spots reference the signalized intersections (agents). Each signalized intersection include one or more crossroads which are highlighted in a dark (green) color. The intersection not controlled by any agent are highlighted in a lighter (yellow) color. The right side of the figure shows the way each agent is connected to the others as required by MA2C fingerprints communication and reward computation. The set of all the agents connected to a single agent constitutes its neighborhood. For this pseudo-random simulation, 2,000 vehicles where inserted in the traffic network, one each time step in the time interval [0, 2,000] while no vehicle is inserted during the 1,600 remaining episode time steps.
3.4.2. Bologna—Pasubio
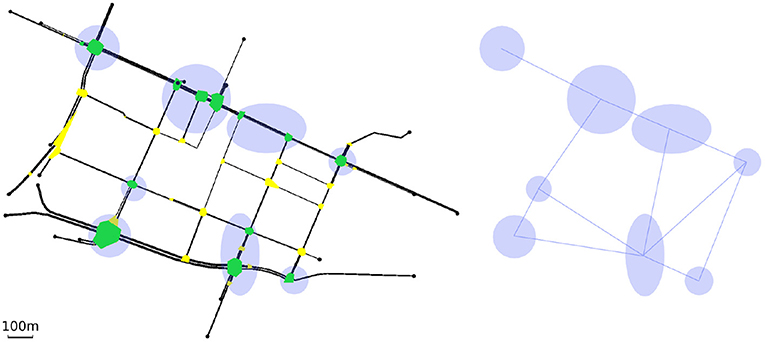
Figure 8 (left) shows the Bologna—Pasubio neighborhood (Bieker et al., 2015). As in the Andrea Costa case, the right hand side of the figure shows how the agents have been connected.
4. Results
In this section, we evaluate how MA2C performance translates in terms of emissions.
As described in the above sections, our typical traffic simulation spans over 3,600 time steps, with an interaction time of each vehicle with its environment of 5 s (Table 2):
• In the first part of the simulation (time steps [0, 2,000]) a vehicle is pseudo-randomly inserted on the map for each time step and follows a pseudo-random path.
• In the second part of the simulation (time steps [2,000, 3,600]) no vehicle is inserted. Eventually, all the vehicles circulating on the map leave through one of the exit lanes or end their journey by reaching their destination.
Evaluations regarding training, convergence as well as details on robustness toward random testing are fully detailed in Fazzini et al. (2021). In this section, we will focus exclusively on the effects of traffic signal control by MA2C on vehicle circulation.
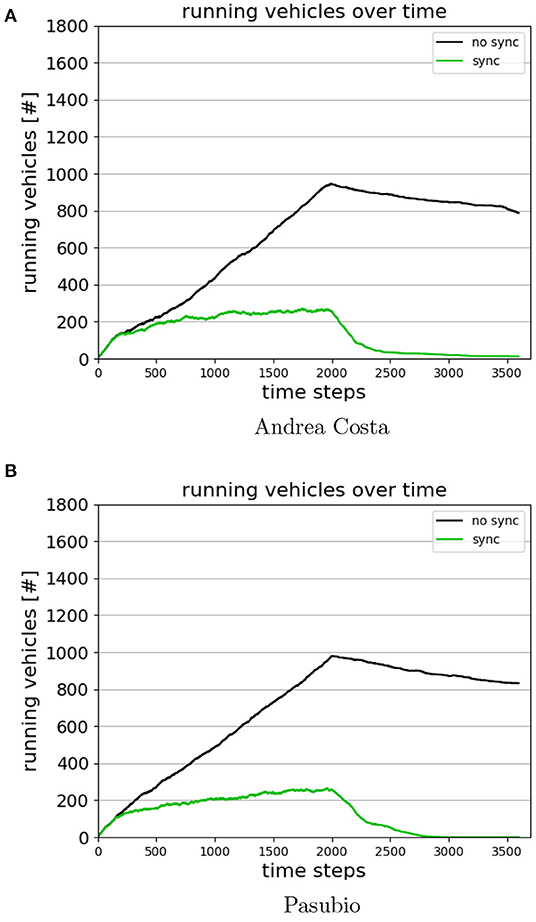
Figure 9 shows the number of running vehicles in the time span [0, 3,600] for the cases Andrea Costa and Pasubio (Fazzini et al., 2021).
The curve referring to the case where no coordination is performed among the agents (No Sync case) shows that due to heavy queuing at the traffic lights, several vehicles stay on the road after time step 2000. In the graph, the curve keeps rising while vehicles are injected and tends to slowly decrease afterwards. However, when MA2C performs coordination among the agents using the learnt policy (Sync case), the amount of vehicles running fades quickly toward zero after time step 2,000. This finding has an obvious impact on the amount of emissions, as shown in the following sections.
4.1. NOx Emissions
Emissions have been computed following the emission model implemented within Sumo (Krajzewicz et al., 2014). The graphs and the tables reported come from evaluating a policy converging to the ideal behavior during training shown in the training graphs. As in Fazzini et al. (2021), the evaluation of such policy shows no dependence by the seed used to generate the random vehicle trips.
Figures 10, 11 display the NOx emissions normalized in time and street length (g/h/km) with (Sync) and without (no Sync) synchronization3.
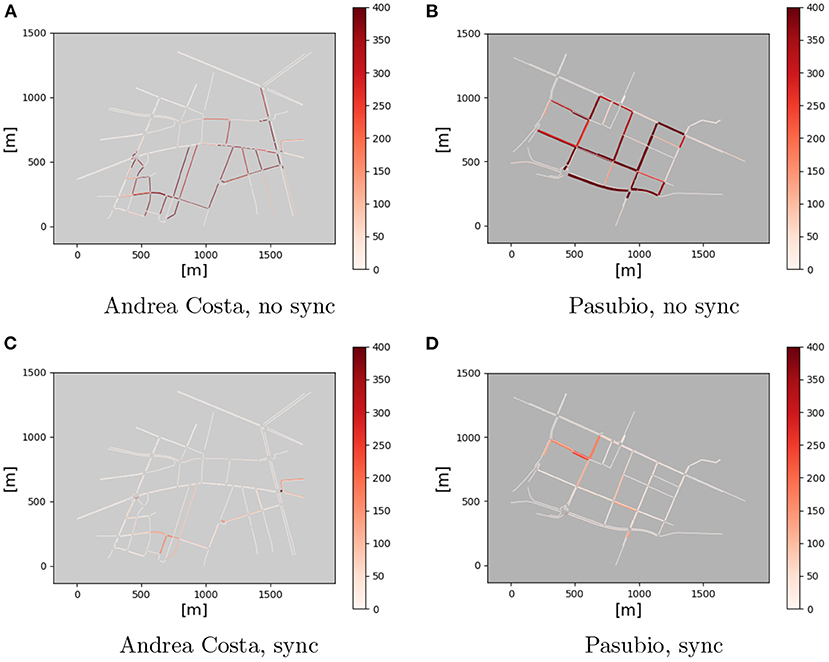
Figure 10. NOx emissions, time interval [0, 1000]. (A) Andrea Costa, no sync. (B) Pasubio, no sync. (C) Andrea costa, sync. (D) Pasubio, sync.
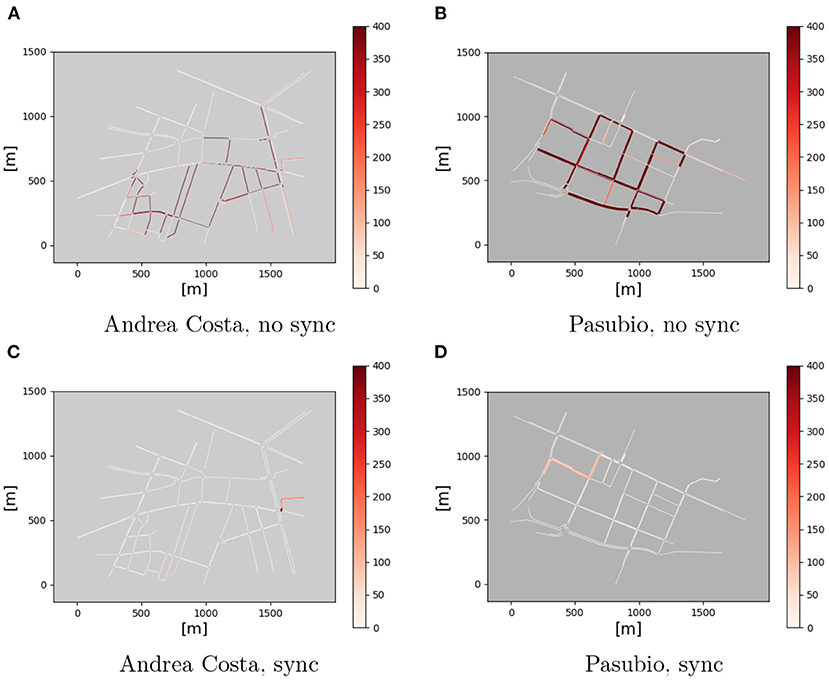
Figure 11. NOx emissions, time interval [2000, 3600]. (A) Andrea Costa, no sync. (B) Pasubio, no sync. (C) Andrea Costa, sync. (D) Pasubio, sync.
It appears evident that, in the No Sync case, the amount of emissions stays almost constant over the time intervals considered. A closer look reveals a slight increase of the emissions with time.
In the Sync case, the pictures highlight that the emissions are significantly lower than the previous case: they decrease significantly in the [2,000, 3,600] interval, when no new vehicle gets injected on the road and the traffic eventually fades out. This fact is completely missing in the No Sync case (Figure 11).
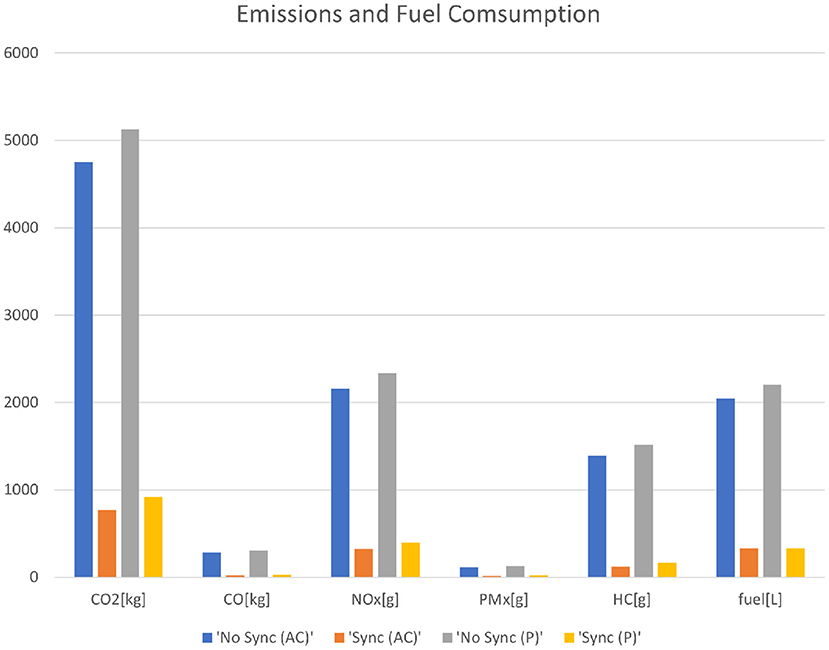
Finally, Table 3 and Figure 12 show the overall decrease in pollution and fuel consumption between the cases with No Sync and Sync for both Andrea Costa (AC) and Pasubio (P).
5. Discussion
In this work, we have evaluated a recently developed MARL approach, MA2C (Chu et al., 2019, 2020), in terms of emission reduction induced in a controlled traffic network. As an ATSC benchmark, we adopted digital representations of the Andrea Costa and Pasubio areas (Bologna, Italy) (Bieker et al., 2015).
We showed that when signalized intersections are coordinated using MA2C, traffic emissions into the environment and fuel consumption decrease significantly with respect to the case without such coordination. This result translates to a very evident reduction of pollutants released into the environment.
Data Availability Statement
The original contributions presented in the study are included in the article/supplementary material, further inquiries can be directed to the corresponding author/s.
Author Contributions
PF: project administration, conceptualization, methodology, formal analysis, investigation, software, validation, visualization, and writing—original draft preparation. MT: pollution data visualization and validation and bibliography management. VR: ‘Related work' section. FP: supervision and resources.
Conflict of Interest
The authors declare that the research was conducted in the absence of any commercial or financial relationships that could be construed as a potential conflict of interest.
Publisher's Note
All claims expressed in this article are solely those of the authors and do not necessarily represent those of their affiliated organizations, or those of the publisher, the editors and the reviewers. Any product that may be evaluated in this article, or claim that may be made by its manufacturer, is not guaranteed or endorsed by the publisher.
Footnotes
1. ^as in Fazzini et al. (2021), to comply the literature on the subject, in this work, we will call the environment feedback “reward” even though it is provided (and perceived) as a penalty.
2. ^the complete list of the symbols used in the equations is reported in Fazzini et al. (2021).
3. ^All the other pollutants, we analyzed (namely CO2, CO, PMx, and HC) exhibit a similar behavior.
References
Arel, I., Liu, C., Urbanik, T., and Kohls, A. (2010) Reinforcement learning-based multi-agent system for network traffic signal control. IET Intell. Transp. Syst. 4, 128. doi: 10.1049/iet-its.2009.0070
Barto, A. G., Sutton, R. S., and Anderson, C. W. (1983). Neuronlike adaptive elements that can solve difficult learning control problems. IEEE Trans. Syst. Man Cybern. (SMC-135), 834–846.
Bazzan, A. L. C., and Klgl, F. (2014) A review on agent-based technology for traffic and transportation. Knowl. Eng. Rev. (29), 375–403. doi: 10.1017/S0269888913000118
Bieker, L., Krajzewicz, D., Morra, A. P., Michelacci, C., and Cartolano, F. (2015). Traffic simulation for all: a real world traffic scenario from the city of Bologna. Lecture Notes in Control and Information Sciences (New York, NY: Springer), 13, 47–60. doi: 10.1007/978-3-319-15024-6_4
Chu, T., Chinchali, S., and Katti, S. (2020). Multi-agent reinforcement learning for networked system control. arXiv: 2004.01339v2.
Chu, T., Wang, J., Codec, L., and Li, Z. (2019). Multi-agent deep reinforcement learning for large-scale traffic signal control. IEEE Transactions on Intelligent Transportation Systems Vol. 21. (IEEE), 1086–1095. doi: 10.1109/TITS.2019.2901791
El-Tantawy, S., and Abdulhai, B. (2012) “Multi-agent reinforcement learning for integrated network of adaptive traffic signal controllers (MARLIN-ATSC),” in 2012 15th International IEEE Conference on Intelligent Transportation Systems (Anchorage, AK: IEEE), 319–326.
Fazzini, P., Wheeler, I., and Petracchini, F. (2021). Traffic signal control with communicative deep reinforcement learning agents: a case study. CoRR, abs/2107.01347.
Gokulan, B. P., and Srinivasan, D. (2010) Distributed geometric fuzzy multiagent urban traffic signal control. IEEE Trans. Intell. Transp. Syst. 11, 714–727. doi: 10.1109/TITS.2010.2050688
Hermes, J. (2012) How traffic jams affect air quality. Available online at: https://www.environmentalleader.com/2012/01/how-traffic-jams-affect-air-quality.
Krajzewicz, D., Hausberger, S., Wagner, P., Behrisch, M., and Krumnow, M. (2014). “Second generation of pollutant emission models for sumo,” in Modeling Mobility with Open Data Vol. 13 (Springer). 203–221.
Kuyer, L., Whiteson, S., Bakker, B., and Vlassis, N. (2008) Multiagent reinforcement learning for urban traffic control using coordination graphs. in Machine Learning and Knowledge Discovery in Databases, Lecture Notes in Computer Science, eds W. Daelemans, B. Goethals, K. Morik, Vol. 5211 (Heidelberg: Springer), 656–671.
Liang, X., Du, X., Wang, G., and Han, Z. (2019) A deep reinforcement learning network for traffic light cycle control. IEEE Trans. Veh. Technol. 68, 1243–1253. doi: 10.1109/TVT.2018.2890726
Lopez, P. A., Wiessner, E., Behrisch, M., Bieker-Walz, L., Erdmann, J., and Flotterod, Y.-P. (2018) Microscopic traffic simulation using SUMO. in 2018 21st International Conference on Intelligent Transportation Systems (ITSC) (Maui, HI: IEEE), 2575–2582.
Mannion, P., Duggan, J., and Howley, E. (2016) An experimental review of reinforcement learning algorithms for adaptive traffic signal control. in Autonomic Road Transport Support Systems, eds T. L. McCluskey, A. Kotsialos, J. P. Mller, F. Klgl, O. Rana, and R. Schumann (Cham: Springer International Publishing), 47–66.
Marini, S., Buonanno, G., Stabile, L., and Avino, P. (2015) A benchmark for numerical scheme validation of airborne particle exposure in street canyons. Environ. Sci. Pollut. Res. 22, 2051–2063. doi: 10.1007/s11356-014-3491-6
Mnih, V., Badia, A. P., Mirza, M., Graves, A., Lillicrap, T. P., Harley, T., et al. (2016). Asynchronous methods for deep reinforcement learning. CoRR, abs/1602.01783.x
Nishi, T., Otaki, K., Hayakawa, K., and Yoshimura, T. (2018) “Traffic signal control based on reinforcement learning with graph convolutional neural nets,” in 2018 21st International Conference on Intelligent Transportation Systems (ITSC) (Maui, HI: IEEE), 877–883.
Rezzai, M., Dachry, W., Moutaouakkil, F., and Medromi, H. (2018) “Design and realization of a new architecture based on multi-agent systems and reinforcement learning for traffic signal control,” in 2018 6th International Conference on Multimedia and Computing Systems (ICMCS) (Rabat: IEEE), 1–6.
Rizza, V., Stabile, L., Buonanno, G., and Morawska, L. (2017) Variability of airborne particle metrics in an urban area. Environ. Pollut. 220, 625–635. doi: 10.1016/j.envpol.2016.10.013
Saxe, A. M., McClelland, J. L., and Ganguli, S. (2014). “Exact solutions to the nonlinear dynamics of learning in deep linear neural networks,” in 2nd International Conference on Learning Representations, ICLR 2014 (Banff, AB).
Sutton, R. S., and Barto, A. G. (1998) Reinforcement Learning: an Introduction (Adaptive Computation and Machine Learning). (Cambridge, MA: Mit Press).
Teodorovi, D. (2008) Swarm intelligence systems for transportation engineering: Principles and applications. Transp. Res. C Emerg. Technol. 16, 651–667. doi: 10.1016/j.trc.2008.03.002.
Wang, Y., Yang, X., Liang, H., and Liu, Y. A review of the self-adaptive traffic signal control system based on future traffic environment. J. Adv. Transp. (2018), 1–12. doi: 10.1155/2018/1096123
Wei, H., Zheng, G., Gayah, V., and Li, Z. (2020) A survey on traffic signal control methods. arXiv: 1904.08117v3.
Wierstra, D., Förster, A., Peters, J., and Schmidhuber, J. (2007). “Solving deep memory pomdps with recurrent policy gradients,” in ICANN‘07 (Berlin: Max-Planck-Gesellschaft, Springer), 697–706.
Keywords: multi-agent systems, reinforcement learning, vehicle flow optimization, traffic emissions, machine learning
Citation: Fazzini P, Torre M, Rizza V and Petracchini F (2022) Effects of Smart Traffic Signal Control on Air Quality. Front. Sustain. Cities 4:756539. doi: 10.3389/frsc.2022.756539
Received: 10 August 2021; Accepted: 25 January 2022;
Published: 18 February 2022.
Edited by:
Sergio Ulgiati, University of Naples Parthenope, ItalyReviewed by:
Danil Prokhorov, Other, Ann Arbor, United StatesNicola Milano, Italian National Research Council, Italy
Copyright © 2022 Fazzini, Torre, Rizza and Petracchini. This is an open-access article distributed under the terms of the Creative Commons Attribution License (CC BY). The use, distribution or reproduction in other forums is permitted, provided the original author(s) and the copyright owner(s) are credited and that the original publication in this journal is cited, in accordance with accepted academic practice. No use, distribution or reproduction is permitted which does not comply with these terms.
*Correspondence: Paolo Fazzini, cGFvbG8uZmF6emluaUBpaWEuY25yLml0
 Paolo Fazzini
 Marco Torre
 Francesco Petracchini
