- 1Mechanical Engineering and Robotics Course, Graduate School of Advanced Science and Technology, Ryukoku University, Otsu, Japan
- 2Mechanical Engineering and Robotics Course, Faculty of Advanced Science and Technology, Ryukoku University, Otsu, Japan
Recently, research on human-robot communication attracts many researchers. We believe that music is one of the important channel between human and robot, because it can convey emotional information. In this research, we focus on the violin performance by a robot. Building a system capable of determining performance from a musical score will leads to better understanding communication through music. In this study, we aim to develop a system that can automatically determine bowing parameters, such as bow speed and bowing direction, from musical scores for a violin-playing robot to produce expressive sounds using reinforcement learning. We adopted Q-learning and ε-greedy methods. In addition, we utilized a neural network to approximate the value function. Our system uses a musical score that incorporates the sound pressure value of each note to determine the bowing speed and direction. This study introduces the design of this system. It also presents simulation results on the differences in bowing parameters caused by changes in learning conditions and sound-pressure values. Regarding learning conditions, the learning rate, discount rate, search rate, and the number of units in the hidden layer in the neural network were changed in the simulation. We used the last two bars of the score and the entire four bars in the first phrase of “Go Tell Aunt Rhody.” We determined the number of units in each layer and conducted simulations. Additionally, we conducted an analysis by adjusting the target sound pressure for each note in the score. As a result, negative rewards decreased and positive rewards increased. Consequently, even with changes in target sound pressure in both the last two bars and the entire four bars, the violin-playing robot can automatically play from the score by improving reinforcement learning. It has become clear that achieving an expressive performance using this method is possible.
1 Introduction
1.1 Unique trends in this research
Communications research has become increasingly active worldwide in recent years. Robots are being developed and used to enable communication between humans and other robots. Examples include industrial robots working in factories, nursing care robots working in hospitals and elderly care facilities, robots that communicate directly with humans through voice, and robots that play musical instruments. These robots can move in ways similar to humans and animals, performing tasks that humans cannot do. Consequently, they have the potential to collaborate and communicate with humans, supporting and enriching people’s lives in various ways.
Research on robots playing musical instruments has been ongoing for a long time. For example, there are organ-playing robots by Kato et al. (1987), MUBOT by Kajitani (1989), guitar-playing robots (Sobh et al., 2003), bagpipe-playing robots (Solis and Ng, 2011), marimba-playing robots (Bretan and Weinberg, 2019), performance robots (Petersen et al., 2010), and saxophone performance robots (Lin et al., 2019), which have become popular. In addition, organ-playing robots (Sugano et al., 1986) have been studied using algorithms that automatically determine performance movements based on musical scores. This study focuses on violins, whose sounds are determined by bowing.
Regarding violin-playing robots, (Kuwabara et al., 2006), and (Min et al., 2013) developed mechanisms and control systems for robot arms and hands. In addition, Toyota Motor Corporation developed a humanoid violin-playing robot (Kusuda, 2008), but no academic research has been conducted on it. This study aims to construct a process for determining playing movements from musical scores as academic research using a violin-playing robot that operates with two humanoid arms (Shibuya et al., 2020a).
Shibuya et al. (2020b) constructed an algorithm to determine the performance motion based on data obtained by analyzing the parameters of bow movement when producing a tone based on the performance of a human violinist. However, this approach applies only to a specific piece of music and not to various pieces, necessitating changes in performance design each time the piece of music changes. Therefore, to improve efficiency, we aim to generate performance sounds according to the target sound pressure using a value function approximation with a reinforcement learning neural network and automate bowing decisions (Shibuya et al., 2020a; Shibuya et al., 2022).
In Shibuya et al. (2020a), only the discount rate γ was considered, whereas in Shibuya et al. (2022), both the discount rate γ and the search rate ε were considered. However, in both studies (Shibuya et al., 2020a; Shibuya et al., 2022b), differences in bowing parameters owing to changes in the maximum and minimum values of the reward, the number of bars in the score, number of units in the hidden layer (middle layer), and target sound pressure value were not considered. Therefore, in this study, we used the analysis results to examine the differences in bowing parameters owing to changes in the maximum and minimum reward values, number of bars in the score, number of units in the hidden layer (middle layer), and target sound pressure value. This approach aimed to address these variations effectively.
1.2 Violin-playing robot
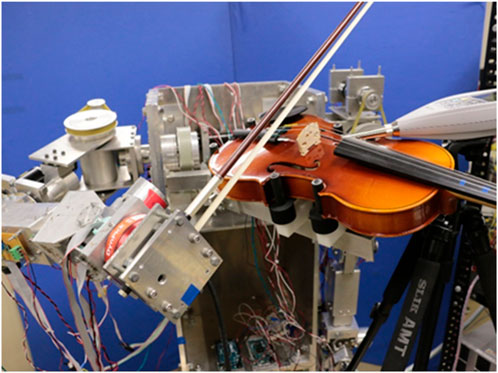
Figure 1 shows the violin-playing robot that is the subject of this study.
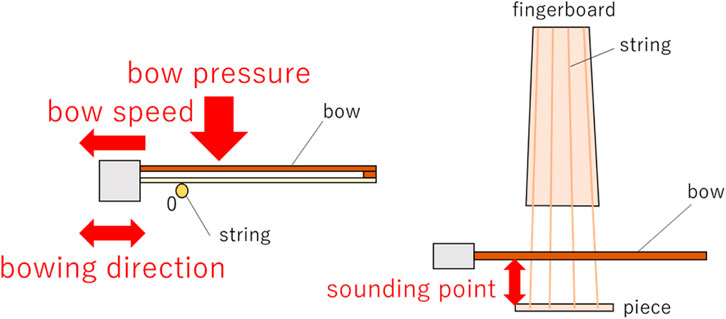
This robot is a humanoid dual-armed robot that has joints with 7 degrees of freedom in both arms and is driven by DC motors. The violin performance of this robot consists of bowing with the right arm, fingering with the left hand, and holding the instrument. Furthermore, the bow movement of the right arm can be divided into bow speed, bow pressure, sounding point, and direction of bow movement, as shown in Figure 2.
1.3 Performance movement plan
It is possible to design the bow speed and bowing direction according to the designated sound pressure without reinforcement learning. However, when including other parameters such as the bow force, fingering, or use of different musical pieces, the complexity of the performance design is greatly increase. In our system, we used reinforcement learning to avoid such issues.
We aim to develop a robot that can automatically determine performance actions based on the piece being played, similar to a human violinist, to achieve an expressive performance. Moreover, we aim to design a robots that can effectively communicate with people through music.
Regarding the motion generation system and its determination of performance motions, we discuss how generated performances differ depending on performance skill, the impact on the sound and audience, and the ability to perform musically regardless of circumstances. These decisions are made from the perspective of the specialized content of mechanical systems engineering.
From the perspective of playing techniques, the main actions are “bowing with the right arm” and “fingering with the left hand.” The ability to adjust bow speed (the speed at which the bow is played) and bow pressure (the force applied to the bow string) varies depending on the performer. In addition, during left-hand fingering, the ability to adjust the force of the fingers when pressing the strings and the accuracy of the pitch also differ depending on the performer. Based on this premise, when generating motions for a short and simple musical score, we can determine how different the performance motions are depending on the bowing and fingering conditions and whether the performance is musical based on the evaluation of the performance sound.
Given that the main body of the violin-playing robot, shown in Figure 1, has been completed as hardware, future work will adopt reinforcement learning to quickly respond to specified sound conditions by adjusting the strength, volume, and other characteristics of the sound. We will develop a system that determines the movement of the bow using the robot’s right arm and improve the system so that the robot can automatically determine the performance motion from the musical score. Simply improving the robot’s hardware has its limitations in determining the robot’s performance movements from musical score data. Therefore, reinforcement learning (a part of machine learning) has been adopted to maximize the total reward.
Rhythm, tone, and note length are also important parameters that should be considered. However, in this study, we focus only on sound pressure for the sake of simplicity. We hypothesize that by following the sound pressure levels of a human violinist, a more human-like performance will be achieved.
2 Methods
2.1 General explanation of Q-learning
In this section, we briefly explain the concept of Q-learning. In the following discussion, let
Here,
2.2 Reinforcement learning for a violin-playing robot
Unlike supervised and unsupervised learning, reinforcement learning does not require data to be input to the robot, and the robot can output data by taking an action while automatically acquiring data. Q-learning is a form of reinforcement learning, and unlike dynamic programming, it does not require a complete model with prior knowledge of the environment. Learning can proceed by approximating the value function via experience gained from state-action interactions. In addition, unlike the actor-critic method, it can update the value of both the state and action simultaneously. Furthermore, unlike the Sarsa method, it can select the action with the greatest value in the next state. Therefore, we used Q-learning in the proposed system.
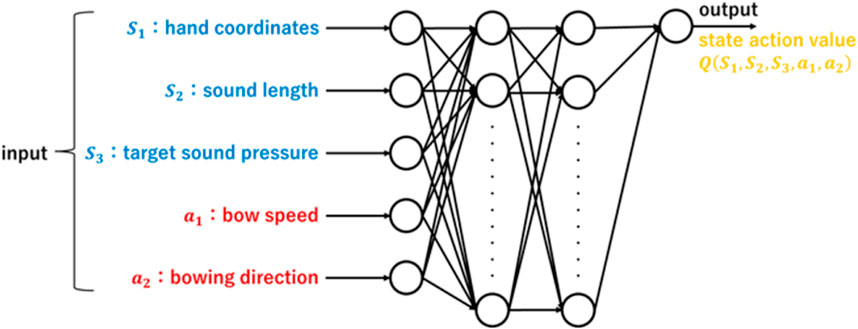
In this study, we used reinforcement learning to determine the performance motions of a violin-playing robot. For state
To determine the bow speed such that the output sound pressure Vo approaches the target sound pressure Vi, it is necessary to derive the relationship between the output sound pressure and bow speed. This relationship is given by Equation 2, where
In addition, the reward is given by Equation 3, where
Here, the value of the constant k is set to 1. If the bow motion generation is successful, the upper limit of the reward
We created a program code in C++ for the last two measures and all four measures of the musical score shown in Figure 4, and reinforcement learning analysis was performed with 300 performance trials. The numbers 1 to 20 shown in Figure 4 are assigned to each note in order from left to right.
In the reinforcement learning parameters, we set the search rate
As the number of hidden layers and their units increases, the calculation time required to approximate the value function increases significantly, and the time required for learning increases accordingly. In some cases, the computational load may make learning impossible. Therefore, the number of hidden layers was set to two, and the number of units was limited to a maximum of 35.
We next consider the number of units. Specifically, when only one hidden layer was used and the number of units was varied, it was determined that 10 or 30 units is suitable for learning. Based on this finding, the number of units used for two hidden layers was set as shown in Table 1.
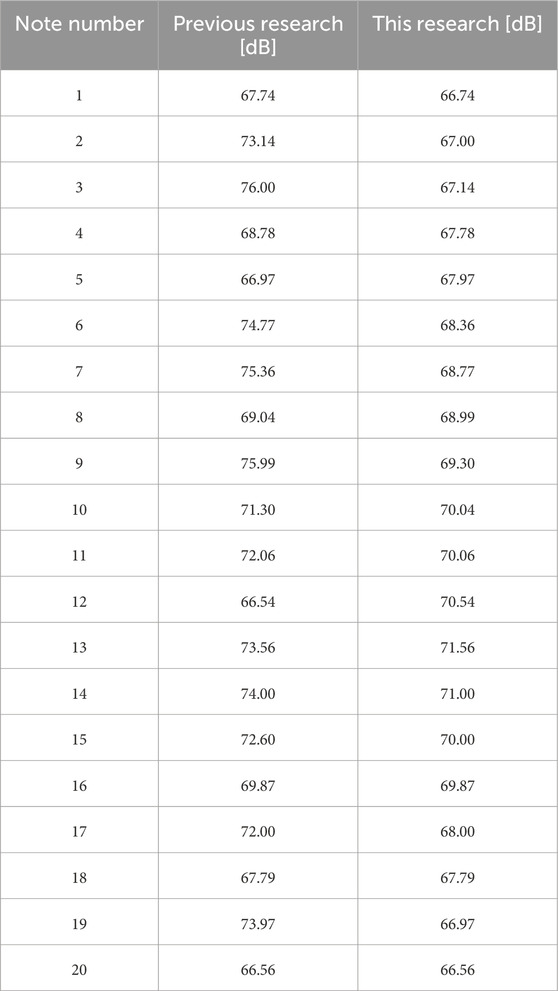
For the target sound pressure of each note in the musical score shown in Figure 4, previous research set sound pressure values based on measurements from actual human violin performances. We determined the target sound pressure level based on the performance experiment reported in (Shibuya et al., 2020a), in which a music college student majoring in violin participated. We subtracted 11 dB from the human data to ensure that the robot produced the target sound pressure. In this study, the sound pressure was set to increase in the first half of the song and decrease in the second half. This pattern is one of many variations in sound pressure. Table 2 presents the target sound pressure of each note in the previous and present studies.
3 Results
First, data were obtained by changing
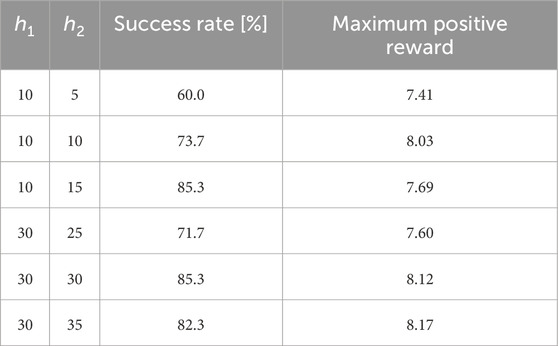
Table 3. Learning success rate and maximum positive reward in the latter two measures of the score and two hidden layers.
From Table 3, it can be observed that the learning success rate exceeds 80% when
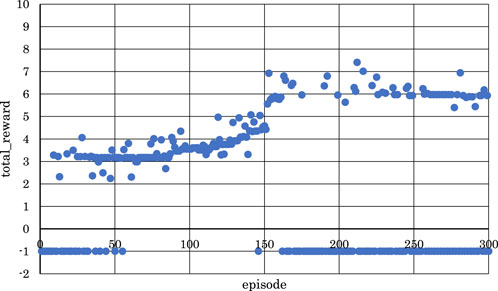
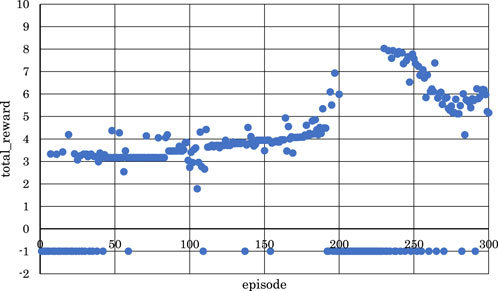
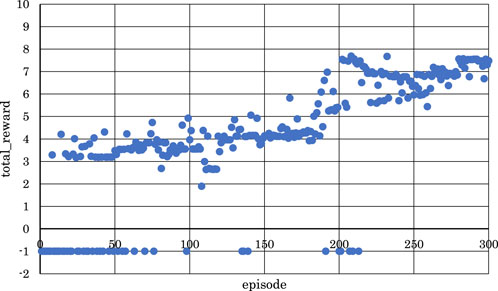
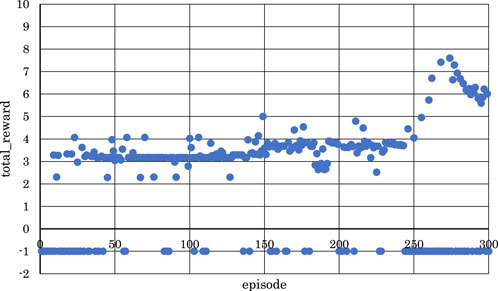
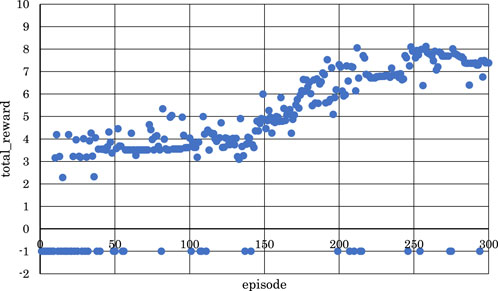
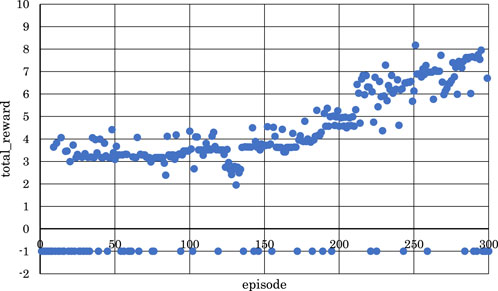
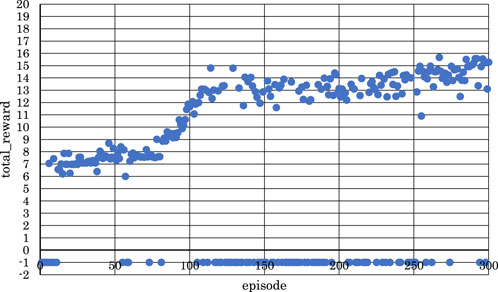
Figures 5–10 show the correlation between the episodes (number of performance trials) and total rewards (sum of rewards for each note in one episode).
From Figures 5, 6, 8, where
Conversely, from Figures 7, 9, 10, where
From the above, it became clear that, reinforcement learning is effective when
Next, based on the results in Table 3 and Figures 5–10, data were obtained by changing
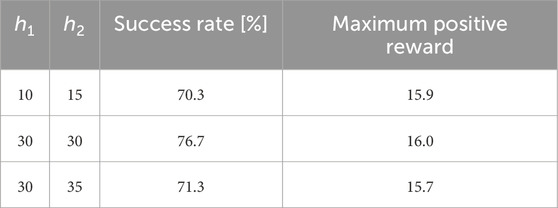
Table 4. Learning success rate and maximum positive reward in the entire four measures of the score and two hidden layers.
From Table 4, you can observe that the highest values for both the learning success rate and the maximum positive reward were achieved when
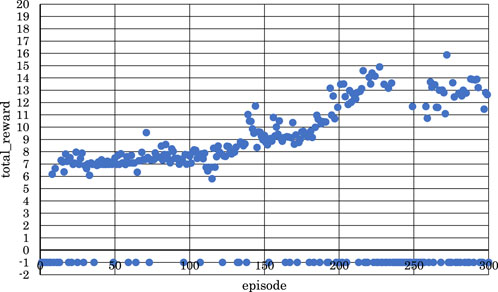
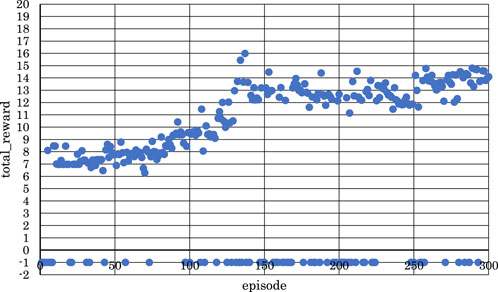
Figures 11–13 show the correlation between the episodes (number of performance trials) and total rewards (sum of rewards for each note in one episode).
From Figure 11, we can observe that the positive rewards, representing success, decreased in the latter half of the learning process when
From Figure 12, it is evident that the positive rewards increased, and the range of increase was wide in the early stages of learning when
From Figure 13, we can see that the positive rewards also increased, but the range of increase was narrower in the early stages of learning when
From these observations, it became clear that reinforcement learning is effective in both the latter two measures and the entire four measures of the musical score shown in Figure 4 when
Finally, with both
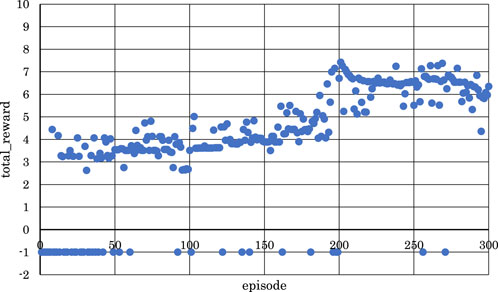
Figure 14. Correlation between episodes and total rewards after changing target sound pressure (2 bars).
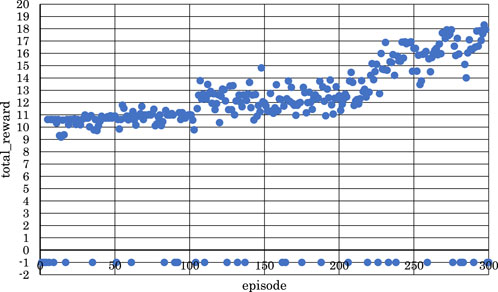
Figure 15. Correlation between episodes and total rewards after changing target sound pressure (4 bars).
As shown in Figure 14, as the number of episodes increased, the negative rewards representing failure gradually decreased, and the positive rewards representing success gradually increased. Similarly, as shown in Figure 15, as the number of episodes increased, the negative rewards representing failure were not continuous, and overall, the positive rewards representing success gradually increased.
In Figure 14, the learning success rate was 86.3%, and the maximum positive reward was 7.43. In addition, as shown in Figure 15, the learning success rate was 88.0%, and the maximum positive reward was 18.3.
From the above findings, it is clear that reinforcement learning was effective even when the number of units in each layer was changed, and the numerical value of the target sound pressure of each note in the score was changed for both the latter two measures and the entire four measures of the musical score, as shown in Figure 4. In other words, it was evident that, as the violin-playing robot succeeded in generating the bow motion, it was able to bring the output sound pressure closer to the target sound pressure and play the violin according to the target sound pressure.
It should be noted that increasing the number of hidden units does not necessarily result in a higher success rate. Therefore, the number of hidden units used in this study was determined to be appropriate, although the understanding of this relationship remains unclear.
4 Conclusion
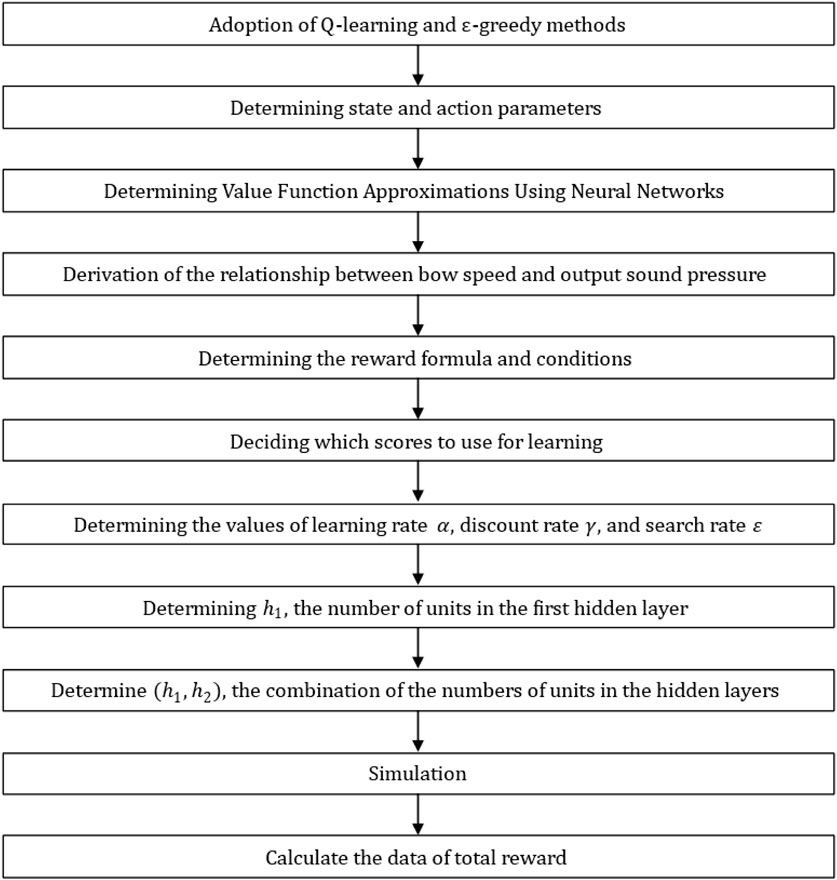
In this study, we examined the number of hidden layers, number of units in each layer, and pattern of sound pressure changes in a piece of music with the aim of enabling a violin-playing robot to automate its playing movements based on musical scores. Using reinforcement learning (Q-learning), we generated a neural network and performed value-function approximation on the network. We carried out the analysis according to the order in Figure 16 and the flowchart in Figure 17.
However, from a musical perspective, the discussion above is limited to the scores shown in Figure 4. Therefore, in the future, we will apply other musical scores (music pieces) in addition to those shown in Figure 4, specify the bar range of the musical score to be subjected to reinforcement learning, perform reinforcement learning analysis (including simulations), and examine changes in the correlation between episodes (number of performance trials) and the total reward (sum of rewards for each note in one episode).
In addition, from the perspective of performance movement when playing the violin, the bow movement of the right arm of the violin-playing robot shown in Figure 1 is limited by the bow speed and direction of bow movement. Therefore, in the future, we will perform reinforcement learning analysis (simulation) that considers not only the bow pressure and sounding point of the robot’s right arm bowing movement but also the fingering of the robot’s left hand. It is necessary to examine the changes in the correlation between episodes (number of performance trials) and total rewards (sum of rewards for each note in one episode).
Furthermore, from the perspective of musical performance planning, the discussion has been limited to the analysis (simulation) of reinforcement learning, and it remains unclear whether reinforcement learning is possible when operating a violin-playing robot on an actual machine.
For example, when generating sounds of the same pitch, there are multiple ways to move the bow, such as “up bow” and “down bow.” The question is whether a violin-playing robot can simultaneously perform bow movement and sound generation, automatically determine the playing motion from the musical score, and play the violin as analyzed.
Therefore, in the future, it will be necessary to operate a violin-playing robot on an actual machine to perform reinforcement learning.
Data availability statement
The original contributions presented in the study are included in the article/supplementary material, further inquiries can be directed to the corresponding author.
Author contributions
KH: Data curation, Investigation, Software, Writing–original draft. KS: Funding acquisition, Supervision, Writing–review and editing.
Funding
The author(s) declare that financial support was received for the research, authorship, and/or publication of this article. This work was supported by JSPS KAKENHI, Grant Number 23K11386.
Conflict of interest
The authors declare that the research was conducted in the absence of any commercial or financial relationships that could be construed as a potential conflict of interest.
Publisher’s note
All claims expressed in this article are solely those of the authors and do not necessarily represent those of their affiliated organizations, or those of the publisher, the editors and the reviewers. Any product that may be evaluated in this article, or claim that may be made by its manufacturer, is not guaranteed or endorsed by the publisher.
References
Bretan, M., and Weinberg, G. (2019). A survey of robotic musicianship. Commun. ACM 56 (5), 100–109. doi:10.1145/2818994
Kajitani, M. (1989). Development of musician robots. J. Rob. Mech. 1 (1), 254–255. doi:10.20965/jrm.1989.p0254
Kato, I., Ohteru, S., Shirai, K., Matsushima, T., Narita, S., Sugano, S., et al. (1987). The robot musician ‘wabot-2’ (waseda robot-2). Robotics 3 (2), 143–155. doi:10.1016/0167-8493(87)90002-7
Kusuda, Y. (2008). Toyota’s violin-playing robot. Industrial Robot Int. J. 35 (6), 504–506. doi:10.1108/01439910810909493
Kuwabara, H., Seki, H., Sasada, Y., Aiguo, M., and Shimojo, M. (2006). The development of a violin musician robot. IEEE. RSJ Int, 18–23.
Lin, J.-Y., Kawai, M., Nishio, Y., Cosentino, S., and Takanishi, A. (2019). Development of performance system with musical dynamics expression on humanoid saxophonist robot. IEEE Robotics Automation Lett. 4 (2), 1684–1690. doi:10.1109/LRA.2019.2897372
Min, B., Matson, E. T., An, J., and Kim, D. (2013). Improvement of violinist robot using a passive damper device. J. Intelligent Robot Syst. 72, pp343–355. doi:10.1007/s10846-012-9799-x
Petersen, K., Solis, J., and Takanishi, A. (2010). Musical-based interaction system for the Waseda flutist robot. Auton. Robot. 28, 471–488. doi:10.1007/s10514-010-9180-5
Shibuya, K., Fukuhara, H., and Nishimura, H. (2022). Motion generation using reinforcement learning for violin-performance robot: effects of discount factor and exploring rate on bowing motion. J. Robotics Soc. Jpn. 40 (10), 924–927. doi:10.7210/jrsj.40.924
Shibuya, K., Kosuga, K., and Fukuhara, H. (2020a) “Bright and dark timbre expressions with sound pressure and tempo variations by violin-playing robot,” in Proc. Of the 29th IEEE international conf. On robot and human interactive communication (RoMan2020), 482–487. doi:10.1109/ROMAN47096.2020.9223503
Shibuya, K., Kosuga, K., and Fukuhara, H. (2020b) “A method for determining playing motions of a violin-playing robot using reinforcement learning,” in Japan society of mechanical engineers robotics and mechatronics conference 2020 (Robomech2020), 2A1–D01.
Sobh, T. M., Wange, B., and Coble, K. W. (2003). Experimental robot musicians. J. Intelligent Robotics Syst. 38 (2), 197–212. doi:10.1023/A:1027319831986
J. Solis, and K. Ng (2011). Musical robots and interactive multimodal systems (Springer-Verlag Berlin Heidelberg Springer). doi:10.1007/978-3-642-22291-7
Keywords: reinforcement learning, humanoid, violin-playing robot, hidden layer, target sound pressure, total-reward
Citation: Horigome K and Shibuya K (2024) Motion-generation system for violin-playing robot using reinforcement learning differences in bowing parameters due to changes in learning conditions and sound pressure values. Front. Robot. AI 11:1439629. doi: 10.3389/frobt.2024.1439629
Received: 28 May 2024; Accepted: 07 November 2024;
Published: 28 November 2024.
Edited by:
Arsen Abdulali, University of Cambridge, United KingdomReviewed by:
Zhipeng He, Sun Yat-sen University, ChinaCaleb Rascon, National Autonomous University of Mexico, Mexico
Copyright © 2024 Horigome and Shibuya. This is an open-access article distributed under the terms of the Creative Commons Attribution License (CC BY). The use, distribution or reproduction in other forums is permitted, provided the original author(s) and the copyright owner(s) are credited and that the original publication in this journal is cited, in accordance with accepted academic practice. No use, distribution or reproduction is permitted which does not comply with these terms.
*Correspondence: Kenzo Horigome, WTI0ZDAwMkBtYWlsLnJ5dWtva3UuYWMuanA=
 Kenzo Horigome
 Koji Shibuya