
94% of researchers rate our articles as excellent or good
Learn more about the work of our research integrity team to safeguard the quality of each article we publish.
Find out more
REVIEW article
Front. Fish Sci. , 19 March 2025
Sec. Fish Experimental Biology
Volume 3 - 2025 | https://doi.org/10.3389/frish.2025.1550222
This article is part of the Research Topic Patterns, causes and consequences of intraspecific variation in environmental tolerance in fishes View all 4 articles
 Courtney H. Babin
 Bernard B. Rees*
The extent of aquatic hypoxia (low dissolved oxygen) has increased in recent times and now threatens aquatic habitats worldwide. Here, we review intraspecific variation in hypoxia tolerance in fish on various scales: geographic variation among populations; variation among genetic strains; variation due to laboratory acclimation; and variation among individuals coming from a given population and having similar exposure history. Metrics of hypoxia tolerance include the oxygen level below which the costs of maintenance can no longer be met by oxygen uptake from the environment; the time or oxygen level at which aquatic surface respiration is conducted; and the time or oxygen levels at which fish lose the ability for coordinated movement. There is great diversity in the range of intraspecific hypoxia tolerance and its association with potential underlying morphological, physiological, and genetic correlates. We advocate for greater standardization of experimental design, enhanced data reporting, and development and validation of new metrics of hypoxia tolerance. With greater understanding of intraspecific variation in hypoxia tolerance, it might be possible to predict which populations, strains, or individuals will fare better during hypoxic episodes; mitigate the effects of low oxygen on fishes; and design breeding protocols to enhance the hypoxia tolerance of fishes.
Low dissolved oxygen concentrations (hypoxia) occur naturally in many aquatic habitats due to the limited solubility of oxygen in water, high rates of biological oxygen consumption, and poor mixing of certain water bodies (1–3). However, the severity, geographic scope, and duration of aquatic hypoxia have increased over the last several decades due to human activities (4–7). At present, aquatic hypoxia poses a significant threat to marine and freshwater ecosystems.
The ray-finned fishes (Actinopterygii) occur in habitats with a wide range of oxygen concentrations (8) and have evolved various means to cope with hypoxic conditions. In environments with chronically low oxygen, some fishes have evolved air breathing mechanisms that allow them to extract oxygen directly from the atmosphere (9). Most fishes, however, rely upon water as their respiratory medium, and aquatic hypoxia poses a challenge to fueling aerobic metabolism in support of activities essential for survival (10, 11). Consequently, fishes rely upon a suite of behavioral, anatomical, physiological, and biochemical strategies when confronted with aquatic hypoxia (12–14). The extent to which different species employ these strategies is influenced by phylogeny, life history, and habitat, resulting in considerable, and well-documented, variation in hypoxia tolerance among fish species (12, 15–17).
There is also considerable variation in hypoxia tolerance within a given fish species. Intraspecific variation in hypoxia tolerance may contribute to the differential survival of certain populations, genetic strains, or individuals in the face of worsening aquatic hypoxia. As such, intraspecific variation provides the raw material for natural selection to act upon, potentially enabling evolutionary adaptation to low oxygen over time (18–20). Thus, it is critical to understand the extent of intraspecific variation in hypoxia tolerance, the underlying morphological, physiological, and biochemical bases for this variation, and the extent to which that variation is heritable.
Here, we review intraspecific variation in hypoxia tolerance in ray-finned fishes. We describe common metrics of hypoxia tolerance and highlight examples demonstrating that these metrics vary at multiple scales of intraspecific comparison, ranging from populations to individuals. To better understand the mechanisms accounting for this intraspecific variation, we explore the anatomical and physiological correlates of this variation, as well as discuss evidence for its genetic basis. We conclude by considering reasons for the diversity in the responses of the hypoxia tolerance metrics and their putative underlying correlates and suggesting avenues for greater understanding into this important issue.
Because the capacity to tolerate hypoxia reflects the integration of behavior, anatomy, physiology, and biochemistry, there are myriad ways to quantify hypoxia tolerance of fishes. These metrics are usually framed in the context of the fish's oxygen uptake (ṀO2) from the environment (Figure 1). In this idealized representation, the minimum ṀO2 at a given ambient temperature is the standard oxygen uptake (ṀO2, standard), which is the ṀO2 required to aerobically fuel the costs of maintenance, without the added costs of activity, growth, or digestion [Figure 1A, solid line; (21)]. The upper limit of ṀO2 is the maximum oxygen uptake (ṀO2, max), and it may be elicited during intense locomotor activity, digestion, after an exhaustive chase, or some combination of these [Figure 1A, dashed line; (22, 23)]. The difference between ṀO2, max and ṀO2, standard is the aerobic scope for activity (24, 25), or simply aerobic scope (AS). Several studies report routine oxygen uptake (ṀO2, routine), which is typically measured on an undisturbed, post-absorptive fish, but which includes some undefined level of spontaneous activity. Values for ṀO2, routine, therefore, fall between ṀO2, standard and ṀO2, max, usually closer to the former.
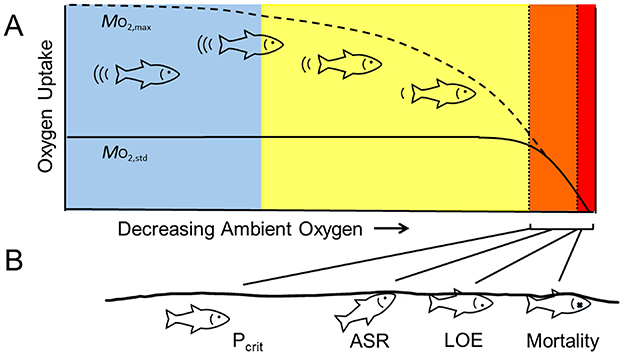
Figure 1. Schematic of fish responses to decreasing ambient oxygen. (A) General patterns of oxygen uptake by fish. The solid line represents the oxygen uptake required for maintenance (ṀO2, standard) and the dashed line represents the maximum oxygen uptake (ṀO2, max). Both ṀO2, standard and ṀO2, max are independent of ambient oxygen levels near fully air-saturated values (blue shading). As ambient oxygen decreases, ṀO2, max becomes limited, but ṀO2, standard is unaffected, thus compressing the capacity to increase oxygen uptake over maintenance levels, i.e., decreasing aerobic scope (yellow shading). With further reduction in oxygen levels, ṀO2, standard cannot be maintained. Over a range of low oxygen, fish can survive, at least temporarily, by a reduction in metabolic rate, an increase in anaerobic ATP production, or both (orange shading). Below this level, survival decreases rapidly (red shading). (B) Metrics of hypoxia tolerance. The critical oxygen tension (Pcrit) corresponds to the oxygen level that limits ṀO2, standard. Near or below this level, some species will conduct aquatic surface respiration (ASR) to ventilate their gills with better oxygenated water at the surface. A more severe reduction in oxygen leads to the loss of equilibrium (LOE), which results in mortality unless fish are returned to well-oxygenated conditions.
As ambient oxygen decreases from the air-saturated value, fish maintain relatively stable ṀO2 across a range of oxygen levels that depends upon the intensity of aerobic metabolism. This pattern of oxygen regulation is widespread among fishes, while oxygen conformity (i.e., a linear decline in ṀO2 as a function of ambient oxygen) is rare (26). Because ṀO2, max is much higher than ṀO2, standard, however, it becomes limited at higher levels of ambient oxygen than ṀO2, standard. When ṀO2, max is limited by oxygen but ṀO2, standard is not, AS progressively declines as oxygen decreases. Upon further reduction of oxygen, a point is reached when ṀO2, standard can no longer be sustained. Below this point, the fish's oxygen uptake decreases and it relies increasingly on anaerobic metabolism, reduces its metabolic rate, or both (13). Because neither strategy can be sustained indefinitely, increasing time at these levels or further reduction in oxygen ultimately results in mortality.
Perhaps the most common metric of the hypoxia tolerance of fish is the oxygen level below which ṀO2, standard cannot be sustained (Figure 1B). When measured as a partial pressure (PO2), this is the critical oxygen tension (Pcrit); when measured as a percentage of the air-saturated value, it is called the critical saturation [Scrit; (27–30)]. Although there may not be universal agreement of how to estimate Pcrit from a record of decreasing ṀO2 vs. oxygen (31), and some researchers question its biological utility (32), Pcrit is still considered to be an ecologically and physiologically meaningful reflection of the fish's capacity to extract oxygen from its environment (33). In addition, it has been tabulated for more species than other metrics of hypoxia tolerance (17, 34).
Many fish use aquatic surface respiration (ASR) to ventilate their gills with the oxygen-rich surface layer when oxygen levels decrease in the bulk of the water column [Figure 1B; (12, 35)]. ASR is widespread among fishes, and it increases the survival of fish at low oxygen (35). However, this behavior is associated with an increased risk of predation, especially by aerial predators, and there may also be a metabolic cost to maintaining position near the surface (36, 37). Therefore, ASR is not common at high or intermediate levels of oxygen, but it increases dramatically as oxygen levels go below Pcrit. When individual fish are exposed to controlled reductions in ambient oxygen, ASR can be quantified either as the PO2 when this behavior is first observed or as the elapsed time before it occurs (38). When groups of fish are assessed, ASR has been quantified as the oxygen level corresponding to a certain proportion of individuals engaging in ASR or as the proportion of time spent by a focal individual conducting ASR. For example, ASR50 could be the oxygen level when 50% of the group is engaged in ASR or the oxygen level when 50% of the time is spent in ASR (12).
As oxygen is further lowered, fish lose their capacity for coordinated movement and lose their ability to right themselves. This point is termed loss of equilibrium (LOE; Figure 1B). Because this failure would almost certainly result in mortality in the field, it has also been referred to as the incipient lethal oxygen level (ILOL; or ILOS or ILOC for incipient lethal oxygen saturation or oxygen concentration, respectively). LOE can be quantified as an oxygen level (PO2, percent saturation, or concentration) or as a time to onset in a reproducible hypoxia challenge (38, 39). Although LOE would essentially equal death in an ecological setting, in the laboratory, fish usually recover completely if immediately transferred to water having higher oxygen levels. Because of this, LOE has largely replaced mortality as an experimental endpoint due to concerns for animal care and welfare. Importantly, Claireaux et al. (39) showed that fish with longer times to LOE during laboratory exposures enjoyed greater survival than fish with shorter times to LOE when subsequently maintained in semi-natural outdoor enclosures, arguing for a link between this metric of hypoxia tolerance and fitness.
The metrics above are point measurements that show how fish respond when oxygen levels drop to or below the minimum needed for maintenance metabolism. Because AS reflects the aerobic costs of various fitness-related activities (10), it is possible that any reduction in oxygen level that compresses AS could have negative impacts. Hence, an alternative measure of hypoxia tolerance is the curve that describes the decrease in ṀO2, max as a function of decreasing oxygen, or the limiting oxygen level curve (40–42), recently reformulated as the hypoxia performance curve (43, 44). To determine this curve, fish are induced to reach ṀO2, max, generally by motivating them to increase locomotor activity, at several oxygen levels between fully air-saturated conditions and Pcrit. If the fish's ṀO2, standard is also known, then one can determine AS and plot it as a function of oxygen. This function can be used to determine a point estimate of hypoxia tolerance, for example the oxygen level that compressed AS by 50% [PAAS − 50; (43, 44)]. This approach is arguably more integrative and perhaps more ecologically relevant given the ranges across which oxygen levels vary in nature. However, it is time and resource intensive, requiring the determination of ṀO2 of active animals at a variety of oxygen levels. Nevertheless, recent developments in respirometry (45, 46) increase the feasibility of this approach.
Another recently proposed metric is the oxygen supply capacity [α; (47, 48)]. This approach posits that the relationship between ṀO2, max and oxygen level is linear and that the slope, α, reflects the maximum capacity for oxygen extraction from the environment by the fish. If the relationship is linear and goes through the origin, then α can be estimated at any oxygen level as ṀO2/PO2 as long as the fish is near or at its ṀO2, max. According to this proposal, Pcrit is simply one point on this line (the PO2 when ṀO2, max = ṀO2, standard), and therefore α = ṀO2, standard/Pcrit. Although the condition that the relationship between ṀO2, max and oxygen level describes a straight line may apply to some species (48, 49), both theoretical considerations and empirical studies on other species suggest that these conditions do not apply universally (50). Hence, its utility as a broadly applicable metric of hypoxia tolerance requires further validation (51).
Other measures of hypoxia tolerance have been proposed, such as the regulation index [RI; (32, 52)]. However, Pcrit and oxygen or time thresholds for ASR and LOE are the most regularly reported measures of hypoxia tolerance and will be the focus of this review.
The purpose of this review was to address intraspecific variation in the hypoxia tolerance of ray-finned fishes, specifically as determined by Pcrit, ASR, or LOE. We searched Web of Science and Google Scholar using the following terms: (hypoxia or hypoxia tolerance) AND (intraspecific variation, interindividual variation, population variation, or acclimation) AND (fish or fishes). Abstracts were reviewed to ensure that the publications dealt with ray-finned fishes (not “shellfish” or cartilaginous fishes) and included quantitative data on one or more of the three metrics of hypoxia tolerance considered here. Additional references were obtained by examining the literature cited sections of these publications, as well as by searching studies that had subsequently cited them. Additional studies relevant to Section 8 (Genetic Basis of Intraspecific Variation in Hypoxia Tolerance) were recovered by adding the search term (heritability or selection or fitness or GWAS). Although it is likely that some relevant studies were missed by these search strategies, we suggest that those included here are representative of the general patterns of intraspecific variation in hypoxia tolerance among fishes.
The term “intraspecific” includes many scales of variation, which we have summarized in four categories (Figure 2): variation among geographic locations that differ in oxygen availability or other abiotic characteristics; variation among genetic strains, for example, of commercially important aquaculture species; variation arising from laboratory acclimation to low oxygen; and variation in hypoxia tolerance among individuals from a given population and held under similar conditions, sometimes referred to as interindividual variation. Some publications included data relevant to multiples scales, for example, comparing how fish from different populations respond to laboratory acclimation or how genetic strains might show similar or divergent patterns of interindividual variation. Tables 1–4 present the publications reviewed here according to these four scales of intraspecific variation.
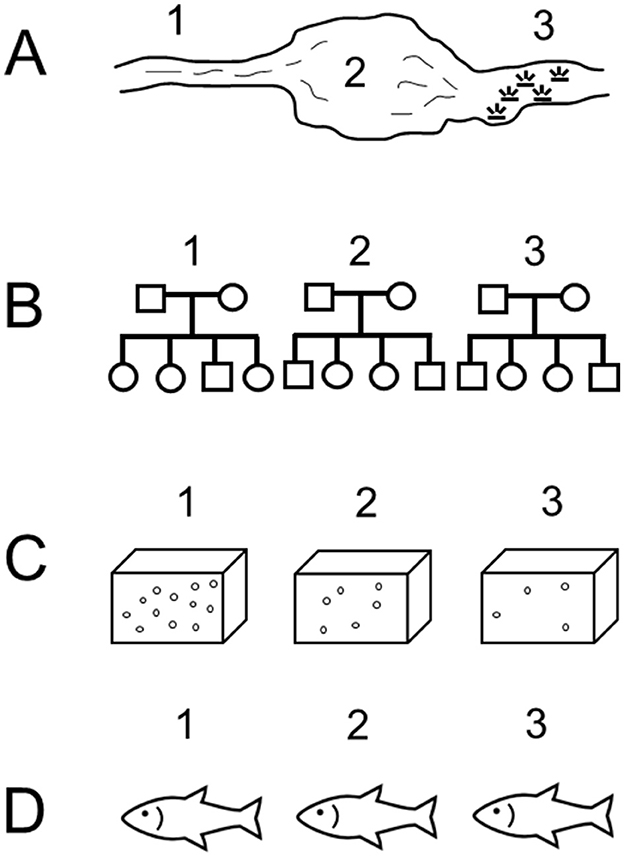
Figure 2. Schematic representation of differing scales of intraspecific variation in hypoxia tolerance. (A) Variation in three fish collections from different geographic regions that vary in oxygen availability or other characteristics, for example river (1), lake (2), or marsh (3) habitats. (B) Variation among genetic strains or families of fish (1–3). (C) Variation due to laboratory acclimation, for example to high (1), medium (2), or low (3) levels of oxygen. (D) Variation among three individuals (1–3) that come from the same population or genetic strain and having similar exposure histories to low oxygen.
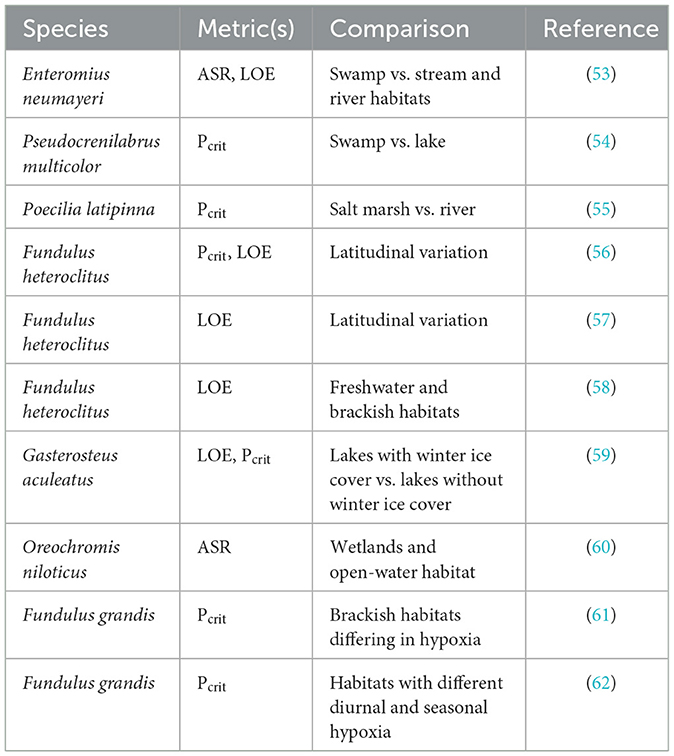
Table 1. Studies of geographic variation in hypoxia tolerance of fishes.
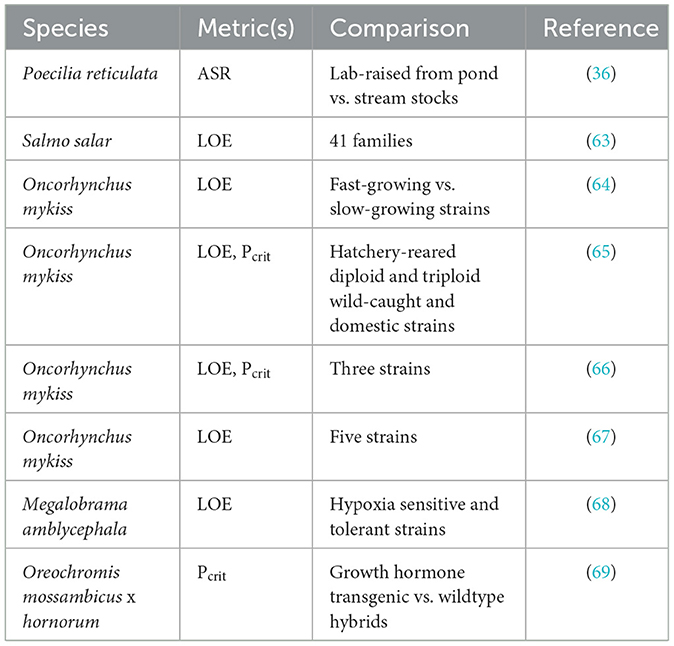
Table 2. Studies of genetic strain or family variation in hypoxia tolerance of fishes.
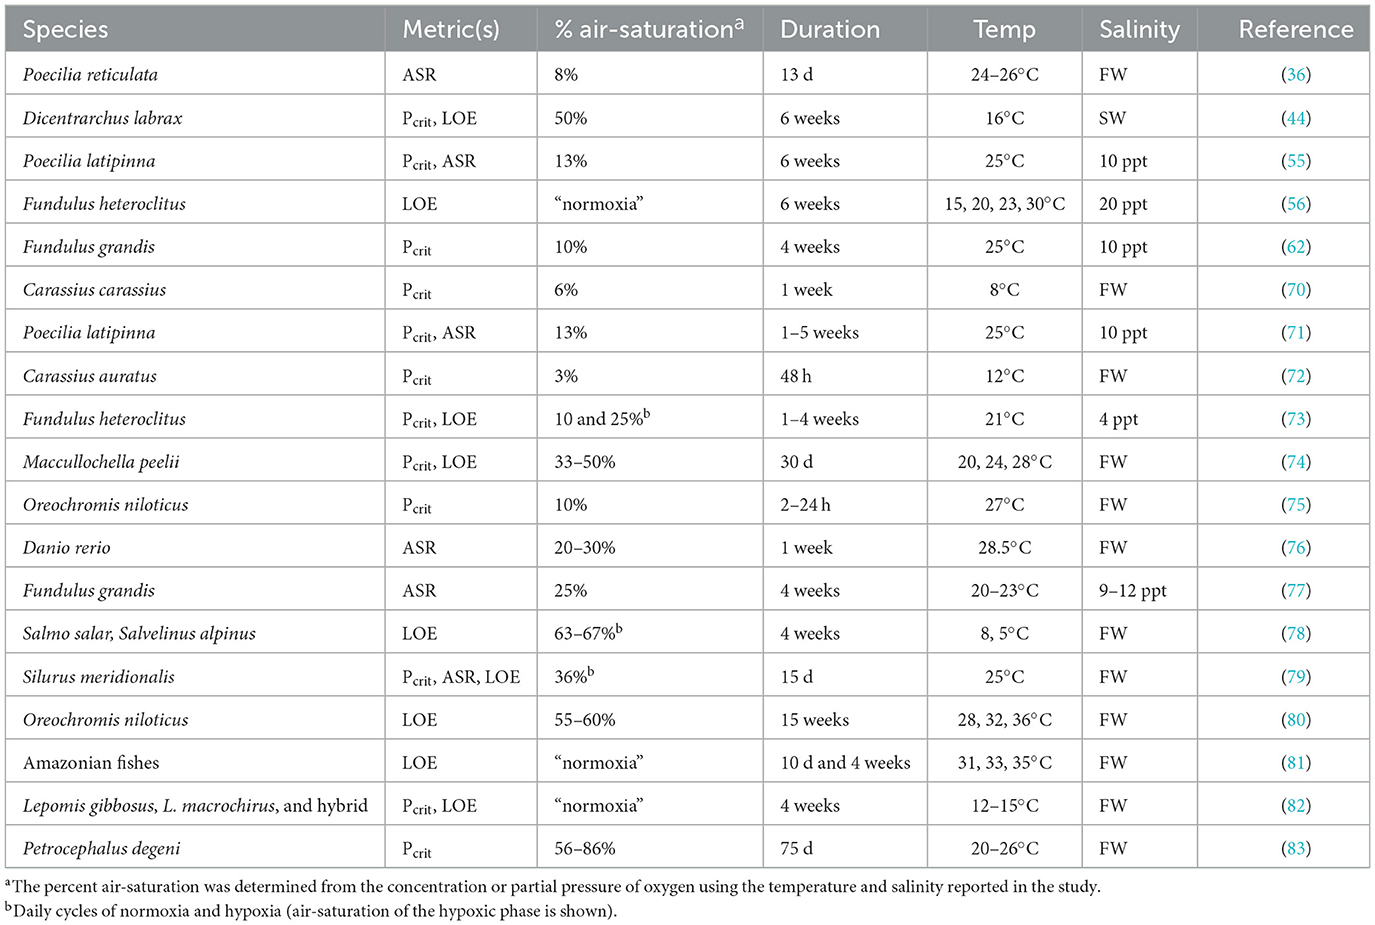
Table 3. Studies of the effects of laboratory acclimation on hypoxia tolerance of fishes.
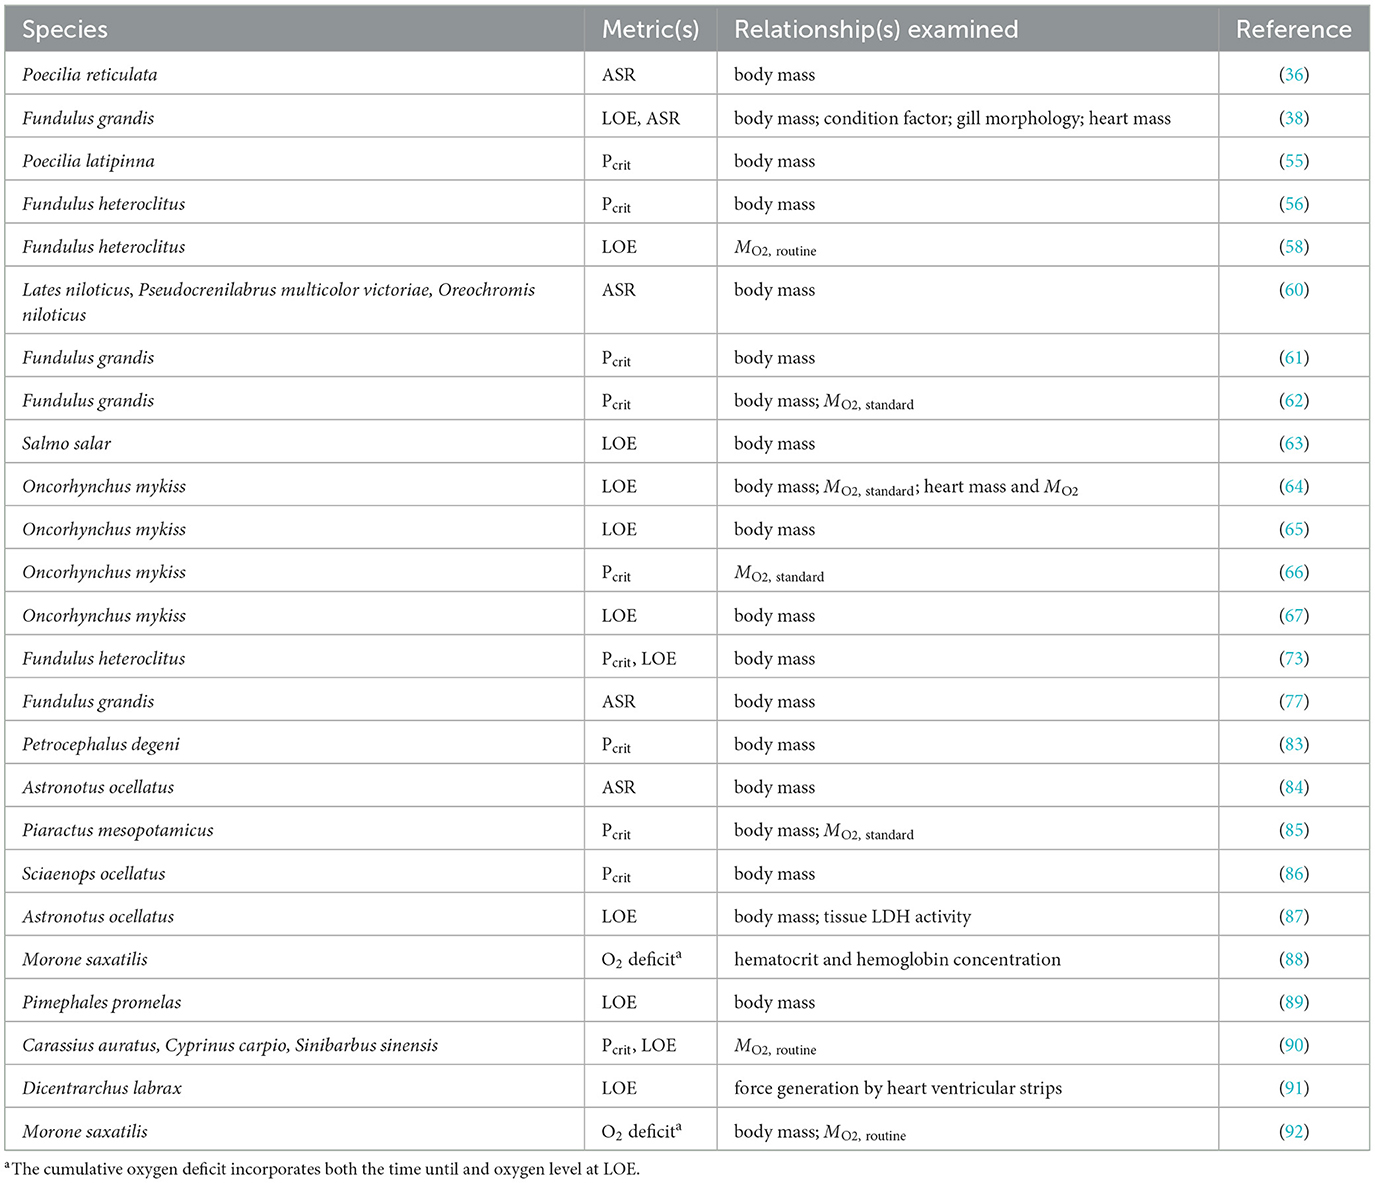
Table 4. Studies of interindividual variation in hypoxia tolerance of fishes.
Within each scale of variation, we highlight the links between variation in hypoxia tolerance metrics and potential underlying traits. These traits fall into two broad categories: those which ought to improve the fish's capacity to extract oxygen from the environment and deliver it to the tissues (e.g., gill morphology; heart size and performance; blood oxygen carrying capacity) and those that improve the tolerance of fish to the lack of oxygen [e.g., reduced aerobic metabolism; increased capacity for anaerobic metabolism; (14)]. For studies of population, strain, and acclimation effects, the link between a particular metric of hypoxia tolerance and these traits is typically inferred from concordant changes in mean values among groups. For studies of interindividual variation, these links are further supported by statistical correlations between trait values measured in many individuals. Thus, one caveat to these analyses is that they demonstrate correlations, rather than causal, mechanistic relationships between hypoxia tolerance and these traits. Furthermore, there are instances when these relationships are not observed, and we provide counter examples, where available.
Moreover, except for selected examples, we do not address the topic of cross-tolerance, i.e., where the exposure to one abiotic or biotic stressor improves the tolerance to another one (93). The interactive effects of low oxygen and high temperature are particularly relevant given current trends in global climate, and they have been reviewed elsewhere (94). Finally, we do not consider variation that might arise during development or ontogeny (95, 96), nor that due to exposure of previous generations to low oxygen (97).
Evidence for geographic variation in hypoxia tolerance in fish comes from the work by Chapman and her colleagues on the respiratory ecology of African fishes. Olowo and Chapman (53) showed that Neumayer's barb (Enteromius neumayeri, formerly Barbus neumayeri) from oxygen-poor papyrus swamps initiated ASR at lower oxygen levels and displayed a lower frequency of LOE than conspecifics from nearby well-oxygenated streams and rivers. Chapman and Liem (98) had previously shown that barbs from swamps have larger gills, which could contribute to these differences. Chapman et al. (54) reported that swamp-dwelling Egyptian mouth brooder (Pseudocrenilabrus multicolor) had lower Pcrit than lake-dwelling fish, a difference that was associated with greater gill surface area in fish from swamps. Similarly, sailfin molly (Poecilia latipinna) sampled from a periodically hypoxic salt marsh had lower Pcrit, longer gill filaments, and larger total gill surface area than fish from a normoxic river (55).
Mummichog, Fundulus heteroclitus, sampled from populations along the Atlantic coast of North America vary in hypoxia tolerance. When held at a common temperature, fish from a southern population have significantly lower Pcrit and longer times to LOE than fish from a northern population (56). Both observations suggest that southern fish are more hypoxia tolerant, consistent with the expectation of greater frequency of aquatic hypoxia in the warmer waters inhabited by southern populations. Southern fish have lower ṀO2, routine, which could improve their tolerance under oxygen-limiting conditions. However, southern fish were found to have smaller gill surface areas, which is opposite of the expectation that larger gills contribute to greater hypoxia tolerance (56). Healy et al. (57) demonstrated that the difference in time to LOE between northern and southern mummichog populations was seen across a much narrower latitudinal gradient, from northern to southern New Jersey, coinciding with a steep cline in mitochondrial DNA haplotype. In addition, mummichogs sampled along a salinity gradient demonstrated differences in time to LOE, with fish from brackish water having longer times to LOE than fish from freshwater (58). This difference is consistent with the lower oxygen solubility in brackish water and the expectation of a higher incidence of hypoxia compared to freshwater habitats.
Hypoxia also occurs in high latitude lakes during winter when ice coverage restricts diffusion of atmospheric oxygen. Regan et al. (59) showed that three-spine stickleback (Gasterosteus aculeatus) from a lake that ices over in the winter had significantly longer times to LOE compared to fish sampled from a lake that is not covered by ice. This difference was attributed to a greater capacity for metabolic rate reduction rather than a difference in oxygen extraction, as Pcrit did not differ between populations.
These examples of geographic variation in hypoxia tolerance are balanced by other examples showing limited or no variation. Reid et al. (60) found no difference in the frequency of ASR in Nile tilapia (Oreochromis niloticus) from hypoxia-prone wetlands compared to an open-water lake habitat. In Gulf killifish (Fundulus grandis) sampled from wetlands along the northern Gulf of Mexico that experience differing degrees of hypoxia, Everett and Crawford (61) reported differences in ṀO2 under hypoxia, but not in Pcrit. Reemeyer and Rees (62) also failed to find differences in Pcrit in Gulf killifish sampled from areas within a single estuary having differing seasonal oxygen profiles. Clearly, the extent to which hypoxia tolerance varies geographically will be influenced by the degree to which sites are spatially and physico-chemically distinct and the rates of gene flow between them.
Geographic variation in hypoxia tolerance can arise from genetic differences, long-lasting effects of previous exposure to differing environments, or some combination of these effects. A genetic basis is supported by observations that hypoxia tolerance differs among families or genetic strains within a species, even when reared under identical conditions. In early studies of ASR, Kramer and Mehegan (36) noted that laboratory-reared guppies (Poecilia reticulata) originating from a heavily vegetated shallow pond engaged in ASR less frequently during severe hypoxia than guppies originating from a well-oxygenated stream, suggesting that the former were more tolerant of hypoxia. In salmonids, Anttila et al. (63) demonstrated differences in time to LOE among families of Atlantic salmon (Salmo salar), and Roze et al. (64) showed that a fast-growing strain of rainbow trout (Oncorhynchus mykiss) had longer time to LOE and a lower oxygen saturation at LOE than a slow-growing strain. In Roze et al. (64), the difference in hypoxia tolerance between strains could be attributed, at least in part, to larger body size in the fast-growing strain (see Section 7.1, below). Scott et al. (65) also found an effect of strain on the time to LOE in rainbow trout. This effect was observed after correction for differences in body mass, but there was a strong annual effect on which strain proved most tolerant or even whether strains differed at all. Moreover, in a year when strains differed in time to LOE, they did not vary in Pcrit (65). On the other hand, Zhang et al. (66) found that the Pcrit and the oxygen saturation at LOE showed significant and concordant variation among three strains of rainbow trout. Within each strain, Pcrit was positively correlated with ṀO2, standard, supporting the view that fish with lower aerobic maintenance costs can endure greater reduction in ambient oxygen levels (see Section 7.2). Strowbridge et al. (67) further showed that differences in the oxygen saturation at LOE among rainbow trout strains, although small in magnitude, were consistent between fry and yearling life stages. Genetic strains of blunt snout bream (Megalobrama amblycephala) show consistent differences in the oxygen saturation at LOE across a temperature range of 10 to 30°C (68). These differences were associated with differences in gill morphology, red blood cell number and hemoglobin concentration, and polymorphism in a gene involved in oxygen sensing (see Section 8.3). A counter example to the observation of strain differences in hypoxia tolerance is that growth-hormone transgenic and wildtype hybrid tilapia (Oreochromis mossambicus x hornorum) have similar Pcrit, even though the transgenic strain displayed higher resting ṀO2, presumably due to a higher aerobic cost of growth (69).
While the observation of population, family, and strain differences in metrics of hypoxia tolerance suggest these traits have genetic bases, acclimation studies have demonstrated considerable phenotypic plasticity in each metric of hypoxia tolerance. Laboratory exposure to low oxygen brings about a decrease in Pcrit in crucian carp [Carassius carassius; (70)], sailfin mollies (55, 71), goldfish (Carassius auratus; 78), mummichog (73), Gulf killifish (62), and European seabass (Dicentrarchus labrax; 44). Although most acclimation studies are on the order of weeks in duration, the change in Pcrit in goldfish was observed after only 2 days of exposure to low oxygen (72). A change in Pcrit, however, is not a universal response to low oxygen acclimation: Pcrit was not altered by acclimation to hypoxia in Murray cod (Maccullochella peelii; 80) or Nile tilapia (75), although the former study used a relatively moderate hypoxia treatment (50% air-saturation), and the latter study was short in duration (24 h).
There are fewer studies on the effects of low oxygen acclimation on ASR and LOE, but like studies of Pcrit, they provide some support for phenotypic plasticity in these metrics. In an early study of hypoxia acclimation in the mummichog, Greaney et al. (99) noted that “hypoxic fish attempted to ‘breathe' at the surface”, but that after 3 weeks of hypoxia, fish “no longer remained at the surface”. Although the authors did not expressly identify this behavior as ASR, it strongly suggests that acclimation to hypoxia reduces the frequency of ASR. Kramer and Mehegan (36) noted that guppies spent less time conducting ASR within days of beginning an experimental exposure to low oxygen. This effect differed in extent between sexes, with a more dramatic decrease in the frequency of ASR by males than females. In the closely related sailfin molly, the frequency of ASR decreased as the duration of hypoxic acclimation increased from 1 to 5 weeks, also showing a steeper decline in males than females (71). Acclimation to hypoxia leads to a reduction in the cumulative time that adult zebrafish spend conducting ASR, as well as a potential decrease in the threshold PO2 for the onset of ASR (76). In contrast, acclimation to hypoxia for 4 weeks was not associated with a change in frequency of ASR by Gulf killifish, even though there was evidence of acclimatization to summer hypoxia in the field (77).
With respect to LOE, acclimation of mummichog to 1 to 4 weeks of continuous hypoxia lowered the PO2 prior to LOE compared to normoxic controls (73). In Murray cod, hypoxic acclimation also resulted in a decrease in the oxygen level at LOE, with the extent of this reduction depending upon the duration and temperature of hypoxic treatments (74). Similarly, hypoxic acclimation led to lower PO2 at LOE in European seabass (44).
The above results were measured after acclimation to constant hypoxia in the laboratory. In nature, oxygen levels go through pronounced diurnal cycles in many habitats, with the lowest oxygen levels occurring at night. Consequently, laboratory exposures to cycles of nighttime hypoxia and daytime normoxia are more realistic of natural conditions in these habitats. When Chinese large-mouth catfish (Silurus meridionalis) were acclimated to daily cycles of hypoxia, Pcrit, ASR, and LOE all improved (i.e., occurred at lower oxygen levels), compared to fish held in continuous normoxia (79). When Atlantic salmon (Salmo salar) were acclimated to daily cycles of hypoxia, the time to LOE increased, whereas the response of Arctic char (Salvelinus alpinus) depended upon acclimation temperature (78). In the mummichog, the effects of acclimation to cycling hypoxia on Pcrit and LOE were less pronounced than during acclimation to constant hypoxia (73). Depending upon the severity and duration of intermittent hypoxia, values for Pcrit and the PO2 at LOE did not differ from normoxic controls, suggesting that constant and cycling hypoxia elicit distinct physiological responses (73).
Considering that fish from populations experiencing different thermal environments differ in their hypoxia tolerance (62, 63; Section 4), it is relevant to briefly consider the effects of thermal acclimation on metrics of hypoxia tolerance. Acclimation of mummichog to warm temperatures led to increased hypoxia tolerance, as reflected by longer time to LOE compared to their cool-acclimated counterparts (56), which parallels the greater hypoxia tolerance of fish from southern populations (56, 57). The beneficial effects of warm acclimation are likely to be limited to moderate elevations in temperature, however, because acclimation to temperatures higher than those optimal for growth and survival decreases hypoxia tolerance (shorter times LOE) in Nile tilapia (80) and a variety of Amazonian fishes (81). For a more extensive discussion of the interaction between thermal acclimation and hypoxia tolerance, see Earhart et al. (94).
The reduction in Pcrit in hypoxia-acclimated crucian carp is associated with a dramatic increase in the length and area of gill lamellae available for gas exchange (70). This change is rapid, reversible, and arises from a decrease in the abundance of cells between neighboring lamellae rather than new growth of lamella (70). This interlamellar cell mass (ILCM) regresses during exposure to low oxygen or elevated temperature, thereby improving the capacity for oxygen extraction by fishes in challenging environments (70, 100–102). Consistent with this, the decrease in Pcrit in hypoxia-acclimated goldfish is associated with an increase in the exposed length and surface area of gill lamellae, presumably due to a reduction in the ILCM (72). Although the capacity for gill remodeling via changes in the ILCM appears to be widely distributed among fishes (101, 103), evidence for its involvement in the response to hypoxic acclimation of other fishes is mixed. Borowiec et al. (73) did not report changes in the ILCM in hypoxia-acclimated mummichog; rather they noted shorter gill filaments during both short-term constant hypoxia and chronic intermittent and constant hypoxia, as well as fewer gill filaments during chronic constant hypoxia compared to normoxic controls. These changes are opposite those predicted for fish with improved hypoxia tolerance. On the other hand, McBryan et al. (56) reported an increase in lamellar height, in parallel with regressed ILCM, during acclimation of mummichogs to elevated temperature. This effect of thermal acclimation on gill morphology was associated with an increase in the time to LOE (see Section 6.4, above), but no corresponding change in Pcrit (56). It is important to note that even in the absence of changes in gill gross morphology (ILCM regression, lamellar surface area), hypoxia dependent changes in the fine structure (dimensions of the gill epithelium and vasculature) could improve oxygen uptake by decreasing the diffusion distance between water and blood (104).
Acclimation to low oxygen typically results in changes in blood variables that should improve the oxygen capacity for oxygen transport: hematocrit, red blood cell count, and/or whole blood hemoglobin concentration. These changes are associated with lower Pcrit, lower PO2 at LOE, or longer times to LOE in sailfin mollies (71), goldfish (72), and mummichogs (73). In mummichogs, acclimation to hypoxia also brings about a decrease in the erythrocytic concentration of ATP, a negative allosteric regulator of oxygen affinity (99). This change is expected to increase the oxygen affinity of hemoglobin and improve the gradient for oxygen diffusion into the animal from a hypoxic environment (105, 106). On the other hand, hematocrit, hemoglobin concentration, and relative heart mass were unchanged after acclimation of European seabass to hypoxia, conditions that brought about decreases in Pcrit and the PO2 at LOE (44).
The tolerance to low ambient oxygen should increase in fish with lower maintenance or routine aerobic costs. Despite this expectation, acclimation to hypoxia has diverse effects on ṀO2, standard and ṀO2, routine. Parallel decreases in Pcrit and ṀO2, standard and/or ṀO2, routine have been measured after hypoxia acclimation in goldfish (72), the mummichog (73), and European seabass (44). In sailfin mollies and Chinese large-mouth catfish, however, the lower Pcrit measured after hypoxia acclimation occurred with no changes in ṀO2, routine (55, 79). In the Gulf killifish, hypoxia acclimation led to lower Pcrit but higher ṀO2, standard (62). Some of this diversity might be explained by different methods for determining Pcrit, ṀO2, standard, and ṀO2, routine (21, 31). For example, ṀO2, standard is frequently measured in the same respirometry trial after estimating ṀO2, max by exhaustive chasing. In such an experimental design, the clearance of metabolic end products might contribute to a higher ṀO2, standard, particularly under hypoxia (62). The effects of hypoxia acclimation on other metrics of hypoxia tolerance also show mixed relationships with ṀO2, standard or ṀO2, routine. In mummichog and European seabass, hypoxia acclimation brings about lower PO2 at LOE that is associated with lower ṀO2, standard and/or ṀO2, routine (44, 73). However, acclimation of Chinese large-mouth catfish to intermittent hypoxia, which brought about decreases in both the PO2 at LOE and the PO2 prior to ASR, was not associated with a change in ṀO2, routine relative to normoxic fish (79).
The standard holding conditions for laboratory fish are likely to be better oxygenated and more stable than their natural habitats. Of course, there are many factors besides oxygen level that differ between field and laboratory settings, including the presence of predators, type and quantity of food, and water clarity and chemistry. Nevertheless, it is reasonable to ask if fish brought into a controlled laboratory environment show changes in hypoxia tolerance opposite of those expected for acclimation to low oxygen. Borowiec et al. (82) captured pumpkinseed sunfish (Lepomis gibbosus), bluegill sunfish (L. macrochirus), and their hybrid, and measured various traits related to hypoxia tolerance within 24 h of capture or after a minimum of 4 weeks of acclimation to well-oxygenated laboratory conditions. Wild-caught fish had greater hypoxia tolerance, as evidenced by lower Pcrit and PO2 at LOE, than laboratory-acclimated fish. This difference was associated with greater gill surface areas and higher hematocrit in wild-caught fish (105). When the African electric fish Petrocephalus degeni was collected from low-oxygen swamps and acclimated to well-aerated water, gill filament length and hemoglobin decreased during laboratory acclimation (83). However, there was not a corresponding change in Pcrit, suggesting that this metric of hypoxia tolerance is not obligatorily linked to these morphological and hematological traits.
The size of an individual, generally measured as body mass (Mb), has profound effects on numerous biological functions (107). Nilsson and Ostlund-Nilsson (108) presented theoretical arguments for Mb to differentially affect metrics of hypoxia tolerance. Based upon scaling relationships for gill surface area, aerobic metabolism, and anaerobic metabolic potential, they argued that Pcrit ought to be weakly related or unrelated to Mb, whereas large fish would have a benefit at oxygen levels below Pcrit, measured as either a longer time before LOE or a lower PO2 at LOE. Nilsson and Ostlund-Nilsson (108) presented data from individuals spanning more than 3 orders of magnitude in Mb from 50 species of damselfishes (Pomacentridae) that supported these predictions.
Within species, however, the effects of body size are highly variable for all three of the hypoxia tolerance metrics considered here. In a study of oscars (Astonotus ocellatus), Sloman et al. (84) observed that large individuals were able to regulate MO2 to lower PO2 compared to smaller fish. Although they did not directly measure Pcrit, this observation is consistent with a negative relationship between Pcrit and Mb. Pcrit is also negatively related to Mb in Gulf killifish (61, 62). Interestingly, in Gulf killifish, this relationship was not observed after acclimation to low oxygen, high temperature, or low salinity (62). Pcrit and Mb were unrelated in the mummichog (56, 73), sailfin mollies (55) and pacu [Piaractus mesopotamicus; (85)]. Finally, Pcrit increases with Mb in red drum [Sciaenops ocellatus; (86)] and the electric fish Petrocephalus degeni (83), suggesting that large fish are less hypoxia tolerant than small fish.
The time to LOE is positively associated with Mb in oscars (87), consistent with the prediction that larger fish are more hypoxia tolerant (108). However, in many other species, the time to LOE or PO2 at LOE is unrelated to Mb, or, in some cases, smaller fish have longer time to LOE or lower PO2 at LOE. In Atlantic salmon, there was no effect of Mb on time to LOE (63). Within several strains of rainbow trout, Mb was not related to either time to LOE or the PO2 at LOE (64, 65, 67), with the exception that in certain strains measured during certain years, smaller individuals were more tolerant [longer time to LOE; (65)]. The cumulative oxygen deficit, which incorporates both the time to LOE and the PO2 at LOE, was not related to body mass or length in juvenile striped bass [Morone saxatilis; (88)]. In fathead minnow (Pimephales promelas), individuals that lost equilibrium during severe hypoxia were larger than individuals that did not, suggesting that smaller individuals were more tolerant (89). Borowiec et al. (73) reported a slight positive relationship between Mb and the PO2 at LOE for mummichogs, also consistent with smaller animals being more tolerant (i.e., maintained equilibrium to lower PO2). Rees and Matute (38) found that Mb was not related to either the time to LOE or the PO2 at LOE in the Gulf killifish; however, fish with higher Fulton condition factor (K) endured lower PO2 prior to LOE than fish with lower K. This result suggests that, perhaps, mass per se is not as important as mass relative to length.
The effects of body size on the tendency to perform ASR are also mixed. Kramer and Mehegan (36) found that the frequency of ASR decreased with body mass for male guppies, but increased with body mass for females, potentially reflecting higher metabolic costs of reproduction in females. On the other hand, Love and Rees (77) reported that the frequency of ASR was related to neither body mass nor sex in Gulf killifish. That analysis, however, used the average mass of groups of male and female fish in ASR trials. When fish were measured individually, Rees and Matute (38) found that larger Gulf killifish performed ASR sooner and at higher PO2 than smaller fish. Reid et al. (60) reported that Nile perch (Lates niloticus) showed a similar relationship between Mb and ASR (larger fish reached ASR50 at higher PO2). In the same study, three other species showed no relationship between Mb and ASR50, which the authors attributed to a larger range in Mb in Nile perch (60). Sloman et al. (84) also found that large oscars conducted ASR at higher PO2 than smaller individuals. Whether these observations mean that large individuals are less hypoxia tolerant, however, is complicated by the fact that ASR may increase the risk of predation (37). If larger fish perceive less threat of predation, they might employ this behavior earlier than a smaller fish.
Thus, despite expectations based upon interspecific comparisons (108), the influence of body size on intraspecific variation in hypoxia tolerance is not straightforward, regardless of which metric is used. There are probably several reasons for the diversity of responses noted above. First, intraspecific studies generally have a narrower range of Mb variation than interspecific comparisons, making it harder to statistically discern the effects of Mb. Secondly, studies of intraspecific variation in Mb may be confounded by including fish of different life history stages or nutritional or reproductive status, all of which could influence hypoxia tolerance. Finally, body size-dependent variation in behavior could disproportionately affect certain metrics of hypoxia tolerance [e.g., ASR; (84)].
Apart from body size, the most frequent trait that has been associated with interindividual variation in Pcrit is either ṀO2, standard or ṀO2, routine, undoubtedly because these variables are usually measured in the same experiment. Moreover, the estimation of Pcrit typically depends upon the value of either ṀO2, standard or ṀO2, routine (Figure 1B). Reemeyer and Rees (62) suggest the significant positive correlation between Pcrit and ṀO2, standard in Gulf killifish arises from these dependencies. Pcrit and ṀO2, standard were also positively correlated among individuals of three strains of rainbow trout (66). Pcrit and ṀO2, routine were positively correlated among individuals of three cyprinid species [crucian carp, common carp (Cyprinus carpio) and qingbo (Spinibarbus sinensis); (90)]. Interindividual variation in Pcrit and ṀO2, standard were not statistically correlated with one another, however, in juvenile pacu (85).
The relationship between LOE and ṀO2, standard or ṀO2, routine is less uniform. Interindividual variation in the PO2 at LOE was positively associated with ṀO2, routine in common carp and qingbo, but not in crucian carp (90). In fast and slow-growing strains of rainbow trout, Roze et al. (64) found that neither the time to LOE nor the PO2 at LOE were related to ṀO2, standard. Variation in time to LOE in a genetically mixed population of mummichog was unrelated to ṀO2, routine (58). Similarly, the cumulative oxygen deficit at LOE of striped bass was unrelated to oxygen uptake under conditions that approximate ṀO2, routine (88).
Although LOE is not reliably associated with ṀO2, standard or ṀO2, routine, it has been related to interindividual variation in other variables. Joyce et al. (91) categorized European seabass as hypoxia tolerant or sensitive based upon longer vs. shorter times to LOE, respectively. Ventricular strips were then isolated from hearts and stimulated in vitro. Ventricular strips from tolerant individuals generated more force than those from sensitive individuals, but only when stimulated under hypoxic conditions (91). Previously, Roze et al. (64) had shown that rates of oxygen consumption by isolated, permeabilized hearts did not correlate with the time to LOE or PO2 at LOE of rainbow trout. Presumably, those measurements were made under conditions of normal aeration, leaving open the possibility that individual differences in in vitro cardiac physiology are only observed in hypoxia as seen in Faust et al. (109). In striped bass, the cumulative oxygen deficit was positively associated with hematocrit and blood hemoglobin concentration (92). On the other hand, heart mass was not correlated with either time to LOE or the PO2 at LOE in Gulf killifish (38) or in fast- and slow-growing strains of rainbow trout (64). Almeida-Val et al. (87) suggested that tissue levels of the glycolytic enzyme, lactate dehydrogenase, contribute to interindividual variation in hypoxia tolerance of oscars based upon the similarity in the mass scaling of enzyme concentration and time to LOE.
Rees and Matute (38) found that the number of gill filaments in Gulf killifish was positively associated with interindividual variation in the time to LOE and weakly negatively related to the PO2 at LOE. In the same study, interindividual variation in the time of first onset of ASR was related to the average length of gill filaments (38). These relationships were corrected for body size variation, and they suggest that, for a given body size, individuals with longer or more numerous gill filaments are more tolerant of low oxygen.
As mentioned above, the observation that fish populations and genetic strains differ in hypoxia tolerance strongly suggests that there is a genetic basis. This conclusion is supported by measures of the repeatability and the heritability of specific metrics of hypoxia tolerance, along with recent studies of the genetic architecture of these traits.
The repeatability of any given metric of hypoxia tolerance provides information on the stability of that value for a given subject over time. A highly repeatable trait suggests that there are inherent differences among individuals that may be genetically based, and hence capable of responding to natural selection. Indeed, in quantitative genetics, the repeatability of a trait is thought to represent an upper limit of its heritability (110), although there are conditions when this might not be true (111).
Among the metrics of hypoxia tolerance considered here, the repeatability of LOE has received the most attention. Claireaux et al. (39) showed that the times to LOE of individual European seabass measured over 2 to 6 weeks were correlated with one another (Pearson's correlation coefficients, r, 0.58–0.77). This was true whether fish were measured under standard laboratory maintenance conditions or after exposure of fish to chemical contaminants (oil and/or dispersants). Subsequently, Joyce et al. (91) demonstrated that the times to LOE of individual seabass remained significantly correlated between measurements made up to 18 months apart (r = 0.48). Zhang et al. (112) observed that the oxygen saturation at LOE was also repeatable in European seabass. In that study, however, exposure of fish to oil changed the rank order of hypoxia tolerance among individuals when LOE was measured 7 months later.
Rees and Matute (38) used adjusted repeatability (Radj), which is an intraclass correlation coefficient (113) that accounts for covariates, such as body mass (114), to determine the consistency of the time and PO2 of LOE in Gulf killifish. They found that both measures were repeatable across multiple trials conducted over 6 to 8 weeks (Radj = 0.31 for time to LOE and Radj = 0.35 for PO2 at LOE). Nelson et al. (92) and Kraskura and Nelson (88) showed significant repeatability in rank order of individual values for the cumulative oxygen deficit, which incorporates both the time and the PO2 at LOE, in juvenile striped bass measured repeatedly over 3 to 6 months (Kendall's coefficient of concordance W = 0.53 and Spearman's p = 0.59, respectively). These results suggest that LOE is a stable metric of an individual's hypoxia tolerance across time.
There are fewer measurements of the consistency of Pcrit or ASR when measured in multiple trials for a given individual. The Pcrit of individual Gulf killifish was highly reproducible when measured 1 week apart [r = 0.74; (31)]. Importantly, Pcrit determined for the same individuals by different analytical techniques or using closed vs. intermittent-flow respirometry were not significantly correlated (31), demonstrating the importance of experimental design in making these comparisons (115). Also, the correlations between consecutive measurements were much lower (r = 0.07 to 0.24) when measured 2 to 6 months apart (62). Considering multiple measurements made over a period of 6 months, Pcrit had an Radj of 0.16 (62). Although this value was statistically higher than no repeatability (Radj = 0), it suggests that only 16% of the total variation in Pcrit was due to differences among individuals, with most of the variation arising from within-individual variation (62).
The only study that measured the repeatability of ASR, of which we are aware, is Rees and Matute (38). During a reproducible hypoxia challenge test, both the time prior to and the PO2 at the first occurrence of ASR by Gulf killifish were repeatable (Radj = 0.44 for time to ASR and Radj = 0.39 for PO2 at ASR). A comparison of LOE, ASR and Pcrit from a single species (Gulf killifish), suggests that first two are more repeatable for a given individual than the last.
As indicated above, trait repeatability is only an estimate of heritability. Direct measures of the narrow sense heritability (h2) are less common, and to our knowledge, not available for Pcrit and ASR. In an early study of the hypoxia tolerance of common carp, the time to cessation of opercular movement, which is closely linked to the time to LOE, had an h2 = 0.51 (116). More recently, similarly high values for h2 have been reported for the time to LOE of yellow croaker (Larimichthys crocea) [0.61, (117); 0.62, (118)]. Somewhat lower estimates have been reported for rainbow trout, 0.22 to 0.28, depending upon what model of selection was used to determine h2 (119). Although the absolute values of h2 differ, these studies all indicate a substantial genetic basis for the time to LOE. In a related study, the behavior of hypoxia avoidance by European seabass was found to have an h2 of 0.19 (120).
There has been considerable recent interest in probing the genomic basis of hypoxia tolerance in fishes. Wang et al. (121) used a 250K SNP (single-nucleotide polymorphism) array in a genome wide association study (GWAS) to understand variation in the time to LOE in channel catfish (Ictalurus punctatus). They found numerous QTLs (quantitative trait loci) associated with LOE both among across and within catfish strains, suggesting a complex genetic architecture of hypoxia tolerance. Within these QTLs were significant SNPs in or near genes involved in critical cell signaling pathways, namely the mitogen-activated protein kinase (MAPK) and phosphatidylinositol 3-kinase (PI3K)-AKT-mammalian target of rapamycin (mTOR) pathways (121). Zhong et al. (122) used similar approaches to study hypoxia tolerance in hybrid catfish (channel catfish x blue catfish, Ictalurus furcatus). Their analysis revealed that some of the same pathways (MAPK, PI3K/AKT/mTOR), as well as others [vascular endothelial growth factor (VEGF), P53-mediated apoptosis, and DNA damage checkpoint pathways], were enriched in SNPs associated with time to LOE.
Healy et al. (57) identified 35 SNPs that explained nearly 52% of the variation in time to LOE in naturally occurring populations of the mummichog. A major conclusion of that study was that hypoxia tolerance is a polygenic trait, which is expected for complex phenotypes (123). Brennan et al. (58) identified eight candidate SNPs by either association mapping or selection scans that were correlated with adaptive divergence in hypoxia tolerance between populations of brackish-water and freshwater mummichogs. One SNP was found to be upstream of the gene encoding hyaluronan synthase 1 (HAS1), an enzyme whose product (hyaluronan) is a negative regulator of the hypoxia-inducible transcription factor (HIF), a master regulator of the transcriptional response to low oxygen (1). Other studies have implicated HIF-related genes and pathways in contributing to variation in hypoxia tolerance in fishes. For example, Wang et al. (68) showed hypoxia tolerance in blunt snout bream was correlated with two SNPs in the egln2 (egg-laying nine-2) gene, which encodes an enzyme involved in the degradation of HIF1α protein subunits. Similarly, in a study of yellow croaker, Ding et al. (117) identified four SNPs and 10 candidate genes related to time to LOE. Among these candidate genes was egln2.
San et al. (124) identified four significant SNPs and 16 candidate genes that were related to survival time under hypoxia in the golden pompano (Trachinotus ovatus). Similarly, Prchal et al. (119) identified three significant and two putative QTLs, and 15 candidate genes related to time to LOE of rainbow trout. In the latter study, no QTL explained more than 1% of the variation in LOE, reinforcing the notion that hypoxia tolerance is highly polygenic. Interestingly, though, both studies identified lonrf3 (LON peptidase N-terminal domain and RING finger protein 3), commd5 (COMM Domain-Containing Protein 5), and fam199x (protein FAM199X), as potential candidate genes.
In silver silago (Sillago sihama), Ye et al. (125) identified six QTLs spanning five linkage groups associated with hypoxia tolerance, as defined by the time until “onset of gasping.” Enrichment analyses highlighted the involvement of processes related to ion transport and drug metabolism. Remarkably, 13 SNPs fell within the mgst3b (microsomal glutathione S-transferase 3b) gene, five of which showed a significant association with hypoxia tolerance. This gene encodes an enzyme that conjugates glutathione to toxins, which helps defend against oxidative stress and, potentially, hypoxia.
This brief review of the genetic basis of hypoxia tolerance leads to four observations. First, hypoxia tolerance is a complex, polygenic phenotype. As a result, each QTL, SNP, or candidate gene typically explains only a small fraction of the variation in hypoxia tolerance among individuals. Second, despite the polygenic nature of hypoxia tolerance, several of these studies have identified the same cell signaling pathways (MAPK, PI3K/AKT/mTOR, VEGF) or candidate genes (e.g., egln2, lonrf3). Third, some of the candidate genes (egln2, has1) and pathways (VEGF) are associated with oxygen-dependent regulation of gene expression by HIF, although there are also likely to be HIF-independent responses. Fourth, these studies almost uniformly use the time to LOE as the metric of hypoxia tolerance because it can be measured rapidly in large numbers of individuals. Thus, these studies address the genetics of survival during exposure to extreme hypoxia, which is important in many contexts, e.g., survival in “dead zones” or in poorly-oxygenated aquaculture ponds. These studies, however, do not address the genetic bases of fish responses to less dramatic reductions that are important in many ecological settings.
There is considerable intraspecific variation in hypoxia tolerance in fishes, as assessed by Pcrit, ASR, or LOE, and this variation can be measured at a variety of scales, from that among populations inhabiting diverse habitats to that among individuals arising from a given population held under common conditions. Variation among populations, genetic strains, and individuals supports a genetic basis for this variation, but acclimation studies show that hypoxia tolerance is also plastic. The potential underlying correlates of hypoxia tolerance also vary, however, they do so in a more idiosyncratic fashion. There are clear examples of where changes in gill morphology or cardiovascular variables that ought to improve oxygen extraction or delivery to the tissues are associated with an increase in hypoxia tolerance, as judged by one or more of the metrics considered here. But there are also instances when a metric of hypoxia tolerance varies (e.g., among populations or individuals) and these same underlying variables do not change, or in fact, change in unpredicted ways. Below, we offer some reasons for this lack of uniformity, as well as propose specific recommendations for experimental design and data reporting that might help in generalizing across studies.
With about 33,000 species of ray-finned fishes (8), it is not surprising that different species employ different strategies to deal with low oxygen, especially considering the different scales of intraspecific variation reviewed here. Because of phylogeny, natural history, or developmental, behavioral, anatomical, or physiological constraints, different species might display diverse responses in the hypoxia tolerance metrics considered here, as well as in their underlying correlates. One example is ASR. This behavior is facilitated by a certain body morphology (upturned mouth, flattened dorsal aspect of the head; 35) and it may be influenced by the perceived threat of predation (37). Thus, ASR might be a more likely response to hypoxia in certain species or contexts than in others.
In addition, there are multiple ways to achieve a particular outcome with respect to hypoxia tolerance. For example, an increase in the gill surface area available for gas exchange can be brought about by different mechanisms. Regression of the ILCM appears to be important during acclimation to low oxygen, at least among cyprinid fishes, whereas growth of more or longer gill filaments appears to be involved in population and interindividual variation in hypoxia tolerance. Cases when hypoxia tolerance varies but gill morphology does not (or it changes in expected ways) might reflect the multiple roles served by gills, where diverse processes (e.g., maximizing oxygen uptake and minimizing diffusive ion and water fluxes) cannot be simultaneously optimized (102).
Another interesting possibility is that the range of intraspecific variation in hypoxia tolerance may be related to the range of variation in oxygen levels experienced in nature, with populations that encounter a greater range of seasonal or daily variation in oxygen also displaying greater intraspecific variation in hypoxia tolerance. Ultimately, certain species, populations, or individuals might attain sufficient hypoxia tolerance by an increase in oxygen extraction or an increase in tissue oxygen delivery or by suppressing aerobic metabolic demands, but not require all three. In other words, the “one size fits all” maxim does not necessarily apply to all fishes in all hypoxic settings. In this review, we have documented a diversity of responses by fish to low oxygen; understanding this diversity continues to be a challenge.
Another source of variation among results from different studies arises for technical, rather than biological, reasons. Regrettably, none of the metrics of hypoxia tolerance considered here is fully standardized. Determination of Pcrit, which is the most reported measure of hypoxia tolerance, can be done with closed or intermittent-flow respirometry; it can be calculated with different mathematical models; and it can rely upon measures of ṀO2, standard or ṀO2, routine; all of which can influence mean values for a group, as well as the repeatability of values for an individual (31). Although these issues likely don't influence the comparability of results within a study, they do affect ability to compare across studies. This lack of standardization has led some to criticize the use of Pcrit and advocate for other measures of hypoxia tolerance (32). Although LOE has been proposed as a better metric of hypoxia tolerance, its determination is even less standardized among studies. Unlike studies of thermal tolerance for which there are standardized protocols for ramping temperature, there is no similar standard for lowering oxygen in LOE tests. This is partly due to the widely different hypoxia tolerance among species. That is, a ramping rate or a final PO2 that effectively discriminates differences in LOE by one species, might fail to elicit LOE in a reasonable time in a more tolerant species, or, potentially, kill all individuals of a more sensitive species. Moreover, Pcrit and LOE likely measure different aspects of hypoxia tolerance by fish (108), and one should not be substituted for the other.
Another barrier to comparing across studies relates to data reporting. Although we have cited certain “negative results” (i.e., a lack of relationship between a hypoxia metric and a putative correlate), under-reporting negative results could lead to a mistaken impression that these are rare cases. In addition, most of the comparisons among populations, genetic strains, and acclimation treatments are based upon mean values, rather than upon correlations among individual values [although see (66)]. This can be misleading. For example, Reemeyer and Rees (62) reported that mean Pcrit and ṀO2, standard changed in opposite directions during acclimation of Gulf killifish to hypoxia, even though the two variables were strongly positively correlated among individuals over the entire experiment. Along similar lines, Zhang et al. (66) noted differences in Pcrit, but not ṀO2, standard among strains of rainbow trout, belying the fact that the two variables were positively correlated at the individual levels. The availability of online data repositories and supplemental information in published work allows reporting “negative data” and presenting datasets that show measurements made on each individual. The latter would be especially helpful in assessing interindividual variation in hypoxia tolerance and its putative determinants.
As mentioned earlier (Section 2), the metrics of hypoxia tolerance considered here are point measurements of fish responses to extreme reductions in ambient oxygen. These levels of oxygen are likely to occur in severe cases of aquatic hypoxia, which might provide a strong selective force favoring populations, strains, or individuals with certain values of each metric. However, less dramatic reductions in oxygen are certainly more prevalent in most aquatic habitats and could constrain fitness-related activities of fishes (10). Metrics of hypoxia tolerance that integrate fish responses across a range of oxygen levels have been proposed (43, 47, 52). These typically require that fish be induced to reach ṀO2, max, for example by increased locomotor activity, making these techniques lower in throughput than others. Nevertheless, they are highly integrative and could apply more broadly to ecologically relevant hypoxia than the point measures considered here. Thus, there may be a tradeoff between ecological realism and throughput necessary for certain experimental approaches, namely those linking hypoxia tolerance to underlying genetic variability. One resolution might be a two-tiered approach that combines high-throughput screening of a given metric (e.g., LOE) with more integrative measurements on a smaller number of individuals (43).
With the increase in the extent of aquatic hypoxia worldwide, it is important to understand the tolerance of fishes to low oxygen. It is clear that hypoxia tolerance varies within species, however there is great diversity in the specifics of this tolerance—which metrics of hypoxia tolerance change and by how much; what are the geographic and temporal scales across which this variation occurs; and what are the putative underlying correlates of hypoxia tolerance. Greater comparability among studies, and hence greater understanding of hypoxia tolerance in general, will come from standardization of experimental designs, enhanced reporting of “negative data” and individual-based measurements, and the development of new metrics of hypoxia tolerance. It will be important to determine how these new metrics relate to more traditional measurements of hypoxia tolerance, to ascertain the degree to which one can extrapolate the underlying determinants of one metric to others. Armed with this information, it might be possible to predict which populations, strains, or individuals will fare better during hypoxic episodes; mitigate the effects of low oxygen on fishes; and design breeding protocols to enhance the hypoxia tolerance of species important for aquaculture.
CB: Investigation, Writing – original draft. BR: Conceptualization, Funding acquisition, Visualization, Writing – review & editing.
The author(s) declare that financial support was received for the research and/or publication of this article. This was funded by the Greater New Orleans Foundation.
We thank the Greater New Orleans Foundation Endowed Chair in Aquatic Conservation (BBR) for funding.
The authors declare that the research was conducted in the absence of any commercial or financial relationships that could be construed as a potential conflict of interest.
The author(s) declare that no Gen AI was used in the creation of this manuscript.
All claims expressed in this article are solely those of the authors and do not necessarily represent those of their affiliated organizations, or those of the publisher, the editors and the reviewers. Any product that may be evaluated in this article, or claim that may be made by its manufacturer, is not guaranteed or endorsed by the publisher.
1. Nikinmaa M, Rees BB. Oxygen-dependent gene expression in fishes. Am J Physiol-Regul Integr Comp Physiol. (2005) 288:R1079–90. doi: 10.1152/ajpregu.00626.2004
2. Diaz RJ, Rosenberg R. Spreading dead zones and consequences for marine ecosystems. Science. (2008) 321:926–9. doi: 10.1126/science.1156401
3. Rabalais NN, Díaz RJ, Levin LA, Turner RE, Gilbert D, Zhang J. Dynamics and distribution of natural and human-caused hypoxia. Biogeosciences. (2010) 7:585–619. doi: 10.5194/bg-7-585-2010
4. Pires AM, Cowx IG, Coelho MM. Seasonal changes in fish community structure of intermittent streams in the middle reaches of the Guadiana basin, Portugal. J Fish Biol. (1999) 54:235–49. doi: 10.1111/j.1095-8649.1999.tb00827.x
5. Breitburg D, Levin LA, Oschlies A, Grégoire M, Chavez FP, Conley DJ, et al. Declining oxygen in the global ocean and coastal waters. Science. (2018) 359:eaam7240. doi: 10.1126/science.aam7240
6. Jane SF, Hansen GJA, Kraemer BM, Leavitt PR, Mincer JL, North RL, et al. Widespread deoxygenation of temperate lakes. Nature. (2021) 594:66–70. doi: 10.1038/s41586-021-03550-y
7. Sampaio E, Santos C, Rosa IC, Ferreira V, Pörtner HO, Duarte CM, et al. Impacts of hypoxic events surpass those of future ocean warming and acidification. Nat Ecol Evol. (2021) 5:311–21. doi: 10.1038/s41559-020-01370-3
8. Nelson JS, Grande TC, Wilson MVH. Fishes of the World. Hoboken: John Wiley & Sons (2016). doi: 10.1002/9781119174844
9. Graham JB. Ecological, evolutionary, and physical factors influencing aquatic animal respiration. Am Zool. (1990) 30:137–46. doi: 10.1093/icb/30.1.137
10. Claireaux G, Lefrançois C. Linking environmental variability and fish performance: integration through the concept of scope for activity. Philos Trans R Soc B Biol Sci. (2007) 362:2031–41. doi: 10.1098/rstb.2007.2099
11. Claireaux G, Chabot D. Ocean Deoxygenation: Everyone's Problem. Causes, Impacts, Consequences and Solutions. In: Laffoley D, Baxter JM, editors. Gland: IUCN, International Union for Conservation of Nature (2019).
12. Chapman LJ, Mckenzie DJ. Chapter 2 behavioral responses and ecological consequences. Fish Physiology. (2009) 27:25–77. doi: 10.1016/S1546-5098(08)00002-2
13. Richards JG. Chapter 10 metabolic and molecular responses of fish to hypoxia. Fish Physiology. (2009) 27:443–85. doi: 10.1016/S1546-5098(08)00010-1
14. Farrell AP, Richards JG. Chapter 11 defining hypoxia. Fish Physiology. (2009) 27:487–503. doi: 10.1016/S1546-5098(08)00011-3
15. Mandic M, Todgham AE, Richards JG. Mechanisms and evolution of hypoxia tolerance in fish. Proc R Soc B Biol Sci. (2009) 276:735–44. doi: 10.1098/rspb.2008.1235
16. Fu SJ, Yan GJ, Cao ZD, Fu C, Zhang AJ, Pang X. Interspecies variation in hypoxia tolerance, swimming performance and plasticity in cyprinids that prefer different habitats. J Exp Biol. (2014) 217:jeb.089268. doi: 10.1242/jeb.089268
17. Verberk WCEP, Sandker JF, Van De Pol ILE, Urbina MA, Wilson RW, McKenzie DJ, et al. Body mass and cell size shape the tolerance of fishes to low oxygen in a temperature-dependent manner. Glob Change Biol. (2022) 28:5695–707. doi: 10.1111/gcb.16319
18. Nikinmaa M, Waser W. Molecular and cellular studies in evolutionary physiology of natural vertebrate populations: influences of individual variation and genetic components on sampling and measurements. J Exp Biol. (2007) 210:1847–57. doi: 10.1242/jeb.002717
19. Diaz RJ, Breitburg DL. Chapter 1 the hypoxic environment. Fish Physiology. (2009) 27:1–23. doi: 10.1016/S1546-5098(08)00001-0
20. Richards JG. Physiological, behavioral and biochemical adaptations of intertidal fishes to hypoxia. J Exp Biol. (2011) 214:191–9. doi: 10.1242/jeb.047951
21. Chabot D, McKenzie DJ, Craig JF. Metabolic rate in fishes: definitions, methods and significance for conservation physiology. J Fish Biol. (2016) 88:1–9. doi: 10.1111/jfb.12873
22. Rees BB, Reemeyer JE, Binning SA, Brieske SD, Clark TD, De Bonville J, et al. Estimating maximum oxygen uptake of fishes during swimming and following exhaustive chase–different results, biological bases and applications. J Exp Biol. (2024) 227:jeb246439. doi: 10.1242/jeb.246439
23. Fernandes TJ, Fu SJ, McKenzie DJ, Killen SS. Expanding the scope: integrating costs of digestive metabolism and growth into estimates of maximum oxygen uptake in fishes. J Exp Biol. (2024) 227:jeb248197. doi: 10.1242/jeb.248197
25. Brett JR. The respiratory metabolism and swimming performance of young sockeye salmon. J Fish Res Board Can. (1964) 21:1183–226. doi: 10.1139/f64-103
26. Ultsch GR, Jackson DC, Moalli R. Metabolic oxygen conformity among lower vertebrates: the toadfish revisited. J Comp Physiol B. (1981) 142:439–43. doi: 10.1007/BF00688973
27. Tang PS. On the rate of oxygen consumption by tissues and lower organisms as a function of oxygen tension. Q Rev Biol. (1933) 8:260–74. doi: 10.1086/394439
28. Beamish FWH. Respiration of fishes with special emphasis on standard oxygen consumption: III. Influence of oxygen. Can J Zool. (1964) 42:355–66. doi: 10.1139/z64-033
29. Ultsch GR, Boschung H, Ross MJ. Metabolism, critical oxygen tension, and habitat selection in darters (Etheostoma). Ecology. (1978) 59:99–107. doi: 10.2307/1936635
30. Ultsch GR, Regan MD. The utility and determination of Pcrit in fishes. J Exp Biol. (2019) 222:jeb203646. doi: 10.1242/jeb.203646
31. Reemeyer JE, Rees BB. Standardizing the determination and interpretation of Pcrit in fishes. J Exp Biol. (2019) 222:jeb210633. doi: 10.1101/703991
32. Wood CM. The fallacy of the Pcrit–are there more useful alternatives? J Exp Biol. (2018) 221:jeb163717. doi: 10.1242/jeb.163717
33. Regan MD, Mandic M, Dhillon RS, Lau GY, Farrell AP, Schulte PM, et al. Don't throw the fish out with the respirometry water. J Exp Biol. (2019) 222:jeb200253. doi: 10.1242/jeb.200253
34. Rogers NJ, Urbina MA, Reardon EE, McKenzie DJ, Wilson RW. A new analysis of hypoxia tolerance in fishes using a database of critical oxygen level (Pcrit). Conserv Physiol. (2016) 4:cow012. doi: 10.1093/conphys/cow012
35. Kramer DL, McClure M. Aquatic surface respiration, a widespread adaptation to hypoxia in tropical freshwater fishes. Environ Biol Fishes. (1982) 7:47–55. doi: 10.1007/BF00011822
36. Kramer DL, Mehegan JP. Aquatic surface respiration, an adaptive response to hypoxia in the guppy, Poecilia reticulata (Pisces, Poeciliidae). Environ Biol Fishes. (1981) 6:299–313. doi: 10.1007/BF00005759
37. Kramer DL, Manley D, Bourgeois R. The effect of respiratory mode and oxygen concentration on the risk of aerial predation in fishes. Can J Zool. (1983) 61:653–65. doi: 10.1139/z83-087
38. Rees BB, Matute LA. Repeatable interindividual variation in hypoxia tolerance in the Gulf killifish, Fundulus grandis. Physiol Biochem Zool. (2018) 91:1046–56. doi: 10.1086/699596
39. Claireaux G, Théron M, Prineau M, Dussauze M, Merlin FX, Le Floch S. Effects of oil exposure and dispersant use upon environmental adaptation performance and fitness in the European sea bass, Dicentrarchus labrax. Aquat Toxicol. (2013) 130–1:160–70. doi: 10.1016/j.aquatox.2013.01.004
40. Neill WH, Bryan JD. “Responses of fish to temperature and oxygen, and response integration through metabolic scope.” In:Brune DE, Tomasso JR, , editors. Aquaculture and Water Quality: Advances in World Aquaculture. Baton Rouge, LA: The World Aquaculture Society (1991). p. 31–57.
41. Neill WH, Miller JM, Van Der Veer HW, Winemiller KO. Ecophysiology of marine fish recruitment: a conceptual framework for understanding interannual variability. Neth J Sea Res. (1994) 32:135–52. doi: 10.1016/0077-7579(94)90037-X
42. Claireaux G, Chabot D. Responses by fishes to environmental hypoxia: integration through fry's concept of aerobic metabolic scope. J Fish Biol. (2016) 88:232–51. doi: 10.1111/jfb.12833
43. Zhang Y, Farrell AP. Testing the hypoxia tolerance and hypoxic performance of fishes: a two-tier screening approach. Front Mar Sci. (2022) 9:939239. doi: 10.3389/fmars.2022.939239
44. Zhang Y, Mauduit F, Pettinau L, Ollivier H, Lancien F, Anttila K, et al. Respiratory plasticity during acclimation to hypoxia and following a recovery in normoxia. Can J Zool. (2023) 101:794–806. doi: 10.1139/cjz-2022-0158
45. Zhang Y, Gilbert MJH, Farrell AP. Finding the peak of dynamic oxygen uptake during fatiguing exercise in fish. J Exp Biol. (2019) 222:jeb196568. doi: 10.1242/jeb.196568
46. Zhang Y, Gilbert MJH, Farrell AP. Measuring maximum oxygen uptake with an incremental swimming test and by chasing rainbow trout to exhaustion inside a respirometry chamber yields the same results. J Fish Biol. (2020) 97:28–38. doi: 10.1111/jfb.14311
47. Seibel BA, Deutsch C. Oxygen supply capacity in animals evolves to meet maximum demand at the current oxygen partial pressure regardless of size or temperature. J Exp Biol. (2020) 223:jeb210492. doi: 10.1242/jeb.210492
48. Seibel BA, Andres A, Birk MA, Burns AL, Shaw CT, Timpe AW, et al. Oxygen supply capacity breathes new life into critical oxygen partial pressure (Pcrit). J Exp Biol. (2021) 224:jeb242210. doi: 10.1242/jeb.242210
49. Esbaugh AJ, Ackerly KL, Dichiera AM, Negrete B. Is hypoxia vulnerability in fishes a by-product of maximum metabolic rate? J Exp Biol. (2021) 224:jeb232520. doi: 10.1242/jeb.232520
50. Farrell AP, Mueller CA, Seymour RS. Coming up for air. J Exp Biol. (2021) 224:jeb243101. doi: 10.1242/jeb.243101
51. Timpe AW, Seibel BA. Correcting systematic error in PO2 measurement to improve measures of oxygen supply capacity (α). Comp Biochem Physiol A Mol Integr Physiol. (2024) 298:111737. doi: 10.1016/j.cbpa.2024.111737
52. Mueller CA, Seymour RS. The regulation index: a new method for assessing the relationship between oxygen consumption and environmental oxygen. Physiol Biochem Zool. (2011) 84:522–32. doi: 10.1086/661953
53. Olowo JP, Chapman LJ. Papyrus swamps and variation in the respiratory behaviour of the African fish Barbus neumayeri. Afr J Ecol. (1996) 34:211–22. doi: 10.1111/j.1365-2028.1996.tb00615.x
54. Chapman LJ, Chapman CA, Nordlie FG, Rosenberger AE. Physiological refugia: swamps, hypoxia tolerance and maintenance of fish diversity in the Lake Victoria region. Comp Biochem Physiol A Mol Integr Physiol. (2002) 133:421–37. doi: 10.1016/S1095-6433(02)00195-2
55. Timmerman CM, Chapman LJ. Hypoxia and interdemic variation in Poecilia latipinna. J Fish Biol. (2004) 65:635–50. doi: 10.1111/j.0022-1112.2004.00474.x
56. McBryan TL, Healy TM, Haakons KL, Schulte PM. Warm acclimation improves hypoxia tolerance in Fundulus heteroclitus. J Exp Biol. (2016) 219:474–84. doi: 10.1242/jeb.133413
57. Healy TM, Brennan RS, Whitehead A, Schulte PM. Tolerance traits related to climate change resilience are independent and polygenic. Glob Change Biol. (2018) 24:5348–60. doi: 10.1111/gcb.14386
58. Brennan RS, Healy TM, Bryant HJ, La V, Schulte PM, Whitehead A. Integrative population and physiological genomics reveals mechanisms of adaptation in killifish. Mol Biol Evol. (2018) 35:2639–53. doi: 10.1093/molbev/msy154
59. Regan MD, Gill IS, Richards JG. Metabolic depression and the evolution of hypoxia tolerance in threespine stickleback, Gasterosteus aculeatus. Biol Lett. (2017) 13:20170392. doi: 10.1098/rsbl.2017.0392
60. Reid AJ, Farrell MJ, Luke MN, Chapman LJ. Implications of hypoxia tolerance for wetland refugia use in Lake Nabugabo, Uganda. Ecol Freshw Fish. (2013) 22:421–9. doi: 10.1111/eff.12036
61. Everett MV, Crawford DL. Adaptation vs. allometry: population and body mass effects on hypoxic metabolism in Fundulus grandis. Physiol Biochem Zool. (2010) 83:182–90. doi: 10.1086/648482
62. Reemeyer JE, Rees BB. Plasticity, repeatability, and phenotypic correlations of aerobic metabolic traits in a small estuarine fish. J Exp Biol. (2020) 223:jeb228098. doi: 10.1101/2020.05.01.072587
63. Anttila K, Dhillon RS, Boulding EG, Farrell AP, Glebe BD, Elliott JAK, et al. Variation in temperature tolerance among families of Atlantic salmon (Salmo salar) is associated with hypoxia tolerance, ventricle size and myoglobin level. J Exp Biol. (2013) 216:1183–90. doi: 10.1242/jeb.080556
64. Roze T, Christen F, Amerand A, Claireaux G. Trade-off between thermal sensitivity, hypoxia tolerance and growth in fish. J Therm Biol. (2013) 38:98–106. doi: 10.1016/j.jtherbio.2012.12.001
65. Scott MA, Dhillon RS, Schulte PM, Richards JG. Physiology and performance of wild and domestic strains of diploid and triploid rainbow trout (Oncorhynchus mykiss) in response to environmental challenges. Can J Fish Aquat Sci. (2015) 72:125–34. doi: 10.1139/cjfas-2013-0450
66. Zhang Y, Healy TM, Vandersteen W, Schulte PM, Farrell AP. A rainbow trout Oncorhynchus mykiss strain with higher aerobic scope in normoxia also has superior tolerance of hypoxia. J Fish Biol. (2018) 92:487–503. doi: 10.1111/jfb.13530
67. Strowbridge N, Northrup SL, Earhart ML, Blanchard TS, Schulte PM. Acute measures of upper thermal and hypoxia tolerance are not reliable predictors of mortality following environmental challenges in rainbow trout (Oncorhynchus mykiss). Conserv Physiol. (2021) 9:coab095. doi: 10.1093/conphys/coab095
68. Wang DD, Xu XN, Wu CB, Chen J, Zou SM. Screening of hypoxia-tolerance related SNP in a selectively bred F5 strain of blunt snout bream (Megalobrama amblycephala). Aquaculture. (2020) 519:734840. doi: 10.1016/j.aquaculture.2019.734840
69. McKenzie DJ, Martínez R, Morales A, Acosta J, Morales R, Taylor EW, et al. Effects of growth hormone transgenesis on metabolic rate, exercise performance and hypoxia tolerance in tilapia hybrids. J Fish Biol. (2003) 63:398–409. doi: 10.1046/j.1095-8649.2003.00162.x
70. Sollid J, De Angelis P, Gundersen K, Nilsson GE. Hypoxia induces adaptive and reversible gross morphological changes in crucian carp gills. J Exp Biol. (2003) 206:3667–73. doi: 10.1242/jeb.00594
71. Timmerman CM, Chapman LJ. Behavioral and physiological compensation for chronic hypoxia in the sailfin molly (Poecilia latipinna). Physiol Biochem Zool. (2004) 77:601–10. doi: 10.1086/421754
72. Fu SJ, Brauner CJ, Cao ZD, Richards JG, Peng JL, Dhillon R, et al. The effect of acclimation to hypoxia and sustained exercise on subsequent hypoxia tolerance and swimming performance in goldfish (Carassius auratus). J Exp Biol. (2011) 214:2080–8. doi: 10.1242/jeb.053132
73. Borowiec BG, Darcy KL, Gillette DM, Scott GR. Distinct physiological strategies are used to cope with constant hypoxia and intermittent hypoxia in killifish (Fundulus heteroclitus). J Exp Biol. (2015) 218:jeb114579. doi: 10.1242/jeb.114579
74. Gilmore KL, Doubleday ZA, Gillanders BM. Prolonged exposure to low oxygen improves hypoxia tolerance in a freshwater fish. Conserv Physiol. (2019) 7:coz058. doi: 10.1093/conphys/coz058
75. Bergstedt JH, Pfalzgraff T, Skov PV. Hypoxia tolerance and metabolic coping strategies in Oreochromis niloticus. Comp Biochem Physiol A Mol Integr Physiol. (2021) 257:110956. doi: 10.1016/j.cbpa.2021.110956
76. Abdallah SJ, Thomas BS, Jonz MG. Aquatic surface respiration and swimming behaviour in adult and developing zebrafish exposed to hypoxia. J Exp Biol. (2015) 218:jeb116343. doi: 10.1242/jeb.116343
77. Love JW, Rees BB. Seasonal differences in hypoxia tolerance in Gulf killifish, Fundulus grandis (Fundulidae). Environ Biol Fishes. (2002) 63:103–15. doi: 10.1023/A:1013834803665
78. Antilla K, Lewis M, Prokkola JM, Kanerva M, Seppanen E, Kolari I, et al. Warm acclimation and oxygen depletion induce species-specific responses in salmonids. J Exp Biol. (2015) 218:1471–7. doi: 10.1242/jeb.119115
79. Yang H, Cao ZD, Fu SJ. The effects of diel-cycling hypoxia acclimation on the hypoxia tolerance, swimming capacity and growth performance of southern catfish (Silurus meridionalis). Comp Biochem Physiol A Mol Integr Physiol. (2013) 165:131–8. doi: 10.1016/j.cbpa.2013.02.028
80. Zhou Y, Zhang Y, Wei S, Li W, Li W, Wu Z, et al. Reduced hypoxia tolerance and altered gill morphology at elevated temperatures may limit the survival of tilapia (GIFT, Oreochromis niloticus) under global warming. Fishes. (2022) 7:216. doi: 10.3390/fishes7050216
81. Jung EH, Brix KV, Richards JG, Val AL, Brauner CJ. Reduced hypoxia tolerance and survival at elevated temperatures may limit the ability of Amazonian fishes to survive in a warming world. Sci Total Environ. (2020) 748:141349. doi: 10.1016/j.scitotenv.2020.141349
82. Borowiec BG, Crans KD, Khajali F, Pranckevicius NA, Young A, Scott GR. Interspecific and environment-induced variation in hypoxia tolerance in sunfish. Comp Biochem Physiol A Mol Integr Physiol. (2016) 198:59–71. doi: 10.1016/j.cbpa.2016.04.010
83. Mucha S, Chapman LJ, Krahe R. Normoxia exposure reduces hemoglobin concentration and gill size in a hypoxia-tolerant tropical freshwater fish. Environ Biol Fishes. (2023) 106:1405–23. doi: 10.1007/s10641-023-01427-9
84. Sloman KA, Wood CM, Scott GR, Wood S, Kajimura M, Johannsson OE, et al. Tribute to R. G Boutilier: the effect of size on the physiological and behavioural responses of oscar, Astronotus ocellatus, to hypoxia. J Exp Biol. (2006) 209:1197–205. doi: 10.1242/jeb.02090
85. Blasco FR, Leite CAC, Rantin FT, Taylor EW, McKenzie DJ. Individual variation in sublethal tolerance of warming and hypoxia in the pacu Piaractus mesopotamicus: an investigation of correlations and dependence on intrinsic metabolic phenotype. Front Fish Sci. (2024) 2:1276161. doi: 10.3389/frish.2024.1276161
86. Pan YK, Ern R, Esbaugh AJ. Hypoxia tolerance decreases with body size in red drum Sciaenops ocellatus. J Fish Biol. (2016) 89:1488–93. doi: 10.1111/jfb.13035
87. Almeida-Val VMF, Val AL, Duncan WP, Souza FCA, Paula-Silva MN, Land S. Scaling effects on hypoxia tolerance in the Amazon fish Astronotus ocellatus (Perciformes: Cichlidae): contribution of tissue enzyme levels. Comp Biochem Physiol B Biochem Mol Biol. (2000) 125:219–26. doi: 10.1016/S0305-0491(99)00172-8
88. Kraskura K, Nelson JA. Hypoxia tolerance is unrelated to swimming metabolism of wild, juvenile striped bass (Morone saxatilis). J Exp Biol. (2020) 223:jeb217125. doi: 10.1242/jeb.217125
89. Robb T, Abrahams MV. Variation in tolerance to hypoxia in a predator and prey species: an ecological advantage of being small? J Fish Biol. (2003) 62:1067–81. doi: 10.1046/j.1095-8649.2003.00097.x
90. Pang X, Pu DY, Xia DY, Liu XH, Ding SH Li Y, et al. Individual variation in metabolic rate, locomotion capacity and hypoxia tolerance and their relationships in juveniles of three freshwater fish species. J Comp Physiol B. (2021) 191:755–64. doi: 10.1007/s00360-021-01382-w
91. Joyce W, Ozolina K, Mauduit F, Ollivier H, Claireaux G, Shiels HA. Individual variation in whole-animal hypoxia tolerance is associated with cardiac hypoxia tolerance in a marine teleost. Biol Lett. (2016) 12:20150708. doi: 10.1098/rsbl.2015.0708
92. Nelson JA, Kraskura K, Lipkey GK. Repeatability of hypoxia tolerance of individual juvenile striped bass Morone saxatilis and effects of social status. Physiol Biochem Zool. (2019) 92:396–407. doi: 10.1086/704010
93. Rodgers EM, Gomez Isaza DF. The mechanistic basis and adaptive significance of cross-tolerance: a ‘pre-adaptation' to a changing world? J Exp Biol. (2023) 226:jeb245644. doi: 10.1242/jeb.245644
94. Earhart ML, Blanchard TS, Harman AA, Schulte PM. Hypoxia and high temperature as interacting stressors: will plasticity promote resilience of fishes in a changing world? Biol Bull. (2022) 243:149–70. doi: 10.1086/722115
95. Widmer S, Moore FB-G, Bagatto B. The effects of chronic developmental hypoxia on swimming performance in zebrafish. J Fish Biol. (2006) 69:1885–91. doi: 10.1111/j.1095-8649.2006.01242.x
96. Rutjes HA, Nieveen MC, Weber RE, Witte F, Van Den Thillart GEEJM. Multiple strategies of Lake Victoria cichlids to cope with lifelong hypoxia include hemoglobin switching. Am J Physiol-Regul Integr Comp Physiol. (2007) 293:R1376–83. doi: 10.1152/ajpregu.00536.2006
97. Ho DH, Burggren WW. Parental hypoxic exposure confers offspring hypoxia resistance in zebrafish (Danio rerio). J Exp Biol. (2012) 215:jeb074781. doi: 10.1242/jeb.074781
98. Chapman LJ, Liem KF. Papyrus swamps and the respiratory ecology of Barbus neumayeri. Environ Biol Fishes. (1995) 44:183–97. doi: 10.1007/BF00005915
99. Greaney GS, Place AR, Cashon RE, Smith G, Powers DA. Time course of changes in enzyme activities and blood respiratory properties of killifish during long-term acclimation to hypoxia. Physiol Zool. (1980) 53:136–44. doi: 10.1086/physzool.53.2.30152576
100. Sollid J, Weber RE, Nilsson GE. Temperature alters the respiratory surface area of crucian carp Carassius carassius and goldfish Carassius auratus. J Exp Biol. (2005) 208:1109–16. doi: 10.1242/jeb.01505
101. Nilsson GE. Gill remodeling in fish—a new fashion or an ancient secret? J Exp Biol. (2007) 210:2403–9. doi: 10.1242/jeb.000281
102. Gilmour KM, Perry SF. Conflict and compromise: using reversible remodeling to manage competing physiological demands at the fish gill. Physiology. (2018) 33:412–22. doi: 10.1152/physiol.00031.2018
103. Gilmour KM, Turko AJ. Effects of structural remodelling on gill physiology. J Comp Physiol B. (2024) 194:595–609. doi: 10.1007/s00360-024-01558-0
104. Soivio A, Tuurala H. Structural and circulatory responses to hypoxia in the secondary lamallae of Salmo gairdneri gills at two temperatures. J Comp Physiol B. (1981) 145:37–43. doi: 10.1007/BF00782591
105. Wood SC, Johansen K. Adaptation to hypoxia by increased HbO2 affinity and decreased red cell ATP concentration. Nat New Biol. (1972) 237:278–9. doi: 10.1038/newbio237278a0
106. Greaney GS, Powers DA. Cellular regulation of an allosteric modifier of fish haemoglobin. Nature. (1977) 270:73–4. doi: 10.1038/270073a0
107. Schmidt-Nielsen K. Scaling: Why is Animal Size so Important? New York: Cambridge University Press (1984). doi: 10.1017/CBO9781139167826
108. Nilsson GE, Östlund-Nilsson S. Does size matter for hypoxia tolerance in fish? Biol Rev. (2008) 83:173–89. doi: 10.1111/j.1469-185X.2008.00038.x
109. Faust HA, Gamperl AK, Rodnick KJ. All rainbow trout (Oncorhynchus mykiss) are not created equal: intra-specific variation in cardiac hypoxia tolerance. J Exp Biol. (2004) 207:1005–15. doi: 10.1242/jeb.00824
111. Dohm MR. Repeatability estimates do not always set an upper limit to heritability. Funct Ecol. (2002) 16:273–80. doi: 10.1046/j.1365-2435.2002.00621.x
112. Zhang Y, Mauduit F, Farrell AP, Chabot D, Ollivier H, Rio-Cabello A, et al. Exposure of European sea bass (Dicentrarchus labrax) to chemically dispersed oil has a chronic residual effect on hypoxia tolerance but not aerobic scope. Aquat Toxicol. (2017) 191:95–104. doi: 10.1016/j.aquatox.2017.07.020
113. Lessells CM, Boag PT. Unrepeatable repeatabilities: a common mistake. Auk. (1987) 104:116–21. doi: 10.2307/4087240
114. Stoffel MA, Nakagawa S, Schielzeth H. rptR: repeatability estimation and variance decomposition by generalized linear mixed-effects models. Methods Ecol Evol. (2017) 8:1639–44. doi: 10.1111/2041-210X.12797
115. Regan MD, Richards JG. Rates of hypoxia induction alter mechanisms of O2 uptake and the critical O2 tension of goldfish. J Exp Biol. (2017) 220:jeb154948. doi: 10.1242/jeb.154948
116. Nagy A, Csanyi V, Bakos J, Horvath L. Development of a short-term laboratory system for the evaluation of carp growth in ponds. Bamidgeh. (1980) 32:6–15.
117. Ding J, Zhang Y, Wang J, Liu C, Gao X, Wu Y, et al. Genome-wide association study identified candidate SNPs and genes associated with hypoxia tolerance in large yellow croaker (Larimichthys crocea). Aquaculture. (2022) 560:738472. doi: 10.1016/j.aquaculture.2022.738472
118. Ding J, Gao Z, Wang J, Zhang Y, Wang X, Wu X, et al. Genome-wide association and transcriptome analysis provide the SNPs and molecular insights into the hypoxia tolerance in large yellow croaker (Larimichthys crocea). Aquaculture. (2023) 573:739547. doi: 10.1016/j.aquaculture.2023.739547
119. Prchal M, D'Ambrosio J, Lagarde H, Lallias D, Patrice P, François Y, et al. Genome-wide association study and genomic prediction of tolerance to acute hypoxia in rainbow trout. Aquaculture. (2023) 565:739068. doi: 10.1016/j.aquaculture.2022.739068
120. Ferrari S, Horri K, Allal F, Vergnet A, Benhaim D, Vandeputte M, et al. Heritability of boldness and hypoxia avoidance in European seabass, Dicentrarchus labrax. PLoS ONE. (2016) 11:e0168506. doi: 10.1371/journal.pone.0168506
121. Wang X, Liu S, Jiang C, Geng X, Zhou T, Li N, et al. Multiple across-strain and within-strain QTLs suggest highly complex genetic architecture for hypoxia tolerance in channel catfish. Mol Genet Genomics. (2017) 292:63–76. doi: 10.1007/s00438-016-1256-2
122. Zhong X, Wang X, Zhou T, Jin Y, Tan S, Jiang C, et al. Genome-wide association study reveals multiple novel QTL associated with low oxygen tolerance in hybrid catfish. Mar Biotechnol. (2017) 19:379–90. doi: 10.1007/s10126-017-9757-5
123. Bernatchez L. On the maintenance of genetic variation and adaptation to environmental change: considerations from population genomics in fishes. J Fish Biol. (2016) 89:2519–56. doi: 10.1111/jfb.13145
124. San LZ, Liu BS, Liu B, Zhu KC, Guo L, Guo HY, et al. Genome-wide association study reveals multiple novel SNPs and putative candidate genes associated with low oxygen tolerance in golden pompano Trachinotus ovatus (Linnaeus 1758). Aquaculture. (2021) 544:737098. doi: 10.1016/j.aquaculture.2021.737098
Keywords: oxygen, teleost, acclimation, interindividual variation, population variation, Pcrit, loss of equilibrium, aquatic surface respiration
Citation: Babin CH and Rees BB (2025) Metrics, scales, and correlates of intraspecific variation in hypoxia tolerance in fishes. Front. Fish Sci. 3:1550222. doi: 10.3389/frish.2025.1550222
Received: 23 December 2024; Accepted: 03 March 2025;
Published: 19 March 2025.
Edited by:
Katja Anttila, University of Turku, FinlandReviewed by:
Takaaki Abe, Nihon University, JapanCopyright © 2025 Babin and Rees. This is an open-access article distributed under the terms of the Creative Commons Attribution License (CC BY). The use, distribution or reproduction in other forums is permitted, provided the original author(s) and the copyright owner(s) are credited and that the original publication in this journal is cited, in accordance with accepted academic practice. No use, distribution or reproduction is permitted which does not comply with these terms.
*Correspondence: Bernard B. Rees, YnJlZXNAdW5vLmVkdQ==
Disclaimer: All claims expressed in this article are solely those of the authors and do not necessarily represent those of their affiliated organizations, or those of the publisher, the editors and the reviewers. Any product that may be evaluated in this article or claim that may be made by its manufacturer is not guaranteed or endorsed by the publisher.
Research integrity at Frontiers
Learn more about the work of our research integrity team to safeguard the quality of each article we publish.