 Lauren M. Zhovmer
 Andres M. GonzalezBonet1
- 1US Food and Drug Administration (US FDA), Center for Food Safety and Applied Nutrition (CFSAN), College Park, MD, United States
- 2Oak Ridge Institute for Science and Education (ORISE), Oak Ridge, TN, United States
When reviewing the safety of food packaging, safety assessors must determine the migration levels of a food contact substance (FCS) from the packaging into the contained food products. Migration values can be expressed relative to levels in food using a single ‘food mass-to-surface area (mF/A) ratio’, representative of the general food supply. Because no published literature has examined mF/A ratios for the current U.S. food supply, this study aimed to use food databases to develop a standard mF/A ratio representative of packaged foods in the current U.S. food supply. First, we obtained information on the food-contact surface area (A) and food mass (mF) for a selection of packaged foods sold in U.S. retail stores. To adequately represent the variation of food products on the market, we identified a representative product per food category, using a 95-category list that was derived from the USDA WWEIA Food Categories. The values for A and mF per package were determined for each representative product using product size information from the Syndigo Nutrition Database. These data were used to calculate the A/mF ratio for each of the 95 representative products, and the average A/mF ratio was determined. The average A/mF ratio was weighted using consumption data from the WWEIA component of NHANES, so that more weight was given to foods that are consumed in greater quantities. The final step was to then take the reciprocal of the averaged A/mF ratio to obtain the final mF/A ratio. The resulting mF/A ratio was 4.8 g/in2, which rounds to 5 g/in2. In summary, we determined that 5 g/in2 is representative of the current U.S. food supply and could be used as a standard mF/A ratio when estimating migration levels of an FCS from packaging into food.
Introduction
Around the world, various regulatory agencies review the available information to ensure the safety of the global food supply. In the U.S., substances that are used in contact with food are regulated as food additives by the Food and Drug Administration (FDA) under the Federal Food, Drug, and Cosmetic Act (FD&C Act). Section 409(h) (6) of the FD&C Act defines a food contact substance (FCS) and outlines the present primary pre-market approval process, known as the food contact notification (FCN) process, whereby FCSs can be deemed safe for their intended or proposed use. The FCN process is codified and described in Title 21, Part 171, of the Code of Federal Regulations (denoted as 21 CFR 171.1 through 171.130). For the purposes of this paper, we define a single-use food contact article (FCA) as the finished packaging product, e.g., film, bottle, or container, intended for use in direct contact with a single food product and not intended for repeat applications. As the result of their intended use, FCSs in single-use FCAs can migrate into food and become components of food.
FDA’s safety assessment of an FCS relies on evaluating probable dietary exposure to the FCS, including all constituents or impurities, as a result of the proposed use and other authorized uses, and ensuring that probable dietary exposures are supported by the available toxicological information. The recommended chemistry information for an FCN includes discussions and data on the identification of those substances that potentially could migrate to food, as well as estimates of resultant consumer dietary exposure.
Exposure estimates for FCSs usually involve combining migrant levels in food with parameters based on information on uses of articles (e.g., packaging) that might contain the FCS. Depending on the available information, migration values for an FCS and/or constituents are generally determined by accelerated migration testing using food simulants and are expressed relative to the surface area of the test article, i.e., migrant mass-per-surface area (mm/A). These values, in turn, can be expressed as migrant levels in food based on information on the food mass-to-surface area (mF/A) for the articles. For single-use articles, such as a beverage bottle or yogurt cup, the historical value that is presently used in the U.S. is 10 g food per square inch of FCA (10 g/in2). The FDA often estimates migration levels of FCSs using this standard mF/A ratio, which is intended to be representative of all FCA used in the U.S. food supply. While different food products have different food masses and surface areas–and therefore different mF/A ratios–using one value as an assumed standard mF/A ratio simplifies the migration calculations. It can also be applied to a broad range of food contact applications, such as paper and plastic packaging (FDA, 2007), liquid and powder formula packaging (FDA, 2019), and recycled plastics in food packaging (FDA, 2021).
Innovations in packaging materials and other food trends can affect the way that food is sold in the U.S., which may have an impact on the suitability and applicability of the standard mF/A ratio used in the U.S. of 10 g/in2. The FDA’s standard mF/A ratio of 10 g/in2 was first introduced in 1976 (FDA, 1976) and was based on the mF/A ratio for the metal food can, which was a dominant form of food packaging commonly available at that time. With the recent technological innovations in the food packaging industry, this value developed decades ago may not reflect the current market. For example, there has been a shift in food packaging types from rigid packaging, such as glass, paperboard, metal, and plastic rigid containers, to flexible packaging, such as bags, and pouches made from various films (Freedonia, 2011; Mintel, 2019). This shift to more food and beverages packaged in flexible packaging equates to smaller packages and smaller portion sizes which overall result in lower calculated mF/A ratios. Also, because calculations are based on product size and packaging surface area, the growing consumer interest in smaller format ‘convenience’ packaging (Mintel, 2018) could also impact a calculated mF/A ratio.
Other international regulatory groups also use one standard representative mF/A ratio when estimating FCS migration into food, and their standard values may be more reflective of current packaging trends. While there is no public source available that summarizes the values that other countries use, these values can be found in or derived from various available literature. For example, Health Canada uses a standard mF/A ratio of 5 g/in2 as part of their regulatory review process (Vivas, 2013; Health Canada, 2020). In the European Union (EU), according to Article 17 of Regulation (EU) No. 10/2011, the conventional assumption is that an individual consumes 1 kg of food daily and that the food is packaged in a cubic plastic container with a food contact surface area of six square decimeters (dm2) (EC, 2011). The EU’s assumption for plastics corresponds to an A/mF ratio of six dm2/kg food. When converted to grams and inches, this equals a standard mF/A ratio of 10.75 g food/in2. While these values may be considered more recently established into practice than the FDA’s use of 10 g/in2 in 1976, packaging and consumption patterns can greatly vary regionally. The use of data sources specific to U.S. food packaging and food consumption patterns would help in ensuring a standard mF/A ratio applicable to the U.S.
Based on the trends discussed above, there is a need to evaluate the packaged food supply in the U.S. to determine a standard mF/A ratio representative of the current market. The mF/A ratio first referenced by the FDA in 1976 has not been re-evaluated, and while more recently published mF/A ratios exist, they were calculated for the food supplies of other countries. Using a value not representative of the current U.S. market may affect migration estimates. The objective of this study is therefore to use U.S. food databases to determine a standard mF/A ratio representative of all packaged foods in the current U.S. food supply.
Materials and methods
Surface area and food mass values for packaged foods sold in the U.S.
In order to determine a representative mF/A ratio for all packaged foods in the U.S., we first obtained information on the food contact surface area (A) and food mass (mF) for FCAs used for packaged foods sold in U.S. retail stores. We then used this information to calculate the A/mF and mF/A ratios for representative products from a variety of food categories. Finally, we used dietary intake data from the National Health and Nutrition Survey (NHANES) to calculate a consumption-weighted average A/mF ratio. Taking the inverse of this ratio resulted in a final mF/A ratio, representative of the totality of packaged foods in the U.S. The steps of this approach are illustrated in Figure 1.
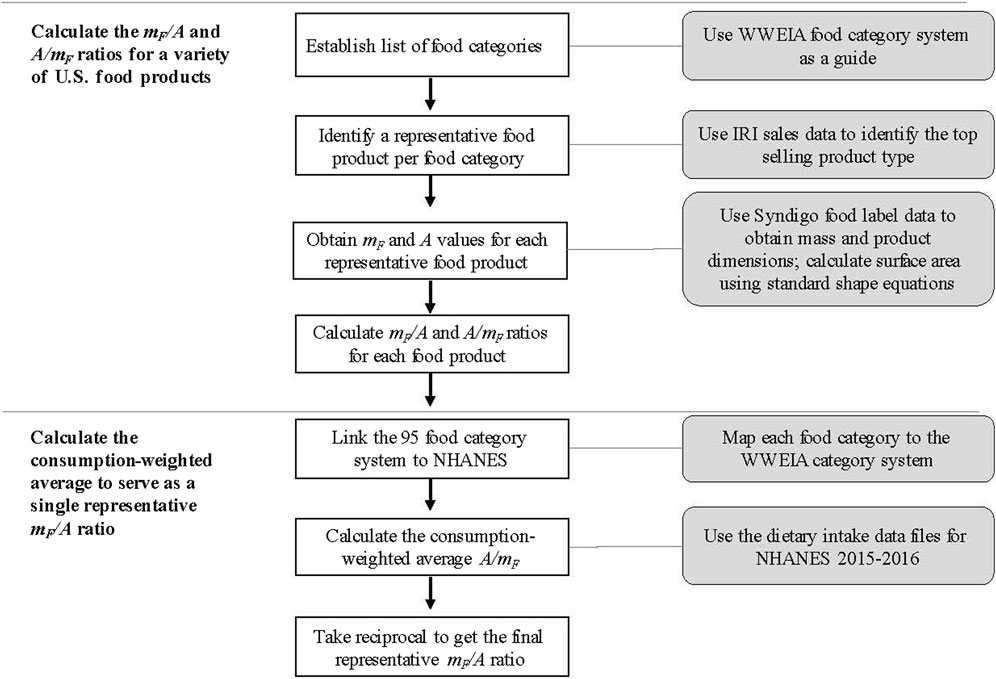
Figure 1. Steps outlining the general approach taken to calculate a representative mF/A ratio for food contact articles in the U.S.
Determination of food categories
The first step was to identify specific food products to include in the analysis. There are a number of choices for the consumer with regard to food products, type of processing, brands, sizes, and packaging types available in the U.S. retail market. Calculating the mF and A for every food product in the U.S. was not feasible for this study. Therefore, to adequately represent the variation of food products on the market in our calculations, we analysed the food supply at the food category level, determining the mF and A for one representative product in each food category. This food category-level analysis aimed to account for the variability in food types by grouping similar products and selecting a representative product for the food category. For example, a top selling 1-gallon carton of whole milk was selected to represent the entire whole milk food category. As another example, a top selling 12-ounce plastic bag of caffeinated ground coffee was selected to represent the entire ground coffee category.
The NHANES is a large, complex survey of the U.S. population conducted by the National Center for Health Statistics (NCHS) in the Center for Disease Control and Prevention (CDC) (NCHS, 2018a). NHANES data are released in 2-year cycles, including a dietary intake component. The most recent year of data available at the time of this study was for the 2015-2016 cycle. Details on the survey design, data collection procedures, and other methodology related to the dietary intake portion of NHANES are publicly available elsewhere (NCHS, 2018b). Of particular interest to this study, the United States Department of Agriculture (USDA) develops and provides a comprehensive list of food categories that are published every 2 years along with the corresponding NHANES cycle’s dietary data. These food categories–the What We Eat in America (WWEIA) Food Categories–are a full categorization system, covering all foods reported to be eaten in the corresponding NHANES dietary data files (USDA ARS, 2018b). Because of its appropriate coverage of the U.S. food supply and its ability to allow mapping to NHANES datasets for dietary intake analyses, we chose the WWEIA Food Categories as a guide for the development of the list of food categories for this study.
Based on an analysis of the WWEIA Food Categories and by grouping similar food products into the same food categories, we determined that a list of ninety-five (95) food categories would serve as an appropriate representation of the current U.S. packaged food supply. The list is comprised of commercially packaged foods, typically sold through retail channels. Several of the 95 food categories align directly with the WWEIA Food Categories, such as Bacon (our category 21) and Tortillas (our category 40), while others vary slightly from the WWEIA Food Categories. For example, while the WWEIA Food Categories have two separate yogurt categories (Yogurt, regular and Yogurt, Greek), we only included one yogurt category (our category 12). Because of the similarity in packaging shape and size for regular and Greek yogurt, we determined that there was no need to analyse two separate yogurt food categories for the purpose of this project. Supplementary Table SA of the Appendix provides the full list of food categories used for this analysis.
Determination of representative products
Each food category contains numerous food products of varying shapes and sizes, and therefore varying mF and A values. As noted above, to optimize time and resources, we selected one representative product for each food category and calculated its mF and A values to represent the entire category. We used the product size with the greatest market share as a consistent approach to determining the most often purchased product for each category. For the purposes of this approach, we assumed that products of the same size (i.e., equal mass) in a category have the same packaging dimensions. Once the most often purchased product size was identified, we selected the bestselling product for that size as the category’s representative product.
In order to systematically identify the most popular product sizes, we used sales information to analyze market share. The IRI Total Store Advantage™ (herein referred to as IRI) database provides individual product-level information about when and how much of a product is sold through U.S. retail stores (Information Resources Inc, 2022). We aggregated total sales volume information for the full 52-week span of the year 2018, which was the most recent time frame available at the time of conducting this study. We then grouped the market share data by product size and sorted by volume sales to determine the product size with the largest market share. For most food categories, identifying the most common product size was a straight-forward approach, because certain specific product sizes are very common for that category. For example, the majority of shredded cheese is sold in either 8-ounce, 16-ounce, or 32-ounce plastic bags. With 56% of all sales coming from the 8-ounce size, this product size and shape was identified as the best-selling product and therefore selected as the representative product for the shredded cheese category. For a few food categories, we grouped products by mass (ounces) ranges prior to determining the size with the largest market share. For example, when analyzing the Frozen Meals-Single Serve category, we grouped products into 4.00–4.99 ounces, 5.00–5.99 ounces, 6.00–6.99 ounces, etc., and the group with the largest market share was selected to represent the most common product size.
Database selection to derive mF and A values for each representative food product
The calculation of the mF and A values for each of the representative food products required a data source of packaged food products containing data on the identity, size, and dimensional measurements of such products. Specific labelling requirements exist for most foods under the FD&C Act and its amendments. These requirements include the specification that most packaged food products sold in the U.S. have their mass or volume clearly labelled on the front of the product, also known as the net quantity of contents statement (FDA, 2013). To accomplish our goal, we needed a database containing both food package dimensional measurements and mass/volume text from the front of U.S. food package labels to serve as the source for our mF and A value calculations. Using information from the same database to calculate both A and mF removes the potential for inconsistencies between datasets. While unlikely, this prevented possibilities of different data collection methodologies affecting our A/mF ratio and mF/A ratio calculations.
The food product data source selected for this study was the Syndigo Nutrition database (herein referred to as the Syndigo database), which provides detailed data for packaged food products collected either from retail stores or directly from manufacturers (Syndigo, 2022). The database includes various fields of product information, including the mass/volume measurements from the front of the package label and the height, width, and depth dimensional information for each product’s packaging. These product dimensions are critical for calculating A values for FCAs. The dimensions presented in the Syndigo database are for a packaged food’s external package. The database does not report the dimensions of any inner packaging, such as a bag inside a box of breakfast cereal, which would be a more accurate source of information for calculating A values. In the cases where an internal package existed, we assumed that the external dimensions would be an adequate representation of the internal packaging dimensions for the purpose of this analysis. In addition, for foods that do not contain an inner package (e.g., a pasta box or soda can), the inner food contact surface was assumed to have the same area as the exterior of the food package, as the thickness of a food package is minimal and would not significantly alter the dimensional analysis. As of August 2019, the Syndigo database contained information for over 500,000 products collected since 1999.
Calculation of A, mF, the mF/A ratio, and the A/mF ratio per food category
We calculated the surface area of the packaging in contact with the food product using the height, width, and depth fields provided in the Syndigo database. These measurements were obtained by Syndigo following the GS1 Package Measurement Rules Standard for retail packages (GS1 2021). For all packaging, we assumed all surfaces to be smooth, all edges to be sharp, and unless curved, flexible surfaces that were shaped by the contents of their packaging to be flat. The surface areas for most products were calculated using standard cylinder and rectangular prism surface area equations. Food packaging may be categorized into two broad categories, rigid or flexible packaging. Types of rigid packaging include, but are not limited to, glass bottles and jars, metal cans, paperboard boxes, and plastic bottles and jars. Products packaged in a container with a cylindrical shape include juices and carbonated soft drinks sold in cans, jars, and bottles. Examples of rigid products with a rectangular prism shape include boxed dry pasta and tubs of ice cream. Flexible packaging types include, but is not limited to, films, bags, and pouches of varying shapes and sizes. Certain products sold in flexible packaging, such as ground coffee, sugar, and flour, have well defined shapes. On the other hand, some bagged products required the use of a different surface area equation that considered the shape of a sealed top (i.e., a stand-up pouch). Examples of such products include resealable snacks and frozen foods. We termed this shape a ‘rectangular prism with no top’. The surface area for the three shapes used are defined by the following equations (Eqs 1-3):
where A is the surface area of the packaging that is in contact with food in square inches (in2), w is the width (in), h is the height (in), and d is the depth (in) of the food product.
In addition to A, the other necessary variable for calculating the A/mF ratio is mF. As mentioned previously, the Syndigo database provides the mass or volume information for food products as found labelled on the front of the product package. For products with size information labelled in mass units, we used the product size directly as mF. For products where size information was provided in volumetric measures (e.g., beverages, ice cream), we approximated mF by converting the volume information into mass using density information of a standard reference product, obtained from the USDA National Nutrient Database for Standard Reference (USDA ARS, 2018a). The reference standards and the results of these conversions are summarized in Supplementary Table SB of the Appendix.
Because both the A/mF ratio and the mF/A ratio are needed for this analysis, we calculated both values for the representative product for each of the 95 identified food categories. As an illustrative example, Figure 2 provides the A value, mF value, and the corresponding ratio calculations for four of the study’s food categories. The four food categories represented in this figure demonstrate items of varying food types that have differing packaging shapes (e.g., cylinder vs. rectangular prism vs. rectangular prism with no top).
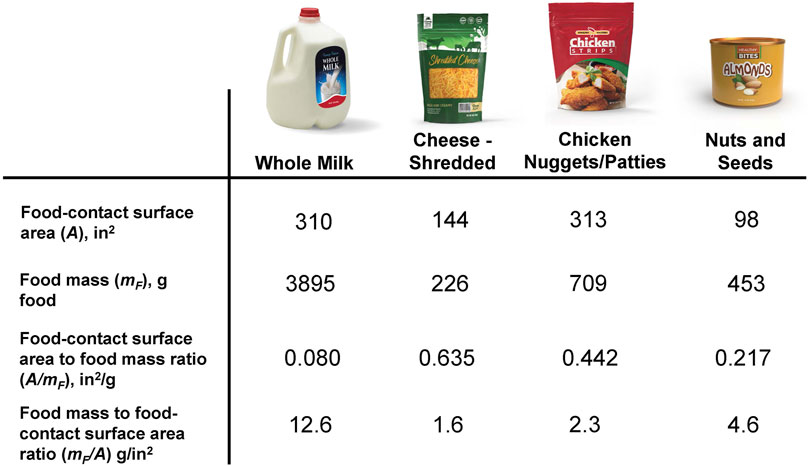
Figure 2. Four of the 95 categories identified for this study, with size information and calculated A/mF and mF/A ratios for the per-category representative products.
Determination of a representative mF/A ratio for all U.S. Foods
The final step of the analysis was to take the A/mF values for the 95 food categories and determine a single representative value. The reciprocal of this value–a single mF/A ratio–is the final representative mF/A ratio for the current U.S. food supply. As opposed to simply averaging the 95 A/mF ratios, we applied a weighting factor, and therefore our calculation was a weighted average. Our approach to applying a weighting factor incorporated dietary consumption data for the foods included in each of the 95 food categories, and therefore we termed the result a ‘consumption-weighted average’. Essentially, categories containing foods that are consumed more often and in greater quantities influenced the final value more than categories containing foods eaten less frequently and in lower quantity. In order to weight the data in this fashion, we relied on the dietary intake records collected in the WWEIA component of NHANES.
Preparation of the Merged NHANES + A/mF ratios dataset
Every 2 years, NHANES releases data from a 24-h dietary recall survey conducted on a statistically significant sample of the U.S. population. These data from NHANES–hereon referred to as dietary data files - contain specific information for each of the individual foods reported consumed by each interviewed respondent, including respondent information, respondent sample weights for statistical analysis, and names/descriptions of each food product consumed. Of importance to this analysis, not only are descriptions of the individual foods provided, but also the quantity (mass) of each of the individual foods consumed per person. The data on the mass of each individual food consumed was the variable allowing us to weight our final representative A/mF value based on reported consumption.
In addition to the variables noted above, every food reported eaten in the dietary data files is linked to a ‘food code’ found in the Food and Nutrient Database for Dietary Studies (FNDDS) (USDA ARS, 2018c). In turn, each FNDDS food code is linked to a WWEIA category (USDA ARS, 2018d). As stated previously, our 95-category system was developed to closely align with the WWEIA category system. Therefore, it was appropriate to utilize the associated WWEIA category to link our 95 food categories to the corresponding NHANES consumption data for each category. By aligning the NHANES consumption data with the corresponding food categories, we were able to determine the quantity (in grams) of food consumed by the U.S. population for most of our 95 food categories.
Using SAS 9.4 statistical software, we prepared a dataset that contained (1) the individual foods reported consumed in the NHANES dietary intake data for the 2015-2016 2-year cycle, including respondent ID and nationally representative sample weight, (2) the mass in grams of each individual food reported consumed by each respondent in NHANES, (3) the associated food category from our list of 95 food categories, and (4) the representative A/mF value for the associated food category that we calculated using the Syndigo data. We limited the dataset to ages 1+ and excluded breast-fed respondents. All tap water reported consumed was assigned the A/mF value of bottled water (category 78), effectively assuming that an individual’s entire diet comes from packaged foods.
The linking process was not able to directly align foods reported in the NHANES data to five of the 95 packaged food categories (oatmeal, ground coffee, single cup coffee, tea bags, and protein (and nutritional) powders). For example, the quantities of coffee consumed reported in NHANES data are provided in the brewed (water added) form, while the packaged category for coffee is reported as ground coffee (category 72). The category A/mF ratio for ground coffee needed to be adjusted for the brewing process when it was linked to the consumption data for a “cup of coffee” (category 78). We applied conversion factors to categories where the packaged product differs from the consumed form of the product (e.g., ground coffee versus coffee as consumed). These calculations were performed in Excel and then incorporated into the final dataset. Additional details on these ‘as packaged’ to ‘as consumed’ conversion factors can be found in Supplementary Table SC of the Appendix.
Analysis of the dataset to derive a consumption-weighted final representative mF/A ratio
Arriving at the final consumption-weighted mF/A ratio involved two consecutive weighted average calculations: (1) First, calculating the average A/mF ratio for each individual respondent. This was weighted by the mass of each individual food consumed by that respondent. Then, (2) averaging these individual respondent A/mF ratios together, using the NHANES nationally representative respondent sample weights. The result of following these two steps was what we defined as the consumption-weighted average.
The first of the two steps used the mass in grams of each individual food reported consumed by a respondent in NHANES to calculate the weighted average A/mF ratio for that specific person. This was performed for every respondent in the dataset. The weighted average surface area to food mass ratio for each respondent (
where n is 95, mF (category) is the mass of food reported by the respondent as mapped correspondingly to a food category, and A/mF (category) is the surface area-to-food mass ratio for the representative product of the jth category.
The second step was to average the individual respondents’ A/mF ratios, using the nationally representative sample weights provided with the NHANES dietary data files ensure that the final average is weighted to represent the U.S. population. The following general equation (Eq. 5) was used to calculate the final average A/mF ratio,:
Where
Results
Table 1 provides the final calculations for the representative products for each of the 95 food categories. The name and size of each of the representative food products are listed in the table, as well as the product’s calculated A/mF and mF/A ratios. For example, for the Ground Meat category (#13), the identified representative product was ground beef, and the top selling size was 16 ounces. The calculated A/mF and mF/A ratios for this product were 7.35 in2/g and 0.136 g/in2, respectively.
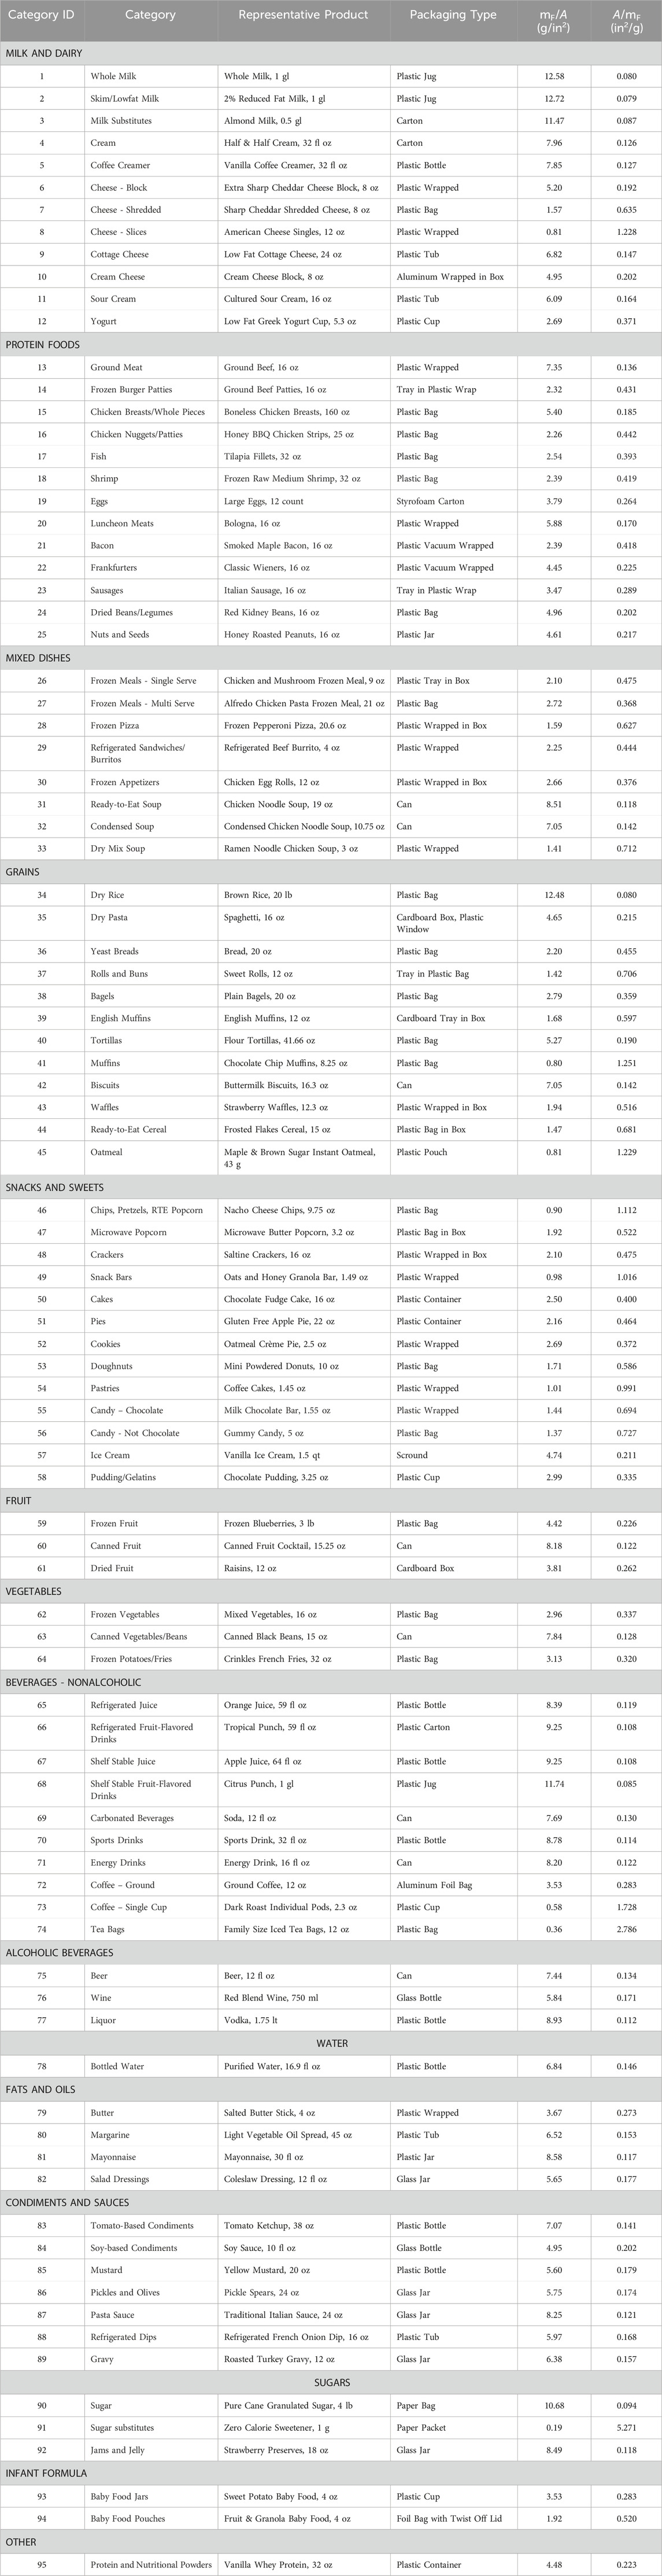
Table 1. Calculated mF/A and A/mF ratios for representative food products in the United States.
The 95 food categories identified for this study span the U.S. packaged food supply. The mF/A is intended to provide comparative ratios to others reported in the literature and was obtained by taking the reciprocal of the calculated A/mF ratio. The mF/A ratios range from 0.19 g/in2 to 12.72 g/in2, and the A/mF ratios range from 0.079 in2/g to 5.271 in2/g. The representative product with the greatest mF/A ratio was 1-gallon reduced fat milk, with an mF/A ratio of 12.72 g/in2. The representative product with the smallest mF/A ratio was the 1-g zero calorie sweetener packet, with an mF/A ratio of 0.19 g/in2.
The results from determining the representative mF/A ratio for the current U.S. packaged food supply are provided in Table 2. Using our approach of calculating a consumption-weighted average of the 95 category A/mF ratios, the final A/mF ratio was 0.209 in2/g, with a standard deviation of 0.039. Taking the inverse of this consumption-weighted average A/mF ratio resulted in the mF/A ratio of 4.78 g/in2. This single mF/A ratio is representative of the current U.S. food supply. For comparison purposes only, we also included a calculation of simply averaging the 95 category mF/A ratios, resulting in an A/mF ratio of 0.429 in2/g, and the inverse of this equated to an mF/A ratio of 2.33 g/in2.
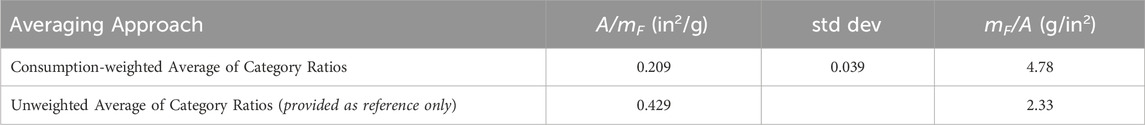
Table 2. Final representative mF/A ratio for all packaged foods in the current U.S. market. The value was calculated by taking the reciprocal of the consumption-weighted average A/mF ratio. The unweighted average A/mF ratio and its reciprocal mF/A ratio are provided as well for comparison purposes.
Discussion
The mF/A ratios of packaged food products in the U.S. vary greatly across food categories and packaging types. Across our selection of food categories, the mF/A ratios range from 0.18 g/in2 to 12.72 g/in2 (see Table 1). This general finding emphasizes the importance of sampling across a wide array of food categories when assessing the mF/A ratios for packaged food products in the U.S. Of the 95 food categories, six representative products were found to have an mF/A of greater than or equal to 10 g/in2. Products that met these criteria include a gallon jug of milk, a 4 lb bag of sugar, and a 20 lb bag of rice. In comparison, 34 representative products were found to have an mF/A between 5 and 10 g/in2, and 55 were found to have an mF/A of less than 5 g/in2. These findings validate our choice in methodology to sample a vast array of products across the food supply before determining the final representative mF/A ratio.
Our final representative mF/A ratio of 4.78 g/in2 rounds to a whole number of 5 g/in2. The use of whole numbers is preferable here to accomplish the dual task of simplifying migration calculations while still providing a standard mF/A ratio that is sufficiently representative of the U.S. market.
Our resulting mF/A ratio can roughly be compared to mF/A ratios available in the open literature for other regions of the world. After unit conversions, the EU’s assumption for plastics equals a standard mF/A ratio of 10.75 g food/in2. The Grupo Mercado Común (Common Market Group) recommends the use of the same mF/A ratio as the EU for plastic FCAs used in Argentina, Brazil, Paraguay, and Uruguay (GMC, 2019). The International Life Science Institute Europe (ILSI Europe), Packaging Material Task Force, estimated a mean food-contact surface area for an individual’s daily diet of 20.1 dm2/p/d (square decimeters per person per day) for all food packaging based on 1995 EU packaging data (ILSI Europe, 1997). Assuming an individual’s daily diet is 3 kg of food per day and that the entire diet is packaged in FCAs, the ILSI value of 20.1 dm2/p/d is equivalent to 9.6 g food/in2. In 2002, Bouma et al. (2003) conducted a survey on the domestic use of food packaging in the Netherlands. Using these data, one can determine an average mF/A ratio for all surveyed food packaging in the Netherlands of 3.8 g food/in2. Poças et al. (2009) reported on the results of a 2007 survey of food packaging usage in Portuguese urban families, at the household level, and using these data, one can determine a mF/A ratio for all surveyed food packaging of 2.6 g food/in2. From an analysis of the Irish National Children’s Food Survey for children aged 5–12 years, Duffy et al. (2007) determined a mean food-contact area for all food packaging of 13.44 dm2/person/day and a mean intake of packaged food of 1,195 g/day. Using these values, a mF/A ratio for all surveyed package food for Irish children of 5.73 g/in2 can be determined. Due to concerns with small food packages with high contact surface area per volume, such as PVC cling films in contact with cheese products, Grob et al. (2007) proposed for European legislation to assume 20 dm2 contact surface area per liter of packaging instead of migration limits based in concentrations. Assuming a food density of 1 kg/L, the assumption is equivalent to a mF/A ratio of 3.2 g/in2.
These values from different regions can only be roughly compared, as some are from legislation and some are from research publications, However, our final representative mF/A ratio is less than the value identified for some regions (FDA, 2007; EC, 2011) and greater than the mF/A ratio identified for other regions (Bouma et al., 2003; Poças et al., 2009). This could be due to a shift in packaging types and shapes over time and region, or due to the robustness of our methodology, which importantly considers both food intake and surface area of food packaging, per food categories that cover the U.S. daily diet. It is of note that our result of 5 g/in2 aligns with the mF/A ratio found in Health Canada’s reporting on migration calculations (Vivas, 2013). Retail products and packaging types may be similar between the two North American countries.
The various standard mF/A ratios presented by different countries show that regional consumption patterns–as determined in part by the available food supply and packaging–and calculation methodology can impact the resulting mF/A ratio. A primary limitation of our study is that the results are specific only to the U.S. Our data sources used for food packaging dimensions, retail product sales, as well as dietary consumption patterns were all specific to the U.S. population. It could be of interest for future research to apply similar methods to other countries, where the necessary food product dimension and dietary consumption data are available for the countries of interest. The methodology steps provided in Figure 1 could be followed using these country-specific data sources in place of the U.S. data sources.
This study followed methodology that is novel in comparison to approaches found in the literature. To calculate an mF/A ratio representative of the U.S. food supply, we used both a commercial database of food product dimensions, as well as national dietary food recall surveys. It is difficult to glean the specific methodology behind the mF/A ratios referred to for other regions, but in some cases, we found that an assumed ‘total food consumed per person per day’ of 1 kg (packaged in plastic only) (EC, 2011) or 3 kg (ILSI Europe, 1997) was broadly used. Also, in some cases, an ‘assumed food packaging surface area for all foods’ has been utilized (EC, 2011 assumes six dm2). Our study’s use of specific food product dimensions and respondent dietary recall data eliminates the uncertainty that may result from making broad assumptions, such as those mentioned above.
The incorporation of a consumption-weighted average in this study is of particular note. For comparison purposes, we also calculated an ‘unweighted average’ by simply averaging the 95 per-category mF/A ratios, resulting in an unweighted average mF/A ratio of 2.33 g/in2–which rounds to 2 g/in2. This difference from our calculation of 5 g/in2 confirms that the use of a consumption-weighting process was essential for obtaining a representative value that is an accurate reflection of what the U.S. population is consuming. Using an unweighted average does not account for food categories that are consumed more frequently than others and in greater amounts. All consumers neither eat evenly nor from all categories. It is important to consider the diets of consumers to understand which categories are the strongest determinants of consumer exposure, and a consumption-weighted average approach appropriately takes this into account.
This study provided a detailed analysis of mF/A ratios for food products representative of the current U.S. market. The use of packaged food sales data and dietary intake data within our analysis incorporated a wide range of retail products relevant to the current U.S. food supply. In summary, our effort to determine a mF/A ratio representative of all packaged foods in the current U.S. food supply resulted in a value of 5 g/in2.
Data availability statement
The original contributions presented in the study are included in the article/Supplementary Material, further inquiries can be directed to the corresponding author.
Author contributions
LZ: Writing–original draft, Writing–review and editing. AG: Writing–original draft, Writing–review and editing. MG: Writing–review and editing. AB: Writing–review and editing. KA: Writing–review and editing.
Funding
The author(s) declare that no financial support was received for the research, authorship, and/or publication of this article.
Conflict of interest
The authors declare that the research was conducted in the absence of any commercial or financial relationships that could be construed as a potential conflict of interest.
Publisher’s note
All claims expressed in this article are solely those of the authors and do not necessarily represent those of their affiliated organizations, or those of the publisher, the editors and the reviewers. Any product that may be evaluated in this article, or claim that may be made by its manufacturer, is not guaranteed or endorsed by the publisher.
Supplementary material
The Supplementary Material for this article can be found online at: https://www.frontiersin.org/articles/10.3389/frfst.2024.1408805/full#supplementary-material
References
Bouma, K., Stavenga, K., and Draaijer, A. (2003). Domestic use of food packaging materials in The Netherlands. Available at: https://library.wur.nl/ebooks/VWA/1779160.pdf (Accessed May 12, 2022).
Duffy, E., Hearty, A. P., McCarthy, S., and Gibney, M. J. (2007). Estimation of exposure to food packaging materials. 3: development of consumption factors and food-type distribution factors from data collected on Irish children. Food Addit. Contam. 24 (1), 63–74. doi:10.1080/02652030600865475
[EC] European Commission (2011) European Commission Regulation (EU) No. 10/2011 of 14 January 2011 on plastic materials and articles intended to come into contact with food. Brussels: European Commission, 4–5.
[FDA] U.S. Food and Drug Administration (1976) FDA guidelines for chemistry and technology requirements of indirect food additives petitions. Washington, D.C., United States: U.S. Department of Health and Human Services, U.S. Food and Drug Administration.
[FDA] U. S. Food and Drug Administration (2007). U.S. food and drug administration (US FDA) guidance for industry: preparation of premarket submissions for food contact substances: chemistry recommendations. Available at: http://www.fda.gov/Food/GuidanceRegulation/GuidanceDocumentsRegulatoryInformation/ucm081818.htm (Accessed May 11, 2022).
[FDA] U.S. Food and Drug Administration (2013). Guidance for industry: a food labeling guide. Available at: https://www.fda.gov/regulatory-information/search-fda-guidance-documents/guidance-industry-food-labeling-guide.
[FDA] U.S. Food and Drug Administration (2019). Guidance for industry: preparation of food contact notifications for food contact substances in contact with infant formula and/or human milk. Available at: https://www.fda.gov/regulatory-information/search-fda-guidance-documents/guidance-industry-preparation-food-contact-notifications-food-contact-substances-contact-infant (Accessed May 12, 2022).
[FDA] U.S. Food and Drug Administration (2021). Guidance for industry: use of recycled plastics in food packaging (chemistry considerations). Available at: https://www.fda.gov/regulatory-information/search-fda-guidance-documents/guidance-industry-use-recycled-plastics-food-packaging-chemistry-considerations (Accessed May 12, 2022).
[FDA] U. S. Food and Drug Administration (2022). About the FCS review program. Available at: https://www.fda.gov/food/inventory-effective-food-contact-substance-fcs-notifications/about-fcs-review-program (Accessed May 12, 2022).
[Freedonia] The Freedonia Group (2011) Food containers: rigid and flexible in the United States to 2015. Cleveland, OH, United States: The Freedonia Group, 1.
Global Standards 1 (2021). GS1 Package and Product Measurement Standard: the global standard for nominal measurement attributes to facilitate communication of the same for retail and non-retail products covering consumer unit to pallet and all intermediary levels. Available at: https://www.gs1.org/docs/gdsn/3.1/GS1_Package_Product_Measurement_Standard.pdf (Accessed May 12, 2022).
Grob, K., Pfenninger, S., Pohl, W., Laso, M., Inmhof, D., and Rieger, K. (2007). European legal limits for migration from food packaging materials: 1. Food should prevail over simulants; 2. More realistic conversion from concentrations to limits per surface area. PVC cling films in contact with cheese as an example. Food control. 18, 201–210. doi:10.1016/j.foodcont.2005.09.015
Gürtler, R. (2020). “Risk assessment of food additives,” in Regulatory toxicology (Berlin, Heidelberg: Springer Berlin Heidelberg), 1–15.
Health Canada (2020). Information requirements for food packaging submissions. Available at: https://www.canada.ca/en/health-canada/services/food-nutrition/legislation-guidelines/guidance-documents/information-requirements-food-packaging-submissions.html (Accessed May 12, 2022).
[ILSI Europe] ILSI Europe Packaging Materials Task Force (1997). Food consumption and packaging usage factors. Available at: https://ilsi.eu/publication/food-consumption-and-packaging-usage-factors (Accessed May 11, 2022).
Information Resources Inc Information resources Inc. Available at: https://www.iriworldwide.com/en-US (Accessed May 13, 2022).
[Mintel] Mintel Group Ltd (2018) Food packaging trends – US, june 2018. Pack size. London, United Kingdom: Mintel Group Ltd, 31–32.
[Mintel] Mintel Group Ltd (2019) Food packaging trends – US, june 2019. Key players. London, United Kingdom: Mintel Group Ltd, 21–22.
[NCHS] National Center for Health Statistics (2018b). NHANES 2015-2016 dietary data. Hyattsville (MD): US department of Health and human services, center for Disease Control and prevention. Available at: https://wwwn.cdc.gov/nchs/nhanes/search/datapage.aspx?Component=Dietary&CycleBeginYear=2015 (Accessed May 18, 2022).
[NCHS] National Center for Health Statistics (2018a). NHANES data 2015-2016. Hyattsville (MD): US department of Health and human services, center for Disease Control and prevention. Available at: https://wwwn.cdc.gov/nchs/nhanes/continuousnhanes/default.aspx?BeginYear=2015 (Accessed May 18, 2022).
Poças, M. F. F., Oliveira, J. C., Pinto, H. J., Zacarias, M. E., and Hogg, T. (2009). Characterization of patterns of food packaging usage in Portuguese homes. Food Addit. Contam. Part a. 26 (9), 1314–1324. doi:10.1080/02652030903046690
Syndigo (2022). Comprehensive nutritional info – nutritional information and wellness. Available at: https://syndigo.com/solutions/create/(Accessed May 18, 2022).
The Grupo Mercado Común (2019) GMC resolution Numbers 39/2019; Reglamento técnico MERCOSUR sobre la lista positive de aditivos para elaboración de materiales plásticos y revestimientos poliméricos destinados a entrar en contacto con alimentos (complementación de la resolución GMC Nº 39/19). Uruguay: The Grupo Mercado Común.
United States Code (2011) United States code. Office of the federal register (United States). 21 U.S.C. $348(h)(6). Washington, D.C.: United States Code.
[USDA ARS] U.S. Department of Agriculture, Agricultural Research Service (2018d). FNDDS codes linked to WWEIA Food Categories (Excel file). Available at: https://www.ars.usda.gov/ARSUserFiles/80400530/apps/WWEIA1516_foodcat_FNDDS.xlsx (Accessed May 18, 2022).
[USDA ARS] U.S. Department of Agriculture, Agricultural Research Service (2018c). USDA food and nutrient database for dietary studies 2015-2016. Available at: http://www.ars.usda.gov/nea/bhnrc/fsrg (Accessed May 18, 2022).
[USDA ARS] U.S. Department of Agriculture, Agricultural Research Service (2018a). USDA national nutrient database for standard reference. Available at: https://ndb.nal.usda.gov (Accessed August 14, 2019).
[USDA ARS] U.S. Department of Agriculture, Agricultural Research Service (2018b). What we eat in America food categories 2015-2016. Available at: www.ars.usda.gov/nea/bhnrc/fsrg (Accessed May 12, 2022).
Vivas, M. (2013). An outline of food packaging Regulations in Canada. Available at: https://www.worldpackaging.org/Uploads/SaveTheFood/Canada.pdf (Accessed May 29, 2022).
Keywords: migration, food contact articles, food contact substances, FCS, contact ratio, packaging, NHANES, US FDA
Citation: Zhovmer LM, GonzalezBonet AM, Garg M, Bailey AB and Arvidson KB (2024) Determination of a representative food mass-to-surface area ratio (mF/A) for estimating migration values of food contact substances in single use food contact articles marketed in the United States. Front. Food. Sci. Technol. 4:1408805. doi: 10.3389/frfst.2024.1408805
Received: 28 March 2024; Accepted: 23 May 2024;
Published: 21 June 2024.
Edited by:
Aris E. Giannakas, University of Patras, GreeceReviewed by:
Emmanouil Tsochatzis, Aarhus University, DenmarkAnca Ioana Nicolau, Dunarea de Jos University, Romania
Copyright © 2024 Zhovmer, GonzalezBonet, Garg, Bailey and Arvidson. This is an open-access article distributed under the terms of the Creative Commons Attribution License (CC BY). The use, distribution or reproduction in other forums is permitted, provided the original author(s) and the copyright owner(s) are credited and that the original publication in this journal is cited, in accordance with accepted academic practice. No use, distribution or reproduction is permitted which does not comply with these terms.
*Correspondence: Lauren M. Zhovmer, bGF1cmVuLnpob3ZtZXJAZmRhLmhocy5nb3Y=