 Gulsun Akdemir Evrendilek
 Hakan Tanriverdi1
- 1Department of Food Engineering, Faculty of Engineering, Bolu Abant Izzet Baysal University, Golkoy Campus, Bolu, Türkiye
- 2Department of Food Engineering, Faculty of Engineering, Izmir Institute of Technology, Izmir, Türkiye
Pulsed electric field (PEF) processing of licorice root “sherbet” (LRS) by various electric field strengths (7.00, 15.50, and 24.10 kV/cm), treatment times (108, 432, and 756 µsec), and processing temperatures (6, 18, and 30°C) according to the Box–Behnken design were performed. The samples were analyzed for pH, titratable acidity, conductivity, turbidity, total reducing sugar, color (L*, a*, and b*), hue, chroma, total color difference, color intensity, color tone (yellow, red, and blue color tones), total antioxidant capacity, total phenolic substance content, and sensory properties. Results revealed that PEF processing did not adversely affect most of the physical, chemical, and sensory properties of LRS, with a maximum of 2.48, 4.04, 1.78, and 1.20 log reductions on the initial total mesophilic aerobic bacteria, total mold and yeast, Bacillus circulans, and Candida tropicalis. The response variable modeled for the PEF was found to be conductivity, with the optimum processing conditions of 6.90 kV/cm, 756.00 µs, and 7.48°C. After that, the samples were stored at 4°C and 22°C for shelf-life studies. Control samples at 4°C and 22°C were spoiled on the fifth and second days, whereas PEF-treated samples stored at 4°C began to deteriorate after the 40th day and the samples stored at 22°C after the 30th day, respectively. It was revealed that PEF is a suitable process to extend the shelf-life of licorice “sherbet” with preservation of physicochemical and sensory properties.
Highlights
- PEF processing of licorice root “sherbet” by energies up to 39.90 J did not cause significant changes in most of the physical, bioactive, and sensory properties.
- Maximum of 2.48, 4.04, 1.78, and 1.20 log reductions on the initial total mesophilic aerobic bacteria, total mold and yeast, Bacillus circulans, and Candida tropicalis were obtained by PEF processing.
- The optimum PEF-processing parameters to process licorice root “sherbet” were 6.90 kV/cm, 756.00 µs, and 7.48°C.
- PEF processing provided a shelf-life extension of licorice root “sherbet” over 40 days at 4°C.
1 Introduction
Licorice, known as the stolon and the root of the Glycyrrhiza plant from the Leguminosae family, has been known as one of the most commonly used medicinal herbs in the pharmaceutical, food, and cosmetic industries since ancient times (Hayashi and Sudo, 2009). Water extract of licorice, also known as licorice root drink (LRD) or licorice root “sherbet” (LRS), is commonly consumed in summer in most of the Middle East countries and in the eastern-south eastern part of the Republic of Türkiye (Evrendilek et al., 2021). The “sherbet” is freshly prepared by immersing the shredded roots in water and extracting the water-soluble components overnight (Ariño et al., 2007). There is a high demand for LRS consumption, especially in the summertime, due to its refreshing sweet taste, but its consumption is limited due to its short shelf-life. LRS is a very sweet and low-acid drink that is prone to spoilage by microbial growth within a couple of days after production. Heat processing of LRS provides shelf-life extension, but physical and organoleptic properties are affected adversely by heat application; thus, alternative processing technologies are in high demand.
Processing of LRS by high hydrostatic pressure (HHP) processing (200–500 MPa pressure, 3–15 min treatment time, and 4°C–40 °C treatment temperature) with determination of changes in physicochemical properties provided a shelf-life extension of 25 days (Evrendilek et al., 2021). HHP processing of acidified LRS provided an increase in consumer acceptability with an increase in shelf-life (Aday et al., 2021). Processing of LRS by HHP (250, 355, and 450 MPa for holding times of 1 and 5 min) resulted in significant microbial inactivation with no significant difference in physicochemical and sensory properties (Aday et al., 2018).
The pulsed electric field (PEF) has gained popularity as it is one of the most appropriate non-thermal processing technologies to process liquid foods with low viscosity. Although studies mostly reported on different types of food, including fruit and vegetable juices (Evrendilek et al., 2021; Kantala et al., 2021; Delso et al., 2022; Evrendilek, 2022; Oziembłowski et al., 2022; Roobab et al., 2022), a limited number of studies are reported with LRS processing by PEF. Processing of Mentha piperita essential oil-added LRS by PEF provided a shelf-life extension of 6 weeks (Demir et al., 2022). Even though PEF processing can be a viable alternative to process LRS with shelf-life extension, studies focused on PEF processing of LRS are very limited. Therefore, the objectives of the study include 1) PEF processing of LRS based on the Box–Behnken design, 2) observing the changes in important quality properties and determining microbial inactivation, 3) optimizing PEF-processing parameters for shelf-life studies, and 4) determining the shelf-life extension of LRS processed by optimum PEF-processing parameters.
2 Materials and methods
2.1 Materials
Dry shredded licorice roots were purchased from a wholesaler (Ankara, Türkiye). API50 CHB/E and API 20C tests were purchased from bioMérieux, Inc. (Durham, NC, United States). Nutrient agar (NA), yeast extract agar (YEA), plate count agar (PCA), potato dextrose agar (PDA), and yeast extract (TE) were purchased from Fluka (Seelze, Germany), while tartaric acid, 3,5-dinitrosalicylic acid (DNS), NaOH, sodium potassium tartrate, glucose, and 2,2-diphenyl-1-picryl-hydrazyl-hydrate (DPPH) were obtained from Sigma (Steinheim, Germany). OSU-4A PEF treatment system was constructed by the Ohio State University (Columbus, OH, United States). A trigger generator (model 9300 series) was purchased from Quantum Composers, Inc. (Bozeman, MT, United States), K-type thermocouples were provided by Fisher Scientific (Pittsburgh, PA, United States), a two-channel digital oscilloscope (model TDS 320) was purchased from Tektronix, Inc. (Beaverton, OR, United States), and a water bath (model RTE-11) was purchased from NESLAB Instruments, Inc. (Newington, NH, United States). The Sension 5 model conductivity meter was purchased from HACH (CO, ABD), the pH-2005 model pH meter was purchased from JP Selecta SA (Barcelona, Spain), and the 20008 model turbidity meter was purchased from MICRO TPI (Istanbul, Türkiye). The Hunter ColorFlex spectrophotometer was provided by Hunter Associates Laboratory, Inc. (Reston, VA, United States), while the T80+ UV/VIS model spectrophotometer was purchased from PG Instruments (Leicestershire, United Kingdom).
2.2 Preparation of licorice root “sherbet”
Licorice root “sherbet” was prepared by immersing 20 g of dried shredded licorice roots in 20 L water at room temperature for 16–18 h at 4°C. The “sherbet” was filtered through cheesecloth to remove particles to obtain a clear drink with goldish-yellowish color. The LRS was kept at refrigeration temperature and processed immediately by PEF.
2.3 Isolation of microbial cultures from licorice root “sherbet”
Both Bacillus circulans and Candida tropicalis cultures isolated from LRS were identified using API50 CHB/E and API 20C tests. The isolated B. circulans culture was plated onto NA and incubated at 22°C ± 2°C for 48 h, while the isolated C. tropicalis culture was plated onto YEA and incubated at 35°C ± 2°C for 72 h. Both cultures were inoculated into LRS at a level of 105–106 cfu/mL (Evrendilek GA et al., 2021).
2.4 Pulsed electric field treatment
A continuous flow PEF treatment unit with six treatment chambers was used to treat LRS samples. K-type thermocouples were attached to the inlet and outlet of the co-field flow treatment chambers that were 0.29 cm in diameter and had a 0.23-cm gap to measure the temperature of the samples before and after each treatment chamber. Square-shaped bipolar pulses with 20 µsec delay time, and 3 µsec pulse width were applied. The treatment temperature was controlled with water set at 10°C–12°C.
Pulse duration time, pulse delaying time, and pulse repetition rate were controlled using a trigger generator. Applied current and voltage were measured using a two-channel digital oscilloscope. The PEF system had 200–1,200 Ω of load resistance, 60 A max of output current, 16 J of energy storage, 12,000 V max of output voltage, and 10,000 pulse per second (pps) max repetition rate. PEF-processing parameters of 500 pps frequency, 1 mL/min flow rate, 1–7 cycle time, 2–7 kV, and 6°C–30°C treatment temperature (T) were applied according to the Box–Behnken experimental design (Table 1).
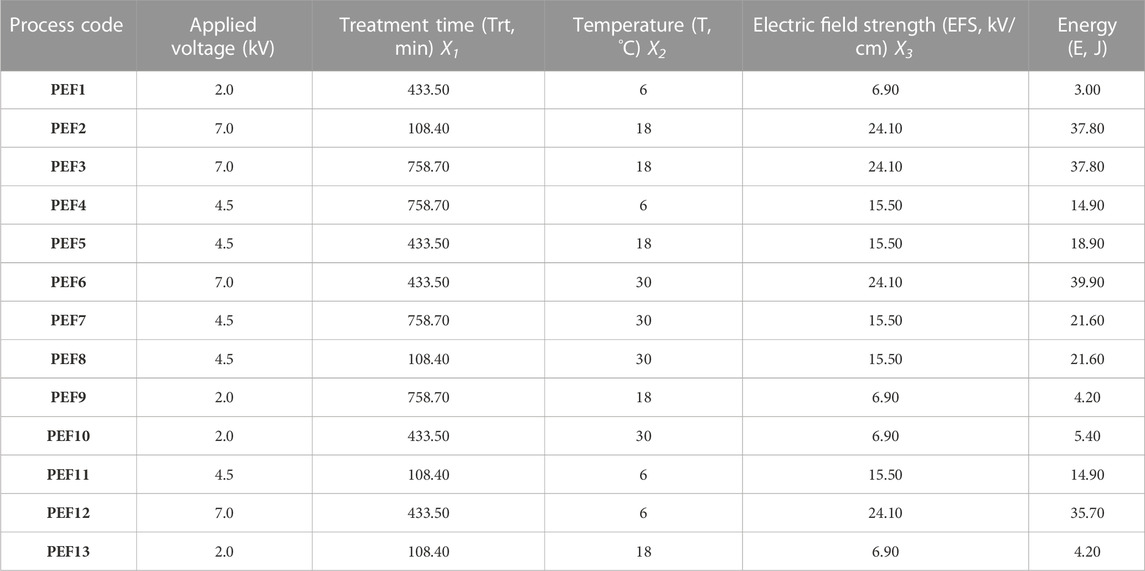
TABLE 1. Processing parameters of licorice root “sherbet” by PEF according to the Box–Behnken design.
2.5 Quality properties measurement of licorice root “sherbet”
Conductivity (µS/cm), pH, and turbidity (NTU) of the samples at room temperature were measured using a conductivity meter, pH meter, and turbidity meter, respectively. Titratable acidity (TA, g/100 mL) using the titrimetric method was determined as glycyrrhizic acid equivalent (Evrendilek et al., 2021).
Color measurement of LDS samples with the measurement of L*, a*, and b* values were performed using the Hunter ColorFlex spectrophotometer, chroma (C*), hue (ho), and total color difference
Reducing sugar content was determined with DNS reagent containing 1% DNS, 2% NaOH, and 20% sodium potassium tartrate (w/v). Glucose solutions with 0.1, 0.2, 0.4, 0.6, and 0.8 g/L concentrations were used as a substrate for the calibration curve (Sengupta et al., 2000).
The total antioxidant capacity (TAC) measurement was conducted using the DPPH free-radical method (Evrendilek et al., 2021). The total phenolic substance content (TPSC) of the samples was measured by the modified Folin–Ciocalteu method at 720 nm (Evrendilek et al., 2021).
2.6 Enumeration of endogenous microflora
The counts of total mesophilic aerobic bacteria (TMAB) and total mold and yeast (TMY) were determined by the surface plating method. The samples were diluted with 0.1% (w/v) peptone water, and the dilutions were plated onto PCA for TMAB, PDA acidified with 10% (w/v) tartaric acid for TMY count, NA for B. circulans, and YEA for C. tropicalis, respectively. PCA and YEA plates were incubated at 35°C ± 2°C for 24–48 h, whereas PDA and NA plates were incubated at 22°C ± 2°C for 3–5 days, respectively. Results were expressed as log cfu/mL.
2.7 Sensory analyses of licorice root “sherbet”
A nine-point hedonic scale quantitative descriptive analysis (QDA) with 20 trained panelists was used for the sensory analyses. The samples were evaluated in three phases of visual evaluation, smell, and taste, for the sensory properties of clarity–cloudiness, shininess–dullness, color intensity, aroma–flavor, density, licorice taste, bitter taste, sour taste, sweetness, and aftertaste (Evrendilek, 2022).
2.8 Shelf-life studies of licorice root “sherbet”
Shelf-life studies of the LRS samples were conducted with the optimum PEF-processing parameters derived from the optimization studies. Approximately 650 mL of the samples in amber-colored glass bottles were stored at both 4°C and 22°C for up to 40 days shelf-life studies. The sampling was performed on the 0, 15, 20, 25, 30, 35, and 40th day of storage, with the measurement of pH, conductivity, turbidity, L*, a*, b*, C*, ho, A420, A520, A620, CI, color tone, TAC, TPSC, and sensory analyses in addition to the enumeration of microbial growth of TMAB, TMY, B. circulans, and C. tropicalis.
2.9 Statistical analyses
All measured responses (pH; conductivity; turbidity; TA; color parameters; reducing sugar; TAC; TPSC; and inactivation of TMAB, TMY, B. circulans, and C. tropicalis), in addition to sensory analyses were evaluated for optimization studies as a function of electric field strength (EFS, 7–24 kV/cm), processing temperature (T, 6–30°C), and treatment time (Trt, 108–756 µs) according to the Box–Behnken design (BBD) (Table 1).
Comparison of the linear, quadratic, and cubic models to select the best model for conductivity of licorice “sherbet” in terms of electric field (X1:2.00–7.00 kV), T (X2:6–30°C), and Trt (X3: 108.00–756.00 µs) was performed by Minitab 17.0 (Minitab, Inc. State College, PA). Linear and non-linear regressions were run, and the best model was chosen based on variance inflation factor (VIF), coefficient of determination (R2), and lack-of-fit values.
2.9.1 Modeling and verification
The factors and their levels were determined using preliminary experiments. To validate the model, additional experiments were carried out in triplicate under the optimal conditions determined. Analysis of variance (ANOVA) and regression models were performed at a 95% confidence interval (p ≤ 0.05). The coefficient of variation (CV, %) value was determined as follows:
where
Data were further analyzed by ANOVA at a 95% confidence interval to determine the significant terms for each response variable, along with the multiple comparisons conducted with Tukey’s test.
3 Results and discussions
3.1 PEF-processing parameters
In order to increase treatment time, the samples pass through the PEF system several times (cycles). Thus, the LRS samples pass through the system in 1, 4, and 7 cycles, resulting in 108.40, 433.50, and 758.70 µsec Trt. Application of electric field strength in the range of 2.00, 4.00, and 7.00 kV yielded 6.90, 15.50, and 24.10 kV/cm electric field strengths. PEF processing was applied at three different treatment temperatures of 6, 18, and 30°C. The frequency of the system was adjusted to 500 pps. The LRD samples passed through the PEF system at a flow rate of 1 mL/min. With the application of these processing parameters, applied energies were calculated as 3.00, 4.20, 5.40, 14.90, 18.90, 21.60, 37.80, and 39.90 J (Table 1).
3.2 Effect of applied pulsed electric field processing on quality parameters of licorice root “sherbet”
The pH value of the control samples (6.81 ± 0.14) ranged from 6.42 ± 0.05 to 6.89 ± 0.04 by the applied PEF treatments, with significant changes observed by the PEF1, PEF3, PEF7, and PEF9 treatments. The conductivity of the control samples (441.72 ± 2.85 μS/cm) ranged from 417.88 ± 3.55 to 480.22 ± 2.90 μS/cm and significantly changed only by the PEF12 treatment. Titratable acidity of the control samples measured as 0.02 ± 0.00 g/100 mL was not significantly changed by the applied treatments, whereas reducing sugar content of the untreated control samples with the initial concentration of 0.33 ± 0.01 g/L only significantly changed by the PEF10 and PEF11 treatments. The mean turbidity of the untreated samples, measured as 16.97 ± 0.46 NTU, significantly changed by the PEF1, PEF3, PEF5, PEF6, PEF9, PEF10, and PEF12 treatments. Both TAC and TPSC of the control samples, measured as 16.48% ± 7.63% and 123.54 ± 7.32 mg GAE/mL, significantly increased by all PEF treatments (p ≤ 0.05) (Table 2).
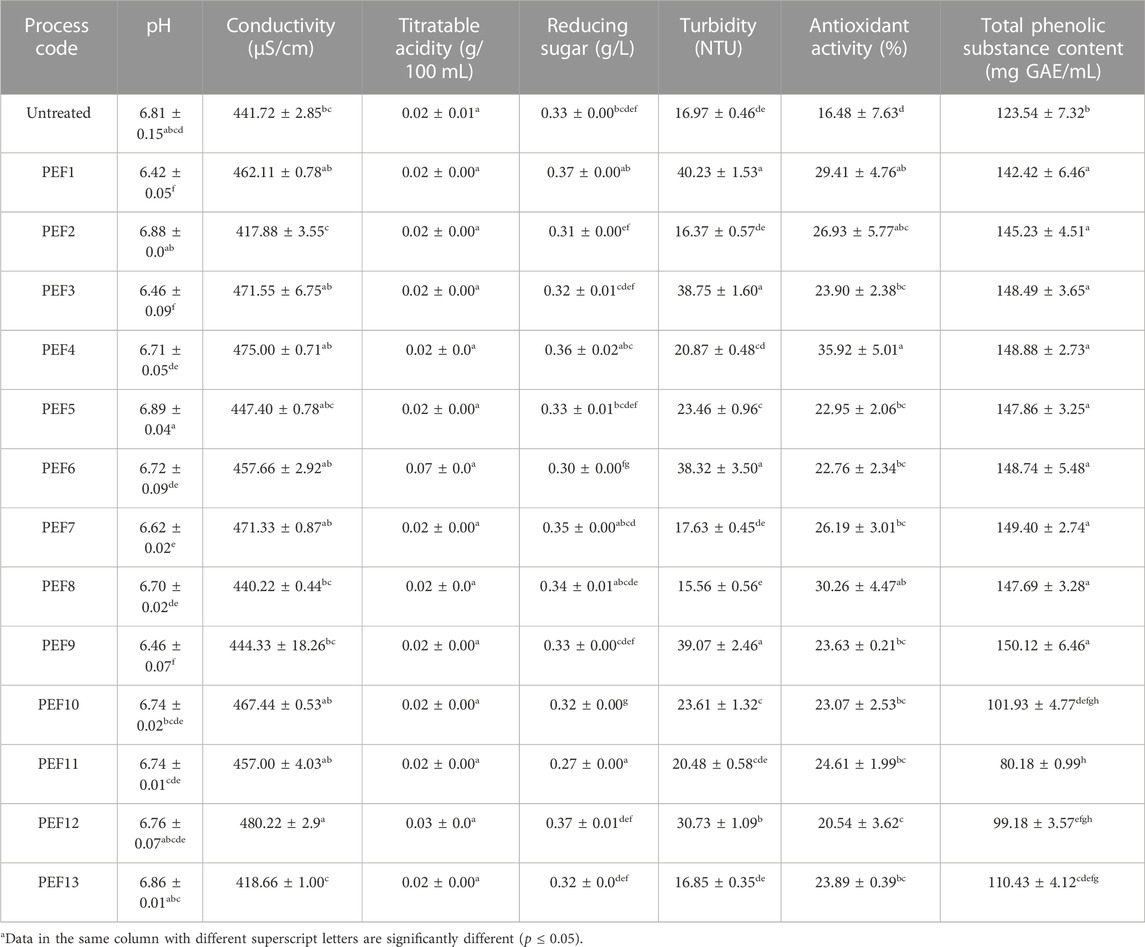
TABLE 2. Changes in the physical and bioactive properties of licorice root “sherbet” by pulsed electric fields.
ANOVA results revealed that the pH of the samples was significantly affected by the treatment time in the linear model and square terms of EFS, Trt, and T, whereas the conductivity was significantly affected by linear terms of EFS, Trt, and T and square terms of Trt and T in addition to interactions of EFS*Trt and EFS*T. Changes in titratable acidity were not affected by any linear or square terms. The turbidity of the samples was significantly affected by linear term of Trt and square term of T, while the interaction of Trt*T was also significant. Both EFS and T as linear terms; EFS, Trt, and T as square terms; and Trt*T interaction had a significant effect on the changes of TAC. TPSC was significantly affected by linear terms of Trt and T and square term of T only.
Color L*, a*, and b* values of the control LRD sample (54.73 ± 2.57, 4.61 ± 1.65, and 49.98 ± 1.61) were significantly changed by the applied PEF treatments. While PEF7 caused a significant decrease in L* value, PEF3, PEF4, PEF7, and PEF10 treatments caused a significant increase in a* value. No significant change was observed in the b* value of the LRS samples. Except for the PEF9 samples, which had a significantly higher C* value than that of the control (50.19 ± 1.55) LRS samples, the other PEF processes were not significantly different. Hue values of the control and PEF-processed samples were very close to each other, but the samples treated by the PEF3, PEF4, PEF7, PEF9, PEF10, and PEF12 treatments were significantly different from the control samples. Total color difference of the PEF-treated samples fluctuated due to changes in L*, a*, and b* values. Although the color intensity of the control samples (1.34 ± 0.06) was not significantly changed by the PEF treatments, the color tone of the control LRS samples (6.67 ± 0.20) was significantly reduced by the PEF1, PEF3, PEF4, PEF7, PEF9, PEF10, and PEF12 treatments (p ≤ 0.05) (Table 3).
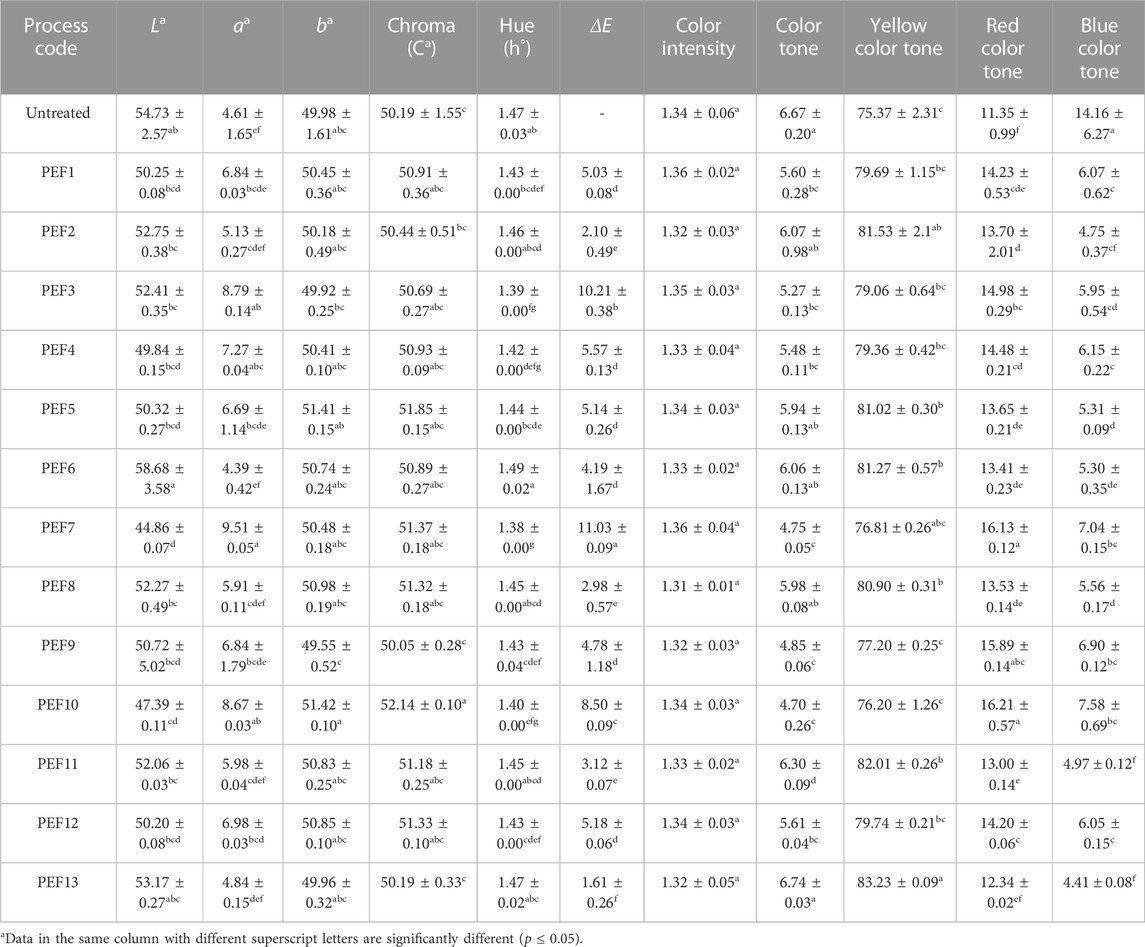
TABLE 3. Changes in the color properties of licorice root drink by pulsed electric fields.
According to the ANOVA results, the L* value of LRS samples was significantly affected by linear terms of EFS and T, and there were significant interactions between EFS*Trt and Trt*t, whereas the a* value of the LRD samples was significantly affected by the linear terms of EFS and T with the significant interaction between EFS and Trt. The b* value was only significantly affected by the interaction terms of EFS*EFS and Trt*Trt. Square terms of EFS and Trt and the interaction between EFS and T had a significant effect on C*. Trt, as a linear term, and EFS*T interaction were the only significant factors that affected h. Both Trt and T, as single terms, and EFS*Trt and Trt*T interactions had a significant effect on the ΔE of the LRS samples. Changes in CI were significantly affected by all the linear terms of EFS, Trt, and T, square terms of EFS, Trt, and T, and interaction of EFS*T, whereas the color tone was significantly affected by the linear term of Trt, square terms of Trt and T, and interactions of EFS*T and Trt*T.
Both the yellow color tone (75.37% ± 2.31%) and red color tone (11.35% ± 0.99%) of the control samples increased with applied PEF processing, but only PEF2, PEF5, PEF6, PEF8, PEF11, and PEF13 were significantly higher for the yellow color tone, while all treatments except for PEF13 were significantly higher for the red color tone. The blue color tone of the control samples (14.16 ± 6.27), on the other hand, significantly decreased by the PEF treatments (p ≤ 0.05). Changes in the yellow color tone were significantly affected by both linear and square terms of Trt and T and interactions of EFS*T and Trt*T; red color tone by linear terms of Trt and T, square terms of Trt, T, and EFS, and interaction of Trt and T; and blue color tone by linear term of Trt, square term of T, and interaction of EFS*T and Trt*T (p ≤ 0.05).
Because of its bioactive compounds, licorice extract has been used as an ingredient in some medicines and foods (Zhang and Ye, 2009). Therefore, preservation of its physicochemical properties is important to obtain benefits from its health-promoting effects (Linton and Patterson, 2000). Studies on HHP of LRS reported that HHP did not adversely affect most of the physiochemical and bioactive properties of LRS (Aday et al., 2018; Evrendilek et al., 2021). Changes in the physical and bioactive properties, in addition to color values of LRS, have been affected by the magnitude of the applied HHP-processing parameters (Evrendilek et al., 2021).
Processing of LRS by PEF (22.60 kV/cm EFS, 262.00 µsec Trt and 33.70 J energy) and PEF processing with the addition of essential oils [mixture of thymus (33%) and M. pulegium (67%)] revealed that PEF treatment did not cause changes in the pH, conductivity, turbidity, TAC, and TPSC of the samples, but PEF combined with essential oil caused changes in these properties with an increase in the measured properties (Demir et al., 2022). Thus, the properties of LRS were more affected by the addition of essential oils rather than by PEF treatment.
Heat [70 (H1), 80 (H2) and 90 (H3) °C for 3 min] and PEF [17 (PEF1), 23 (PEF2) and 30 kV/cm (PEF 3) EFS for 148 µs Trt] and the combination of mild heat (40°C for 3 min) and PEF (23 kV/cm for 148 µs Trt) processing of LRS revealed that increased heat treatment temperatures caused significant changes in the pH, conductivity, total soluble solids, L* (80°C and 90°C heat treatments only), a*, TPSC and TAC. PEF treatments and mild heat + PEF treatments did not show any significant difference in the measured properties (Uzuner and Evrendilek, 2017).
3.3 Effect of applied pulsed electric field processing on inactivation of endogenous microbial flora of licorice root “sherbet”
The mean initial number of TMAB, TMY, B. circulans, and C. tropicalis, 5.17 ± 0.30, 5.17 ± 0.57, 4.88 ± 0.17, and 4.85 ± 0.18 significantly reduced by all PEF treatments. The lowest counts of 2.69 ± 0.37 log cfu/mL by PEF7, 2.32 ± 0.39 log cfu/mL by PEF5, 3.10 ± 0.47 log cfu/mL by PEF12 and 3.65 ± 0.03 log cfu/mL by PEF6 revealing maximum of 2.48, 4.04, 1.78, and 1.20 log reductions on the initial TMAB, TMY, B. circulans, and C. tropicalis, respectively (Table 4). Reduction in the mean initial TMAB was significantly affected by linear terms of EFS and Trt, square terms of EFS and Trt, and interaction of Trt*T, whereas TMK by linear terms of EFS and Trt, B. circulans by linear terms of EFS and T, and C. tropicalis by linear terms of EFS and T, and square terms of EFS and Trt.
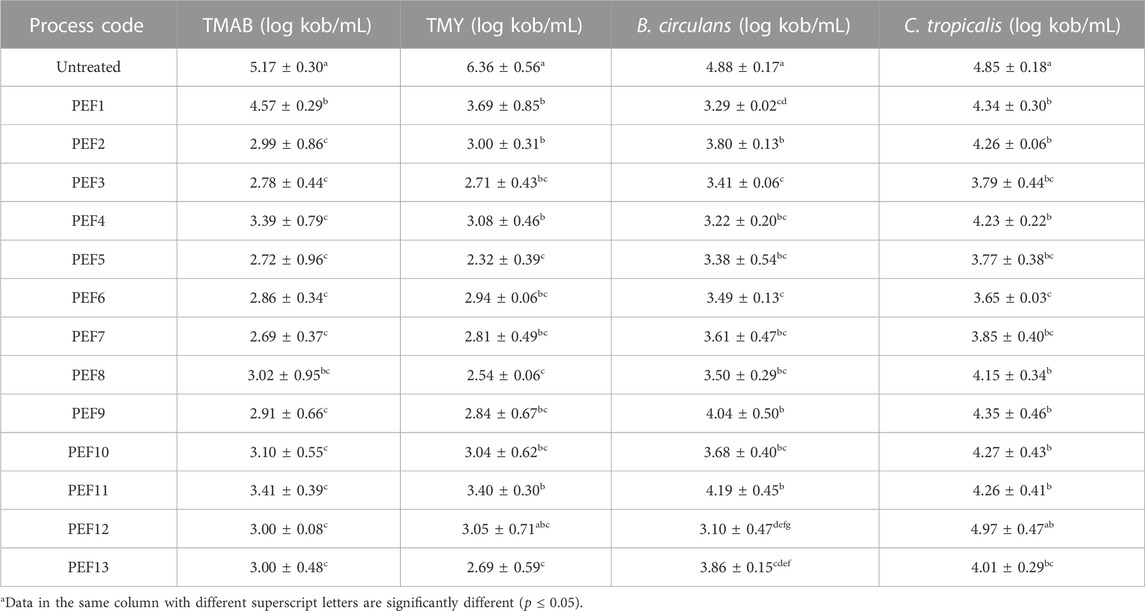
TABLE 4. Inactivation of endogenous microflora in licorice root “sherbet” samples.
Inactivation of endogenous and inoculated microflora of LRS by HHP and PEF had very promising results in that inactivation of endogenous LRS microflora processed by HHP revealed maximum of 3.33 ± 0.16, 3.65 ± 0.01, 3.13 ± 0.04, and 3.08 ± 0.10 log inactivations on the mean initial TMAB, TMY, B. circulans, and C. tropicalis, respectively (Evrendilek et al., 2021). HHP processing (450 MPa for 5 min) of acidified LRS with the combination of citric and acetic acid provided ca. of 2.0 log reduction on the mean initial TMAB and TMY counts, almost 2.5 log reduction on total coliform count, closer to 5 log reductions on Escherichia coli O157:H7 count (Aday et al., 2021). HHP processing of LRS with 250, 355, and 450 MPa pressure applications for 1 and 5 min yielded more than 6.0 log reduction on Escherichia coli and Salmonella typhimirium inoculated into LRS and 2.7 log reduction on endogenous TMAB microflora (Aday et al., 2018).
PEF treatments of LRS and essential oils [mixture of thymus (33%) and M. pulegium (67%)] added LRS resulted in almost 2.0 log reductions on both TMAB and TMY counts (Demir et al., 2022).
PEF (17, 23, and 30 kV/cm), heat (70, 80, and 90 C for 3 min), and combination of mild heat (40°C for 3 min) and PEF (23 kV/cm) processing of LRS revealed that PEF treatments were more effective to reduce initial microbial counts of S. enteritidis, E. coli O157:H7, TMAB, and TMY; the combination of mild heat + PEF was much more effective than that of the PEF and heat treatments alone providing ca. 7 log reductions on both TMAB and TMY and more than 6 log reductions on both S. enteritidis and E. coli O157:H7 (Uzuner and Evrendilek, 2017).
Acidified LRS samples (pH of 4.3–4.4) were pasteurized at 65°C for 2 min and then thermosonicated (TS) at 40, 50, or 60 °C with 150 W and 37 kHz frequency for 10, 20, and 30 min. Thermosonication of LRS at 60°C for 30 min revealed a ca of 7.0 log reduction on E. coli K-12 cultures inoculated into LRS (Öztürk, 2019).
3.4 Effect of applied pulsed electric field processing on sensory properties of licorice root “sherbet”
Applied PEF-processing parameters did not cause a significant difference in the sensory properties of the LRS. Clarity–cloudiness of the samples was significantly affected by linear terms of Trt and T, square terms of EFS and Trt, and interaction between EFS and T. Shininess–dullness of the samples was significantly affected by the EFS, Trt, and T as the linear terms; EFS, Trt, and T as the square terms; and interactions of EFS*Trt, EFS*T, and Trt*T. The other sensory properties were not affected by any process parameters and their interactions.
Sensory properties of LRS are very important as it has a yellowish-goldish color, shiny appearance, and very sweet taste due to the compound called glycyrrhizic acid, up to 50 times as sweet as sucrose formed by one molecule of glycyrrhetinic acid and two molecules of glucuronic acid (Khalesi, 2015; You et al., 2023). The presence of glycyrrhizic acid gives a very sweet, slightly pungent taste characteristic of LRS. In addition, licorice roots contain different compounds, such as flavanones, flavonoids, and saponins, including glycyrrhizic acid, amines, sucrose, glucose, amino acids, essential oils, starch, and gums (Obolentseva et al., 1999; Gupta et al., 2008; Anilkumar et al., 2012). High concentrations of flavanones and flavonoids may cause blurring and undesirable appearance in LRS. Therefore, it is also important to preserve the sensory properties of the LRS after processing.
Processing of LRS by HHP at 450 MPa for 5 min revealed no significant difference between the control and HHP-treated samples conducted with consumer acceptability test in terms of appearance and flavor (Aday et al., 2018). Moreover, HHP treatment in the range from 200 MPa for 3 min at 22°C to 500 MPa for 9 min at 40°C did not cause any significant difference in selected sensory properties according to the hedonic test (Evrendilek GA et al., 2021).
3.5 Modeling and optimization
Modeling studies were carried out with the consideration of R2, VIF, and lack-of-fit (LOF) values because in order to select the best regression model, R2 must be closer to 1, VIF must be 1, and LOF value must be p > 0.05. Based on these three values (R2 = 0.78, VIF <0.1, and LOF = 0.340) for conductivity, a quadratic regression model was chosen (Table 5).
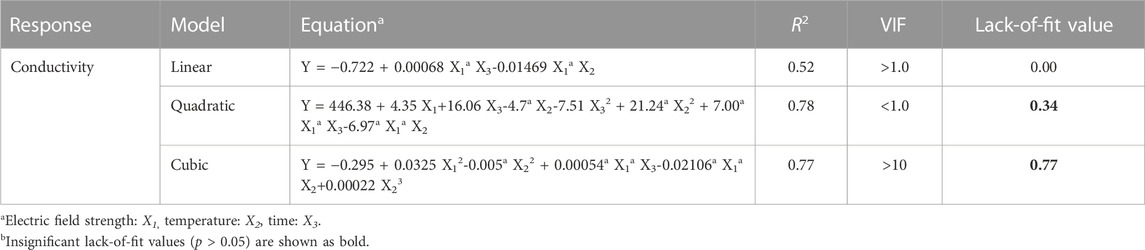
TABLE 5. Comparison of linear, quadratic, and cubic models for licorice “sherbet” by pulsed electric fields.
According to the ANOVA results, the insignificant terms were excluded, and the model was re-written in terms of coded factors as follows:
where Y is the predicted conductivity (µS/cm), and X1, X2, and X3 are coded values for electric fields (kV), T (oC), and Trt (μs), respectively. The predicted model was adequate, possessing no significant lack-of-fit (p = 0.340 > 0.05) and very satisfactory R2 values (R2 = 0.78, R2adj = 0.74 R2pred=0.70).
A second-order polynomial equation was developed to identify the 31 responses of licorice “sherbet,” such as pH; conductivity; turbidity; total acidity value; reducing sugar content; L*; a*; b*; ΔE; ho; C*; color tone; CI; percent color components of yellow, blue, and red; TAC; TPSC; and inactivation on TMAB, B. circulans, and C. tropicalis in addition to sensory properties. However, only one response (conductivity) was modeled and optimized due to high R2 and insignificant lack-of-fit values.
Table 6 represents the effect of process variables and interactions on conductivity. EFS, T, and Trt showed significant main effects (p ≤ 0.05) on conductivity. Both EFS and Trt positively affect conductivity, whereas T has a negative effect on conductivity (Table 6). The most important factor was the Trt, with the highest coefficient (16.06), followed by T (4.71) and EFS (4.35) (Table 6).
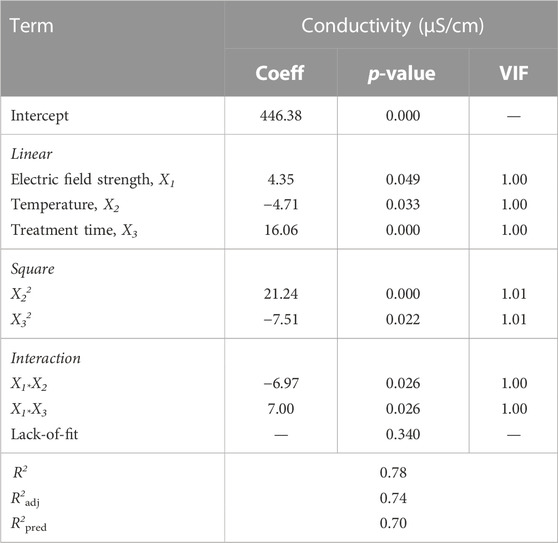
TABLE 6. Revised ANOVA results and estimated regression coefficients for the coded conductivity of licorice “sherbet” model.
For a better understanding of the variables, the response surface plots for conductivity are shown in Figure 1. The conductivity increased with the increased Trt under the highest T at an increasing rate (Figure 1A). The longest Trt maximized conductivity at the highest T (Figure 1A). Conductivity increased with the decreased EFS under the highest T at an increasing rate (Figure 1B). The conductivity peaked with the EFS (7.00 kV) at the longest Trt (756.00 µs) (Figure 1C). The interaction between the EFS and Trt showed a negative correlation with the conductivity (Figure 1C).
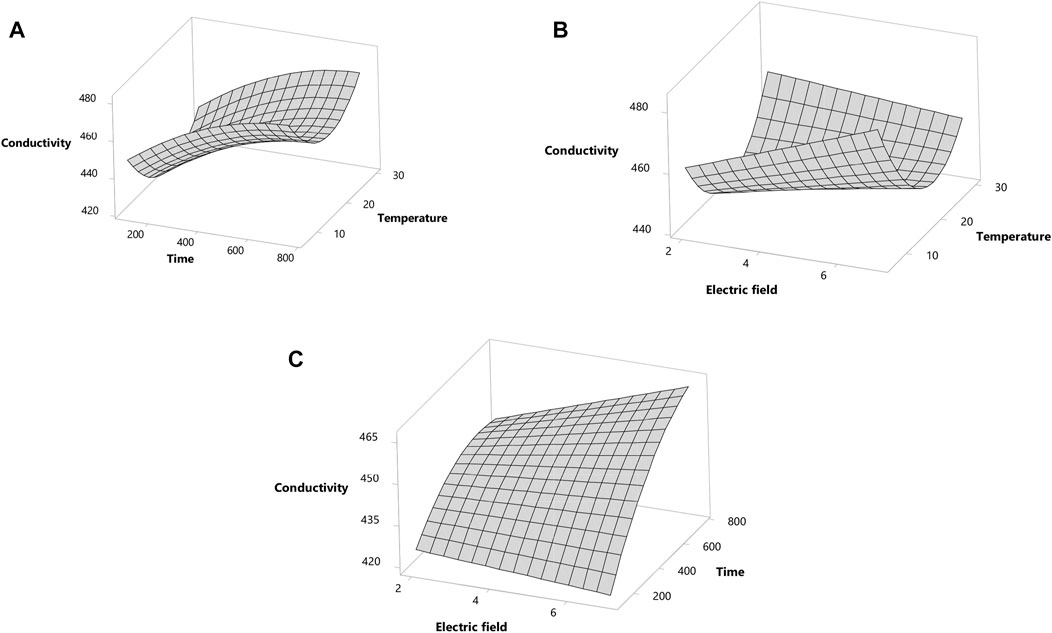
FIGURE 1. Response surface plot for conductivity. (A) The effects of time and temperature. (B) The effects of electric field and temperature. (C) The effects of electric field and time.
The optimum conditions for conductivity of licorice “sherbet” predicted by the model were obtained as EFS of 6.90 kV/cm, T of 756.00 µs, and T of 7.48°C, which also estimate the conductivity of 457.92 μS/cm.
3.6 Shelf-life studies
Control and PEF-treated LRD samples stored at both 4°C and 22°C had different shelf-life extension periods. Control samples stored at 22°C spoiled on the second day, while the control samples at 4°C spoiled after the fifth day. PEF-treated samples, on the other hand, stored at both 4°C and 22°C, had a shelf-life period of 40 and 30 days, respectively.
The pH of the control samples at 4°C dropped to 5.71 ± 0.06 from 6.33 ± 0.12, while the pH of the PEF-treated samples at 4 °C dropped to 5.01 ± 0.45 from 6.36 ± 0.00. Control samples at 22°C had a pH of 6.17 ± 0.04, and no further measurements were carried out because of the spoilage of the samples. The pH of the PEF-treated samples stored at 22°C, 6.13 ± 0.01, lowered to 4.20 ± 0.11 by the end of the 30 days of storage. Changes in pH were affected by both the storage time and temperature. The pH of the samples stored at 22°C lowered significantly faster than that of the samples stored at 22°C (p ≤ 0.05) (Table 7).
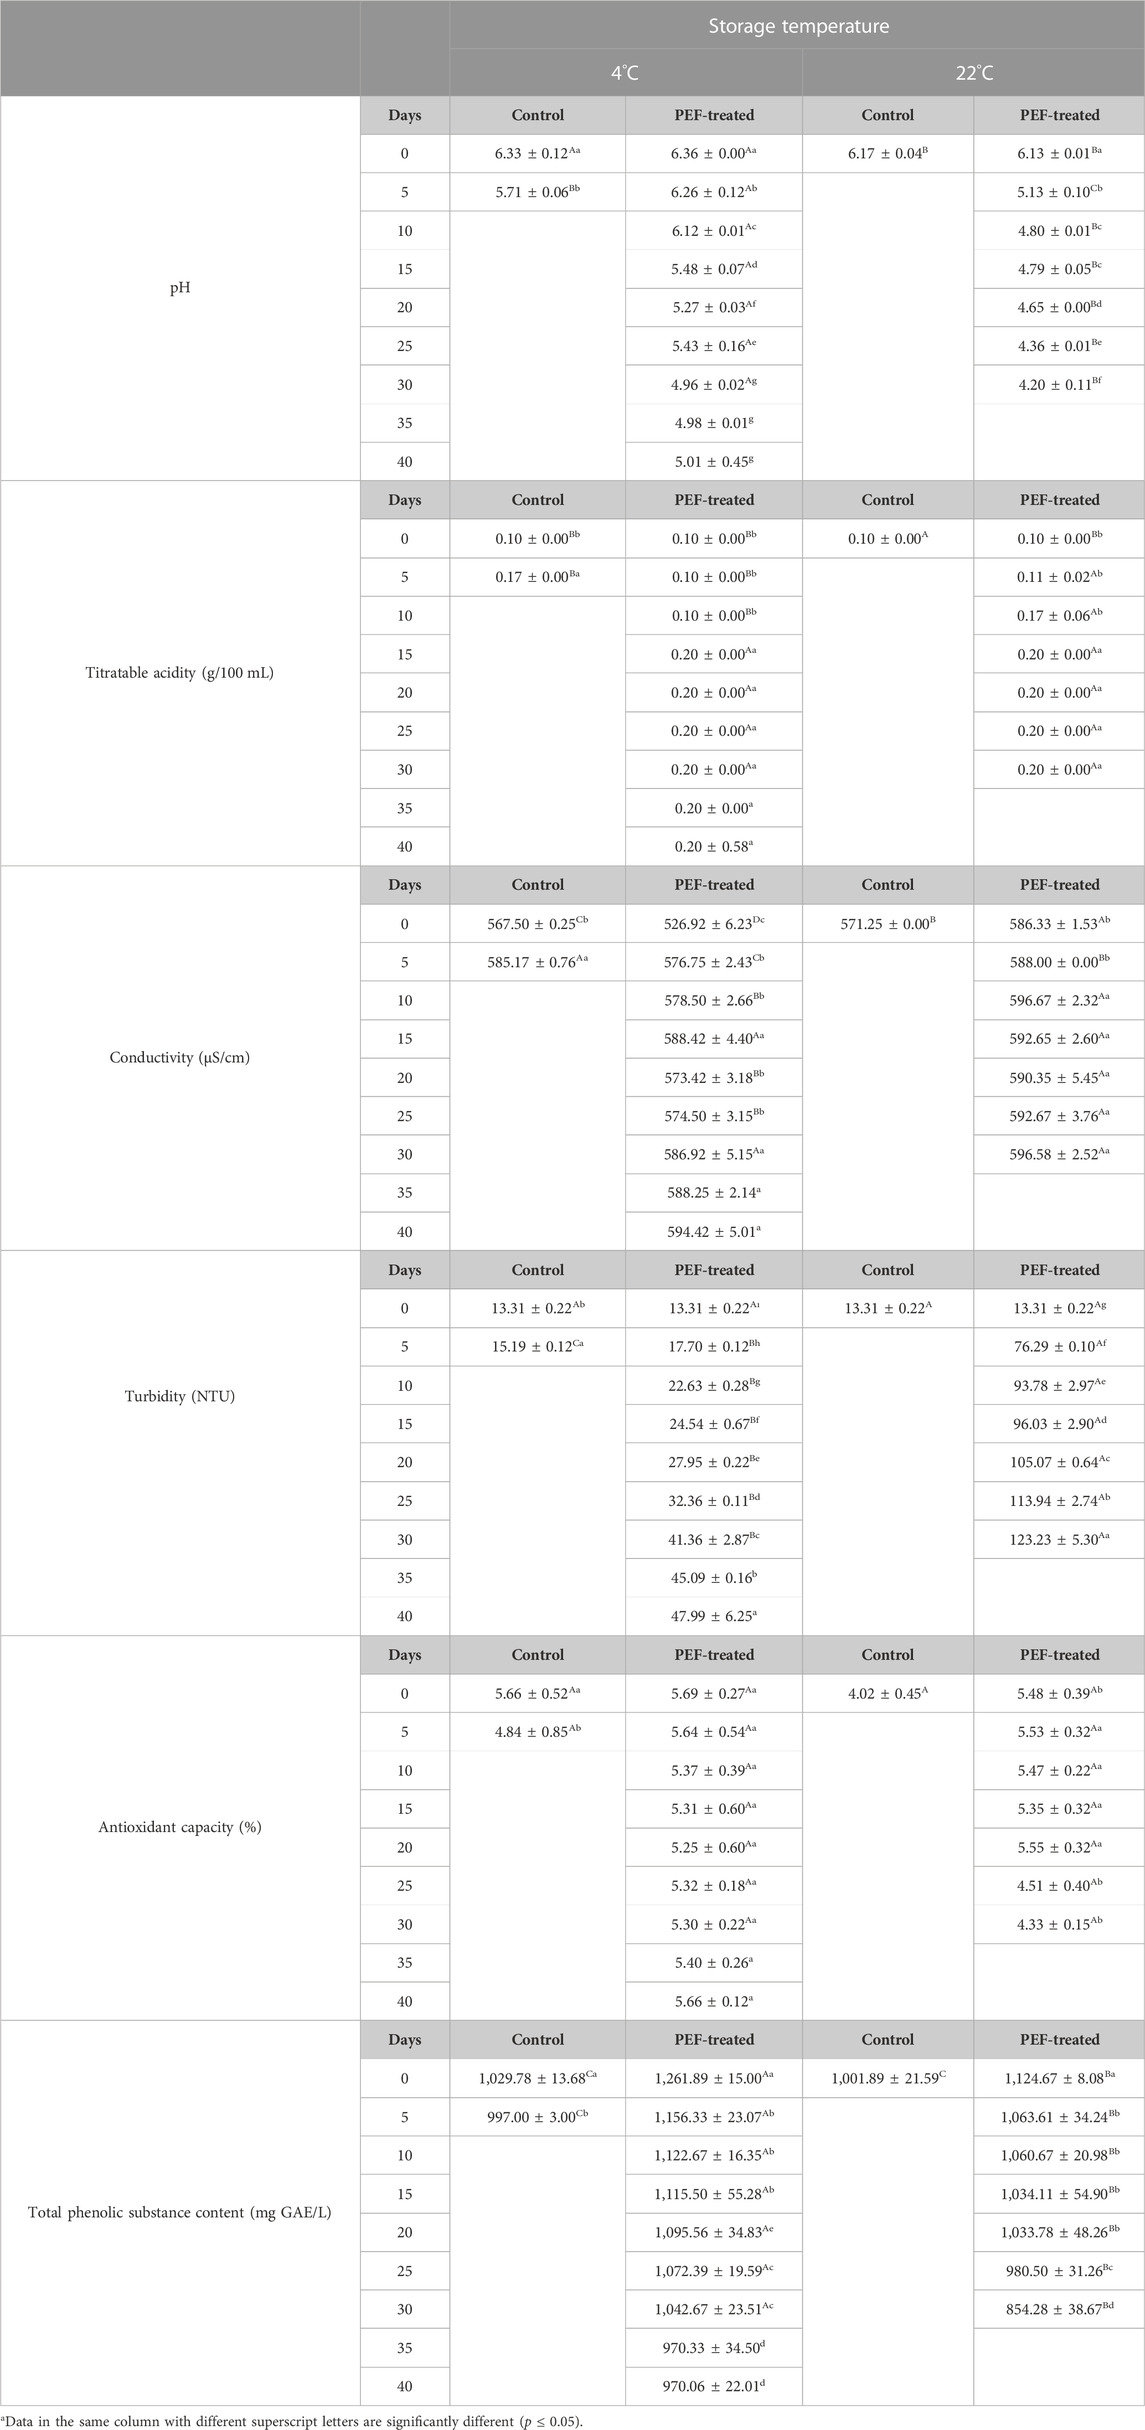
TABLE 7. Changes in the physical and bioactive properties of licorice root “sherbet” processed by pulsed electric fields during shelf-life study.
Titratable acidity of the PEF-treated samples increased from 0.10 ± 0.00 to 0.20 ± 0.00 by the end of 30 and 40 days of storage time for the samples stored at 22°C and 4°C. Titratable acidity of control samples at 4°C increased to 0.17 ± 0.00 after the fifth day. Storage time had a significant effect on titratable acidity (p ≤ 0.05). The conductivity of the PEF-treated samples (526.92 ± 6.23 μS/cm at 4°C and 586.33 ± 1.53 μS/cm at 22°C) increased by both storage time and temperature to 594.42 ± 5.01 μS/cm and 596.58 ± 2.52 μS/cm, respectively, while the conductivity of the control samples at 4°C increased to 585.17 ± 0.76 μS/cm from 567.50 ± 0.25 μS/cm (p ≤ 0.05) (Table 7).
Turbidity of all the samples (13.31 ± 0.22 NTU) on the first day of shelf-life studies increased to 15.19 ± 0.12 NTU for the control samples at 4°C after the fifth day, 47.99 ± 6.25 NTU for the PEF-treated samples at 4°C after 40 days, and 123.23 ± 5.30 NTU for the PEF-treated samples at 22°C after 30 days of storage (Table 7). Turbidity of the PEF-treated samples at 22°C was significantly higher than that of the PEF-treated samples at 4°C, and turbidity of all the samples increased with the storage time (p ≤ 0.05) (Table 7).
The antioxidant capacity of the PEF-treated samples at 4°C did not significantly change with the storage time, but the samples at 22°C had a significant decrease after the 25th day of storage. TAC of the samples at 22°C was significantly lower than that of the samples at 4°C from the 25th day of storage (p ≤ 0.05) (Table 7). TPSC of the PEF-treated samples (1,261.89 ± 15.00 mg GAE/L at 4°C and 1,124.67 ± 8.08 mg GAE/L at 22°C) decreased significantly after the fifth day and continued to decrease until the end of the storage time. PEF-treated samples at 4°C had a TPSC of 970.06 ± 22.01 mg GAE/L after the 40th day, whereas the PEF-treated samples at 22°C had a TPSC of 854.28 ± 38.67 mg GAE/L after the 30th day of storage. The samples stored at 22°C had a significantly higher decrease in TPSC than that of the samples stored at 4°C (p ≤ 0.05) (Table 7).
Color L* and h° values and red color tone and blue color tone of the PEF-treated samples at both 4°C and 22°C and control samples at 4°C showed a significant increase during shelf-life studies. Moreover, the increase in the color properties for the PEF-treated samples at 22°C was significantly higher than that for the PEF-treated samples at 4°C (p ≤ 0.05). In contrast, a* and b*, C*, YCT, OD420, OD520, CI, color tone, and yellow color tone values showed a significant decrease in all samples. The PEF-treated samples stored at 22°C had a significantly higher decrease than the PEF-treated samples at 4°C for these properties (p ≤ 0.05) (Table 8).
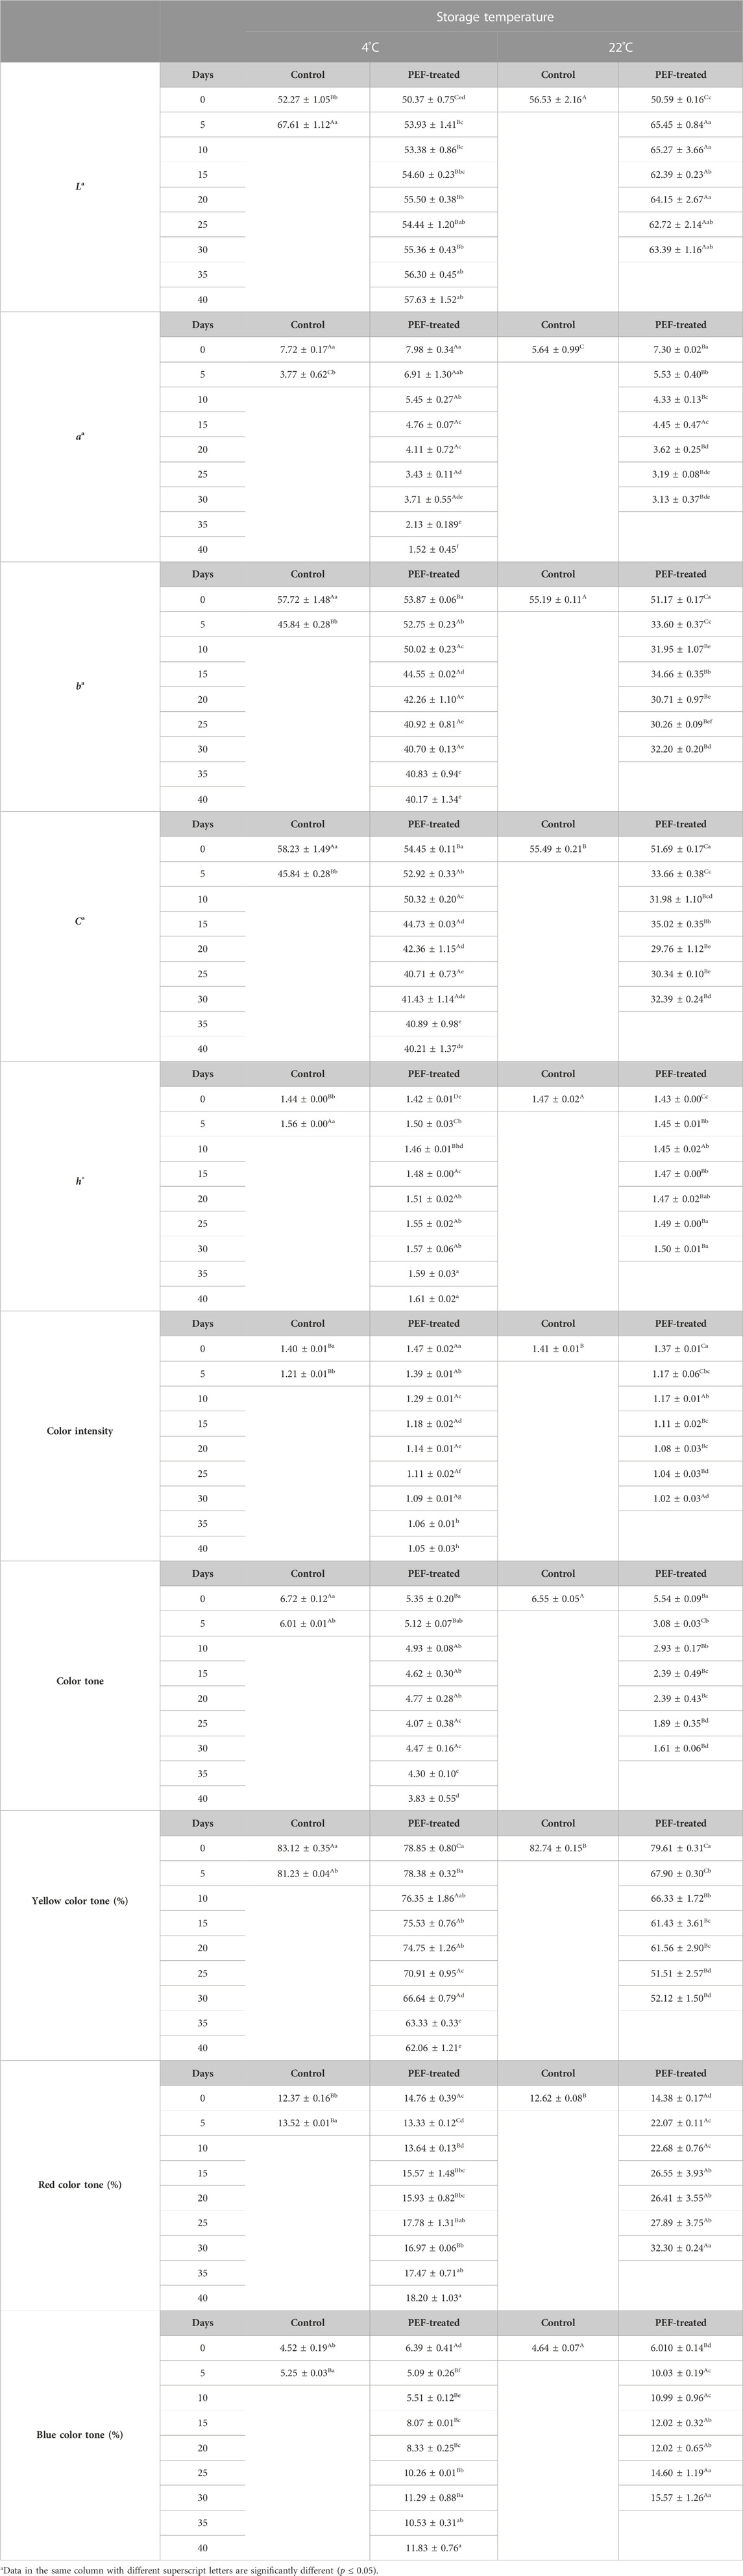
TABLE 8. Changes in the color properties of licorice root “sherbet” processed by pulsed electric fields during shelf-life study.
The mean initial TMAB count of the control and the PEF-treated samples at both 4 (3.51 ± 0.12 and 1.53 ± 0.23 log cfu/mL) and 22°C (3.51 ± 0.12 log cfu/mL and 1.51 ± 0.19 log cfu/mL) significantly increased to 4.27 ± 0.23 log cfu/mL after 5 days for control samples at 4°C, 3.50 ± 0.15 log cfu/mL after 40 days for PEF-treated samples at 4°C, and 3.81 ± 0.36 log cfu/mL after 30 days for PEF-treated samples at 22°C, respectively. Samples at 22°C had a significantly higher TMAB count than that of the counterparts at 4°C. The mean initial TMY count of the control and the PEF-treated samples at both 4 (2.02 ± 0.04 log cfu/mL and 1.25 ± 0.34 log cfu/mL) and 22°C (2.35 ± 0.229 log cfu/mL and 1.49 ± 0.30 log cfu/mL) increased to 4.58 ± 0.24 log cfu/mL after 5 days for control samples at 4°C, 4.17 ± 0.16 log cfu/mL, after 40 days for the PEF-treated samples at 4°C, and 4.62 ± 0.38 log cfu/mL after 30 days for the PEF-treated samples at 22°C. All the microbial growths at 22°C were faster, and thus, the number of microorganisms at 22°C was significantly higher than that of the counterparts at 4°C (Table 9).
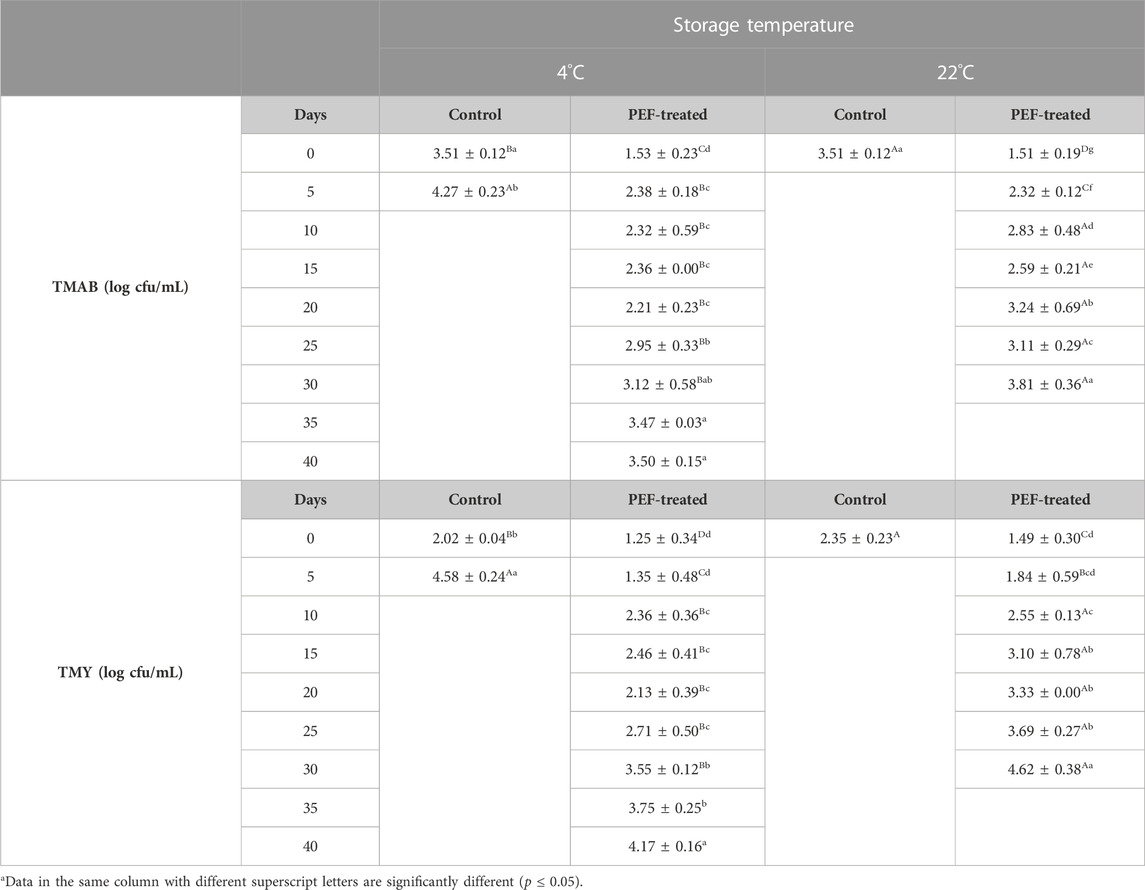
TABLE 9. Changes in the total mesophilic aerobic bacteria and total mold and yeast counts of licorice root “sherbet” processed by pulsed electric fields during shelf-life study.
Changes in sensory properties during shelf-life studies revealed that the clarity of the control LRS samples at 4°C and PEF-treated samples at 4°C and 22 °C decreased to 4.20 ± 0.00, 6.47 ± 0.23, and 4.33 ± 0.58 from 9.00 ± 0.00, 8.00 ± 0.00, and 8.20 ± 0.00, respectively (p ≤ 0.05). Shininess of the control samples at 4°C diminished to 5.00 ± 0.00 from 9.20 ± 0.00, whereas that of the PEF-treated samples at 4°C and 22°C diminished to 6.40 ± 0.20 and 4.53 ± 0.12 from 8.40 ± 0.00 and 7.80 ± 0.00, respectively (p ≤ 0.05). Color of the PEF-treated LRS samples at 4°C and 22°C was scored as 9.00 ± 0.00, and both reduced to 6.00 ± 0.00 after 40 and 30 days, respectively. Color of the control samples at 4°C was initially scored as 8.80 ± 0.00 and reduced to 6.00 ± 0.00 on the fifth day (p ≤ 0.05). Aroma–flavor of all the samples (8.80 ± 0.00) reduced to 5.60 ± 0.00 after 5 days for control samples at 4°C, 6.13 ± 0.23 after 40 days for PEF-treated samples at 4°C, and 4.87 ± 0.12 after 30 days for PEF-treated samples at 22°C, respectively. Density of the LRS samples recorded as 9.00 ± 0.00 reduced to 5.00 ± 0.00, 4.87 ± 0.12, and 5.00 ± 0.20 for the control and PEF-treated samples at 4°C after 5 and 40 days and PEF-treated samples at 22°C after 30 days, respectively. Licorice taste of all the samples, which was 8.60 ± 0.00 at the beginning of the shelf-life studies, dropped to 4.40 ± 0.00, 5.40 ± 0.20, and 4.47 ± 0.12 for control and PEF-treated samples stored at 4°C on the fifth and 40th days and PEF-treated samples stored at 22°C on the 30th day, respectively. Bitter taste of the samples, scored as 2.10 ± 0.18 for all the samples, increased to 7.40 ± 0.00 for the control samples at 4°C after the fifth day, 6.53 ± 0.12 for the PEF-treated samples at 4°C after the 40th day, and 8.00 ± 0.00 for the PEF-treated samples at 22°C after the 30th day of storage. Sour taste of the samples, 2.40 ± 0.00 at the beginning of the shelf-life studies, increased to 8.80 ± 0.00, 4.80 ± 0.00, and 6.40 ± 0.40 for the control samples at 4°C after the fifth day and PEF-treated samples at 4°C and 22°C after 40 and 30 days, respectively. Sweetness of the samples at the beginning of the shelf-life studies was recorded as 9.00 ± 0.00 for all samples, but this value decreased to 3.87 ± 0.23 for the control samples stored at 4°C after the fifth day and to 6.87 ± 0.12 and 7.60 ± 0.00 for the PEF-treated samples at 4°C and 22 °C after 40 and 30 days of storage, respectively. Aftertaste of all the samples, which was 8.84 ± 0.20, decreased to 4.80 ± 0.00, 5.73 ± 0.16, and 4.07 ± 0.12 for the control samples at 4°C after the fifth day and PEF-treated samples stored at 4°C and 22°C after 40 and 30 days of storage, respectively.
LRS has a very short shelf-life, and efforts have been made to extend its shelf-life without adversely affecting physical, bioactive, and sensory properties. HHP processing of LRS at the optimum operational conditions of 500 MPa pressure, 9.90 min, and 18.5°C provided a 25-day shelf-life period. It was reported that a significant decrease in pH, L*, a*, b*, and C* values and glabridin concentration but a significant increase in turbidity and conductivity values, TMAB, and TMY, and no significant change in titratable acidity, h°, glycyrrhizin concentration, and sensory properties were observed on HHP-processed LRS samples (Evrendilek et al., 2021).
PEF treatment of LRS samples by PEF (22.60 kV/cm EFS, 262.00 µsec) and PEF combined with the addition of essential oils [mixture of thymus (33%) and M. pulegium (67%)] provided 6 weeks of shelf-life extension at 4°C. While there was a decrease in the first week and then an increase during storage in turbidity of the samples, a slight decrease in the pH was observed. The TAC of the samples gradually decreased toward the end of the shelf-life period, while the TPSC of the samples showed a significant decrease only in the last week. A significant increase was observed in both TMAB and TMY counts at the end of the shelf-life. No significant difference was observed in the sensory properties of the samples, and even higher scores were obtained from the PEF-treated samples than from the control samples (Demir et al., 2022).
The increase in acidity during shelf-life studies was due to the increase in microbial growth. Previous studies also reported an increase in the pH of nutritious juices containing apple juice, honey, and other ingredients; containing cayenne pepper, honey, and other ingredients (cayenne juice),; and containing passion fruit juice, honey, and other ingredients (passion juice) stored at 4, 10, or 22°C for 24 weeks (Mendes-Oliveira et al., 2022); some roselle fruit juice blends stored at 28°C and 4°C (Mgaya-Kilima et al., 2014), and roselle juice nectars stored at an ambient temperature for 120 days (Kumar et al., 2012). PEF processing, on the other hand, had no significant effect on the Brix values of all three nutritious juices right after processing and during shelf-life studies at 4 to 10°C and 22°C for 24 weeks of storage time. Color L* and b* values showed a significant increase in both treated and non-treated apple juice samples stored at 10°C and 22°C (Mendes-Oliveira et al., 2022). Significant changes in color values (L*, a*, and b*) of apple juice samples before and after PEF treatment was observed in the samples stored at 4, 22, and 37°C with a storage time of <36 days (Evrendilek et al., 2000).
Two PEF treatments, 30 kV/cm for 217 µs and 34 kV/cm for 145 µs, achieved over 5 log reductions in S. typhimurium and Escherichia coli O157:H7 in three nutritious juices, and no recovery was observed during 24-week shelf-life studies at 4, 10, or 22°C for both bacteria. PEF-treated juices had lower TMAB and TMY counts than those of the control samples after treatment and during shelf-life studies. Even though an increase was observed in the counts of TMAB and TMY during shelf-life studies, this increase was significantly lower in PEF-treated juices than in the control samples (Mendes-Oliveira et al., 2022).
4 Conclusion
PEF treatment of LRS by different levels of electric field strength (7.00, 15.50, and 24.10 kV/cm), treatment time (108, 432, and 756 µsec), and processing temperatures (6, 18, and 30°C) according to the Box–Behnken design with determination of optimum operational processing parameters of 6.90 kV/cm, 756.00 µs, and 7.48°C performed with applied energy ranging from 4.20 to 35.70 J revealed that most of the physical, bioactive, and sensory properties of LRS were not adversely affected by PEF treatment. Moreover, PEF treatment enabled significant inactivation of endogenous microflora of TMAB, TMY, B. circulans, and C. tropicalis. LRS samples processed under the optimum processing conditions were stored at 4°C and 22°C for shelf-life studies. While control samples at 4°C and 22°C were spoiled on the fifth and second days, PEF-treated samples stored at 22°C and 4 °C began to deteriorate after the 30th and 40th days of storage.
This is the first study that reports the effect of PEF treatment of LRS to determine shelf-life extension with measurement of changes in the physicochemical, bioactive, and sensory properties in addition to microbial inactivation. It is concluded that PEF treatment is effective for shelf-life extension of LRS, but further studies need to be conducted to determine changes in aroma-active compounds and phenolic compounds.
Data availability statement
The original contributions presented in the study are included in the article/Supplementary Material; further inquiries can be directed to the corresponding author.
Author contributions
HT: conducting test and analysis and data management; ID: conducting test and analysis and data management; GA: conceptualization, funding acquisition, project administration, data curation, supervision, validation, and writing—original draft; SU: data analyses, modeling, and optimization. All authors contributed to the article and approved the submitted version.
Funding
Financial support was provided by the Republic of Türkiye Ministry of Agriculture and Forestry General Directorate of Agricultural Research and Policies (project no: TAGEM/16/AR-GE/35) and the Republic of Türkiye Ministry of Development Government Planning Agency (project no: 2009 DPT K 120140).
Conflict of interest
The authors declare that the research was conducted in the absence of any commercial or financial relationships that could be construed as a potential conflict of interest.
Publisher’s note
All claims expressed in this article are solely those of the authors and do not necessarily represent those of their affiliated organizations, or those of the publisher, the editors, and the reviewers. Any product that may be evaluated in this article, or claim that may be made by its manufacturer, is not guaranteed or endorsed by the publisher.
References
Aday, S., Pala, Ç. U., Çam, B. A., and Bulut, S. (2021). Combined effects of acidification and high-pressure processing on microbial inactivation, bioactive compounds and antioxidant activity of liquorice root “sherbet”. Int. J. Agric. Environ. Food Sci. 5, 364–374. doi:10.31015/jaefs.2021.3.16
Aday, S., Uysal Pala, Ç., Ayana Çam, B., and Bulut, S. (2018). Storage quality and microbiological safety of high pressure pasteurized liquorice root “sherbet”. LWT 90, 613–619. doi:10.1016/j.lwt.2018.01.013
Anilkumar, D., Joshi, H., and Nishteswar, K. (2012). Review of Glycyrrhiza glabra (yastimadhu) - a broad spectrum herbal drug. Pharma Sci. Monit. 3, 3171–3195.
Ariño, A., Herrera, M., Estopañan, G., and Juan, T. (2007). High levels of ochratoxin A in licorice and derived products. Int. J. Food Microbiol. 114, 366–369. doi:10.1016/j.ijfoodmicro.2006.08.005
Delso, C., Berzosa, A., Sanz, J., Álvarez, I., and Raso, J. (2022). Two-step PEF processing for enhancing the polyphenol concentration and decontaminating a red grape juice. Foods 11, 621. doi:10.3390/foods11040621
Demir, I., Atmaca, B., Evrendilel, G. A., and Uzuner, S. (2022). Effectiveness of pulsed electric field treatment and plant essential oils on quality and shelf-life extension of licorice root drink. Proc. XIII Int. Sci. Agric. Symposium-Agrosym 2022, 589–595.
Evrendilek, G. A., Agcam, E., and Akyildiz, A. (2021). Effects of pulsed electric fields on sour cherry juice properties and formations of furfural and hydroxymethylfurfural. Int. J. Food Eng. 17, 217–226. doi:10.1515/ijfe-2020-0189
Evrendilek, G. A., Jin, Z. T., Ruhlman, K. T., Qiu, X., Zhang, Q. H., and Richter, E. R. (2000). Microbial safety and shelf-life of apple juice and cider processed by bench and pilot scale PEF systems. Innov. Food Sci. Emerg. Technol. 1 (1), 77–86. doi:10.1016/S1466-8564(99)00004-1
Evrendilek, G., Bakay, S., and Uzuner, S. (2021). High pressure processing of licorice drink with respect to quality characteristics, microbial inactivation, and shelf-life extension. J. Food Proc. Preserv. 45, e15465. doi:10.1111/jfpp.15465
Evrendilek, G. (2022). Pulsed electric field processing of red wine: Effect on wine quality and microbial inactivation. Beverages 8, 78. doi:10.3390/beverages8040078
Gupta, V. K., Fatima, A., Faridi, U., Negi, A. S., Shanker, K., Kumar, J. K., et al. (2008). Antimicrobial potential of Glycyrrhiza glabra roots. J. Ethnopharmacol. 116, 377–380. doi:10.1016/j.jep.2007.11.037
Hayashi, H., and Sudo, H. (2009). Economic importance of licorice. Plant Biotechnol. 26, 101–104. doi:10.5511/plantbiotechnology.26.101
Kantala, C., Supasin, S., Intra, P., and Rattanadecho, P. (2021). Design and analysis of pulsed electric field processing for microbial inactivation (case study: Coconut juice). Sci. Technol. Asia. 27 (4), 281–290.
Khalesi, M. (2015). Ochratoxin A in liquorice products – A review. Food Addit. Contam. Part A 32, 2086–2092. doi:10.1080/19440049.2015.1094708
Kumar, S. N. S., Sreenivas, K. N., Shankarappa, T. H., and Ravindra, V. (2012). Standardization of recipe for value added nutraceutical beverage of guava blended with Aloe vera and roselle. J. Environ. Ecol. 30, 995–1001.
Linton, M., and Patterson, M. F. (2000). High pressure processing of foods for microbiological safety and quality. Acto Microb. Immun Hungarica 47 (2–3), 175–182.
Mendes-Oliveira, G., Jin, T. Z., and Campanella, O. H. (2022). Microbial safety and shelf-life of pulsed electric field processed nutritious juices and their potential for commercial production. J. Food Proces. Preserv. 46 (10), e16249. doi:10.1111/jfpp.16249
Mgaya-Kilima, B., Remberg, S. F., Chove, B. E., and Wicklund, T. (2014). Influence of storage temperature and time on the physicochemical and bioactive properties of roselle-fruit juice blends in plastic bottle. Food Sci. Nutr. 2, 181–191. doi:10.1002/fsn3.97
Obolentseva, G. V., Litvinenko, V. I., Ammosov, A. S., Popova, T. P., and Sampiev, A. M. (1999). Pharmacological and therapeutic properties of licorice preparations (A review). Pharm. Chem. J. 33, 427–434. doi:10.1007/BF02510095
Oziembłowski, M., Trenka, M., Czaplicka, M., Maksimowski, D., and Nawirska-Olszańska, A. (2022). Selected properties of juices from black chokeberry (Aronia melanocarpa L.) fruits preserved using the PEF method. Appl. Sci. 12, 7008. doi:10.3390/app12147008
Öztürk, M. (2019). Termosonikasyon uygulamasinin meyan kökü şerbetinin kalitesi üzerine etkisi. Osmaniye, Türkiye: Osmaniye Korkut Ata University. MS.c. Thesis.
Ribéreau-Gayon, P., Dubourdieu, D., Donèche, B., and Lonvaud, A. (2006). Handbook of enology, volume 1: The microbiology of wine and vinifications. New York, United States: John Wiley & Sons.
Roobab, U., Abida, A., Chacha, J. S., Athar, A., Madni, G. M., Ranjha, M. M. A. N., et al. (2022). Applications of innovative non-thermal pulsed electric field technology in developing safer and healthier fruit juices. Molecules 27, 4031. doi:10.3390/molecules27134031
Sengupta, S., Jana, M. L., Sengupta, D., and Naskar, A. K. (2000). A note on the estimation of microbial glycosidase activities by dinitrosalicylic acid reagent. Appl. Microbiol. Biotechnol. 53, 732–735. doi:10.1007/s002530000327
Uzuner, S., and Evrendilek, G. A. (2017). Impact of pulsed electric fields and heat treatment on quality of licorice drink: A comparative study. Int. J. Food Biosys. Eng. 4 (1), 97–103.
You, T., Tang, J., Yin, S., Jia, G., Liu, G., Tian, G., et al. (2023). Effect of dietary licorice flavonoids powder on performance, intestinal immunity and health of weaned piglets. J. Anim. Physiol. Anim. Nutr. 107, 147–156. doi:10.1111/jpn.13694
Keywords: licorice root sherbet, pulsed electric fields, non-thermal processing technologies, Box–Behnken, shelf-life, optimization, traditional drink
Citation: Akdemir Evrendilek G, Tanriverdi H, Demir I and Uzuner S (2023) Shelf-life extension of traditional licorice root “sherbet” with a novel pulsed electric field processing. Front. Food. Sci. Technol. 3:1157649. doi: 10.3389/frfst.2023.1157649
Received: 02 February 2023; Accepted: 30 March 2023;
Published: 13 April 2023.
Edited by:
Nikolaos Andritsos, University of Patras, GreeceReviewed by:
Aris E. Giannakas, University of Patras, GreeceIoannis Karabagias, University of Patras, Greece
Copyright © 2023 Akdemir Evrendilek, Tanriverdi, Demir and Uzuner. This is an open-access article distributed under the terms of the Creative Commons Attribution License (CC BY). The use, distribution or reproduction in other forums is permitted, provided the original author(s) and the copyright owner(s) are credited and that the original publication in this journal is cited, in accordance with accepted academic practice. No use, distribution or reproduction is permitted which does not comply with these terms.
*Correspondence: Gulsun Akdemir Evrendilek, Z2V2cmVuZGlsZWtAaWJ1LmVkdS50cg==