 Emmanuel Addo-Preko
 Joris Gerald Niilante Amissah
 Maame Yaakwaah Blay Adjei
94% of researchers rate our articles as excellent or good
Learn more about the work of our research integrity team to safeguard the quality of each article we publish.
Find out more
ORIGINAL RESEARCH article
Front. Food. Sci. Technol., 21 June 2023
Sec. Food Characterization
Volume 3 - 2023 | https://doi.org/10.3389/frfst.2023.1071216
This article is part of the Research TopicAdvances in Sensory Evaluation of FoodsView all 6 articles
The 9-point hedonic scale is the most widely used scale for consumer acceptance testing globally. The scale has nine categories with verbal anchors which are converted to a numerical scale with numbers assigned at equal intervals so that the psychological distance between successive scale points is equal. The verbal cues and number of categories assigned to them may not be relevant for Ghanaian consumers based on cultural differences. Using bread as an example, we used a 3 × 4 factorial design for bread types and scaling categories, to determine the number of categories in a hedonic scale that would be appropriate for Ghanaian consumers to use in a consumer acceptance test. Three commonly consumed breads in Ghana, tea bread, butter bread, and sugar bread were used. The number of categories in the scales we tested were the traditional 9-point, and three truncations of it; 7-point, 5-point, and 3- point scales. Each scale had verbal cues and numbers based on the traditional 9-point scale. Assessors rated their degree of overall liking followed by the degree of liking for appearance, flavor and texture of each bread sample. They further ranked the breads for preference. Simple t-tests, Analysis of variance and ranked order analyses were used to determine differences in liking scores for the breads across the different scales used. Regardless of the number of categories in the scales used, the order for product liking and preference rank order were the same; sugar bread > butter bread > tea bread. Attentiveness to the task of scoring the degree of liking was an important factor that impacted how the different scale lengths were used. When assessors are attentive to changes in scale length, they adjust their scores to fit the scale length and thus the number of categories in the scale length does not affect the acceptance score. The choice of scale length to use should be considered carefully in a consumer acceptance test.
The first official sensory hedonic scale to be developed is the 9-point Hedonic scale (9PHS) (Peryam and Girradot, 1952). It was developed at the Quartermaster Food and Container Institute of the U.S. Armed forces by Peryam and Pilgrim (1957). It was developed to measure the food preference of U.S. soldiers and has since been adopted by the food industry to determine the acceptability of foods and beverages (Johnson, 2021). It is to date the most popular and commonly used hedonic scale used to measure consumer acceptance of both food and non-food products (Lim, 2011). The scale is made of nine verbal category points that range from “dislike extremely”—1 to “like extremely”- 9 and a neutral point in the middle at point five that is “neither like nor dislike” (Peryam and Girradot, 1952). The bipolar nature of the scale and the assumption of equal psychological distance between successive scale points makes it a useful tool for some researchers (Lim, 2011). Some researchers however have questioned the traditional hedonic scales' ability to capture the true affect of consumers and its ability to discriminate between test samples (Lim, 2011). These concerns are founded as Nicolas and MarquillyO’Mahony, 2015 demonstrated when they considered the cognitive process that consumers use to score products on the 9-point scale depending on whether the scale was a “words only,” “numbers only” or a mix of these. One of the long-standing limitations of the 9-point hedonic scale is its neutral point that leads to the error of central tendency and causes assessors to avoid using the extreme ends thus inadvertently leading to a truncated scale that limits the discriminating ability of the scale (Schutz and Cardello, 2001). It has also become apparent that cultural factors may influence how the 9-point hedonic scale is used (Hye et al. 1998).
Recently, emotional scales such as the emoji scale (Swaney-Stueve et al., 2018), and the picture scale, facial expression recognition (Gupta et al. (2021) have been found to be useful tools to understand consume acceptance where hedonic scales seemed limited in its ability to fully explain consumer acceptance scores. These innovations in consumer acceptance testing do not intend to replace the hedonic scale although their existence highlights the limitation of hedonic scale only to fully express consumer acceptance scores.
In spite of its limitations, it was determined during its development that that the 9-point hedonic scale, has good discrimination ability (Jones et al. 1955). Furthermore, during the development of the traditional 9-point hedonic scale, it was noted that when the number of categories on the scale was more, the discrimination ability of the scale improved. The 9-point hedonic scale is widely used also because it is easy to use and understand. This notwithstanding, the language translation and cultural influences associated with acceptability scoring require that the use of the 9-point hedonic scale using the verbal, numerical or combination of verbal and numerical anchors in non-western cultures should first be tested for its discrimination power and sensitivity.
Ghana, a West African country, was previously colonized by the English. Although English is the official language in Ghana, there are over 50 spoken local languages and dialects. Akan Twi is the most spoken local language. Language has a strong cultural effect not only on expression but also on interpretation. In sensory testing language and culture are important factors that affect consumer responses to sensory stimuli. Furthermore, in sensory acceptance tests, consumers are untrained and are open to wide variability in the factors that affect their sensory scores of which language and culture would be a factor. The type of scale to use in this context therefore becomes crucial.
Hedonic scales are typically used to assess the degree of liking for products by consumers. The most common one, the 9-point hedonic scale is an easy to understand and extensively used scale.
In our experience when administering tests to consumers in Ghana, translating the verbal anchors of the traditional 9-point hedonic scale often poses a challenge as there are limited equivalent verbal cues to associate with the extended length of the 9-point hedonic scale with. For example, in the Twi language, the most commonly spoken local language in Ghana, consumers may express their degree of liking for a product in an everyday consumption context using 5-points, at best, with terms such as “me p3 paa” (I like very much) “me p3” (I like), “3y3 ara” (it is just ok), “mennp3” (I do not like) mennp3 koraa (I do not like at all). In many instances, however, only 3-points seem relevant. A direct translation of the 9-point hedonic scale however may not have semantic meaning to consumers in local dialects as food is often not described with the affect “like” when referring to pleasantness of food, rather, the degree of pleasantness is expressed as “d3w” which in Akan language can have up to seven different semantic meanings associated with the sensory experience that may or not relate to a taste stimulus (Eshun, 2020). As such, when we conduct sensory testing locally, consumers are often directed to use the numerical values on the scale to express their degree of liking for the product to overcome the limitation of the expression “like” on the 9-point hedonic scale. This may pose challenges for consumers. It is thus not uncommon to notice that consumers use only the extreme ends of the scale or just the middle part of the scale when scoring similar to what others have previously observed (Villanueva et al., 2005). In some cases, we have also seen consumers express a liking for a product only to score it as disliked. These instances highlight the challenges faced by researchers when using the traditional 9-point hedonic scale in the Ghanaian context. At the very least, it will be helpful to researchers to know if the number of categories used in a hedonic scale when given verbal cues make a difference to the Ghanaian consumer when scoring their degree of liking for food products. This forms the basis for the present study.
In this study, the discrimination power, sensitivity, and reliability of hedonic scales of different number of verbal category points are investigated as a basis to determine how relevant a scale is to the Ghanaian consumers when scoring bread. Bread was selected as the test product for this study as it is a universal product, is easily accessible, stable and consistent. The selected breads have distinct sensory properties to allow clear sensory differences to be perceived, thus making it easy to attribute liking scores to the distinct sensory properties they exhibit. The main objective of the present study was to determine if the number of categories presented on a hedonic scale affects consumers' usage of the scale and the scale’s ability to discriminate between products. Specifically, the aim was to compare the sensitivities of the 3-, 5-, 7, and 9-point hedonic scales to detect differences in liking scores for the same products and also compare the discriminatory power of the 3-, 5-, 7, and 9-point hedonic scales when used by the same consumers to score degree of liking for the same products.
A 3 by 4 factorial design (product X scale category type) was used for this study. The study used a central location test method across five different locations in Accra. Assessors evaluated three types of bread samples using four (4) different hedonic scale lengths. The categories of the hedonic scales used were 9-,7-,5-, and 3-point hedonic scales. Each scale was used to evaluate all three bread samples. However, the scales had a fixed order of presentation (from the longest -9PHS- to the shortest—3PHS) where each assessor assessed the sample set with the 9PHS first, then in descending order of scale length until the last scale the 3PHS. The test samples were however randomized across scale type for the assessors. This means that the serving order of the bread sample for an assessor while using one of the scales, will not be the same when the same assessor is assessing the samples using the other scales. Assessors used still water as palate cleanser in between each bread sample tasted. Quotas system was used to ensure that the distribution of gender, ethnicity and educational level, were reflective of the Ghanaian population. Environmental and product controls were put in place to ensure biases were minimized during the test execution. To ensure that the assessors did not memorize the products, the test was designed in a way that three bread samples were treated as 12 unique products. Each bread sample was given four different 3-digit blinding codes. This meant that all samples were presented with completely different blinding codes, which made it seem that each served sample was treated as a unique sample on its own. A product memory test was included in the ballot sheet to test if assessors were memorizing products based on their sensory properties. Finally, to confirm there were differences in the degree of acceptance of the samples, a forced preference ranking test was done.
A total of 164 bread consumers completed the study. Assessors were recruited using a convenience sampling method. Willing volunteers were screened to ensure that they were 18 years and above, consumed bread, had no known allergies and were available on the test date. Other questions that were asked allowed for the quotas for gender (50% male; 50% female) age group, ethnicity, and educational level to be filled.
Three commonly known and consumed bread types in Ghana were used. These were sugar bread (SB), butter bread (BB), and tea bread (TB). Although commercially there are no standard ways of preparing these bread types, they are known to have distinct differences in their sensory properties and consumer appeal. Sugar bread is typically soft and stretchy in texture and is sweet. Butter bread is typically denser in texture and may be stretchy but has low sweetness compared with sugar bread. Tea bread is typically much drier in texture, not as stretchy as the other two, and is not sweet (Fox and Cameron, 1989). The bread samples used in this study were purchased from a trusted commercial supplier. Care was taken to purchase the same batch of products for each bread type. All the breads were pre-sliced by the manufacturer. The breads were frozen (−18 ± −2°C) after purchase and used throughout the study. They were stored for no more than 1 month. Before the test, an appropriate amount of each bread sample was removed from the freezer and thawed overnight for no less than 12 h at room temperature (25°C ± 2°C). Each slice of bread was cut into quarters for the test (approx. 5 cm by 5 cm with a thickness of about 1 cm). Each assessor received a quarter of a slice of bread to assess. The samples were served in 80 cc transparent containers, individually labelled with random three-digit blinding codes. The samples were served at 25°C ± 2°C. Bread samples were presented in a monadic sequential order following the Williams Latin Square design obtained from Compusense cloud® (Compusense 5, Guelph, Ontario).
The hedonic scales used had words only with no numerical values displayed for assessors. The words were converted to numbers during the analysis. The 9-point hedonic scale served as the control scale. The other categories of scale used were 7-points, 5-points, and 3-points. This was done by progressively removing the two extreme ends of the original 9-point hedonic scale. The words on the truncated scales were kept as is. To avoid bias, the boxes of the truncated categories were adjusted so that the length of the scales appeared visually equal even although the number of categories were fewer. The scales were presented in a balanced randomized order.
The test was carried out across different test locations. Although this may be a limitation, it was a practical step taken to ensure the total number of willing participants who fit the quotas could be obtained. As such 5 different locations in Accra were used. The Sensory Evaluation laboratory at the Department of Nutrition and Food Science, University of Ghana, offered a convenient central location for the tests involving participants with higher education. For participants with lower education, it was practical to create a central location test space in locations where they could be most conveniently recruited. These locations included marketplaces and shopping areas. In these locations, simple testing areas consisting of a table and a chair located in a shaded area with minimal distractions caused by human traffic were set up. Participants completed the test individually over a period of time with assistance from research staff to fill in the questionnaire where there was a need.
The test was set up using Compusensecloud® (Compusense 5, Guelph, Ontario). Data collected in the laboratory was collected directly using Compusense on computers. Data collected outside the laboratory was collected using the paper-based version of the same questionnaire printed from the Compusense software. This was due to internet connectivity challenges usually encountered at central locations outside of the laboratory. In both cases, participants first completed an informed consent form as part of the ethics protocol of the Ethics Committee of the College of Basic and Applied Sciences (ECBAS). Each participant first completed a demographic questionnaire to ensure that the quotas were accurately filled. They then completed the acceptance test using the different scales presented in a balanced randomized order. Each participant evaluated each bread sample once using each of the four scales. Assessors first evaluated the bread for overall liking, then liking of appearance, flavour, and texture using each scale type as they were presented. On completing the scoring test, all three (3) bread samples with a new set of blinding codes were presented at a go to the assessors and they were asked to rank the bread samples from most liked to least liked by placing their most liked sample at position 1 and their least liked at position 3. This data was used to ensure that assessors were being consistent in their responses for the order of liking preference. The data of any assessor whose rank order changed in any of the ranking tests compared with their rating order was discarded and not included in the final analysis. Thus, in total each assessor tasted 15 uniquely coded bread samples. A 1-min intermittent break was enforced for the assessors after tasting each sample and a 5-min break was enforced after assessing their first six (6) samples. To confirm that assessors had not memorized the products and gone into an auto pilot mode when scoring them, two sets of memory questions were asked. The first was to determine whether the assessors were memorizing the codes. The question asked assessors to recall how many of the uniquely coded samples they had evaluated at the end of the scoring test. The second question was asked to determine whether they were able to notice they were tasting three different samples throughout the test. Here assessors were asked to state how many unique bread samples they recognized during the taste sessions. Both memory questions were asked at the end of the scoring session.
Assessors who failed the memory test would correctly identify more than eight unique random codes and/or state they tasted only three different types of bread. Data from these assessors were not included in the final analyses.
The raw data were exported from Compusensecloud® (Compusense 5, Guelph, Ontario) to Microsoft Excel 365. Partial data was cleaned from the bulk, leaving only a complete set of responses. The data showed that almost all the assessors were not memorizing the sample codes. Therefore, only the second memory test question’s results were used to wean out assessors who were able to recognize that they were assessing only three samples throughout the course of the test. The second memory test asked assessors how many different samples they thought they had assessed at the end of the test. Assessors who selected three samples as their answers were classified as assessors who failed the memory test. Assessors who selected the other wrong options available were classified as assessors who passed the memory test. The raw data was then divided into two categories, assessors who failed the memory test and those who passed the memory test. All analyses carried out on these two groups were labeled “(F)” and “(P)” for assessors who failed and those who passed the memory test respectively.
Demographic data were analyzed with Microsoft Excel 365 by using counts and percentages. Pie charts were drawn for sex and educational level for both categories of assessors.
For direct comparison to be possible across the scores from the different scales with different numbers of category scale points, the scores had to be transformed to a common base to allow for direct comparison. A conversion formula was used to convert all the individual scores to a scale point of 10. The linear conversion formula used was: 1 + {[(x-1)/(range of original scale)] × (range of new scale)}, where x is the scale value you would want to convert. For example, to convert four on a 7-point scale to the scale value it would be on a 10-point scale, the range of the original scale is six, the absolute difference between 1 and 7. Range of the new scale is nine, the absolute difference between 1 and 10. X is set to four, the scale value to be converted. 1 + {[(4-1)/(6)] × (9)} answer is 5.5.
After converting all the scores to scores on a 10-point scale using the linear conversion formula, a 3-way ANOVA was run on the liking scores with assessors, samples, and scales as the factors using Minitab 17 software. Even though we ran a 3-way ANOVA interaction was investigated between samples and scale length. The ANOVA tables obtained were added to the results presented. Tukey’s post hoc analysis was used to compare the mean liking scores of the different bread samples across the different scales. A table was drawn to show the mean liking scores for the bread samples for each sensory modality tested. This analysis was done for both categories of assessors.
Using XL-STAT (Addinsoft, France) software, Friedman’s analysis was run on the ranking data of both categories of assessors, and the sum of ranks was converted into bar graphs. Two graphs were drawn, one for each assessor group [(F) and (P)].
For each scale, the unconverted version of the data was obtained and used to run a dependent t-tests for the following sample pairs, SB vs. BB, SB vs. TB, and BB vs. TB. The t-tests were run on only overall liking scores. The mean overall liking scores, t-value, and p-value for all sample pairs under all 4 different lengths of hedonic scales were displayed in a table. t-test analysis just like the ANOVA was conducted on the two categories of data we had [i.e., (F) and (P)]. Thus, separate tables were drawn for each category.
Although only three different bread types were used throughout the test, they were uniquely labelled when a different scale length was used to evoke a sense that 12 unique samples were being evaluated. Our rational to ensure consumers focused on scoring their liking for the products instead of paying attention to the changing number of categories in the scales and possibly adjusting their scores from a previous scale to the next scale. Selective attention on how the scale categories changed could impact the process for scoring liking. Nicolas and MarquillyO’Mahony, 2015 had earlier observed that the cognitive strategy that consumers use when scoring liking on a numbers-only or words-only hedonic scale differed. Thus, intentionally distracting consumers from the changing scale categories was important in our study, as this would pose a greater effect in the scoring pattern. Assessors who identified that only three samples were being tasted failed the memory test while those who could not identify that only three bread types were being tested passed the memory test. We considered that the scoring patterns of these two consumer groups may differ and therefore all subsequent results are reported considering those who failed (F) and those who passed (P) the memory test.
From Figure 1, 72% of the total assessors correctly noticed that only three bread types were being evaluated, although the blinding codes were uniquely different as the scale length changed. This is not surprising as the bread types used have distinct sensory properties that make them easy to identify. Sugar bread is typically sweet and elastic, tea bread is dry and crumbly while butter bread is buttery and firm not too stretchy or crumbly (Fox and Cameron, 1989). These two groups of consumers may also be considered discriminators and non-discriminators respectively. For the purpose of understanding how Ghanaian consumers use hedonic scales, results from both groups are presented.
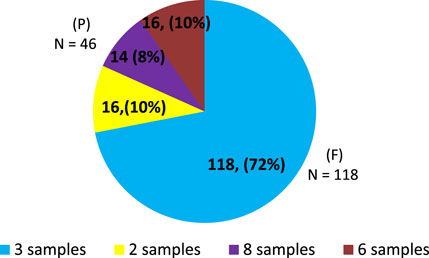
FIGURE 1. Number of unique bread types that assessors identifed at the end of the test. Assessors failed this test when they correctly identified that only 3 unique bread types were included in the test (F). Assessors passed this test when they were not able to identify that only 3 bread types were included in the test (P).
Even though the total number of assessors belonging to each of the consumer groups; discriminators (i.e., those who failed the test) and non-discriminator (those who passed the memory test) was not the same (72% vs. 28%), the percentage distribution of male and female assessors within each category was similar (Figures 2A, B). This ensured that there was no gender bias in the way assessors identified the three bread types.
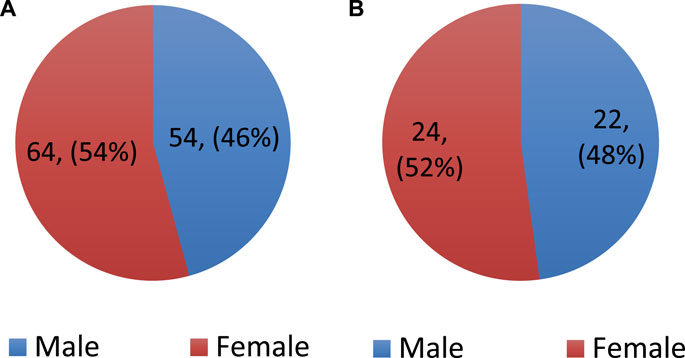
FIGURE 2. Gender distribution of assessors who; (A) did not correctly identify that they were tasting only three bread samples (i.e., failed the memory test) and (B) correctly identified that they were tasting only three bread samples (i.e., passed the memory test).
The educational level of assessors could also influence how easily assessors could recognize the three bread types in the memory test. In Ghana it was reported in 2018 that about 80% of Ghanaians were literate (Sasu, 2023). In this study, the about 90% of all the participants from were literate, making the literacy rate about 10% higher than was reported in 2018. This finding my be reflective of the test location of the study which was within a University campus. None the same, within the two cognitive groups, similar demographics of literacy levels were obtained with a majority (>50%) having tertiary level education or higher. Only a few assessors; 6%, 7% had never been to school or had any form of formal education (Figures 3A, B). Although there was a slightly higher percentage of Senior High Schoolers in the group that passed the memory test (i.e., not correctly identifying that only three samples were being tested) compared to those who failed the memory test, in the present study we focused on literate vs. not literate which was similar across the two groups (i.e., approx. 94% literate and 6% illiterate and 93% literate to 7% illiterate for the two cognitive groups).

FIGURE 3. Educational level of assessors who; (A) did not correctly identify that they were tasting only three bread samples (i.e., failed the memory test) and (B) correctly identified that they were tasting only three bread samples (i.e., passed the memory test).
Based on the results from the memory test, we assumed that the demographics between the two cognitive groups were similar. Results can thus be compared across the two groups.
When the different scales (i.e., 3PHS, 5PHS, 7PHS, and 9PHS) are transformed into an equal 10 point scale, the overall liking scores for assessors who passed the memory test (non-discriminators) are more variable in scoring pattern than those who failed the memory test (discriminators). There is a statistically significant scale effect for the non-discriminators but not for the discriminators (Table 1). Although the highest scores for liking for both consumer groups were about the same, when the highest and lowest liking scores across the different scale were determined, the discriminators who failed the memory test had a narrow scoring range; 2.06 points on the 10-point scale (see values in bold in Table 1), while the non-discriminators who passed the memory test had a wider scoring range of 3.52 points on the 10-point scale (see values in bold in Table 2). It is clear that the level of attention of the assessors to the changing scale length influenced how assessors used the different scales Perhaos assessors were focused on adjusting their liking scores as the scales changed in length. It may be deduced then that if assessors do not pay attention to the scale length, their liking score values may be affected depending on the length of scale used. Similar outcomes were observed for all appearance, flavour and texture.
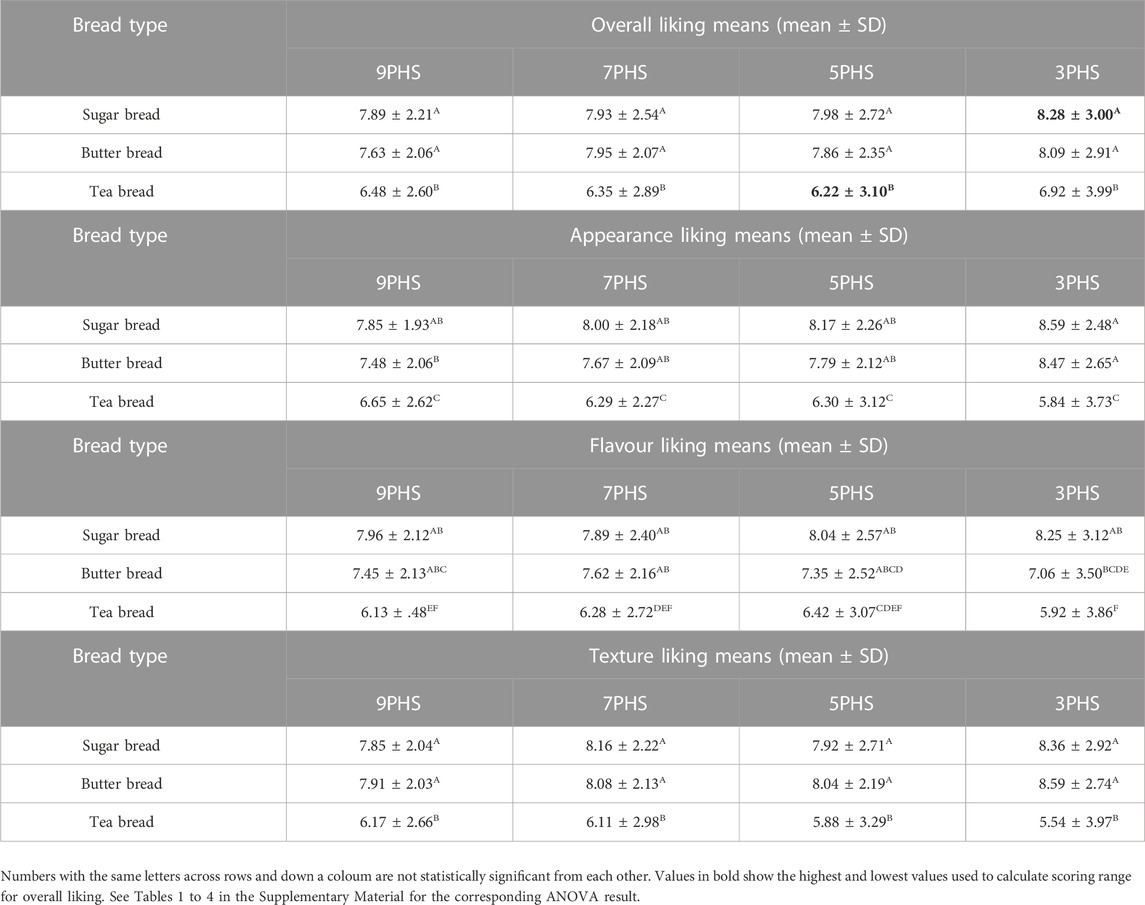
TABLE 1. Table showing mean liking scores of the three bread samples across all the hedonic scales used for assessors who recognized that only three bread types were being tested (F).
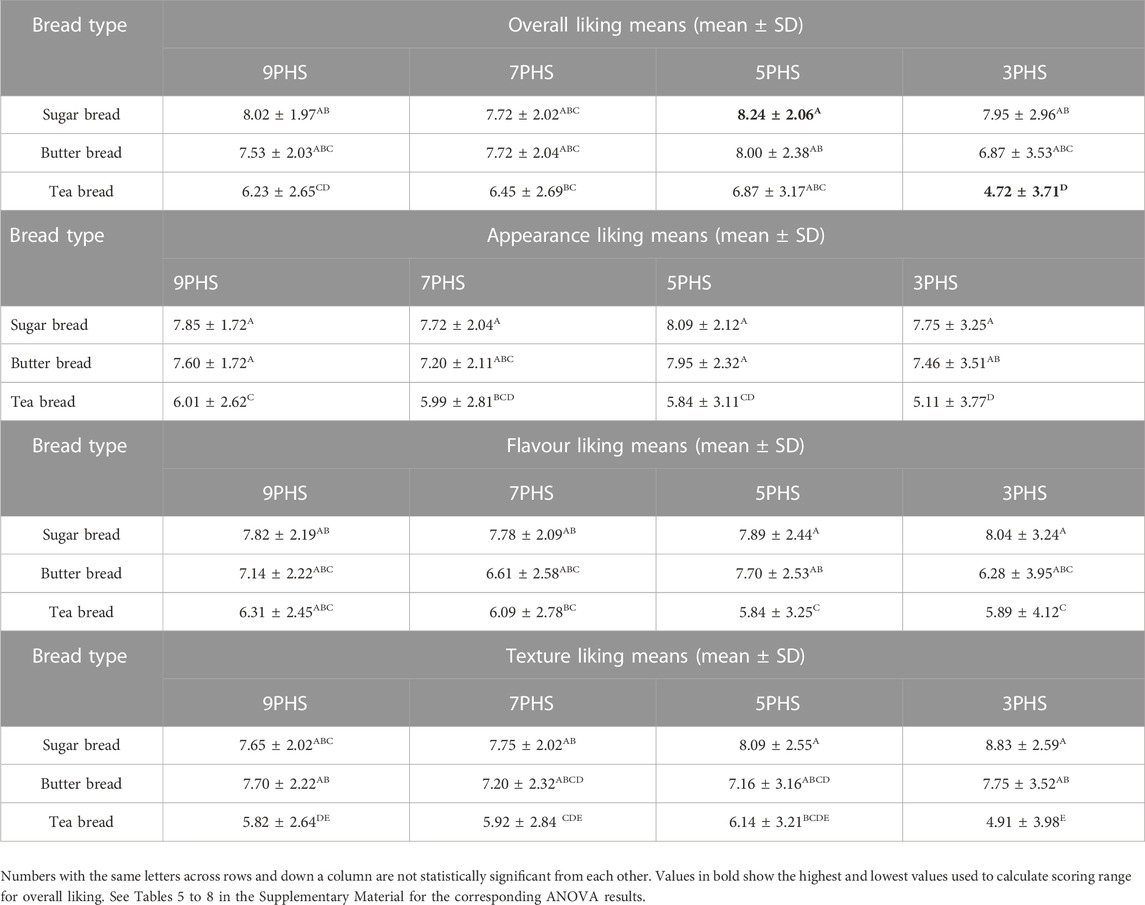
TABLE 2. Table showing mean liking scores of the three bread samples across all the hedonic scales for assessors who did not identify that they were assessing only three bread types.
Figures 4A, B show that both groups of assessors had the samerank order in terms of order of preference of the three different bread samples that were used in the test. However, the rank order for assessors who failed the memory test (discriminators) werestatistically significantly differentiated between all three products while the those who passed the memory test (non-discriminators) were not able to clearly differentiate between their preference for sugarand butter bread. This observation may confirm the assertion that those who passed the memory test (non-discriminators) were unable to differentiate between the products when presented together due to their low discriminating ability. For such assessors, perhaps simple scales such as the 3PHS would be most helpful as they can evaluate the products uniquely on a scale without the need to compare two or more products on the same scale as a ranking test will require. This observation further points to a difference in scale use depending on the level of attention for product evaluation and an assessor’s ability to discriminate between products.
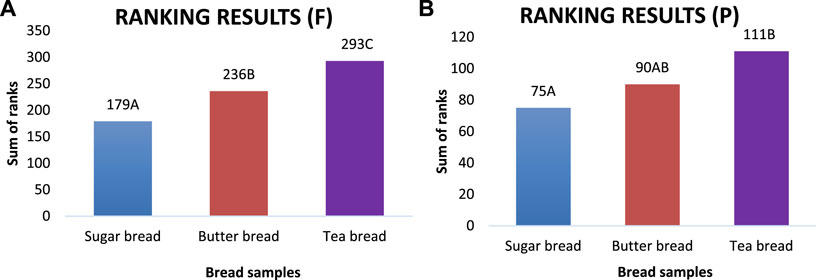
FIGURE 4. (A) Graph showing the rank order of assessors who failed the memory test. (B)Graph showing the rank order of assessors who passed the memory test.
The t-value measures the size of the difference between two means, relative to the variation in the data set. It is calculated by taking the ratio of the difference between the two means and the variation that exists between the sample set which is represented by the standard error (SE) (Hayes, 2022). The t-value is also known as the t-statistic. It is a standardized value that estimates the difference between the two samples being tested by the t-test. The greater the t-value the greater the difference between the samples (Chew, 2010). The t-value was considered a good index to determine the sensitivity of the scales when used by the different groups of assessors. The rank order was the basis for our sample paring (SB vs. BB, SB vs. TB, and BB vs. TB) for the t-test.
From Table 3, none of the scales was sensitive enough to discriminate between sugar bread (SB) and butter bread (BB), although all the scales were able to discriminate between sugar bread (SB) and tea bread (TB) and butter bread (BB) and tea bread (TB). This observation was consistent with the mean liking scores obtained from the two-way ANOVA test results shown in Tables 1, 2.
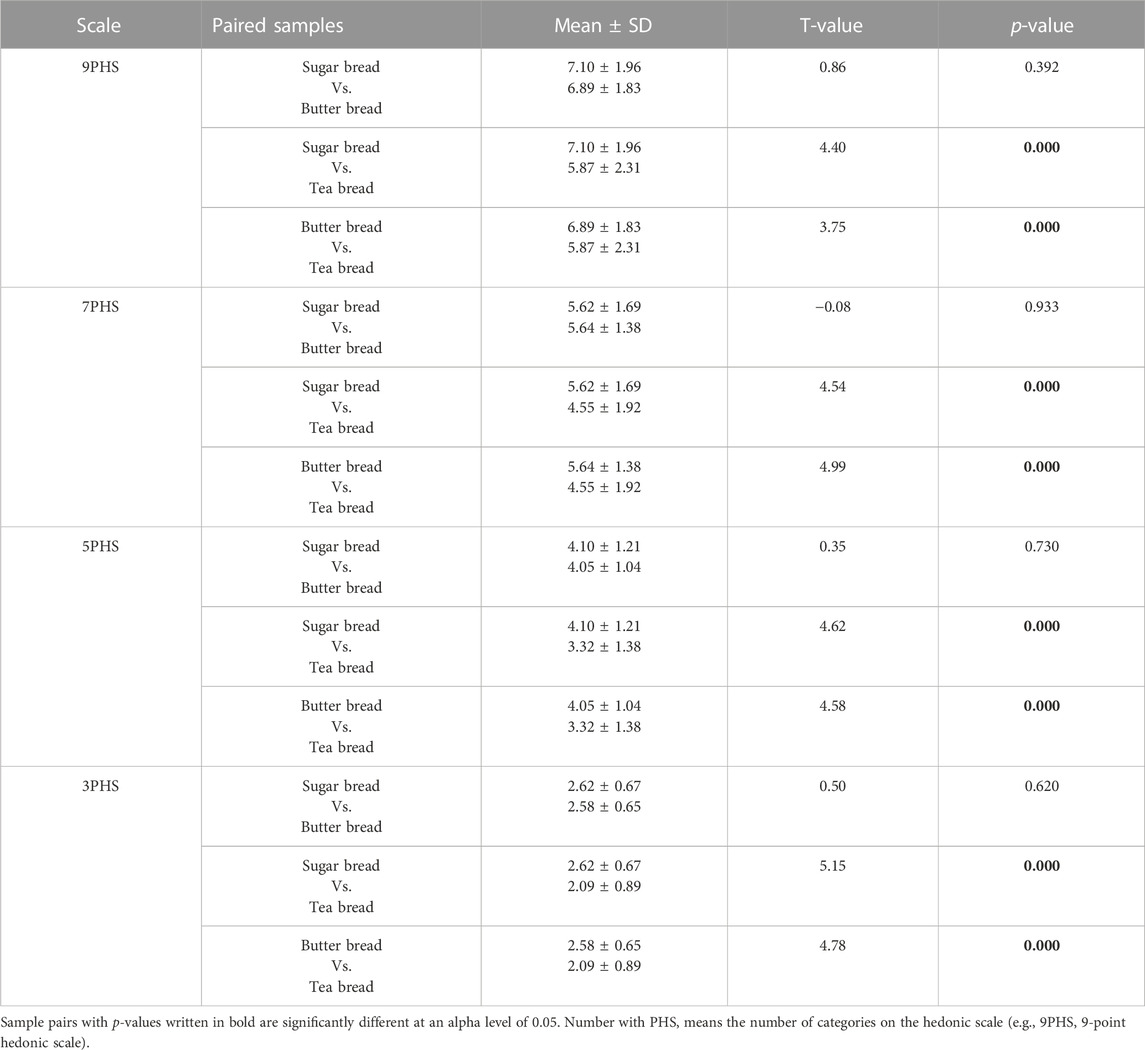
TABLE 3. Table showing results for dependent t-tests ran on bread pairs across the 4 different hedonic scales used for assessors who failed the memory test (F).
Because the t-value is a standardized value, we can compare t-values across the different scales and make some inferences about the discriminatory power of the scales. Thus, extracting further from Table 3, the t-value of SB vs. BB across the scales, had relatively very low values compared to the remaining two pairs and showed not statistical significant effect.
The 3PHS however recorded the highest t-values of the SB vs. TB pairs across the four scales suggesting that the 3PHS had a better discriminatory power for the sample pair in question compared to the other scales. However, the general difference in overall mean liking scores of the two samples in question is prominent, thus the t-values of the other scales were also relatively high. It is believed that the limited number of category scale points in the 3PHS led assessors to score the TB sample as 1 = “dislike,” whiles they were scoring 3 = “like” for the SB sample. This creates more prominent differences between the liking scores of the samples as opposed to the other scales that offered some verbal anchors to capture some degree of liking to an extent depending on how many category scale points there are in the scale. So, on these relatively longer scales, assessors could still rate TB as a “like” but use the degree of liking that comes with the scale to differentiate which samples, they like over the others. This could render the apparent difference between liking scores for the pair to be just one category point apart on these relatively longer scales (especially the 9PHS and 7PHS).
The trend was a bit different when it came to the BB vs. TB pair where the 7PHS rather showed more discrimination between the pair ahead of the 3PHS. The 9PHS again recorded the lowest t-value among the scales. Considering the fact that it was the scale with the highest number of category scale points, it should have offered more discrimination than the other scales. This assertion was established when Peryam and his colleagues conducted a study that concluded that the more the category scale points the more discriminatory the scale (Jones et al. 1955). However, our results showed a different trend where the 9PHS showed a relatively low discriminatory power compared to the other shorter scales used in this study. Considering that these assessors were “attentive” to the changing scale length, it is possible that assessors pre-adjusted their scoring pattern to reflect the scale length being used and thus the superiority of the 9PHS in being more discriminating was not observed.
From Table 4, the trend for assessors who passed the memory test was not any different to those who failed the memory test when the t-test scores were calculated. The SB vs. BB pairs again did not show any significant difference in their liking scores across all the scales for this data set. The remaining two pairs each showed a significant difference between the samples. This common trend that was exhibited by the two groups reflects the true degree of liking of the three bread samples. Just as observed in the ANOVA, the mean overall liking score of SB and BB were not significantly different.
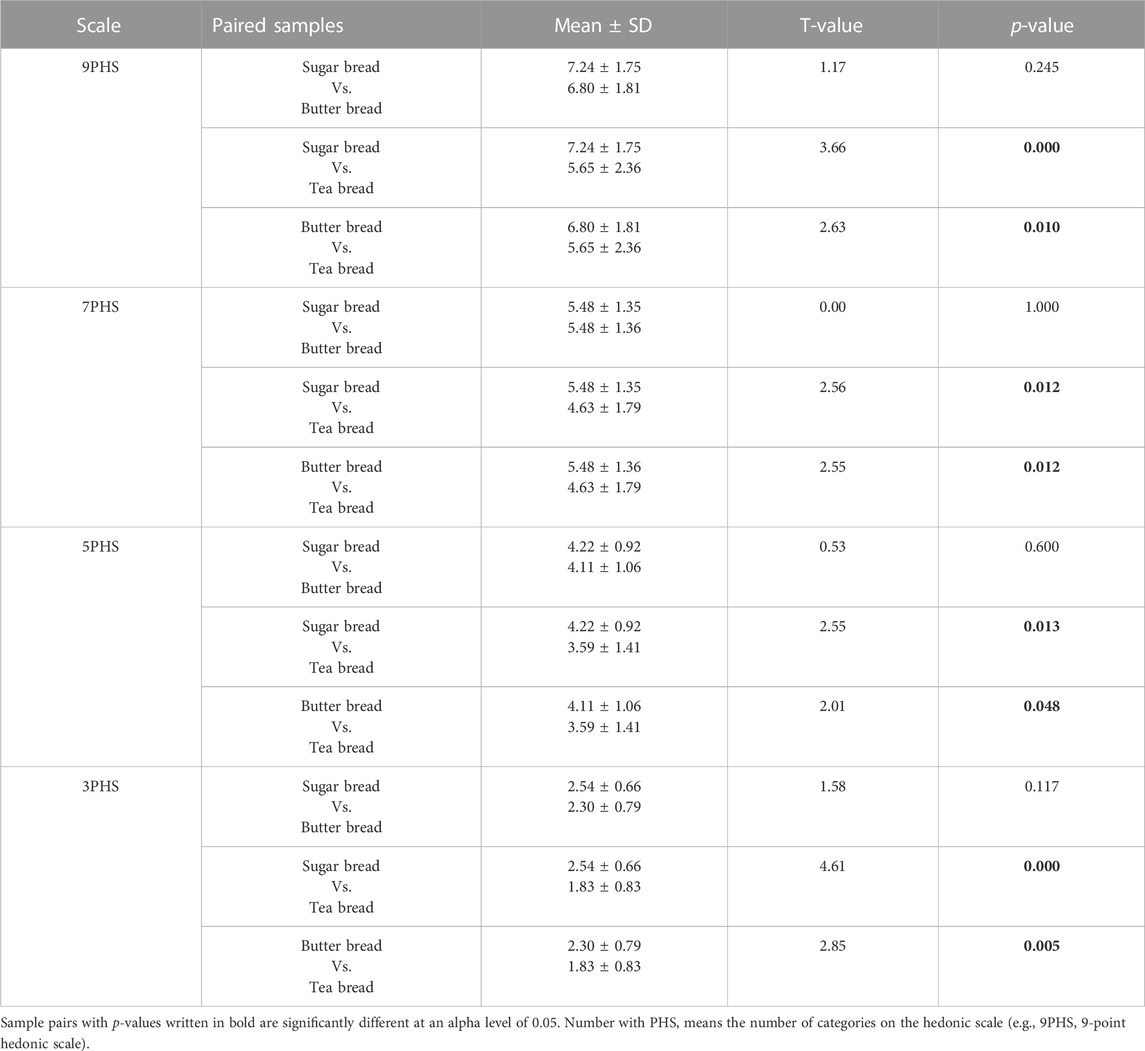
TABLE 4. Table showing results for dependent t-tests ran on bread pairs across the 4 different hedonic scales of different numbers for assessors who passed the memory test.
A close look at all t-values from both Tables 3, 4 showed that the 3PHS values are slightly higher than the 9PHS which may suggest higher sensitivity with the 3PHS than the 9PHS.
Although our aim was not to investigate how attention to the task of scoring liking on different scale lenghts influenced hedonic scoring, it was revealing to notice that the level of attention to the sensory properties of the bread types and changing length of the hedonic scales uncovered through the memory test (c.f. 3.1), turned out to be a more important factor on how the scales were used by the two categories of assessors than the length of the scale categories itself. Attention is well understood to be an important factor in sensory perception and other cognitive tasks (Scerif, 2010). This study has further shown the importance of controlling for this potential bias when conducting sensory tests.
The results show that when assessors are attentive to changes in scale length, those who discriminate between products will adjust their scores to fit the different scale length as such the length of the scale will not change their scoring pattern. Where assessors focus only on rating how much they like a product, without comparing degree of liking across two products (as in a ranking test) the length of scale used is an important attribute to consider. In that context, although similar ranking orders are obtained when large sensory difference exists between the products being tested, a 3PHS is more sensitive and discriminating than the 9PHS. The acceptance value of the 7- and 5-point hedonic scales must be used cautiously as the acceptance scores may not be as reliable as the rank order they provide.
This study is limited in design as it considered only the rank order and sensitivity and discrimination of the scales. There are several factors to consider in a study like this, such as ease of scoring, verbal discussion on relevance to the consumer, language translation and others. It was not possible to integrate all these elements in this present study, however the findings are useful to guide researchers in the choice of scale when working within the Ghanaian context. More studies are required in this area to guide researchers in the use of appropriate scales for consumer testing in Ghana.
The original contributions presented in the study are included in the article/Supplementary Material, further inquiries can be directed to the corresponding author.
The studies involving human participants were reviewed and approved by Ethics Committee of the College of Basic and Applied Sciences (ECBAS) with protocol number 048/15-16. The patients/participants provided their informed consent to participate in this study.
EA-P: data analysis, writing first draft, re-analysis, and re-writing. MYBA: conceptualization, study design, study funding, data analysis, writing and reviewing, re-writing. JGNA: project funding, reviewing. All authors contributed to the article and approved the submitted version.
This project was funded by the Bill and Melinda Gates Foundation. The funder was not involved in the study design, collection, analysis, interpretation of data, the writing of this article, or the decision to submit it for publication. The study was also funded with UK aid from the UK government; however, the views expressed do not necessarily reflect the UK government’s official policies. Grant #OPP1156627, A formative and feasibility assessment of opportunities for strengthening dairy value chains in Ghana for improved maternal and child nutrition outcomes in 2016. Further funding was provided by the University of Ghana Sensory Evaluation Laboratory for project finalization, data analyses and manuscript drafting.
The authors wish to acknowledge Mr Ransford Addo and Ms Amma Oduro for their initial work in data collection. The Authors further acknowledge Mr Paul Holtzman for his immense support with the statistical re-analysis of the work.
The authors declare that the research was conducted in the absence of any commercial or financial relationships that could be construed as a potential conflict of interest.
All claims expressed in this article are solely those of the authors and do not necessarily represent those of their affiliated organizations, or those of the publisher, the editors and the reviewers. Any product that may be evaluated in this article, or claim that may be made by its manufacturer, is not guaranteed or endorsed by the publisher.
The Supplementary Material for this article can be found online at: https://www.frontiersin.org/articles/10.3389/frfst.2023.1071216/full#supplementary-material
Chew, C. J. (2010). Making sense of the two-sample T-test. Available at https://www.coe-partners.com/Articles/Making%20Sense%20of%20the%20Two-Sample%20T-Test.pdf (Accessed.
Eshun, E. S. (2020). A Cognitive Semantic Analysis of perception and cognition expressions in Akan. Ghana: PhD thesis submitted to the University of Ghana. http://localhost:8080/handle/123456789/38351.
Fox, B. A., and Cameron, A. G. (1989). Food science, nutrition and health. 5th edn. London: Edward Arnold, 138.
Gupta, M., Torrico, D. D., Hepworth, G., Gras, S. L., Ong, L., Cottrell, J. J., et al. (2021). Differences in hedonic responses, facial expressions and self-reported emotions of consumers using commercial yogurts: A cross-cultural study. Foods 10, 1237.
Hayes, A. (2022). T-test: What it is, with multiple formulas and when to use them. Available at https://www.investopedia.com/terms/t/t-test.asp.
Johnson, M. (2021). The 9-point hedonic scale. Society of sensory professionals. Available at https://www.sensorysociety.org/knowledge/sspwiki/Pages/The%209-point%20Hedonic%20Scale.aspx.
Jones, L. V., Peryam, D. R., and Thurstone, L. L. (1955). DEVELOPMENT OF A SCALE FOR MEASURING SOLDIERS'FOOD PREFERENCESb. Food Res. 20, 512–520. doi:10.1111/j.1365-2621.1955.tb16862.x
Lim, J. (2011). Hedonic scaling: A review of methods and theory. Food Qual. Prefer. 23, 733–747. doi:10.1016/j.foodqual.2011.05.008
NicolasMarquilly, L. C., and O’Mahony, M. (2015). The 9-point hedonic scale: Are words and numbers compatible? Food Qual. Prefer. 21, 1008–1015. doi:10.1016/j.foodqual.2010.05.017
Peryam, D. R., and Pilgrim, F. J. (1957). Hedonic scale method of measuring food preferences. Food Technol. 11, 9–14.
Sasu, D. D. (2023). Adult literacy rate in Ghana 2000-2020. Statista. Society, Education and Science. Available at https://www.statista.com/statistics/1171920/adult-literacy-rate-in-ghana/#:∼:text=With%2080.38%20percent%2C%20the%20rate,value%20in%20the%20observed%20period.
Scerif, G. (2010). Attention trajectories, mechanisms and outcomes: At the interface between developing cognition and environment. Dev. Sci. 13 (6), 805–812. doi:10.1111/j.1467-7687.2010.01013.x
Schutz, H., and Cardello, A. V. (2001). Labeled Affective Magnitude (LAM) scale for assessing food liking/disliking. J. Sens. Stud. 16, 117–159. doi:10.1111/j.1745-459x.2001.tb00293.x
Swaney-Stueve, M., Jepsen, T., and Deubler, G. (2018). The emoji scale: A facial scale for the 21st century. Food Qual. Prefer. Advance online publication. doi:10.1016/j.foodqual.2018.03.002
Villanueva, D. M. N., Penetate, A. J., and Da Silva, A. P. M. (2005). Performance of the hybrid hedonic scale as compared to the traditional hedonic, self-adjusting and ranking scales. Food Qual. Prefer. 16, 691–703. doi:10.1016/j.foodqual.2005.03.013
Keywords: acceptance, cross-culture, scale-length, bread, Ghana
Citation: Addo-Preko E, Amissah JGN and Adjei MYB (2023) The relevance of the number of categories in the hedonic scale to the Ghanaian consumer in acceptance testing. Front. Food. Sci. Technol. 3:1071216. doi: 10.3389/frfst.2023.1071216
Received: 16 October 2022; Accepted: 05 May 2023;
Published: 21 June 2023.
Edited by:
Damir Dennis Torrico, Lincoln University, New ZealandReviewed by:
Behannis Mena Chalas, The University of Melbourne, AustraliaCopyright © 2023 Addo-Preko, Amissah and Adjei. This is an open-access article distributed under the terms of the Creative Commons Attribution License (CC BY). The use, distribution or reproduction in other forums is permitted, provided the original author(s) and the copyright owner(s) are credited and that the original publication in this journal is cited, in accordance with accepted academic practice. No use, distribution or reproduction is permitted which does not comply with these terms.
*Correspondence: Maame Yaakwaah Blay Adjei, bXliYWRqZWlAdWcuZWR1Lmdo
Disclaimer: All claims expressed in this article are solely those of the authors and do not necessarily represent those of their affiliated organizations, or those of the publisher, the editors and the reviewers. Any product that may be evaluated in this article or claim that may be made by its manufacturer is not guaranteed or endorsed by the publisher.
Research integrity at Frontiers
Learn more about the work of our research integrity team to safeguard the quality of each article we publish.