 Emmanuel Anyachukwu Irondi
 Yunus Temitayo Imam
 Emmanuel Oladipo Ajani
- Department of Biochemistry, Kwara State University, Malete, Nigeria
Natural sources of hydrocolloids may serve as healthier alternatives to modified hydrocolloids as gluten replacement in gluten-free food products. In this study, the physicochemical, antioxidant and starch-digesting enzymes inhibitory properties of gluten-free whole pearl millet flour (PMF) blended with 1.5% and 3% of either sweet detar flour (SDF, a natural source of hydrocolloids) or sodium carboxymethyl cellulose (SCMC, a modified hydrocolloid), and the sensory qualities of their breads were evaluated. White wheat flour (WWF) and its bread served as the control flour and bread, respectively. Amylose level and solubility index of the blends decreased, whereas their water absorption capacity, peak and final viscosity increased significantly as their proportions of SDF and SCMC increased. Total phenolics, tannins, and total flavonoids contents; DPPH•, ABTS•+ scavenging capacity, and reducing power; α-amylase and α-glucosidase inhibitory activities were significantly higher in PMF and its blends with SDF and SCMC than in the WWF. Further, the blend of PMF and 1.5% SDF had a stronger α-amylase and α-glucosidase inhibitory activity than those of PMF and SCMC (1.5 and 3%). Although the sensory qualities of the WWF bread were better than those of PMF and its blends with SDF and SCMC, the sensory qualities of PMF-SDF and PMF-SCMC breads were comparable. The study indicates that SDF could be a good substitute for SCMC in the development of PMF-based gluten-free bread, with an enhanced starch-digesting enzymes inhibitory property, targeting celiac disease and type 2 diabetes patients.
1 Introduction
Intake of gluten-free foods such as gluten-free breads is regarded as the only effective treatment option for celiac disease patient (Lamacchia et al., 2014). Nevertheless, the production of gluten-free bread of a high quality poses a big challenge as a result of the absence of gluten, which confers some unique visco-elastic properties to dough (Shabir et al., 2016). Generally, the development of gluten-free bread involves the use of diverse ingredients such as flours of gluten-free cereals, and additives that can mimic the visco-elastic properties of gluten, in order to obtain bread of a good quality (Shabir et al., 2016). In this context, modified hydrocolloids (gums) are known to serve as replacements for gluten in gluten-free breads (Mir et al., 2016; Filipcev et al., 2021). However, their inclusion as gluten replacement may not be cost-effective (Ohimain, 2014), because the process of manufacturing them is expensive and complex (Adedeji et al., 2012). In addition, they are in short supply relative to their demand (Nwokocha et al., 2012). At the same time, the rising cost of wheat flour, especially in countries that depend on imported wheat for their bakery industry, also necessitates finding alternatives to wheat flour in baked food products. A recent report indicated that the price of wheat rose by 31% in the year 2021, as a result of COVID-19-related port disruptions, increased demand, and high costs of shipping (Dongyu, 2022). Thus, the challenge arising from celiac disease, rising cost of wheat, and high cost of modified hydrocolloids production has stimulated research interest in finding gluten-free cereals and natural, low-cost hydrocolloid-rich sources suitable for gluten-free food products.
Hydrocolloids, such as starch, cellulose, pectin, guar gum, gum Arabic and locust bean gum, have several technological applications in the food industry. They serve as gelling agents, stabilizers, viscosity modifiers, fibers, water binders, and inhibitors of ice crystal in foods (Nwokocha et al., 2012) such as bread. Whereas many previous studies focused on modified hydrocolloid (Mir et al., 2016; Filipcev et al., 2021), our recent study demonstrated that Brachystegia eurycoma flour, an underutilized legume and a rich natural source of hydrocolloids, could serve as a gluten replacement in whole millet flour-based gluten-free bread (Irondi et al., 2021). Similarly, in a related study, Filipcev et al. (2021) concluded that psyllium, another natural source of hydrocolloids, could be used interchangeably with commonly used hydrocolloids (xanthan, guar gum and hydroxymethyl cellulose) to effectively improve the quality of buckwheat/carob gluten-free bread. Thus, the use of natural sources of hydrocolloids could be one of the possible ways of reducing the cost of producing gluten-free bread. In addition to this, the incorporation of underutilized sources of natural hydrocolloids as gluten replacements in baked foods can help unleash their food application potentials, while providing some health benefits to the consumers. Hence, sweet detar (Detarium microcarpum), another underutilized legume and a natural source of hydrocolloid (Nwakaudu et al., 2017), was used as gluten replacement in whole pearl millet (Pennisetum glaucum) flour-based gluten-free bread in this study.
Millets are small seeded, highly nutritious and the most digestible grains available in the world (Singh and Naithani, 2014). They occur in different varieties, including pearl millet (Pennisetum glaucum), kodo millet (Paspalum setaceum), finger millet (Eleusine coracana), foxtail millet (Setaria italic), proso millet (Penicum miliaceum), barnyard millet (Echinochloa utilis), and little millet (Panicum sumatrense) (Saleh et al., 2013). They are known to be a drought-resistant crop, resistant to pests and diseases, and to have a short growing season as compared to other major cereals (Devi et al., 2011). Naturally, millet grains are rich in nutrients and non-nutritive phytochemicals that promote health (Kumar et al., 2022). Due to these advantageous characteristics, millets are receiving more attention in the development of foods with health benefits. As part of its utilization as food, millet flour has been used to develop gluten-free breads in recent time (Comettant-Rabanal et al., 2021; Irondi et al., 2021; Pessanha et al., 2021) and pastas (Tyl et al., 2020). Such gluten-free breads, when produced from whole millet flour, could have some health-promoting properties. This could be possible, as different studies have demonstrated that a regular intake of whole cereal grain-based products has some health benefits such as an improved regulation of body weight and a reduced risk of nutrition-related chronic-degenerative diseases (Hauner et al., 2012; Parenti et al., 2020).
Sweet detar (Detarium microcarpum), belonging to the family of Fabaceae, and sub-family of Caesapiniodeaee, is a cheap and readily available leguminous plant, which grows naturally in the forest parts of Africa (Igwenyi & Akubugwo, 2010). This plant offers some important nutritional and economic advantages (Mbaeyi-Nwaoha et al., 2017). The seed flour is used as a soup thickener to improve the rheology of soup. It also serves technological purposes in food systems, including as a flavourant, emulsifier and stabilizer (Nwokocha and Nwokocha, 2012; Omokhua et al., 2013; Irondi et al., 2015). These food applications of sweet detar flour are attributed to the water-soluble polysaccharide constituent (about 60%) of its seed endosperm, of which xyloglucan is the major component (Wang et al., 1997; Nwokocha et al., 2012). It is also a good source of protein, carbohydrate, calories, as well as certain vitamins and minerals (Mbaeyi-Nwaoha et al., 2017).
In view of the challenge posed by celiac disease, the rising cost of wheat, and high cost of modified hydrocolloids production, the objective of this study was to evaluate the physicochemical, antioxidant, and starch-digesting enzymes inhibitory properties of whole pearl millet flour blended with sweet detar flour (a natural source of hydrocolloids) and the sensory qualities of their breads.
2 Materials and methods
2.1 Materials
Seeds samples of sweet detar (Figure 1) and whole pearl millet grains (Figure 2), white wheat flour and sodium carboxymethyl cellulose (modified hydrocolloid) were bought from a market in Ilorin metropolis, Kwara State. All the chemicals used for the various analyses were analytical grades of Sigma products (St. Louis, United States).
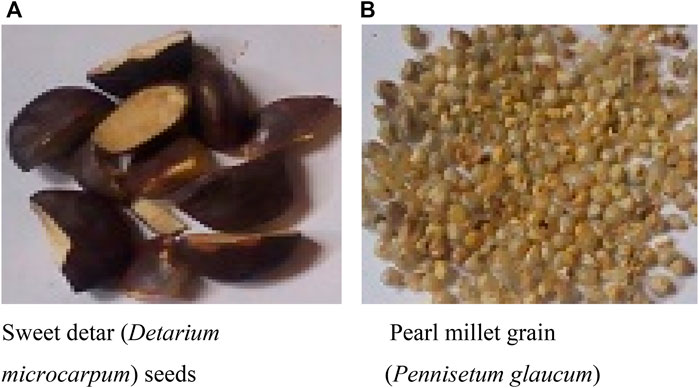
FIGURE 1. (A) Sweet detar (Detarium microcarpum) seeds. (B) Pearl millet grain (Pennisetum glaucum).
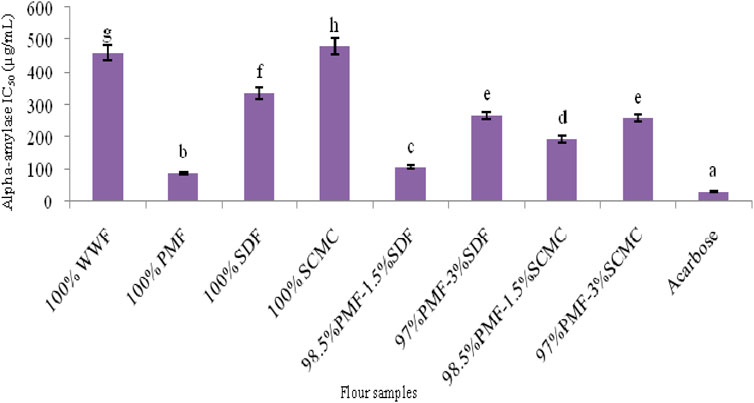
FIGURE 2. Alpha-amylase IC50 of flour samples. Bars with different letters vary significantly (p < 0.05). WWF, white wheat flour; PMF, whole pearl millet flour; SDF, sweet detar flour; SCMC, sodium carboxymethyl cellulose.
2.2 Methods
2.2.1 Flour samples preparation
The sweet detar seeds and whole pearl millet grains samples were ground separately into their respective flours (particle size of less than 0.5 mm). Thereafter, flour blends were formulated by mixing the whole pearl millet flour (PMF) with either sweet detar flour (SDF) or sodium carboxymethyl cellulose (SCMC) at two different proportions (98.1:1.5 and 97:3, w/w), to obtain the following blends: 98.5%PMF:1.5%SDF, 97%PMF:3%SDF, 98.5%PMF:1.5%SCMC and 97%PMF:3%SCMC. Absolute (100%) PMF and white wheat flour (WWF) were included as controls. The proportions of the flours were based on our earlier report (Irondi et al., 2021).
2.2.2 Determination of physicochemical and functional properties of the flour samples
2.2.2.1 Determination of gluten content
Gluten content of the flour samples was quantified as per the gravimetric protocol described by Usurp et al. (1982). In brief, flour sample (20 g) was mixed with 10 ml of distilled water in a centrifuge tube. After 15 min, the suspension was stirred and the flour mixture was rolled into a ball, which was later immersed into distilled water contained in a beaker. After 30 min of standing, it was carefully rinsed under a running tap water, such that no part of it was lost. Afterwards, the resultant elastic gluten was cut into small pieces, arranged in a pan, and oven-dried at 50°C overnight to obtain dried gluten. Subsequently, the final mass was measured and the gluten content (%) was calculated as thus:
Gluten concentration (%) = (Mass of dried gluten (g) x 100)/Mass of flour (g)
2.2.2.2 Determination of amylose and amylopectin contents
Amylose level of the flours was quantified according to the method reported by Irondi et al. (2017). A mixture of the flour sample (100 mg), 95% ethanol (1 ml) and 1 M NaOH (9.2 ml) was heated in a water bath at 100°C for 10 min, to gelatinize the starch. After cooling to room temperature, the gelatinized sample (0.05 ml) was diluted with distilled water (0.45 ml), and mixed with I N acetic acid solution (0.1 ml), iodine solution (0.2 ml, 0.2% I2 in 2% KI), and distilled water (9.2 ml). Subsequently, the mixture was subjected to incubation at room temperature for a period of 20 min, and the absorbance was read at 620 nm in a spectrophotometer (Jenway, 6405 UV/Vis, United Kingdom). The samples’ amylose concentration was calculated using a corn starch amylose standard.
The samples’ amylopectin concentration was calculated by adopting the following formula:
Amylopectin (%) = 100−amylose (%)
2.2.2.3 Determination of water absorption capacity
Water absorption capacity of the samples was determined as per the procedure reported by Nwakaudu et al. (2017). The sample (1 g) was mixed with 10 ml of distilled water in a graduated centrifuged tube for 30 s. The suspension was left for 30 min at room temperature, and then centrifuged at 1500 rpm for 30 min. Subsequently, the supernatant was decanted; noting the volume in the measuring cylinder, which was converted to mass (in grams) by multiplying by the density of water (1 g/ml). The samples’ water absorption capacity was calculated using the following formula:
Water absorption capacity = (Mass of water absorbed x 100)/Mass of flour sample
2.2.2.4 Determination of bulk density
The bulk density of the flour samples was determined as per the protocol described by Nwakaudu et al. (2017). A dry 100 ml measuring cylinder was weighed, and carefully filled with 50 g of the flour sample. Thereafter, the cylinder’s base was gently tapped on a laboratory bench several times, until there no further decrease of the flour in the cylinder. The volume of the flour sample in cylinder and the weight of cylinder plus flour were recorded. The bulk density was calculated thus:
Bulk density (g/ml) = Mass of sample (g)/Volume of sample (ml)
2.2.2.5 Determination of swelling power and solubility index
Swelling power and solubility index of the flour samples were determined as per the procedures reported by Sathe and Salunkhe (1981), with a slight modification. Briefly, 1 g of the flour was mixed with 15 ml of distilled water in a 100 ml conical flask. The suspension was shaken for 5 min at a low speed. It was then transferred into a water bath and heated for 40 min at 80–85°C, with a constant stirring. Thereafter, 7.5 ml of distilled water was added and centrifuged at 2,200 rpm for 20 min. The supernatant was carefully decanted into a pre-weighed can and dried at 100°C to a constant weight. After cooling to room temperature, the can was weighed. The sediment with the centrifuge tube was also weighed. The swelling power and solubility index were calculated according to the following formulae.
Swelling power = Mass of sediment/(Mass of sample−mass of soluble)
% Soluble = (Mass of soluble × 100)/Mass of sample
2.2.3 Determination of pasting properties of the flour samples
The flours’ pasting properties were quantified using a Rapid Visco Analyzer (RVA-4, Perten Scientific, Springfield, IL) (Deffenbaugh and Walker, 1989). In brief, a portion of 3 g of the flour sample was dispersed in distilled water (25 ml) in a canister and loaded on the Rapid Visco Analyzer. The analysis was conducted at a constant stirring rate (160 RPM) according the following programme: 5 min of holding period at 25°C; 5°C/min heating rate between 25 and 95°C; 5 min of holding period at 95°C; a cooling rate of 5°C/min to 25°C; and 5 min of holding period at 25°C. The flours’ pasting properties—peak, breakdown, trough, final, set-back viscosities (expressed in Rapid Visco Analyzer Units, RVU); peak time (expressed in minutes); and pasting temperature (expressed in °C)—were read with the aid of Thermocline software installed on a personal computer system.
2.3 Bread formula and baking process
The bread formula and baking process were according to our earlier report (Irondi et al., 2021). Briefly, the dough comprised flours (100, 98.5 or 97 g of flour, with 0, 1.5 or 3.0 g level of hydrocolloid addition, respectively), salt (1.5 g), sugar (3 g), active dry yeast (0.8 g), shortening (6 g) and potable water (60 g). Uniform dough of each bread formula was obtained by mixing and kneading the ingredients manually. Subsequently, appropriate quantity of the dough was placed in a baking pan pre-smeared with the shortening, and baking was carried out at 330°C for 10 min. The bread loaves were cooled to room temperature on a cooling rack. The bread baked with WWF served as the control bread.
2.4 Preparation of methanolic extract of flours samples
A total of 15 ml of methanol was added to 0.3 g of each flour sample in a centrifuge tube (50 ml capacity), and shaken continuously for a period of 1 h at room temperature. Thereafter, the mixture was kept overnight and filtered to obtain the supernatant (referred to as sample extract hereafter). The extract was collected and stored at −4°C until analysis (Chan et al., 2007).
2.5 Quantification of polyphenolics contents of flour samples
2.5.1 Quantification of total phenolics content
The Folin–Ciocalteu method reported by Singleton et al. (1999) was employed to determine the total phenolics content of the samples. In brief, the sample extract (300 μL) was mixed with Folin–Ciocalteu reagent (1.5 ml) and Na2CO3 solution (1.2 ml, 7.5% w/v) in a test tube and incubated for 30 min in the dark at room temperature. Afterward, the absorbance was read at 765 nm against the blank. The concentration of total phenolics was calculated and expressed as gallic acid equivalent (GAE) in mg/g sample.
2.5.2 Quantification of tannins content
The method reported by Amorim et al. (2008) was adopted to determine the tannins content of the samples. An aliquot (0.1 ml) of the sample extract was mixed with distilled water (7.5 ml), Folin-Denis reagent (0.5 ml), 35% Na2CO3 solution (1 ml), and diluted to 10 ml with distilled water. The mixture was vortexed, incubated for a period of 30 min at room temperature, and the absorbance reading was taken at 760 nm against a blank. Subsequently, the concentration of tannins was calculated and expressed as mg tannic acid equivalent/g (TAE mg/g) sample.
2.5.3 Quantification of total flavonoids content
The aluminum chloride method reported by Kale et al. (2010) was adopted to quantify the total flavonoids content of the samples. Briefly, sample extract (0.5 ml) was mixed with methanol (1.5 ml), 10% aluminum chloride solution (0.1 ml), 1 M potassium acetate solution (0.1 ml) and distilled water (2.8 ml) in a test tube. The mixture was vortexed, incubated for a period of 30 min at room temperature, following which the absorbance reading was taken at 514 nm. Total flavonoids concentration of the sample was expressed as mg quercetin equivalent/g (QE mg/g) sample.
2.6 In vitro antioxidant activity assays
2.6.1 Determination of 1, 1-diphenyl-2-picrylhydrazyl free-radical (DPPH•)-scavenging ability of flour samples
The method of Cervato et al. (2000) was adopted to quantify the DPPH• scavenging ability of the sample extract, with a slight modification. Briefly, 1 ml of appropriate dilution of the extract and 3 ml of methanolic solution of DPPH radicals (60 μM; 0.0118 g of DPPH• dissolved in 500 ml of methanol) were mixed in test tubes. The mixture was incubated in the dark at room temperature for 30 min, before the absorbance was read at 517 nm on a spectrophotometer (Jenway, 6405 UV/Vis, United Kingdom). A reference test, comprising 1 ml of methanol mixed with 3 ml of DPPH radical solution, was included in the assay. The percentage inhibition (% Inh.) of DPPH• by the test sample was calculated using the following equation:
%Inh. = [(Abs517reference−Abs517sample) ÷ Abs517reference] × 100; where Abs517reference is the absorbance reading of the reference, and Abs517sample is the absorbance reading of the sample.
The SC50, which stands for the extract’s concentration that scavenged 50% of DPPH radical, was calculated from the extract concentration (mg/ml) versus inhibition (%) plot of each extract.
2.6.2 Determination of 2, 2-azinobis (3-ethyl-benzothiazoline-6-sulfonic acid) radical cation (ABTS+) radical-scavenging ability of flour samples
The ABTS radical-scavenging ability of extracts of the flours was determined following the procedure described by Sellappan and Akoh (2002). In this assay, a mixture of equal volume of 7 mM ABTS aqueous solution and K2S2O8 (2.45 mM) was incubated for 16 h in the dark at room temperature to generate the ABTS cation radical. Thereafter, the absorbance was adjusted at 734 nm to 0.7 ± 0.02 with 95% ethanol. Next, the extract (0.2 ml) was mixed with ABTS+ solution (2.0 ml) and incubated for 15 min, before reading the absorbance at 734 nm. Lastly, the ABTS+-scavenging capacity of the samples was calculated as trolox equivalent antioxidant capacity (TEAC), using a trolox (100–500 µM) calibration curve.
2.6.3 Determination of iron (III) reducing power
The procedure reported by Irondi et al. (2019b) was employed to quantify the iron (III) reducing power of the flour samples. In this assay, an aliquot (2.5 ml) of the flour extract was mixed with 2.5 ml of sodium phosphate buffer (200 mM, pH 6.6) and 2.5 ml of potassium ferricyanide (1%). The mixture was subjected to 20 min of incubation at 50°C; following which 2.5 ml of trichloroacetic acid solution (10%) was added, and the mixture was divided into 2.5 ml aliquots in separate test tubes. Next, 2.5 ml of distilled water and 1 ml of ferric chloride solution (0.1%) were sequentially added to the content of each test tube, and the absorbance reading was taken at 700 nm. The iron (III) reducing power was then calculated using a gallic acid (0–10 mg gallic acid/mL) calibration curve.
2.7 In vitro starch-hydrolyzing enzyme inhibition assays
2.7.1 Alpha-glucosidase inhibition assay
The protocol described by Kim et al. (2005) was adopted to determine the inhibitory effect of the flour samples on alpha-glucosidase (EC 3.2.1.20), using para-nitrophenylglucopyranoside (PNPG) as the substrate. In brief, 50 μL of α-glucosidase (five units) was pre-incubated with 50 μL of the flour extract for a period of 10 min at 37°C. Hydrolytic reaction was then initiated by the addition of PNPG (3 mmol/L) dissolved in phosphate buffer (20 mmol/L, pH 6.9). After 20 min of hydrolysis at 37°C, the hydrolytic reaction was terminated by adding 0.1 mol/L Na2CO3 (2 ml). The absorbance reading of the yellow p-nitrophenol released from PNPG hydrolysis was taken at 400 nm. The percentage inhibition of α-glucosidase activity was calculated as follows:
%Inhibition = (Abs400reference−Abs400sample) × 100/Abs400reference; where Abs400reference is the absorbance reading of the reference, and Abs400sample is the absorbance reading of the sample.
2.7.2 Alpha-amylase inhibition assay
Assay for α-amylase inhibition was performed by adopting the procedure previously reported by Kwon et al. (2008), using α-amylase (EC 3.2.1.1) from porcine pancreas and soluble starch (substrate). Different dilutions of the flour extracts, amounting to 500 μL, and 500 μL of sodium phosphate buffer (0.02 M, pH 6.9, with 0.006 M NaCl), containing α-amylase solution (0.5 mg/ml), were incubated at 37°C for a period of 10 min. This was followed by the addition of 500 μL of starch solution (1%) in 0.02 M sodium phosphate buffer. Next, the reaction mixture was subjected to incubation at 37°C for a period of 15 min, following which the hydrolytic reaction was terminated by adding 1.0 ml of DNSA colour reagent (1% 3, 5-dinitrosalicylic acid and 12% sodium potassium tartrate in 0.4 M NaOH). The reaction mixture was subjected to 5 min of incubation in a boiling water bath, cooled to room temperature, and diluted with distilled water (10 ml). The absorbance reading was taken at 540 nm, following which the percentage inhibition of α-amylase was calculated as follows:
%Inhibition= (Abs540reference−Abs540sample) × 100/Abs540reference; where Abs540reference is the absorbance reading of the reference, and Abs540sample is the absorbance reading of the sample.
2.8 Sensory evaluation of bread
Sensory (colour, flavour, taste, chewiness and overall acceptability) evaluation was carried out on the freshly baked gluten-free and control breads samples. The ethical clearance (MOH/KS/EU/777/410) to conduct the sensory evaluation was obtained from the Ministry of Health in Ilorin, Kwara State. The method previously reported by Ranasalva and Visvanathan (2014) was adopted to perform the sensory evaluation with a slight modification. A total of twenty-five students of Kwara State University, within the age range of 18–25 years, evaluated the bread samples based on a nine-point scale, using a hedonic questionnaire.
2.9 Statistical analysis of data
The results of replicated experiments (triplicate) were presented as mean ± standard deviation and subjected to one-way analysis of variance using SPSS software (21st version). Duncan’s multiple range test was also carried out to compare the means at 95% confidence level (Elemosho et al., 2020).
3 Results and discussion
3.1 Gluten, amylose and amylopectin levels of the flour samples
Table 1 presents the gluten, amylose and amylopectin contents of the flour samples. As expected, gluten (14.53%) was present in the white wheat flour (WWF), but was not detected in the flours of whole pearl millet (PMF), sweet detar (SDF), the sodium carboxymethyl cellulose (SCMC) and their blends. The absence of gluten in these flours is an indication that they may be suitable for the preparation of gluten-free foods, targeting celiac disease patients, and reducing the risk of developing complications in the celiac disease patients (See et al., 2015). The gluten content of the WWF was the same as we previously reported (Irondi et al., 2021).
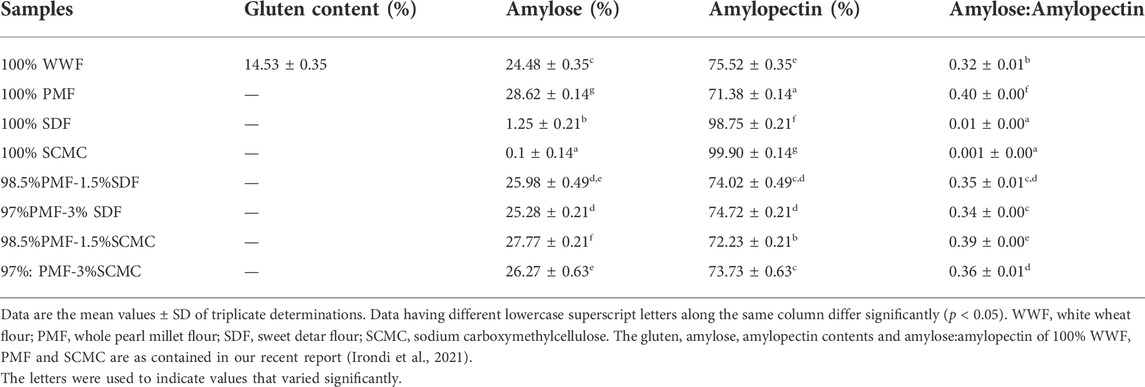
TABLE 1. Gluten, amylose and amylopectin contents of flour samples.
Among the samples, 100% SDF and SCMC had the least and the highest levels (p < 0.05) of amylose and amylopectin, respectively, relative to the 100% WWF and 100% PMF. However, 100% WWF had a significantly lower (p < 0.05) amylose and a higher amylopectin contents than the 100% PMF. Further, the amylose contents of PMF-SDF and PMF-SCMC blends decreased significantly (p < 0.05), while their amylopectin levels increased as the proportion of SDF and SCMC increased. This notwithstanding, the amylose content of the 100% WWF was lower and its amylopectin content was higher than those of PMF-SDF and PMF-SCMC blends. The amylose-amylopectin ratios of the flours were in the order of PMF (0.42) > 98.5%PMF-1.5%SCMC (0.38) > 97%PMF-3%SCMS (0.36) > 98.5%PMF-1.5%SDF (0.35) > 97%PMF-3%SDF (0.34) > WWF (0.32) > 100% SDF (0.01) > 100% SCMC (0.001). Thus, in agreement with previous reports, the amylopectin contents of the flours were higher than their amylose contents, confirming that amylopectin is the predominant component of most starches (Yotsawimonwat et al., 2008; Irondi et al., 2019b). The relative proportion of amylose and amylopectin in flours is known to influence their functional properties, upon which their food and industrial applications depend. It also has effect on the blood glucose response (glycaemic index) of the flours, with a lower amylose and a higher amylopectin level resulting in a higher blood glucose response. This effect is attributed to the propensity of α-amylase to digest amylopectin at a faster rate than amylose in the human duodenum (Shanita, et al., 2011; Irondi et al., 2021). Therefore, the WWF, with a higher amylopectin content compared to the PMF and its blends with SDF and SCMC, may have higher digestibility and consequently, higher glycaemic index in agreement with the report of Riley et al. (2006).
3.2 Functional properties of flour samples
The functional properties of the flours, including solubility index, swelling power, water absorption capacity and bulk density are presented in Table 2. Among the individual flours (that is, 100% WWF, 100%PMF and 100% SDF) and 100% SCMC, the least (p < 0.05) solubility index was recorded in the 100% SCMC, followed by 100% SDF. Generally, the solubility index of the PMF-SDF and PMF-SCMC blends reduced significantly (p < 0.05) as their proportions of SDF and SCMC increased, except for the 98.5%PMF-1.5%SDF blend. The swelling power and water absorption capacity of SCMC, followed by those of SDF, were significantly higher (p < 0.05) than those of 100% WWF and 100% PMF. This agrees with previous reports that hydrocolloids have a strong water-binding capacity (Sun et al., 2022).
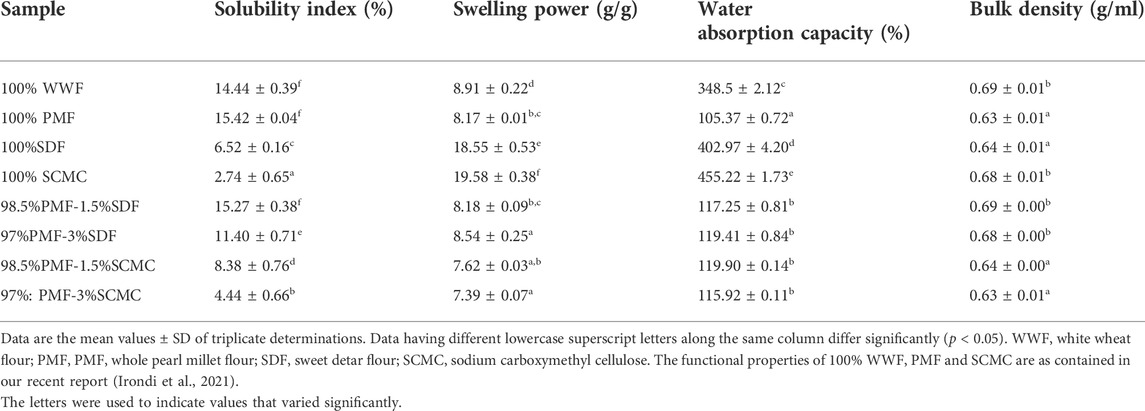
TABLE 2. Functional properties of the flour samples.
Relative to the 100% PMF, the water absorption capacity of the PMF-SDF and PMF-SCMC blends increased significantly (p < 0.05) as the proportions of SDF and SCMC increased in the blends. This is consistent with previous reports that confirmed a positive relationship between increased hydrocolloid content and water absorption (Zannini et al., 2014; Sun et al., 2022).
There was also a significant increase (p < 0.05) in the swelling power of the PMF-SDF at 3% level of SDF addition. Conversely, the solubility index of the blends reduced significantly (p < 0.05) with an increased proportion of SDF and SCMC, relative to the PMF. Further, the water absorption capacity of the 100% WWF in this study was lower than the water absorption capacity range (140%–142%) reported for 100% wheat flour by Suresh et al. (2015).
Water absorption capacity is an important functional property required in dough handling (Nwakaudu et al., 2017), as the dough is expected to absorb water without the dissolution of its proteins, so as to attain body thickening and viscosity (Seena and Sridhar, 2005). Hence, a high water absorption capacity ensures product cohesiveness that is desirable in the development of ready-to-eat foods (Ogunlakin et al., 2012). On the other hand, bulk density is indicative of a product’s porosity, and the flour’s wettability. This influences packaging design and could be applied in determining the appropriate type of packaging material (Iwe and Onalope, 2001; Akubor, 2007). A high bulk density is desirable for a greater ease of dispersibility and reduction of paste thickness (Udensi and Eke, 2000), whereas a low bulk density of flour is a good physical attribute for its stability during distribution (transportation) and storability (Agunbiade and Sanni, 2001).
3.3 Pasting properties of flour samples
The pasting properties (peak, trough, final, set back and breakdown viscosities, peak time and pasting temperature), of which the peak and final viscosities are of great importance to the food industries (Irondi et al., 2018), are presented in Table 3. Among the samples, 100% SDF had the highest (p < 0.05) final viscosity (1402.67 RVU), while 100% SCMC had the highest peak viscosity (900.63 RVU), confirming their visco-elastic qualities as hydrocolloids. These higher peak and final viscosities of SDF and SCMC may partly be attributed to their low amylose content. Flours having a low concentration of amylose swelled easily, and displayed increased viscosity during heating at a lower temperature, as a result of a weaker binding force in the starch granule (Hoover et al., 1996). Thus, SDF and SCMC may be suitable for products in which high gelling strength and elasticity are required (Uzomah and Odusanya, 2011). Expectedly, relative to the 100% PMF, the peak and final viscosities of the PMF-SDF and PMF-SCMS blends (except the 98.5%PMF-1.5%SDF blend) increased significantly (p < 0.05) as the proportions of SDF and SCMC increased.
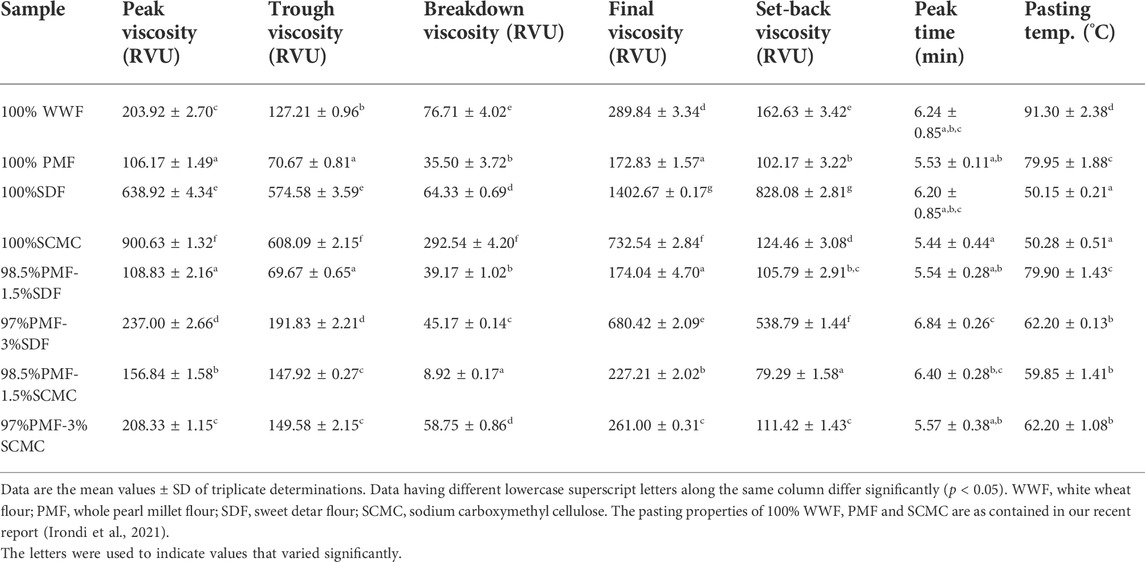
TABLE 3. Pasting properties of the flour samples.
The pasting temperatures of 100% SDF and 100% SMC (50.15 and 50.28°C, respectively) were comparable (p > 0.05); but both were significantly lower (p < 0.05) than those of 100% WWF, 100% PMF, and the blends. Furthermore, in comparison with the 100% PMF and 100% WWF, the pasting temperatures of the PMF-SDF and PMF-SCMS blends (except the 98.5%PMF-1.5%SDF blend) decreased significantly (p < 0.05) with increased proportions of SDF and SCMC. This decrease in pasting temperature gives the blends additional technological advantage in food application over the 100% PMF and 100% WWF, since a lower pasting temperature is an indication of a lower cost energy required to cook a given starch/flour sample (Elemosho et al., 2020).
3.4 Polyphenolics contents of flours
Table 4 presents the polyphenolics contents (mg/g) of the flour samples. Total phenolics and tannins contents varied significantly (p < 0.05) among the three individual flour samples (100% WWF, 100% PMF and 100% SDF); with 100% PMF having the highest levels of these phytochemicals, while 100 WWF had the lowest levels. The low levels of polyphenolics recorded in the 100% WWF may be connected with its refining process, which involved the removal of the bran and germ, leaving only the starchy endosperm that is milled into flour (Parenti et al., 2020). It is well-known that the phytochemicals in cereal grains, including wheat, are mainly deposited in their bran (Parenti et al., 2020). Thus, their removal may have contributed to the lower levels of the polyphenolics in the 100% WWF.
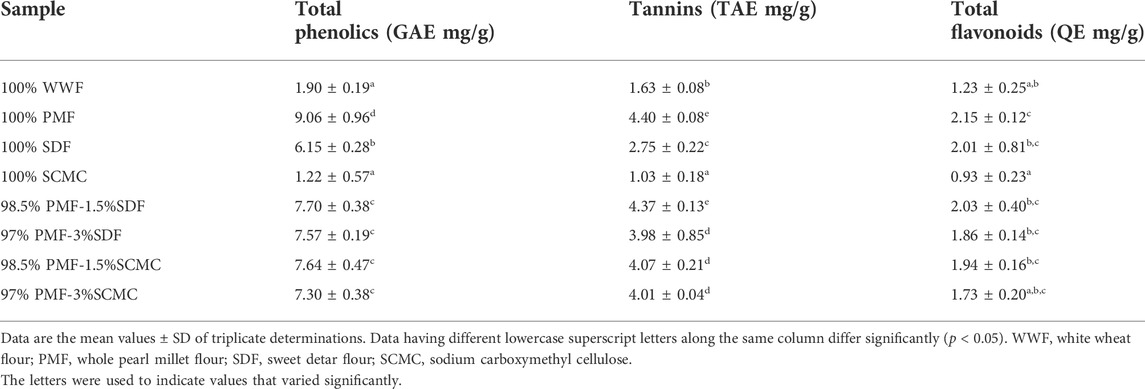
TABLE 4. Polyphenolics contents of flour samples.
Comparatively, the total phenolics (9.06 GAE mg/g) and total flavonoids (2.15 QE mg/g) observed in the 100% PMF in this study are higher than the ranges (total phenolics, 99.75–112.25 mg/100 g; total flavonoid, 62.23–74.05 mg/100 g), while the tannin content (4.40 TAE mg/g) falls within the range (340.00–500.00 mg/100 g) Nakarani et al. (2020) reported in ten different genotypes of finger millet. Similarly, the total phenolics (6.15 GAE mg/g), tannins (2.75 TAE mg/g), and total flavonoids (2.01 QE mg/g) obtained in SDF in this study are higher than the levels (total phenolics, 1.56 ± 0.03 GAE mg/g; tannin, 1.74 ± 0.03 TAE mg/g; and total flavonoid, 0.81 QE mg/g) reported in a previous study (Irondi et al., 2015). These variations could be attributed to differences in the period of sample collection and method of extraction, as well as variations in biotic and abiotic factors that influence the levels of phytochemicals in plants and their bioactivities (Mpofu et al., 2006; Braga et al., 2014).
Polyphenolic compounds are remarkable for their diverse health benefits, such as antioxidant and antidiabetic activities (Sethiya et al., 2014). Aside their health benefits, the antioxidant activity of these polyphenolics compounds help to maintain the nutritional value and prolong the shelf-life of foods, by preventing the oxidative spoilage of some nutrients (for instance, unsaturated fatty acids and vitamins) that are vulnerable to oxidation and retarding the production of some toxic oxidative products (Avila-Roman et al., 2021; Irondi et al., 2021).
3.5 Antioxidant activity of flours
Table 5 contains the antioxidant activity of the flours samples, assayed using ABTS•+, DPPH• scavenging activity, and reducing power tests. In line with the polyphenolics contents, 100% PMF had the most potent antioxidant activity among the flour samples. As earlier stated, the polyphenolics (total phenolics, tannins, and total flavonoids) quantified in the flours in this study are prominent for their antioxidant activity, which they exert through various mechanisms. These mechanisms include the prevention of chain initiation and continued hydrogen abstraction, scavenging of free radicals, decomposition of peroxides, binding of transition metal ion catalysts, and reducing capacity (Arslan and Celik, 2013). The ferric reducing power, ABTS•+ and DPPH• scavenging capacities of the PMF-SDF blends decreased significantly (p < 0.05) in the flour samples, as the proportion of SDF in the blends increased. This notwithstanding, the blends had stronger (p < 0.05) reducing power, ABTS•+ and DPPH• scavenging than the 100% WWF. Ascorbic acid, a reference antioxidant, had a more potent ferric reducing power, ABTS•+ and DPPH• scavenging than the PMF and the blends. Among the flour blends (98.5%PMF-1.5%SDF, 97%PMF-3%SDF, 98.5%PMF-1.5% SCMC and 97%PMF:3% SCMC), 98.5%PMF-1.5%SDF had the strongest ABTS•+ scavenging ability (248.34 ± 0.54 TE μm/g). The ability of the flour blends to scavenge free radicals suggests that products made from them (such as the bread in this study) may be useful in protecting the body from free radicals-induced oxidative damage to cellular bio-molecules (proteins, nucleic acids, carbohydrates and lipids) and oxidative stress-associated chronic diseases (Ward et al., 2008; Takemoto et al., 2009; Irondi et al., 2018).
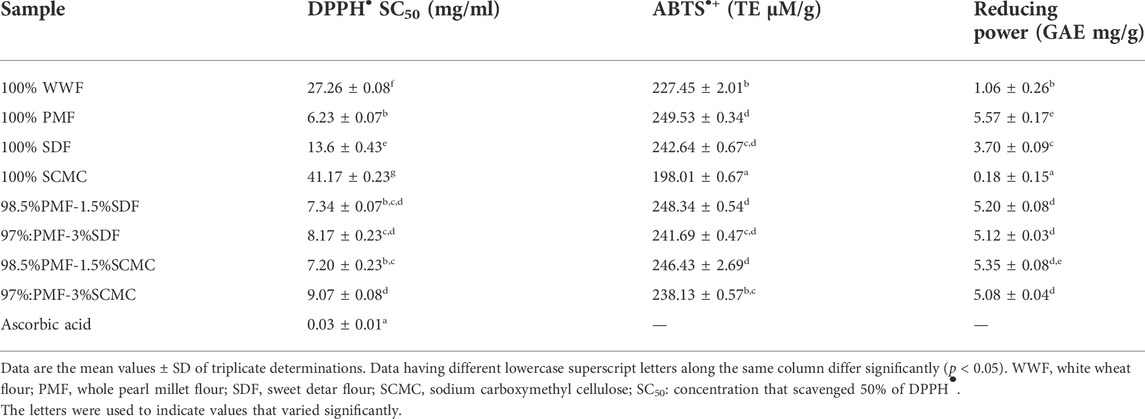
TABLE 5. Antioxidant activities of flour samples.
3.6 Starch-hydrolyzing enzymes inhibitory activity of the flours
The concentrations of extracts of the flours that caused 50% inhibition (IC50 μg/ml) of starch-hydrolyzing enzymes (α-amylase and α-glucosidase) are presented in Figures 2, 3. Alpha-amylase and α-glucosidase catalyze dietary carbohydrates digestion into simple sugars; thus, postprandial blood glucose concentration depends partly on their activities (Sim et al., 2010; Irondi et al., 2019a). Alpha-amylase is found in the saliva and pancreatic juice, where it cleaves the α-(1→4) bond of starch, to release dextrin, maltose, and maltotriose (Tucci et al., 2010). Subsequently, the glycosidic bonds of these oligosaccharides are hydrolyzed further by α-glucosidase found in the ciliary membrane of small intestine, thereby producing glucose units that are then absorbed (Satoh et al., 2013).
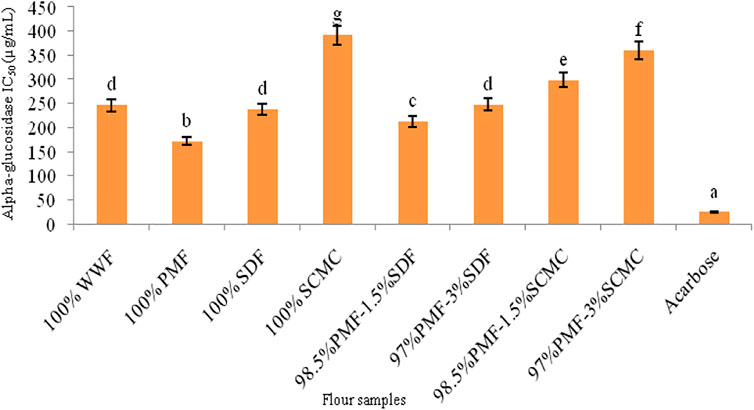
FIGURE 3. Alpha-glucosidase IC50 of flour samples. Bars with different letters vary significantly (p < 0.05). WWF, white wheat flour; PMF, whole pearl millet flour; SDF, sweet detar flour; SCMC, sodium carboxymethyl cellulose.
Among the flours, the 100% PMF had the strongest (p < 0.05) inhibitory effect on the activities of α-amylase and α-glucosidase, although it was not as effective as acarbose, a standard inhibitor of these two enzymes (Figures 2, 3). The stronger inhibitory activity of the 100% PMF over the other flours may be a reflection of its higher level of polyphenolics (Table 4), which are known to inhibit α-amylase and α-glucosidase (Ribeiro et al., 2019). Phenolic compounds are well-known to display their antidiabetic activity by decreasing the rate of starch digestion in vitro and in vivo (Amoako and Awika, 2016), through the inhibition of starch-hydrolyzing enzymes, thereby reducing glycemic response in vivo (Hanhineva et al., 2010). Mechanism-wise, phenolic compounds inhibit digestives enzymes (α-amylase and α-glucosidase, in this case) by protein denaturation, due to their high affinity for proteins, mediated via hydrogen and hydrophobic bonding (Villiger et al., 2015; Irondi et al., 2021).
The PMF-SDF blends had a stronger (p < 0.05) α-amylase and α-glucosidase inhibitory capacity than the PMF-SCMC blends. This suggests that the incorporation of SDF as a natural source of hydrocolloid may have a comparative advantage over SCMC in terms of producing a gluten-free bread with an anti-hyperglycaemic property, targeting nutrition-related non-communicable diseases such as obesity and type 2 diabetes mellitus. This is plausible, since α-amylase and α-glucosidase inhibition has a direct relationship with a reduced blood glucose response (Butterworth et al., 2022).
3.7 Sensory qualities of the bread samples
The sensory qualities (colour, flavour, taste, chewiness, odour and overall acceptability) of PMF-SDF breads are presented in Table 6. Sensory qualities indicate consumers’ perception of a product. From the results, the 100% WWF bread sample was rated better (p < 0.05) than the 100% PMF, PMF-SDF and PMF-SCMC bread samples. The consumers’ preference of the 100% WWF bread over the 100% PMF bread and those of the blends confirms the already known fact that the use of refined flour represents the standard reference in the technology of bread-making, ensuring bread of superior quality sensory attributes that are well-appreciated by consumers (Parenti et al., 2020). As previous studies indicated, the presence of phytochemicals, such as polyphenolic compounds, which are highly deposited in the bran of the cereal kernel, give unrefined breads a bitter taste (Heiniö, 2009). This poor sensory quality has been noted as one of the major setbacks militating against the increased consumption of the unrefined cereal bread (Parenti et al., 2020). However, considering the starch-digesting enzymes inhibitory property of the 100% PMF and those of the blends, a bioactivity that suggests their potential anti-hyperglycaemic property, consumers may want to accept the sensory quality loss in their breads, since it has an accompanying health benefit (Arp et al., 2020). Furthermore, as Parenti et al. (2020) opined, despite consumers’ preference for refined flour bread, their demand for unrefined flour breads has increased greatly due to the health benefits associated with them. Further, the sensory qualities of the PMF-SDF and PMF-SCMC breads were comparable (p > 0.05), suggesting that SDF could be a good natural hydrocolloids substitute for SCMC in the development of whole pearl millet flour-based gluten-free bread.
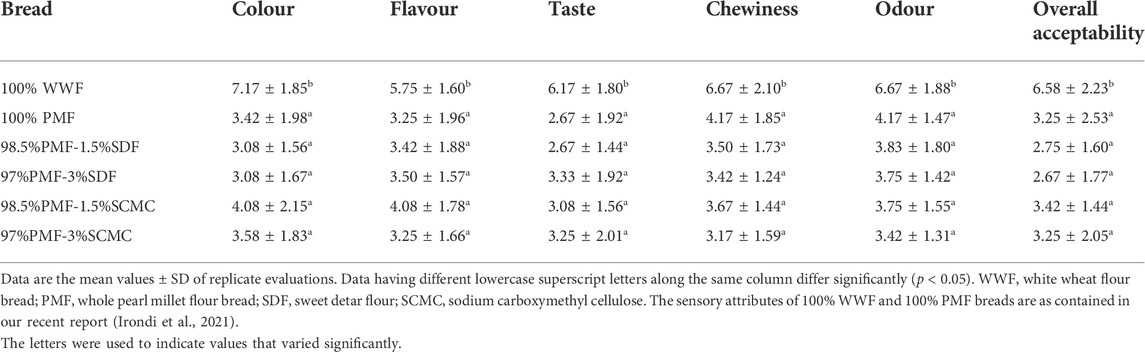
TABLE 6. Sensory attributes of the bread samples.
4 Conclusion
The addition of sweet detar flour (SDF, a natural hydrocolloids-rich source) at 1.5 and 3% levels to whole pearl millet flour (PMF) resulted in a decrease in the amylose level and solubility index of the PMF-SDF blends. However, it led to an increase in the water absorption capacity, peak and final viscosities of the blends. The polyphenolics concentrations, antioxidant and starch-digesting enzymes (α-amylase and α-glucosidase) inhibitory activities of the PMF-SDF blends were higher than those of the white wheat flour (WWF). Further, the α-amylase and α-glucosidase inhibitory activities of 98.5% PMF-1.5% SDF blend were stronger than those of the PMF-SCMC blends. Also, the sensory qualities of the PMF-SDF and PMF-SCMC breads were comparable. Therefore, SDF could be a good substitute for SCMC in the development of PMF-based gluten-free bread, with an enhanced starch-digesting enzymes inhibitory property, targeting celiac disease and type 2 diabetic patients.
Data availability statement
The original contributions presented in the study are included in the article/Supplementary Material, further inquiries can be directed to the corresponding authors.
Ethics statement
The studies involving human participants were reviewed and approved by Kwara State Ministry of Health, Ilorin; Approval number: MOH/KS/EU/777/410. The patients/participants provided their written informed consent to participate in this study.
Author contributions
EI conceptualized the study, supervised the work, and edited the final draft. YI analyzed the samples, collated and analyzed the data, and wrote the original draft. EA supervised the work and edited the final manuscript.
Acknowledgments
The authors acknowledge the Department of Biochemistry, Kwara State University, Malete, for providing the laboratory facilities and some reagents used for the analyses carried out in this study.
Conflict of interest
The authors declare that the research was conducted in the absence of any commercial or financial relationships that could be construed as a potential conflict of interest.
Publisher’s note
All claims expressed in this article are solely those of the authors and do not necessarily represent those of their affiliated organizations, or those of the publisher, the editors and the reviewers. Any product that may be evaluated in this article, or claim that may be made by its manufacturer, is not guaranteed or endorsed by the publisher.
References
Adedeji, A. A., Alakali, J., Adewale, P. O., and Ngadi, M. O. (2012). Thermophysical properties of Detarium microcarpum seed flour. LWT - Food Sci. Technol. 47, 233–237. doi:10.1016/j.lwt.2012.01.010
Agunbiade, S. O., and Sanni, M. O. (2001). “The effect of ambient storage of cassava tubers on starch quality Root Crops. The small processor and development of Local Food Industries for market economy,” Proceedings of the Eight Triennial Symposium of the International Society for Tropical Root Crops, African Branch (ISTRC-AB) (Nigeria: International Institute of Tropical Agriculture Ibadan), 189–194.
Akubor, P. I. (2007). Chemical, functional and cookie baking properties of soybean/maize flour blends. J. Food Sci. Technol. 44 (6), 619–622.
Amoako, D., and Awika, J. M. (2016). Polyphenol interaction with food carbohydrates and consequences on availability of dietary glucose. Curr. Opin. Food Sci. 8, 14–18. doi:10.1016/j.cofs.2016.01.010
Amorim, E. L. C., Nascimento, J. E., Monteiro, J. M., Sobrinho, P., Araujo, T. A. S., and Albuquerque, U. A. P. (2008). A simple and accurate procedure for the determination of tannins and flavonoid levels and some applications in eth‐nobotany and ethnopharmacology. Funct. Ecosyst. Commun. 2, 88–94.
Arp, C. G., Correa, M. J., and Ferrero, C. (2020). Improving quality: Modified celluloses applied to bread dough with high level of resistant starch. Food Hydrocoll. 112. doi:10.1016/j.foodhyd.2020.106302
Arslan, I., and Çelik, A. (2013). Saponin-rich fractions (SRPs) from Soapwort show antioxidant and hemolytic activity. APCBEE Procedia 7, 103–108. doi:10.1016/j.apcbee.2013.08.019
Avila-Roman, J., Soliz-Rueda, J. R., Bravo, F. I., Aragones, G., Suarez, M., Arola-Arnal, A., et al. (2021). Phenolic compounds and biological rhythms: Who takes the lead? Trends Food Sci. Technol. 113, 77–85. doi:10.1016/j.tifs.2021.04.050
Braga, T. V., Dores, R. G., Ramos, C. S., Evangelista, F. C. G., Tinoco, L. M., Varotti, F., et al. (2014). Antioxidant, antibacterial and antitumor activity of ethanolic extract of the Psidium guajava leaves. Am. J. Plant Sci. 5 (23), 3492–3500. doi:10.4236/ajps.2014.523365
Butterworth, P. J., Bajka, B. H., Edwards, C. H., Warren, F. J., and Ellis, P. R. (2022). Enzyme kinetic approach for mechanistic insight and predictions of in vivo starch digestibility and the glycaemic index of foods. Trends Food Sci. Technol. 120, 254–264. doi:10.1016/j.tifs.2021.11.015
Cervato, G., Carabell, M., Gervasio, S., Cittera, A., Cazzola, R., and Cestaro, B. (2000). Antioxidant properties of oregano (Origanum vulgare) leaf extracts. J. Food Biochem. 24 (6), 453–465. doi:10.1111/j.1745-4514.2000.tb00715.x
Chan, E. W. C., Lim, Y. Y., and Chew, Y. L. (2007). Antioxidant activity of Camellia sinensis leaves and tea from a lowland plantation in Malaysia. Food Chem. x. 102 (4), 1214–1222. doi:10.1016/j.foodchem.2006.07.009
Comettant-Rabanal, R., Carvalho, C. W. P., Ascheri, J. L. R., Chávez, D. W. H., and Germani, R. (2021). Extruded whole grain flours and sprout millet as functional ingredients for gluten-free bread. LWT – Food Sci. Technol. 150, 112042. doi:10.1016/j.lwt.2021.112042
Deffenbaugh, L. B., and Walker, C. E. (1989). Comparison of starch pasting properties in the brabender Viscoamylograph and the Rapid Visco-Analyzer. Cereal Chem. 66, 499.
Devi, P. B., Vijayabharathi, R., Sathyabama, S., Malleshi, N. G., and Priyadarisini, V. B. (2011). Health benefits of finger millet (Eleusine coracana L.) polyphenols and dietary fiber: A review. J. Food Sci. Technol. 51 (6), 1021–1040. doi:10.1007/s13197-011-0584-9
Dongyu, Q. (2022). New scenarios on global food security based on Russia-Ukraine conflict. Food and Agriculture Organization of the United Nations. https://www.fao.org/director-general/news/news-article/en/c/1476480/.
Elemosho, A. O., Irondi, E. A., Alamu, E. O., Ajani, E. O., Maziya-Dixon, B., and Menkir, A. (2020). Characterization of Striga-resistant yellow-orange maize hybrids for bioactive, carbohydrate, and pasting properties. Front. Sustain. Food Syst. 4, 585865. doi:10.3389/fsufs.2020.585865
Filipcev, B., Pojic, M., Simurina, O., Misan, A., and Mandic, A. (2021). Psyllium as an improver in gluten-free breads: Effect on volume, crumb texture, moisture binding and staling kinetics. LWT -Food Sci. Technol. 151, 112156. doi:10.1016/j.lwt.2021.112156
Hanhineva, K., Törrönen, R., Bondia-Pons, I., Pekkinen, J., Kolehmainen, M., Mykkänen, H., et al. (2010). Impact of dietary polyphenols on carbohydrate metabolism. Int. J. Mol. Sci. 11 (4), 1365–1402. doi:10.3390/ijms11041365
Hauner, H., Bechthold, A., Boeing, H., Bronstrup, A., Buyken, A., Leschik-bonnet, E., et al. (2012). Evidence-based guideline of the German nutrition society: Carbohydrate intake and prevention of nutrition-related diseases. Ann. Nutr. Metab. 60, 1–58. doi:10.1159/000335326
Heiniö, R. L. (2009). Comparison of sensory characteristics of refined and whole grain foods. Cereal Foods World 54, 12
Hoover, R., Sailaya, Y., and Sasulski, F. W. (1996). Characterization of starches from wild and long grain Brown rice. Food Res. Int. 29, 99–107. doi:10.1016/0963-9969(96)00016-6
Igwenyi, I. O., and Akubugwo, E. I. (2010). Analysis of four seeds used as soup thickeners in the South Eastern part of Nigeria. Int. Conf. Chem. Chem. Eng., 426–430. doi:10.1109/ICCCENG.2010.5560398
Irondi, E. A., Agboola, S. O., and Boligon, A. A. (2018). Inhibitory effects of tropical almond leaf extract on xanthine oxidase, pancreatic lipase, and angiotensin I-converting enzyme, in vitro. J. Food Biochem. 42 (4), e12481. doi:10.1111/jfbc.12481
Irondi, E. A., Adegok, B. M., Effion, E. S., Oyewo, S. O., Alamu, E. O., and Boligon, A. A. (2019a). Enzymes inhibitory property, antioxidant activity and phenolics profile of raw and roasted red sorghum grains in vitro. Food Sci. Hum. Wellness 8 (2), 142–148. doi:10.1016/j.fshw.2019.03.012
Irondi, E. A., Awoyale, W., Oboh, G., and Boligon, A. A. (2017). Effect of mango kernel flour addition on the phenolics profile, antioxidant activity and pasting properties of wheat flour. Food Meas. 11 (4), 2202–2210. doi:10.1007/s11694-017-9605-3
Irondi, E. A., Awoyale, W., Oboh, G., and Boligon, A. A. (2019b). Phenolics composition, antioxidant and pasting properties of high quality cassava flour substituted with Brachystegia eurycoma seed flour. Ann. UDJG. FoodTechnology. 43 (1), 9–23. doi:10.35219/foodtechnology.2019.1.01
Irondi, E. A., Ganiyu, O., and Afolabi, A. A. (2015). Methanol extracts of Brachystegia eurycoma and Detarium microcarpum seeds flours inhibit some key enzymes linked to the pathology and complications of type 2 diabetes in vitro. Food Sci. Hum. Wellness 4 (4), 162–168. doi:10.1016/j.fshw.2015.08.002
Irondi, E. A., Imam, Y. T., and Ajani, E. O. (2021). Effects of brachystegia eurycoma flour addition on the physicochemical properties of whole millet flour and the sensory attributes of its gluten-free bread. Acta Univ. cibiniensis. Ser. E Food Technol. 25 (1), 43–52. doi:10.2478/aucft-2021-0004
Iwe, M. O., and Onalope, O. O. (2001). Effect of extruded full-fat soy flour into sweet potato flour on functional properties of the mixture. J. Sustain Agric. Environ. 3, 109–117.
Kale, A., Gaikwad, S., Mundhe, K., Deshpande, N., and Salvekar, J. (2010). Quantification of phenolics and flavonoids by spectrophotometer from. Juglans regia. Int. J. Pharm. Biol. Sci. 1 (3), 1
Kim, Y. M., Jeong, Y. K., Wang, M. H., Lee, Y. H., and Rhee, H. I. (2005). Inhibitory effect of pine extract on alpha-glucosidase activity and postprandial hyperglycemia. Nutrition 21 (6), 756–761. doi:10.1016/j.nut.2004.10.014
Kumar, A., Kumari, P., and Kumar, M. (2022). “Role of millets in disease prevention and health promotion,” in Functional foods and nutraceuticals in metabolic and non-communicable diseases (Academic Press), 341–357. doi:10.1016/B978-0-12-819815-5.00034-3
Kwon, Y. I., Apostolidis, E., and Shetty, K. (2008). Inhibitory potential of wine and tea against Α-amylase and Α-glucosidase for management of hyperglycemia linked to type 2 diabetes. J. Food Biochem. 32 (1), 15–31. doi:10.1111/j.1745-4514.2007.00165.x
Lamacchia, C., Camarca, A., Picascia, S., Di Luccia, A., and Gianfrani, C. (2014). Cereal-based gluten-free food: How to reconcile nutritional and technological properties of wheat proteins with safety for celiac disease patients. Nutrients 6 (2), 575–590. doi:10.3390/nu6020575
Maziya-Dixon, B., Adebowale, A. A., Onabanjo, O. O., and Dixon, A. G. O. (2005). Effect of variety and drying methods on physico-chemical properties of high quality cassava flour from yellow cassava roots. Afr. Crop Sci. Conf. Proc. 7, 635
Mbaeyi-Nwaoha, I. E., Nnagbo, C. L., Obodoechi, C. M., Nweze, B. C., and Okonkw, T. M. (2017). Production and evaluation of yoghurt contained local stabilizers - Brachystegia eurycoma (‘Achi’) and Detarium microcarpuim (‘Ofo’). Int. J. Biotechnol. Food Sci. 5 (2), 23
Mir, S. A., Shah, M. A., Naik, H. R., and Zargar, I. A. (2016). Influence of hydrocolloids on dough handling and technological properties of gluten-free breads. Trends Food Sci. Technol. 51, 49–57. doi:10.1016/j.tifs.2016.03.005
Mpofu, A., Sapirstein, H. D., and Beta, T. (2006). Genotype and environmental variation in phenolic content, phenolic acid composition, and antioxidant activity of hard spring wheat. J. Agric. Food Chem. 54, 1265–1270.
Nakarani, U. M., Singh, D., Suthar, K. P., Karmakar, N., Faldu, P., and Patil, H. E. (2020). Nutritional and phytochemical profiling of nutracereal finger millet (Eleusine coracanaL.) genotypes. Food Chem. 341, 128271. doi:10.1016/j.foodchem.2020.128271
Nwakaudu, A. A., Nwakaudu, M. S., Owuamanam, C. I., Alagbaoso, S. O., Njoku, N. E., Agunwah, I. M., et al. (2017). Effect of carboxymethylcellulose incorporation on the functional, pasting and sensory properties of water yam (D. alata) flour. Eur. J. Food Sci. Technol. 5 (1), 1
Nwokocha, L. M., and Nwokocha, K. E. (2020). Chemical composition and rheological properties of Detarium microcarpum and Irvingia gabonensis seed flours. Sci. Afr. 10, e00529. doi:10.1016/j.sciaf.2020.e00529
Nwokocha, L. M., and Williams, P. A. (2012). “Evaluating the potential of Nigerian plants as a source of industrial hydrocolloids,” in Gums and stabilisers for the food industry 16, Williams and Phillips, 27–44. doi:10.1039/9781849734554-00027
Ogunlakin, G. O., Oke, M. O., Babarinde, G. O., and Olatunde, D. G. (2012). Effect of drying methods on proximate composition and physico-chemical properties of Cocoyam Flour. Am. J. Food Technol. 7, 245–250. doi:10.3923/ajft.2012.245.250
Ohimain, E. I. (2014). The prospects and challenges of cassava inclusion in wheat bread policy in Nigeria. Int. J. Sci. Technol. Soc. 2 (1), 6–17. doi:10.11648/j.ijsts.20140201.12
Omokhua, G. E., Abbey, W. M., and Olaleye, S. M. (2013). Use of Indigenous technology in processing and utilization of non timber forest product in south-eastern. Niger. J. Agric. Soc. Res. 13 (2), 68
Parenti, O., Guerrini, L., and Zanoni, B. (2020). Techniques and technologies for the breadmaking process with unrefined wheat flours. Trends Food Sci. Technol. 99, 152–166. doi:10.1016/j.tifs.2020.02.034
Pessanha, K. L. F., Menezes, J. P., dos, A., Ferreira, M. V. da S., Takeiti, C. Y., and Carvalho, C. W. P. (2021). Impact of whole millet extruded flour on the physicochemical properties and antihyperglycemic activity of gluten free bread. LWT - Food Sci. Technol. 147, 111495. doi:10.1016/j.lwt.2021.111495
Ranasalva, N., and Visvanathan, R. (2014). Development of bread from fermented pearl millet flour. J. Food Process. Technol. 5 (5), 327. doi:10.4172/2157-7110.1000327
Ribeiro, P. V. M., Andrade, P. A., Hermsdorff, H. H. M., Santos, C. A., Cotta, R. M. M., Estanislau, J. A. S. G., et al. (2019). Dietary non-nutrients in the prevention of non-communicable diseases: Potentially related mechanisms. Nutrition 66, 22–28. doi:10.1016/j.nut.2019.03.016
Riley, C. K., Wheatley, A. O., and Asemota, H. N. (2006). Isolation and characterization of starches from eight Dioscorea alata cultivars grown in Jamaica. Afr. J. Biotechnol. 5, 1528–1536.
Saleh, A. S. M., Zhang, J., Chen, J., and Shen, Q. (2013). Millet grains: Nutritional quality, processing, and potential health benefits. Compr. Rev. Food Sci. Food Saf. 12 (3), 281–295. doi:10.1111/1541-4337.12012
Sathe, S. K., and Salunkhe, D. K. (1981). Functional properties of great Northern bean (Phaseolus vulgaris). J. Food Sci. 46, 71–81. doi:10.1111/j.1365-2621.1981.tb14533.x
Satoh, T., Inoue, A., and Ojima, T. (2013). Characterization of an α-glucosidase, HdAgl, from the digestive fluid of Haliotis discus hannai. Comp. Biochem. Physiol. B Biochem. Mol. Biol. 166, 15–22. doi:10.1016/j.cbpb.2013.06.002
See, J. A., Kaukinen, K., Makharia, G. K., Gibson, P. R., and Murray, J. A. (2015). Practical insights into gluten-free diets. Nat. Rev. Gastroenterology Hepatology 12 (10), 580
Seena, S., and Sridhar, K. R. (2005). Physicochemical, functional and cooking properties of under explored legumes, Canavalia of the southwest coast of India. Food Res. Int. 38, 803–814. doi:10.1016/j.foodres.2005.02.007
Sellappan, S., and Akoh, C. C. (2002). Flavonoids and antioxidant capacity of Georgia-grown vidalia onions. J. Agric. Food Chem. 50 (19), 5338–5342. doi:10.1021/jf020333a
Sethiya, N. K., Trivedi, A., and Mishra, S. (2014). The total antioxidant content and radical scavenging investigation on 17 phytochemical from dietary plant sources used globally as functional food. Biomed. Prev. Nutr. 4, 439–444. doi:10.1016/j.bionut.2014.03.007
Shabir, A. M., Manzoor, A. S., Haroon, R. N., and Imtiyaz, A. Z. (2016). Influence of hydrocolloids on dough handling and technological properties of gluten-free breads. Trends Food Sci. Technol. 51 (3), 49–57. doi:10.1016/j.tifs.2016.03.005
Shanita, S. N., Hasnah, H., and Khoo, C. W. (2011). Amylose and amylopectin in selected Malaysian foods and its relationship to glycemic index. Sains Malays. 40, 865
Sim, L., Willemsma, C., Mohan, S., Naim, H. Y., Pinto, B. M., and Rose, D. R. (2010). Structural basis for substrate selectivity in human maltase-glucoamylase and sucrase- isomaltase N- terminal domains. J. Biol. Chem. 285 (23), 17763–17770. doi:10.1074/jbc.M109.078980
Singh, M., and Naithani, M. (2014). Phytochemical estimation and antioxidant activity of seed extract of millets traditionally consumed by common people of uttrakhand, India. Int. J. Biol. Pharm. Allied Sci. 3 (10), 2389
Singleton, V. L., Orthofer, R., and Lamuela-Raventos, R. M. (1999). Analysis of total phenols and other oxidation substrates and antioxidants by means of Folin–Ciocalteau’s reagent. Methods Enzym. 299, 152.
Sun, X., Pei, F., and Fang, Y. (2022). The effects of hydrocolloids on the thermo-mechanical, viscoelastic and microstructural properties of whole wheat flour dough. Food Chem. 370, 130976. doi:10.1016/j.foodchem.2021.130976
Suresh, C., Samsher, S., and Durvesh, K. (2015). Evaluation of functional properties of composite flours and sensorial attributes of composite flour biscuits. J. Food Sci. Technol. 52 (6), 3681–3688. doi:10.1007/s13197-014-1427-2
Takemoto, K., Tanaka, M., Iwata, H., Nishihara, R., Ishihara, K., Wang, D. H., et al. (2009). Low catalase activity in blood is associated with the diabetes caused by alloxan. Clin. Chim. Acta. 407 (1-3), 43–46. doi:10.1016/j.cca.2009.06.028
Tucci, S. A., Boyland, E. J., and Halford, J. C. G. (2010). The role of lipid and carbohydrate digestive enzyme inhibitors in the management of obesity: A review of current and emerging therapeutic agents. Diabetes Metab. Syndr. Obes. 3, 125–143. doi:10.2147/dmsott.s7005
Tyl, C., Marti, A., and Ismail, B. P. (2020). Changes in protein structural characteristics upon processing of gluten-free millet pasta. Food Chem. 327, 127052. doi:10.1016/j.foodchem.2020.127052
Udensi, A., and Eke, O. (2000). “Proximate composition and functional properties of flour produced from Mucunacochinensis and Mucunautles,” in Proceedings of the 1st annual conference of the college of agriculture and veterinary medicine (Abia State University), 170–174.
Usurp, E. U., Ugansathy, E. S., and Danni, G. A. (1982). Gluten analysis, manual of chemical methods of food analysis. Lagos: Food and Drugs Administration and Control Laboratory ServicesFederal Ministry of Health, 44. Chapter 6.
Uzomah, A., and Odusanya, O. S. (2011). Mucuna sloanei, Detarium microcarpum and Brachystegia eurycoma seeds: A preliminary study of their starch-hydrocolloids system. Afr. J. Food Sci. 5 (13), 733
Villiger, A., Sala, F., Suter, A., and Butterweck, V. (2015). In vitro inhibitory potential of Cynara scolymus, Silybum marianum, Taraxacum officinale, and Peumus boldus on key enzymes relevant to metabolic syndrome. Phytomedicine 22 (1), 138–144. doi:10.1016/j.phymed.2014.11.015
Wang, Q., Ellis, P. R., Ross-Murphy, S. B., and Burchard, W. (1997). Solution characteristics of the xyloglucan from Detarium senegalense Gmelin. Carbohydr. Polym. 33, 115–124. doi:10.1016/s0144-8617(97)00026-x
Ward, J. L., Poutanen, K., Gebruers, K., Piironen, V., Lampi, A. M., Nystrom, L., et al. (2008). The health grain cereal diversity screen: Concept, results and prospects. J. Agric. Food Chem. 56 (21), 9699–9709. doi:10.1021/jf8009574
Yotsawimonwat, S., Sriroth, K., Kaewvichit, S., Piyachomkwan, K., Jane, J. L., and Sirithunyalug, J. (2008). Effect of pH on complex formation between debranched waxy rice starch and fatty acids. Int. J. Biol. Macromol. 43, 94–99. doi:10.1016/j.ijbiomac.2008.03.006
Keywords: antioxidant activity, gluten-free bread, hydrocolloids, pasting properties, sensory attributes, starch-hydrolyzing enzymes
Citation: Irondi EA, Imam YT and Ajani EO (2022) Physicochemical, antioxidant and starch-digesting enzymes inhibitory properties of pearl millet and sweet detar gluten-free flour blends, and sensory qualities of their breads. Front. Food. Sci. Technol. 2:974588. doi: 10.3389/frfst.2022.974588
Received: 21 June 2022; Accepted: 06 September 2022;
Published: 20 September 2022.
Edited by:
Teleky Bernadette-Emoke, University of Agricultural Sciences and Veterinary Medicine of Cluj-Napoca, RomaniaReviewed by:
Anil Kumar Siroha, Chaudhary Devi Lal University, Sirsa, IndiaAshraf Sharoba, Benha University, Egypt
Copyright © 2022 Irondi, Imam and Ajani. This is an open-access article distributed under the terms of the Creative Commons Attribution License (CC BY). The use, distribution or reproduction in other forums is permitted, provided the original author(s) and the copyright owner(s) are credited and that the original publication in this journal is cited, in accordance with accepted academic practice. No use, distribution or reproduction is permitted which does not comply with these terms.
*Correspondence: Emmanuel Anyachukwu Irondi, ZW1tYW51ZWwuaXJvbmRpQGt3YXN1LmVkdS5uZw==