
95% of researchers rate our articles as excellent or good
Learn more about the work of our research integrity team to safeguard the quality of each article we publish.
Find out more
ORIGINAL RESEARCH article
Front. Food. Sci. Technol. , 15 July 2022
Sec. Food Characterization
Volume 2 - 2022 | https://doi.org/10.3389/frfst.2022.893795
This article is part of the Research Topic Producing Foods and Ingredients Through Valorization of Agro-Industrial By-Products View all 5 articles
 Yhonattan Nicolás López Bermúdez†Juan Felipe Aldana Heredia†
 Andrea del Pilar Sánchez-Camargo
 María Hernández-Carrión*
Production of tomato-based products generates 5% of waste, composed mainly of peel. This has a significant amount of carotenoids, such as lycopene, and an appropriate amount of total dietary fiber (TDF). Both carotenes and dietary fiber are known to have functional effects on the human body. Therefore, the aim of this research was mainly divided into two parts. First, organic tomato peel obtained by a local processing industry was characterized in terms of percentage of macronutrients such as dietary fiber, protein, and ash, as well as total carotenoid content. Second, two valorization alternatives of these compounds as potential functional additives in food processing were proposed. The first one included carotenoid extraction using ultrasound-assisted extraction (UAE), the encapsulation of the enriched carotenoid extract using spray-drying technology, and its subsequent analysis of powder properties. The second one evaluated the potential use of TDF tomato peel as a replacement for fat and flour in four formulations of cookies. Each formulation was assessed using physicochemical, texture, sensory, and theoretical proximal analyses. The results revealed that UAE optimization was performed using a solvent ratio of 80:20 ethyl acetate:ethanol and 2.5% w/v of solvent:biomass ratio. The recovery percentage of total carotenoid content was 89.08%. The TDF content was 49.46 (3.91) g/100 g on a dry basis. For encapsulation, the drying yield and encapsulation efficiencies were 67.3% (0.5) and 58.1% (0.8), respectively. Sensory analysis showed no significant difference between the means for the control cookie and the 30% fat replacement cookie. Moreover, these 30% fat replacement cookies had the highest purchase intention by the consumers. This study presented a solution for unused tomato peel industrial byproducts, promoting the design of new functional food products with a high content of carotenes and dietary fiber, thereby increasing nutritional and health benefits for consumers.
Nowadays, food-processing industries produce a significant volume of liquid and solid wastes, which have a potential value in nutrients and biomass (Khedkar and Singh, 2018). In addition to the fact that these wastes can be a source of pollution, it is relevant to find other methods to enhance the harvesting of these resources (Khedkar and Singh, 2018). Even though most food-processing industries attempt to use these wastes in a circular economy framework, there is still an opportunity for their potential use.
Tomato is one of the most consumed fruits around the world, with a global production of 177 million tons (Ninčević Grassino et al., 2020) and a local (Colombia) production of 527 thousand tons (FAO, 2021). While processing tomatoes (for juice, sauces, soups, or ketchup), a significant amount of waste is produced, composed of peel and seed mainly, which is largely used for animal feed or composting (Ninčević Grassino et al., 2019, 2020). Therefore, there is an opportunity to effectively reuse this waste and add value to other food matrices.
Tomato’s red hue is due to the presence of lycopene. The lycopene amount found in the peel is about five times more than that found in the pulp (Eh and Teoh, 2012; Rahimi and Mikani, 2019). This carotenoid is known to have functional effects on the human body, namely, the reduction of cardiovascular diseases and the improvement of skin health, because of the increase in antioxidant activity (Rahimi and Mikani, 2019; Shi and Le Maguer, 2000). Despite the decision of the European Food Safety Authority (EFSA) of not being able to conclude if there is a cause–relation effect between lycopene consumption and those health claims (EFSA, 2011b), more studies are demonstrating the opposite. However, the EFSA’s health claim discussion states that the amount of lycopene that should be consumed by an adult is 6 mg/day (EFSA, 2011b).
Even though lycopene is the main carotene in tomato peel, it also contains a significant amount of β-carotene (Baranska, Schütze and Schulz, 2006; Tilahun et al., 2018). This chemical compound is formed by the action of the enzyme lycopene beta-cyclase, which transforms lycopene through a cyclization mechanism (Rosati et al., 2000; Tilahun et al., 2018). β-Carotene gives tomato a characteristic orange color. Nonetheless, the presence of lycopene is higher; therefore, tomato is mainly red (Baranska, Schütze and Schulz, 2006). β-Carotene is known to be a precursor of retinol, or vitamin A, as it is commonly known (Rosati et al., 2000). Retinol is known to have effects on the eyes, skin, and cognitive health (EFSA, 2010b). Those health claims are confirmed by the EFSA as a favorable outcome ensuring their statements (EFSA, 2010b). This organization also studied the effects of β-carotene on human health and concluded that it improves skin health as it increases the physiological immune response to UV radiation and contributes to collagen formation (EFSA, 2011a). The recommended dose of β-carotene for an adult is about 60 mg/day (EFSA, 2010b; 2011a).
Lycopene and β-carotene can be found as natural pigments in different plants and fruits. Despite this, chemical pigments are chosen as the main color agents in food-processing industries (Sharma et al., 2022). Some of them, such as tartrazine, are known to have a harmful impact on human and environmental health to the extent of being prohibited in some countries (Wu et al., 2021). Therefore, there is a real motivation in food processing for the replacement of and transition from chemical-origin colorants to plant-based natural pigments (Sharma et al., 2022). Seeing that, numerous emerging green processes of natural pigment extraction are being analyzed, such as Ultrasound-Assisted Extraction (UAE), microwave-assisted extraction, and supercritical fluid extraction (Ordóñez-Santos, Esparza-Estrada and Vanegas-Mahecha, 2021). UAE involves the use of high-frequency sound waves (generally prolonged in a material medium), which exceeds the human hearing limits (Shaik, Chong and Sarbon, 2021). When the medium is liquid, due to their diffusion, sound waves produce little bubbles. This phenomenon is known as cavitation (Eh and Teoh, 2012). This process is beneficial for extraction, because it can help to overcome some physicochemical barriers in mass transport phenomena through microturbulence, microstreaming, microjets, and shock waves (Moharkar, Dhamole and Gole, 2021).
Considering other compounds of interest, tomato peel is also a good source of total dietary fiber (TDF) and consists of about 8.9% soluble dietary fiber and 48.5% insoluble dietary fiber (Gu et al., 2020). Food with dietary fiber tends to have good sensory and nutritional properties as well as beneficial health effects, such as preventing colon cancer, lowering the risk of cardiovascular disease, and reducing blood sugar (Gu et al., 2020) (EFSA, 2009). However, the EFSA states that this cause–effect relation can vary due to the unique physical and chemical characteristics of the fiber component, in addition to the dose and mode of administration (EFSA, 2010a).
In recent times, the local government has perceived an important need to create a culture built up through sustainability and a circular economy. The urge to contribute to the achievement of Sustainable Development Goal number 12 and develop industries based on the usage of residues is changing the mindset of people regarding the potential of byproducts (Centro Nacional de Producción Más limpia, 2020). Therefore, the main objective of this project was to evaluate the inclusion of functional compounds in a further formulation of a new product that maintains all the functional characteristics. Therefore, the study was divided into two major parts. First, it aimed to characterize tomato peel obtained from a local processing industry in terms of total carotenoid and TDF content. Second, the objective sought the valorization of these compounds as a potential functional additive in food processing. Thus, a green extraction process of carotenoid compounds and their encapsulation were carried out. Besides, the powder properties were analyzed. The potential use of TDF as a replacement for fat and flour in four formulations of cookies was assessed. Texture analyses for both dough and baked cookies were also carried out. A consumer sensory analysis was conducted to determine the acceptance of the different formulations of cookies. This study shows relevant data in the valorization of tomato-processing industry residues and could mean a starting point for the complete usage of these residues by applying concepts of sustainability and circular economy.
Tomato peels were obtained as a byproduct from the processing production of tomato paste of the company “Tomates Villa Santos S.A.S., TOVISA,” located in Santa Sofia, Boyacá. During the tomato paste processing, a hot-water blancher was used to ease the peeling process. β-Carotene standard 97.0% of purity (Sigma-Aldrich, 7235-40-7). Absolute ethanol C2H5OH (EtOH, 99.8% v/v), ethyl acetate C4H8O2 (EA, 99.5% v/v), acetone C3H6O (99.5% v/v), hydrochloric acid (37.0% v/v), and sodium hydroxide (98.0% w/w) were produced by Panreac (Gmbh, no date; PanReac AppliChem, 2013; 2017a, 2019, 2020). For the determination of TDF, heat-stable α-amylase (Reactifs RAL), protease (Sigma® Life Science), and amyloglycosidase (Fluka®) were used for enzymatic digestions. For phosphate buffer used in TDF quantification, disodium hydrogen phosphate anhydrous Na2HPO4 (99.0% v/v) and sodium dihydrogen phosphate anhydrous NaH2PO4 (99.0% v/v) were used, which were also produced by Panreac (PanReac AppliChem, 2011; 2017b).
Tomato peels were collected in buckets and stored in an ultrafreezer at −86°C until further sample preparation. First, the moisture content (MC) was determined using a moisture analyzer (Precisa Series 330 XM, Switzerland) (87.47% (0.1)). Second, tomato peels were placed on aluminum foil sheets and freeze-dried using a lyophilizer FreeZone (Labconco 6 L Benchtop Freeze Dry System, Canada) operating under a vacuum (0.007 mBar) and a temperature of −50°C for 72 h (Labconco, no date). Next, freeze-dried peels were ground until a particle size of 1 mm was reached using a cutting mill (Fritcsh pulverisette 19, France). Ground peels were stored in Ziploc bags wrapped in aluminum foil at −20°C until analysis. Further on in the text, this will be considered as the pretreated sample.
Tomato peels before (that is, fresh fruit) and after the hot-water blanching process (70°C, 5 min) were analyzed to compare the carotenoid degradation resulting from this thermal process. For this, a color evaluation of both tomato peels was carried out. Color treats were assessed using a hand-held colorimeter (CR-20, Minolta Co., Osaka, Japan) with an 8° visual angle and D65 illuminant (Minolta, 2015). For each sample, results were obtained as an average of six measurements in different parts of the ground tomato peels.
In addition, chromatic coordinates of the CIELAB were used for ΔE* estimation following Eq. 1. This parameter stipulates the magnitude of the total difference in color in two samples, where L* is brightness, a* is green–red coordinates, and b* is yellow–blue coordinates.
Equation 1. CIELAB formula for total difference in color (ΔE*).
The TDF content was determined according to the AOAC 991.43 by subtracting the total weight residue with the determination of ash and protein (AOAC Official Methods of Analysis, 2009). In brief, a water bath orbital shaker (MaxQTM 7000, ThermoFisher Scientific, United States) was used for enzymatic digestions by heat-stable α-amylase, protease, and amyloglycosidase to remove starch and protein (AOAC Official Methods of Analysis, 2009). Duplicate samples of enzyme digestate were treated with EtOH to precipitate soluble dietary fiber before filtering, using a 30 ml filter crucible of borosilicate glass. Then, TDF residues were washed with EtOH (76% and 98%) and 98% acetone, dried, and weighed. At last, one residue was analyzed for protein content using the total nitrogen Kjeldahl method, and the second residue of the duplicate was analyzed for ash content using a benchtop muffle furnace (5313C10 Thermo ScientificTM ThermolyneTM, United States) for 5 h at 525°C.
Conventional extraction (CE) was carried out using acetone as a solvent to extract the total carotenoid content (TCC) in tomato peel samples, following the methodology reported by Biswas and coworkers (Biswas, Sahoo and Chatli, 2011). First, 1.0 g of pretreated samples was weighed in a test tube. Then, 5 ml of chilled acetone was added to the sample, and the tube was vortexed for 10 min. At last, samples were centrifuged at 4500 RPM for 10 min using a refrigerated centrifuge (Thermo Electron Corporation IEC CL40R, United States), and the supernatant was collected in a separate test tube. The pellet was re-extracted using 5 ml of chilled acetone, followed by vortex and centrifugation once again as mentioned above. Re-extractions were done until the supernatant became translucent. Solutions of all extractions were pooled, and absorbance was measured at 450 nm using a UV-VIS spectrophotometer (T80+, PG Instruments, United Kingdom).
For the quantification, the maximum absorbance wavelength of a known concentration of standard β-carotene dissolved in solvents used in this investigation (EA and EtOH) was estimated by scanning from 400 to 500 nm using a UV-VIS spectrophotometer (T80+, PG Instruments, United Kingdom).
For both 80:20 EA:EtOH and 20:80 EA:EtOH, the maximum absorbance wavelength was 453 nm. The absorbances of the experimental assays were measured at 453 nm, diluting the initial solution to different concentrations until the absorbance was between 0.2 and 0.9 (Rodriguez-Amaya and Kimura, 2004). At last, calibration curves were used to estimate TCC at µg of β-carotene equivalent per gram. For UAE assays, the calibration curve for 80:20 EA:EtOH (% v/v) was
The experimental procedure was adequate with minimal exposure to light. First, 1 g of freeze-dried ground tomato peels was added into a glass amber bottle. Two solvent mixtures of EtOH–EA were chosen and added to the biomass. Within this design, UAE optimization was performed using solvent ratios of 80:20 EA:EtOH and 20:80 EA:EtOH. In addition, two solvent:biomass ratios were used, namely, 0.025 (w/v) and 0.05 (w/v). For UAE, an ultrasonic cleaner was used (2510-DTH, Branson) at 40°C for 45 min considering the method used in Lee-Sie’s study (Eh and Teoh, 2012). The frequency and power of the ultrasonic bath were set at 40 kHz and 130 W. The glass amber bottle was taken out and cooled at room temperature. The mixture was centrifuged (IEC CL40R, Thermo Electron Corporation) and filtered at 4500 RPM and 10°C for 20 min to separate the phases. At last, the supernatant of each assay was dried using a rotary evaporator (RE604/801, Yamato) at 30°C under a vacuum to obtain the extracts. Each assay was performed in duplicate.
The quantification of TCC was carried out using a calibration curve as described in Section 2.3.3. The recovery percentage of TCC was estimated using the results obtained in UAE and CE, as shown in Eq. 2.
Equation 2. Recovery percentage of TCC.
UAE of carotenoids was optimized using an experimental design of two factors and two levels to determine the recovery percentage of TCC (response variable). Solvent:biomass ratio and EA:EtOH ratio were used as independent variables. The statistical program Minitab® was used. Tukey’s test was used to create confidence intervals for all pairwise differences between factor-level means, and Dunnett’s test was used to compare the mean of each factor level (UAE) with the mean of the control (CE) (Minitab, 2019).
Microencapsulation of tomato peel extract with the highest recovery percentage (0.025 solvent:biomass ratio (w/v) and 80:20 EA:EtOH (% v/v)) was performed by spray-drying according to the method used in Szabo’s study (Szabo et al., 2021), with some modifications. The extract obtained from UAE was dissolved in 35 ml of commercial sunflower oil. Wall material was composed of maltodextrin (Química Center S.A.S) and gum arabic from the acacia tree (Sigma-Aldrich, 9000-01-5) in a ratio of 1:3 (w/v) maltodextrin:gum arabic. Wall material was dissolved using distilled water with continuous stirring at 5000 RPM for 10 min using a homogenizer (Dispermat®, Germany) The aqueous solution was stored for 2 h to assure complete rehydration of the polymers. The emulsion (O/W) was completed by adding the sunflower oil enriched by the extracts drop-by-drop to the wall material. The solution had a ratio of 2:1 wall material:oil, and it was homogenized using the Dispermat at a speed of 10,000 RPM. After the oil was thoroughly mixed, the homogenization continued for another 3 min.
The spray-drying process was performed using a spray-dryer (Buchi B290, Switzerland). A cocurrent spraying nozzle of 0.7 mm diameter was used. The emulsion feed rate was 12.5 ml/min. The airflow feed was 473 L/h using an inlet and outlet temperature of 140°C and 100°C, respectively. The vacuum was set at 30 m3/h. The produced microcapsules were collected into Ziploc bags hermetically sealed, wrapped with aluminum foil, and stored at 25°C in a desiccator until further analysis.
MC was determined using a moisture analyzer (Precisa, Series 330 XM) at 105°C until the sample reached a constant weight. Results were expressed as a wet basis percentage. This procedure was performed in duplicate.
The dissolution rate was calculated based on Duran et al.’s study (Duran Barón et al., 2021). Of note, 2.0 g of powder was added to 50 ml of distilled water. The mixture was agitated with a magnetic stirrer (CIMAREC, SP131015Q) at 900 RPM. The dissolution rate was estimated as the time required to completely dissolve the macroscopical particles in the mixture. This method was performed in duplicate.
The tapped density was estimated according to Duran et al.’s study (Duran Barón et al., 2021). Of note, 4.0 g of powder was poured into a 25 ml graduated cylinder. The graduated cylinder was constantly tapped manually until there was a negligible difference in volume between readings observed in the graduated cylinder. The tapped density (in g/ml) was determined as the relation between the mass of the powder sample (g) and the volume of the tapped powder (ml). In addition, the emulsion density was calculated using a 10 ml pycnometer by weight difference. Both methods were performed in duplicate.
The yield of the spray-drying process, expressed in a percentage (%), was the relation between the mass of the powder obtained and the mass of solids in the emulsion fed into the spray-dryer. DY was calculated using Eq. 3 (Duran Barón et al., 2021).
Equation 3 Yield of the spray-drying process.
The encapsulation efficiency was estimated as the relation between TCC of the powder (mg/g of powder obtained) and TCC of the extract (mg/g of sunflower oil) using Eq. 4.
Equation 4. Encapsulation efficiency.
For TCC of the powder, the methodology described in Section 2.3.3 for CE was carried out.
Pretreated tomato peels were considered for cookie preparation. Four formulations were prepared using the same quantity of all ingredients except flour and butter. The ingredients used for dough preparation were wheat flour (Haz de Oros tradicional®), unsalted butter (Alpina®), AAA eggs (Kikes®), vanilla essence (Levepan®), salt (Refisal®), baking powder (Royal®), white sugar (Manuelita®), red and orange colorant (Levapan®), and dried ground tomato peel (TOVISA S.A.S).
For dough preparation, the four formulations shown in Table MS1 were considered. The first one consisted of control without the addition of pretreated tomato peel, the second one had a 30% replacement of wheat flour, the third one had a 15%/15% replacement of wheat flour and unsalted butter, and the last one had a 30% replacement of unsalted butter with pretreated tomato peel.
A six-quart bowl-lift stand mixer manufactured by Kitchenaid® was used for dough preparation. Butter, sugar, and vanilla essence were introduced in the mixer for 1 min at a speed of 4 (mode: mixing, beating). Considering the manufacturing manual of the mixer, this speed is for mixing semiheavy batters, such as cookies (Kitchen Aid, no date). After that, half of the flour and half of the pretreated tomato peel were added to the mixer with continuous stirring for 1 min. Then, the rest of the flour and pretreated tomato peel were added. Afterward, egg, salt, and baking powder were added with continuous stirring for another minute. The mixture of ingredients was kneaded to heat the dough and stretch the gluten chains until an elastic dough was obtained. Then, the dough was wrapped and stored at 4°C for 1 h. Once an hour had passed, the dough was rolled out with a rolling pin until a 4 mm thick sheet was obtained. The sheet was stored again at 4°C for only 30 min. At last, the sheet was cut into small slices using a cookie cutter, and it was baked at 170°C for 10 min in an electric oven (Haceb HG CASIA 60 NE GN, Colombia).
The amount of β-carotene and TDF in each dough sample was estimated using the results of the 2.3.2 and 2.3.3. methods. In addition, it was considered the amount of TDF provided by the ingredients using for the cookie preparation.
A texture analyzer (TA.HDplusC, United Kingdom) was used to analyze the dough and cookies. First, for the dough, a back extrusion test was performed to determine firmness, consistency, cohesiveness, and work of cohesion. The test mode implemented was compression with a test speed of 1 mm/s, a 50% strain target mode, and a trigger force of 10 g.
For the cookies, a three-point bend test was used to measure hardness (g) and fracturability (mm) for each sample. The test was performed with a test mode of compression, a test speed of 1 mm/s, a distance target mode and 3 mm. All cookies were measured in duplicate.
In addition, color evaluation was performed for the dough and cookie samples using a hand-held colorimeter (CR-20, Minolta Co. Japan) with an 8° visual angle and D65 illuminant. For each sample, results were obtained as an average of six measurements in different parts of the sample.
The protocol of the sensory analysis was approved by the Ethics Committee of the Education Faculty of Universidad de los Andes. In total, 50 untrained adult panelists were enrolled to evaluate the sensory properties of the cookies. The experimental procedure was explained, and written consent indicating the voluntary participation and possible risks was obtained for each participant before starting the survey. Samples were randomly listed with a three-digit aleatory number. Participants were classified by gender, age, and status, and two questions were asked—how often they eat cookies and what characteristics they look for in a cookie. Before each sample taste, participants were free to choose the order of the cookie evaluation, and they had to rinse their mouths with water and unsalted crackers (Saltinas®, Colombia) to clean their palate. On the one hand, the participants tasted each sample and rated the samples using a 7-point hedonic scale (1 = “extremely dislike,” 4 = “it does not matter,” 7 = “extremely like”) regarding overall liking, appearance liking, texture liking, color liking, and flavor liking. On the other hand, 5-point just-about-right (JAR) questions (1 = too light, 3 = just-about-right, 5 = too intense) (Deba-Rementeria et al., 2021) were asked regarding crispness and sweetness.
Sensory data analysis was performed using Minitab® and Excel® software. On the one hand, the hedonic scale questions were analyzed using the statistical general linear model and the model was adjusted to the data obtained by the surveys in each of the categories. Therefore, Tukey’s test was used to compare the different pairwise replacement formulations in the perception of a potential consumer. On the other hand, the JAR analysis was held through a penalty analysis method (or mean drop). The test determines how much acceptability has been decreased by attributes that are not optimal (Sensory Dimensions, no date). Eqs. 5 and 6 show the calculation for the mean drop value.
Equation 5. Mean drop for too low.
Equation 6. Mean drop for too high.
In these equations, GAM indicates the global acceptability mean and NJ the number of judges. It is relevant to state that the effect of the attribute on the overall liking of the product is important if the mean drop value is greater than one and the percentage of surveyors with a different score from JAR values higher than 20%.
A theoretical proximal analysis of the best-scored cookie in the sensory analysis was performed. This analysis considered the formulation and the caloric intake of every ingredient in the cookie. In addition, depending on the calculations made with the TDF determination, the proximal analysis included the amount of TDF in one portion of the cookie. A nutrition fact label was made to arrange the data obtained in the product.
The results of the characterization revealed the approximate composition of the samples in terms of TDF, protein, and ash content. Tomato peel had a low content of protein (0.75% (0.14) d.b.) and ash (0.0019% (0.008) d.b.), with dietary fiber being the main carbohydrate compound (49.46% (0.057) d.b) (Navarro-González et al., 2011). The TDF content of organic tomato peel was found to be higher than that of other vegetables and fruits, such as cauliflower stem (35 g/100 g) (Hussain, Jõudu and Bhat, 2020), kiwifruit pomace (2–30 g/100 g) (Pathania and Kaur, 2022), guava peel and seeds (48.6 g/100 g) (Dalal et al., 2020), and carrot peel (45.5 g/100 g) (Chantaro, Devahastin and Chiewchan, 2008). Moreover, other studies estimated a soluble and insoluble dietary fiber content of 8.9 g/100 g and 48.5 g/100 g, respectively (Li et al., 2018). Considering the approximations made in literature, this study found a reasonable estimation of the TDF values. Nevertheless, other studies made a high estimation of TDF content in tomato peel (86.15 g/100 g (Navarro-González et al., 2011) and 85.7 g/100 g (García Herrera et al., 2010)). This could happen due to the blanching process performed in the samples used in this study, since this heat treatment changes the functional properties of the fiber, such as breaking of the glycosidic linkages and, consequently, dietary fiber polysaccharide depolymerization (Margareta and Nyman, 2003). All references are expressed in a dry base.
A color analysis (Table MS2) was performed to evaluate the change in CIELAB color parameters in the tomato before and after the blanching process by TOVISA, considering that the process is accomplished at high temperatures (60°C) The average of six measurements of the CIELAB coordinates (L*, a*, b*) and the differences (Δ L*, Δ a*, Δ b*) before and after the blanching process are shown. The brightness coordinate was the parameter with the greatest change, with an increased brightness in the sample before heat treatment. Besides, the coordinate a* had a negative change, resulting in a red color decrease and a green color increase. At last, the coordinate b* had a considerable positive difference, which indicates an increase in the yellow color and a decrease in the blue color in the samples treated with the blanching process. Furthermore, considering the differences in the L*, a*, and b* parameters, it is possible to estimate the total difference in color (ΔE* = 15.2). This difference between the treated and untreated samples is due to the degradation of carotenoids because of their thermolability, principally lycopene. This degradation caused by the heat produced during the blanching process causes oxidation and cis–trans isomerization (Meléndez-Martínez, 2017).
Table 1 shows the average TCC using CE (control) and UAE experimental assays in duplicate. As mentioned above, the percentage was estimated taking CE as a reference (100% recovery of TCC).
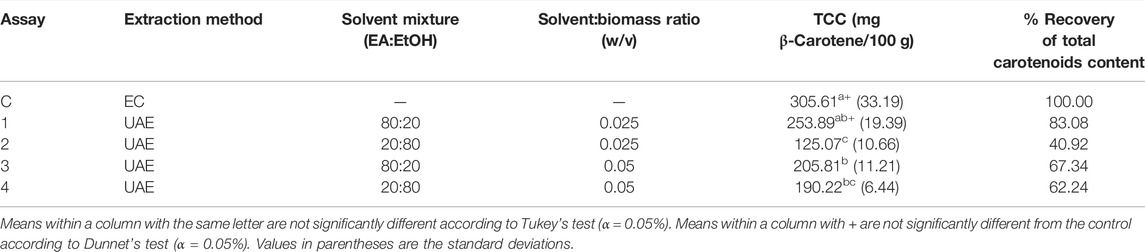
TABLE 1. Total carotenoid content using Ultrasound-Assisted Extraction and EC methods and statistical analysis using Tukey’s test.
First, as shown in Table 1, assays 1, 3, and 4 had similar means and standard deviations. Second, assay 2 had the lowest mean, related to the control. This assay had the lowest solvent:biomass ratio and a solvent ratio of 20 EtOH:80 EA. This suggests a better solvent affinity with carotenoids when there is a high solvent:biomass ratio, and the proportion of EA in the mixture of solvents was greater than that of EtOH. Even though EtOH has good penetration in the food matrix (Meléndez-Martínez, 2017), incorporating other solvents helps to obtain the desired solute retention in the solvent, increase solubility, and improve resolution (Rodriguez-Amaya and Kimura, 2004). In this case, the addition of EA decreased the polarity of the solvent mixture, providing more affinity to carotenoids.
Furthermore, Table 1 shows the statistical aggrupation of Tukey’s test. The means that do not have a letter in common are significantly different. To estimate confidence intervals, a 98.98% individual confidence level was used to obtain a 95% joint confidence level using Tukey’s method. Bearing this in mind, it is possible to affirm that with a 5% significance level, the null hypothesis is rejected for those pairs of samples with a p-value > 0.05. (1–2, 2–C, 3–C, and 4–C). In other words, all the pairs of mean samples mentioned above were significantly different. Despite this, the corresponding means of the pairs of samples 1–3 and 2–4 were significantly equal. Those pairs had one element in common as the pair of samples 1–3 had the same solvent ratio of 80: 20 EA:EtOH and the pair 1–4 had the solvent ratio of 20:80 EA:EtOH. In addition, the pairs 1–4 and 3–4 were also significantly equal. There were no levels in common for the first one, and for the second one, those pairs used the same solvent:biomass ratio (0.05 (w/v)). Considering all estimations performed in Tukey’s test, there was no way to confirm that one level was more significant than the other by using this test. Thus, the main effects plot (not shown) was used to examine differences between the level means of factors (solvent:biomass and solvent ratio). Considering this method, the solvent ratio (EA:EtOH) was the factor with more influence on the response variables, consistent with Tukey’s test analysis. There was a greater concentration of carotenoids when the amount of EA was higher than that of EtOH in the solvent mixture. Furthermore, the solvent:biomass ratio did not have a steep slope, which suggests that this factor did not severely affect TCC obtained in the extraction.
Next, it was important to determine which sample was significantly equal or superior to the control (CE). Dunnett’s test was used to analyze the differences between the statistical means of TCC of the samples (1–4) and the control sample. Assay 1 was the only sample grouped with the control. That means that there was no significant difference between the two means (Minitab, 2019), even though acetone has good penetration in the food matrix and has a good solubility of carotenoids and xanthophylls (Meléndez-Martínez, 2017). The non or low polarity of carotenoids such as lycopene and β-carotene suggests that for a suitable extraction solvent, a nonpolar or slightly polar solvent like hexane (nonpolar), diethyl ether (low polarity), or EA (medium polarity) must be used (Meléndez-Martínez, 2017; Zuorro, 2020). Thus, the variables involved in the extraction process (solubility, affinity, food matrix penetration, polarity) are similar when acetone or a mixture (80:20 EA:EtOH) is used as a solvent.
Considering all solvent parameters mentioned above, such as affinity with solute, solvent food matrix penetration, polarity of the solvent, and solute and solvent boiling points (to easily remove using evaporation), it is necessary to establish a mixture of solvents to obtain more than one parameter that enhances the extraction. EtOH has good food matrix penetration but high polarity that probably does not dissolve carotenes well due to the low polarity of lycopene and β-carotene. Considering this, the incorporation of another solvent, such as EA, should decrease the polarity of the mixture, improving the dilution of carotenoids as well as control.
It can be inferred that the assay 1 mixture has a greater affinity with carotenoids due to their polarity but a lower penetration into the food matrix. This is where the emerging ultrasound technology plays an important role, since the mechanical effect of ultrasound provides greater penetration of the solvent into the cellular material of tomato peel, resulting in the breakdown of cell walls to ease the carotenoid content release (Eh and Teoh, 2012). For this reason, applying green solvents like EtOH and EA in emerging technologies such as ultrasound could be an excellent alternative to extract carotenoids without the need to use a toxic or environmentally harmful solvent or invest a lot of time in CE processes.
Table MS3 shows the parameters obtained for the microencapsulation resultant powder. The emulsion density was measured, and a result of 1.091 (0.01) g/ml was obtained. These data are essential to evaluate the feeding mass in the spray dryer procedure and calculate the drying method efficiency.
As shown in Table MS3, the MC of the powder had a good estimation, considering Szabo et al. (2021) and Turchiuli et al. (2014) studies. The low result assures a good spray-drying process, efficiently eliminating the moisture of the emulsion. The above is attributed to the good stability of the powders during storage (Tan et al., 2015). In addition, it is important to determine the dissolution rate in powders due to the reconstitution capacity, which directly affects the quality of powders in foods (Zhang et al., 2020). The encapsulation efficiency is directly affected by the feed properties and spray-drying conditions (Duran Barón et al., 2021). Table MS3 shows 58.1% encapsulation efficiency. Compared with the results obtained by Duran et al., our results showed similar efficiency values, allowing good carotenoid retention. However, the same ratio relation between airflow and feed flow was taken into account as in Szabo et al.’s (2021) study. The decrease in parameters mentioned could produce an increase in encapsulation efficiency.
Figure 1 shows the four formulations of dough and baked cookies; this figure presents an overall view of the potential product before and after the baking process. A color analysis of the dough and cookies is shown in Table 2 and Table 3. To estimate the magnitude of the change in color in each case, an ∆E calculation was also made. The results showed ∆E values of 17.8, 15.1, 17.7, and 18.8 after baking for the control, and the 30% fat, 15% flour-15% fat, and 30% fat samples, respectively. The color parameters are important to consider the effect of the different formulations and the main chemical reactions that occur since the color can vary depending on the formulation. For fiber-added cookies, it must be taken into account that the fiber was obtained from tomato peel, which gives the dough and cookies a characteristic red (orange in this case because of previous blanching treatment) hue. However, as carotenes found in tomato peel are thermolabile as they are baked, an important degradation occurs, which causes a difference in color (Shi and Le Maguer, 2000). However, the most important change is due to Maillard reactions and water loss during the baking process. These reactions occur during heating between reducing carbohydrates and amino structures in proteins (Žilić et al., 2021). Wheat flour is an important source of proteins, in which gluten represents a relevant part. As the dough is kneaded and mixed, gluten matrices can be formed. Thus, a higher gluten content tends to favor the occurrence of Maillard reactions; hence, a change in color parameters is observed. Furthermore, it could be seen that the 30% flour replacement cookie had less color change. Another important factor to consider is baking time. A study by Zilic et al. (Žilić et al., 2021) showed that for high carbohydrate content food matrices, baking time had a significant effect on color parameters L*, a*, and b*. In addition, Table 2 shows the calculated amount of β-carotene and TDF in different formulated dough, considering the previous chemical characterization carried out. Comparing the formulated samples with the control, a significant increase in TDF and β-carotene was noted in samples with the addition of tomato peel. No other component of the formulation could provide such functional ingredients.

FIGURE 1. Dough and baked cookies for different formulations. Control (A,E), 30% wheat flour replacement (B,F), 15% wheat flour and 15% unsalted butter replacement (C,G), and 30% unsalted butter replacement (D,H). Dough (A–D) and baked cookies (E–H).
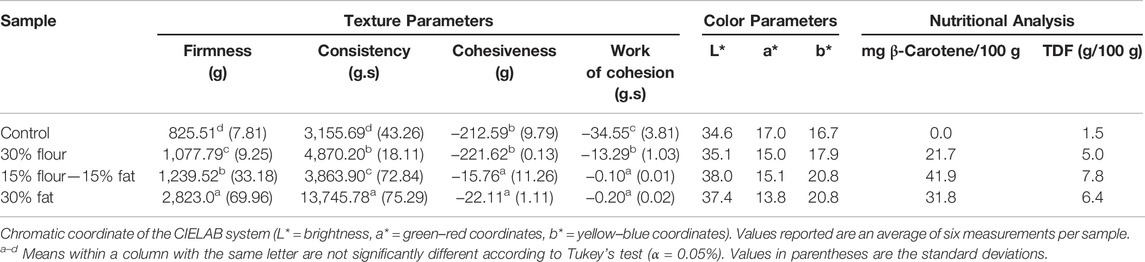
TABLE 2. Dough texture and color and theoretical nutritional analysis.
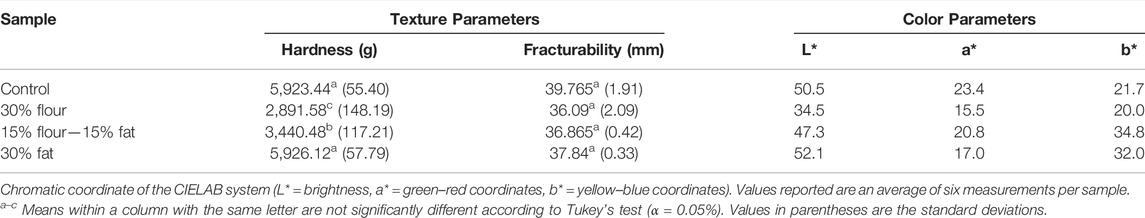
TABLE 3. Texture and color analysis of cookies.
It is important to understand the textural properties of the dough so as to predict its behavior during manipulation, for example, in kneading, rolling, and cutting (Burbano, Cabezas and Correa, 2021). Table 2 illustrates the back extrusion test for dough. As shown in Table 2, the dough with less firmness was the control. On the contrary, the dough with a 30% fat replacement and 15–15% fat and flour replacement, respectively, were the samples with a considerable increase in firmness. During the manipulation of the dough, a firmer structure but a lower spreadability was noted during the rolling process. In addition, this increase in firmness is reasonable because during mixing, the lipids of the unsalted butter act as a lubricant, covering the surface of the flour and preventing the formation of a gluten network during the kneading process (Ekin et al., 2021). Thus, the final product of samples with the fat replacement was a firm and hard-texture dough.
In addition, consistency values increased when there was a high replacement of flour or fats, like in samples 15% flour—15% fat and 30% fat. Still, it was more significant when there was a replacement in the fat formulation. Cohesiveness can be described as the strength of the internal bonds making up the body of the dough (Demir¨ozer et al., 2021). Considering the results shown, the control and 30% flour replacement samples had higher cohesiveness values. Hence, it is possible to establish that the replacement of flour does not considerably affect the strength between the dough particles. It means that the cohesiveness value was not significantly different from the control one. In other words, the formation of the gluten network produced by the proteins in flour should be avoided, increasing the dough’s cohesiveness while decreasing the firmness. This improves the manipulation during the kneading and rolling process. Table 3 shows the texture analysis results in terms of hardness and fracturability and the color analysis of baked cookies.
It is important to define the hardness of a food matrix as the required force to compress a food with the teeth, tongue, or palate (Di Monaco, Cavella and Masi, 2008). Therefore, it can be expressed as the force to compress a food matrix in the mouth. The results shown that the 30% fat replacement sample and control had significantly higher hardness values. The samples with flour replacement had lower hardness values. These behaviors can be explained because of the diminish of the amount of flour in the cookie with 30% flour replacement and 15–15% flour and fat replacement, in which wheat flour was replaced with dietary fiber. Replacement of flour can decrease the gluten content and moisture, which will affect the formation of gluten matrices. It was reported that the hardness of cookies depends on the structure of the composite matrix of protein aggregates, lipids, and sugars, which are embedded in some ungelatinized starch granules (Chung, Cho and Lim, 2014). Hence, this contributed to the decrease in hardness. Other studies that replaced wheat flour with gluten-free cereals, such as rice or amaranth, also reported reduced values for the hardness texture parameter (Chung, Cho and Lim, 2014; Chauhan, Saxena and Singh, 2015; Jan, Saxena and Singh, 2016). For the fracturability, all the results obtained were similar. It is crucial to define fracturability as the tendency of a material to fracture, crumble, crack, shatter, or fail upon applying a relatively small amount of force or impact. The results, shown in Table 3, indicate that in the four cases, fracturability had a similar behavior. Therefore, it can be concluded that the formulation and replacement of fats and flour in cookies do not affect the fracturability in a significant way as all the samples shared the same Tukey’s test aggrupation.
Results of the sensory analysis were divided in terms of gender, age, and frequency of cookie consumption. Regarding gender, there were more men (54%) surveyed than women (46%). The age range with the highest participation in the sensory analysis was 18–25 years with 88%, while the other age ranges (26–35, 36–45, and over 45 years) each had 4% of participation. At last, most people consume cookies on a weekly basis (54%), followed by daily consumption (20%) and people who only have monthly and sporadic consumptions, with a participation of 16% and 10%, respectively. Table 4 shows the results of the sensory analysis attributes measured for the hedonic survey. First, in terms of overall liking, it shows Tukey’s test results applied to the data obtained. The sample with 30% fat replacement was the only one in which the mean was not significantly different from the control cookie.
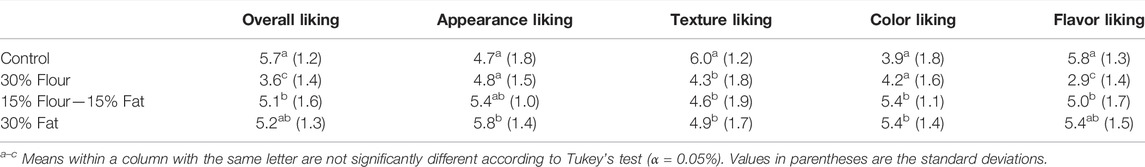
TABLE 4. Scores for overall liking, appearance liking, texture liking, color liking, and flavor liking for cookies.
Considering this, the 30% fat replacement cookie was the only one globally accepted as the control cookie. It can be explained by the flavor liking presented in Table 4 which shows that the 30% fat replacement cookie and control cookie had no significant difference in their flavor score means. This implies that with this formulation, the flavor was accepted as the control one. Bearing in mind that 78% of the consumers did not care about the ingredients but the flavor of the cookie, the importance of this attribute can be understood; this attribute is therefore considered the most important one in the overall liking of the cookie. However, other parameters such as color, appearance, and texture of the 30% fat replacement cookie differed from those of the control cookie, and their means were significantly different. Another important result was the mean average score of the texture in the three replacement cookies. In this attribute, all of the replacement cookies had a significantly lower mean value than that of the control. However, considering the 30% fat replacement cookie, this mean difference was not a principal effect on the attribute of overall liking. Another important result is regarding the attributes of color and appearance. As a result of adding a chemical colorant to the control cookie to achieve a similar color to the one in the tomato fiber, a rejection of the surveyed people was noticed. As it can be seen in color and appearance, the 30% fat replacement and 15–15% fat and flour replacement cookies had higher average means than the control cookie, which means that this colorant addition was perceptible and unliked among the surveyed people.
Comparing the results presented in Table 3 and Table 4, a relationship between texture evaluated in the hedonic survey and cookie parameters such as hardness and fracturability can be evidenced. The 30% fat replacement sample had better texture parameters and the values were not significantly different from the control (see Table 3). It can be evidenced that this sample and the control had the highest values of hardness. On the contrary, the 30% flour replacement cookie had low texture values in the hedonic survey. This is consistent with the hardness parameters. As shown in Table 3, this cookie had lower values of hardness, or in other words, was the softest cookie.
For the JAR scale analysis, the results showed how attributes such as crispness and sweetness affect the overall liking of the product. In the case of the control cookie and the 30% fat replacement cookie, the sweetness was well established, as the JAR percentage was high. However, regarding crispness, both cookies had a low JAR percentage and a high crispness percentage, which can be translated as a need to revise and reduce crispness in those cookies. A mean drop penalization analysis was conducted (Table MS4) to link the JAR scale and overall liking results of the hedonic scale survey. For the control cookie, none of the attributes affected the overall liking of the product. This can be explained as the attributes “too low crispness” and “too low sweetness” had a mean drop greater than 1 (1.3 and 1.7, respectively). Still, the percentage of judges that inferred that decision was low (12% and 10%, respectively). For the 30% fat replacement cookie, there was an effect of the crispness attribute in overall linking. This can be explained as 24% of the judges considered that it was “too low crispness” and scored a mean drop of 1.2. Therefore, this attribute influenced the overall liking but was not as strong to differ significantly from the control. The other attributes and groups did not affect the overall liking of the cookie.
For cookies with 15–15% fat and flour replacement and 30% flour replacement, the same analysis was performed to evaluate the reason for not having a high overall liking compared with the control cookie. First, it is important to mention that the only well-established attribute was the sweetness of the 15–15% fat and flour replacement cookie. The results obtained for the 30% flour replacement cookie show that a higher percentage of judges considered that the cookie was very crispy (42% of judges) and not very sweet (58% of judges). For the 15–15% fat and flour replacement cookie, a significant number of judges (82%) considered that the crispness was very low. However, applying the mean drop analysis for the 15–15% fat and flour replacement cookie attributes did not affect the overall liking in any case. For the 30% flour replacement cookie, the very low crispness and very low sweetness did influence the overall liking as their mean drops were 1.4 (with 28% of the surveyors) and 1.4 (with 58% of the surveyors), respectively.
Considering all the results, the consumers were finally asked to state their intention of purchasing any of the cookies. This question allowed the consumer to choose one or more cookies; there was even an option of neither of them. The control and 30% fat replacement cookies were more likely to be purchased by potential consumers, with 58% and 56%, respectively, of the consumers stating that they would buy them. While the 15–15% fat and flour replacement cookie was intended to be bought by 28% of the consumers and the 30% flour replacement cookie by 4%. This confirms the overall liking of both (30% fat replacement and control) cookies to be likely. In terms of the study, it is important that the 30% fat replacement cookie had a high overall liking. It opens a relevant framework to introduce a possible market analysis to take this cookie into the market and introduce it as a new functional product. The replacement of fats and the addition of fiber can be categorized as a replacement in the formulation of functional cookies and can be a step in the pursuit of the Colombian government to apply terms of sustainability and circular economy in all the food-processing industries.
Formulation cookies with a 30% fat replacement were established as a potential product. The nutritional facts of this product are shown in Figure 2. A bag of cookies was considered a serving size with an approximate weight of 50 g (12 cookies per bag). The daily reference values were taken from the nutritional labeling module of the Colombian Health Ministry (Ministerio, 2019). In addition, minerals and vitamins of all the ingredients described in section 2.9 were considered. As shown in Figure 2, the total amount of calories per serving was calculated considering the factors of conversion of proteins (4 kcal/g), total carbohydrates (4 kcal/g), and fats (9 kcal/g) (Ministerio, 2019).
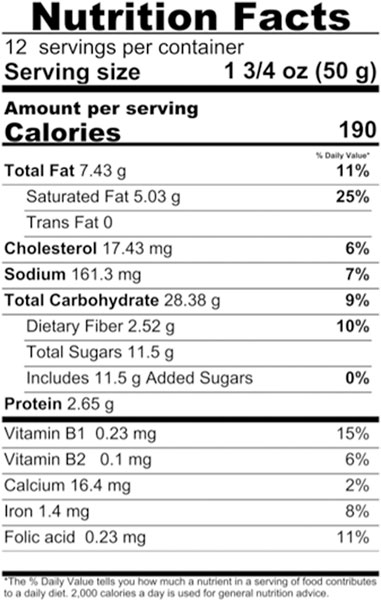
FIGURE 2. Theoretical nutritional chart of the best formulation of cookies.
For the labeling and nutritional requirements implemented, the Resolution 810 of 2021 of the Ministry of Health and Social Protection of Colombia was considered (Ministerio de Salud y Protección Social, 2021). Considering the requirements for nutritional claims, it is possible to establish that the product has the claim of “excellent source of fiber”. This requirement is fulfilled when at least 6 g of fiber are found in 100 g of food. In addition, the product has the claim “excellent source of vitamin B1 or thiamin” as it includes at least 30% of the daily value of thiamin in 100g of food. As a complete lack of trans fat could be evidenced, it is possible to establish the claim “free of trans fat.” At last, if it contains a maximum of 0.02 g per 100 g (in solids), it is possible to use the descriptor “low in cholesterol.”
Considering the current Colombian market, “Compañía de Galletas Noel S.A.” is consolidated as the main producer of cookies in Colombia, with a 55.9% share in the national biscuit market (Passport, 2020). Noel’s product that is most closely related to the 30% fat replacement cookie in terms of serving size, appearance, and bag size is the MiniChips® brand. Comparing the nutritional facts of both cookies, there was a difference in total fats (7.43 g per 50 g in the 30% fat replacement cookie and 10 g per 50 g in MiniChips®). Bearing this in mind, it is possible to observe the difference in total fat associated with the replacement with the fiber of the tomato peel. Furthermore, there was a significant difference in the fiber content. For MiniChips®, a content of 1.4 g of crude fiber per 50 g was evidenced, while for cookies in this study, there was 2.52 g per 50 g of dietary fiber. Thus, there was a substantial increase in the daily reference value for the dietary fiber due to the incorporation of the fiber present in tomato peel. Without this contribution, wheat flour was the only ingredient with a fraction of dietary fiber (3% DV for a 50 g bag of chips). Therefore, incorporating the fiber from tomato peel is an excellent opportunity to launch products with higher dietary fiber content and overall liking.
Tomato peel is an unused industrial residue with high potential due to its functional compounds, such as lycopene, β-carotene, and TDF. The usage of these compounds after the residue is produced can enhance the circular economy and sustainability concepts in the global and local food industry. On the one hand, the extraction of carotenoids can be performed with green processes such as UAE and solvents whose effects on the environment are not as harmful as those used in CE. In this case, the extraction was optimal with a mixture of 80 EA:20 EtOH and a 0.025 (w/v) solvent:biomass ratio. The encapsulation of these carotenoids had an efficiency of 58.1%, which is considered acceptable. On the other hand, tomato peel is a good source of TDF, which is known to have many functional effects, as discussed earlier. A concentration of 49.46 g TDF/100 g biomass d.b was found. In this study, TDF was considered a potential replacement for fats in the formulation of butter cookies. The group of consumers were most likely to buy the 30% fat replacement cookie, and this cookie had better overall acceptability. Therefore, through the valorization of a residue, a proposal in functional food enhances public health issues. In addition, this development considers the urge of the local government of Colombia to create a culture around a new green economy in a country with chances, looking forward to strengthening the use and harvesting of resources obtained from residues.
In this study, two of the principal functional compounds of tomato peel were evaluated in terms of their possibility of usage in the food industry as additives or replacements in formulations. However, due to limitations, there was no evaluation of both compounds together in the development of functional foods. For future work, it can be an excellent opportunity to evaluate the integration of encapsulated carotenes in the formulation of a cookie that replaces fat for tomato fiber. With that in mind, the cookie’s functionality will be higher as it can provide a more functional effect if the intake is constant. This integration can also be an opportunity to know the potential consumer perception of the product once the capsules are added to the formulation. Since the wall material of encapsulation can prevent the degradation of carotene molecules (which are highly thermolabile), it can be studied up to what point this protective layer fulfills its function.
The raw data supporting the conclusion of this article will be made available by the authors, without undue reservation.
The studies involving human participants were reviewed and approved by Comité de Ética de la Investigación de la Facultad de Ingeniería, Universidad de los Andes, Bogotá, Colombia. The patients/participants provided their written informed consent to participate in this study.
YL: Conceptualization, methodology, validation, formal analysis, investigation, writing—original draft. JA: Conceptualization, methodology, validation, formal analysis, investigation, writing—original draft. AS-C: Conceptualization, resources, writing—review and editing, supervision. MC: Conceptualization, resources, writing—review and editing, supervision.
The authors declare that the research was conducted in the absence of any commercial or financial relationships that could be construed as a potential conflict of interest.
All claims expressed in this article are solely those of the authors and do not necessarily represent those of their affiliated organizations, or those of the publisher, the editors, and the reviewers. Any product that may be evaluated in this article, or claim that may be made by its manufacturer, is not guaranteed or endorsed by the publisher.
The authors acknowledge the support of Tomates Villa Santos S.A.S. (Tovisa S.A) for supplying the samples and the Universidad de los Andes, Chemical and Food Engineering department, for financing and allowing the development of experimentation.
The Supplementary Material for this article can be found online at: https://www.frontiersin.org/articles/10.3389/frfst.2022.893795/full#supplementary-material
AOAC Official Methods of Analysis (2009). AOAC 2009.01-2009, Total Dietary Fiber in Foods. Gaithersburg, MD: Enzymatic-gravi. AOAC International.
Baranska, M., Schütze, W., and Schulz, H. (2006). Determination of Lycopene and β-Carotene Content in Tomato Fruits and Related Products: Comparison of FT-Raman, ATR-IR, and NIR Spectroscopy. Anal. Chem. 78 (24), 8456–8461. doi:10.1021/AC061220J
Biswas, A. K., Sahoo, J., and Chatli, M. K. (2011). A Simple UV-Vis Spectrophotometric Method for Determination of β-carotene Content in Raw Carrot, Sweet Potato and Supplemented Chicken Meat Nuggets. LWT - Food Sci. Technol. 44 (8), 1809–1813. doi:10.1016/J.LWT.2011.03.017
Burbano, J. J., Cabezas, D. M., and Correa, M. J. (2022). Effect of Walnut Flour Addition on Rheological, Thermal and Microstructural Properties of a Gluten Free-Batter. Lwt 154, 112819. doi:10.1016/J.LWT.2021.112819
Centro Nacional de Producción Más limpia (2020). Economía Circular: Una forma diferente de hacer negocios sostenibles. Available at: https://www.colombiaproductiva.com/ptp-capacita/publicaciones/transversales/guia-empresarial-de-economia-circular/200310-cartilla-economia-circular (Accessed: November 28, 2021).
Chantaro, P., Devahastin, S., and Chiewchan, N. (2008). Production of Antioxidant High Dietary Fiber Powder from Carrot Peels. LWT - Food Sci. Technol. 41 (10), 1987–1994. doi:10.1016/J.LWT.2007.11.013
Chauhan, A., Saxena, D. C., and Singh, S. (2015). Total Dietary Fibre and Antioxidant Activity of Gluten Free Cookies Made from Raw and Germinated Amaranth (Amaranthus spp.) Flour. LWT - Food Sci. Technol. 63 (2), 939–945. doi:10.1016/J.LWT.2015.03.115
Chung, H.-J., Cho, A., and Lim, S.-T. (2014). Utilization of Germinated and Heat-Moisture Treated Brown Rices in Sugar-Snap Cookies. LWT - Food Sci. Technol. 57 (1), 260–266. doi:10.1016/J.LWT.2014.01.018
Dalal, N., Bisht, V., and Dhakar, U. (2020). Potential of Fruit and Vegetable Waste as a Source of Pectin. Int. J. Chem. Stud. 8 (1), 3085–3090. doi:10.22271/CHEMI.2020.V8.I1AU.8739
de Salud, M. (2019). Módulo rotulado nutricional Capacitación equipos básicos de salud-APS. Available at: www.minsalud.gov.co (Accessed: November 29, 2021).
Deba-Rementeria, S., Zugazua-Ganado, M., Estrada, O., Regefalk, J., and Vázquez-Araújo, L. (2021). Characterization of Salt-Preserved Orange Peel Using Physico-Chemical, Microbiological, and Sensory Analyses. Lwt 148, 111769. doi:10.1016/J.LWT.2021.111769
Demir Özer, E., Esen, M. K., İçigen, M., and Özer, C. O. (2021). Investigation of Usage Possibilities of Kalaba Yoghurt (Local Cream Yoghurt) in Cheesecake Production. Int. J. Gastron. Food Sci. 25, 100376–100450. doi:10.1016/j.ijgfs.2021.100376
Di Monaco, R., Cavella, S., and Masi, P. (2008). Predicting Sensory Cohesiveness, Hardness and Springiness of Solid Foods from Instrumental Measurements. J. Texture Stud. 39 (2), 129–149. doi:10.1111/J.1745-4603.2008.00134.X
Duran Barón, R., Valle-Vargas, M. F., Quintero-Gamero, G., Quintanilla-Carvajal, M. X., and Alean, J. (2021). Encapsulation of Citrulline Extract from Watermelon (Citrullus lanatus) By-Product Using Spray Drying. Powder Technol. 385, 455–465. doi:10.1016/J.POWTEC.2021.03.014
EFSA (2011a). Scientific Opinion on the Substantiation of Health Claims Related to a Combination of Lycopene, Proanthocyanidins, Vitamin C, Vitamin E, Selenium and Beta-Carotene and Contribution to Normal Collagen Formation (ID 1669) and Protection of the Skin from UV-EFSA Journal. Wiley-Blackwell Publ. Ltd. 9 (6). doi:10.2903/J.EFSA.2011.2239
EFSA (2009). Scientific Opinion on the Substantiation of Health Claims Related to Dietary Fibre and Maintenance of Normal Blood Cholesterol Concentrations (ID 747, 750, 811) Pursuant to Article 13(1) of Regulation (EC) No 1924/2006EFSA Journal. Wiley-Blackwell Publ. Ltd. 7 (10). doi:10.2903/J.EFSA.2009.1255
EFSA (2010a). Scientific Opinion on the Substantiation of Health Claims Related to Dietary Fibre (ID 744, 745, 746, 748, 749, 753, 803, 810, 855, 1415, 1416, 4308, 4330) Pursuant to Article 13(1) of Regulation (EC) No 1924/2006’, EFSA Journal. Wiley-Blackwell Publ. Ltd. 8 (10). doi:10.2903/J.EFSA.2010.1735
EFSA (2011b). Scientific Opinion on the Substantiation of Health Claims Related to Lycopene and Protection of DNA, Proteins and Lipids from Oxidative Damage (ID 1608, 1609, 1611, 1662, 1663, 1664, 1899, 1942, 2081, 2082, 2142, 2374), Protection of the Skin from UV-Indu’, EFSA Journal. Wiley-Blackwell Publ. Ltd. 9 (4). doi:10.2903/J.EFSA.2011.2031
EFSA (2010b). Scientific Opinion on the Substantiation of Health Claims Related to Vitamin A (Including β-carotene) and Maintenance of Normal Vision (ID 4239, 4701), Maintenance of Normal Skin and Mucous Membranes (ID 4660, 4702), Andmaintenance of Normal Hair (ID 466’, EFSA Journal. Wiley-Blackwell Publ. Ltd. 8 (10). doi:10.2903/J.EFSA.2010.1754
Eh, A. L.-S., and Teoh, S.-G. (2012). Novel Modified Ultrasonication Technique for the Extraction of Lycopene from Tomatoes. Ultrason. Sonochemistry 19 (1), 151–159. doi:10.1016/J.ULTSONCH.2011.05.019
Ekin, M. M., Kutlu, N., Meral, R., Ceylan, Z., and Cavidoglu, İ. (2021). A Novel Nanotechnological Strategy for Obtaining Fat-Reduced Cookies in Bakery Industry: Revealing of Sensory, Physical Properties, and Fatty Acid Profile of Cookies Prepared with Oil-Based Nanoemulsions. Food Biosci. 42, 101184. doi:10.1016/J.FBIO.2021.101184
FAO (2021). No Title, Supply Utilization Accounts. Available at: http://www.fao.org/faostat/en/#data/SCL.
García Herrera, P., Sánchez-Mata, M. C., and Cámara, M. (2010). Nutritional Characterization of Tomato Fiber as a Useful Ingredient for Food Industry. Innovative Food Sci. Emerg. Technol. 11 (4), 707–711. doi:10.1016/J.IFSET.2010.07.005
Gmbh, A. (2021). Specification Ethanol Absolute for Analysis A1613. Available at: www.itwreagents.com (Accessed: October 13, 2021).
Gu, M., Fang, H., Gao, Y., Su, T., Niu, Y., and Yu, L. (2020). Characterization of Enzymatic Modified Soluble Dietary Fiber from Tomato Peels with High Release of Lycopene. Food Hydrocoll. 99, 105321. doi:10.1016/J.FOODHYD.2019.105321
Hussain, S., Jõudu, I., and Bhat, R. (2020). Dietary Fiber from Underutilized Plant Resources-A Positive Approach for Valorization of Fruit and Vegetable Wastes. Sustainability 1212 (13), 54015401. doi:10.3390/SU12135401
Jan, R., Saxena, D. C., and Singh, S. (2016). Physico-chemical, Textural, Sensory and Antioxidant Characteristics of Gluten - Free Cookies Made from Raw and Germinated Chenopodium (Chenopodium album) Flour. LWT - Food Sci. Technol. 71, 281–287. doi:10.1016/J.LWT.2016.04.001
Khedkar, R., and Singh, K. (2018). Food Industry Waste: A Panacea or Pollution Hazard? Cham: Springer, 35–47. doi:10.1007/978-3-319-58415-7_3
Kitchen Aid (2018). Bowl Lift Stand Mixer Intructions and Recipes 1-800-541-6390 Details inside 9708307C. Available at: https://www.kitchenaid.com/content/dam/global/documents/201002/owners-manual-9708307-RevC.pdf (Accessed: November 22, 2021).
Labconco (2018). FreeZone 6 Liter Benchtop Freeze Dry Systems with Stoppering Tray Dryers. Available at: https://www.labconco.com/product/freezone-6-liter-benchtop-freeze-dry-systems-with-stoppering-tray-dryers/5372 (Accessed September 29, 2021).
Li, N., Feng, Z., Niu, Y., and Yu, L. (2018). Structural, Rheological and Functional Properties of Modified Soluble Dietary Fiber from Tomato Peels. Food Hydrocoll. 77, 557–565. doi:10.1016/J.FOODHYD.2017.10.034
Margareta, E., and Nyman, G.-L. (2003). Importance of Processing for Physico-Chemical and Physiological Properties of Dietary Fibre. Proc. Nutr. Soc. 62 (1), 187–192. doi:10.1079/PNS2002227
Ministerio de Salud y Protección Social (2021). Resolución número 812 de 2021. Available at: https://www.minsalud.gov.co/Normatividad_Nuevo/Resolución No. 810de 2021.pdf (Accessed November 30, 2021).
Minitab, (2019). Minitab 18 Support. Available at: https://support.minitab.com/en-us/minitab/18/(Accessed: November 20, 2021).
Moharkar, S., Dhamole, P. B., and Gole, V. L. (2021). Integrated Ultrasound-Mediated Sugaring-Out Extraction of Erythromycin from Fermentation Broth. Sep. Purif. Technol. 278, 119517. doi:10.1016/J.SEPPUR.2021.119517
Navarro-González, I., García-Valverde, V., García-Alonso, J., and Periago, M. J. (2011). Chemical Profile, Functional and Antioxidant Properties of Tomato Peel Fiber. Food Res. Int. 44 (5), 1528–1535. doi:10.1016/J.FOODRES.2011.04.005
Ninčević Grassino, A., Djaković, S., Bosiljkov, T., Halambek, J., Zorić, Z., Dragović-Uzelac, V., et al. (2019). Valorisation of Tomato Peel Waste as a Sustainable Source for Pectin, Polyphenols and Fatty Acids Recovery Using Sequential Extraction. Waste Biomass Valor 11 (9), 4593–4611. doi:10.1007/S12649-019-00814-7
Ninčević Grassino, A., Ostojić, J., Miletić, V., Djaković, S., Bosiljkov, T., Zorić, Z., et al. (2020). Application of High Hydrostatic Pressure and Ultrasound-Assisted Extractions as a Novel Approach for Pectin and Polyphenols Recovery from Tomato Peel Waste. Innovative Food Sci. Emerg. Technol. 64, 102424. doi:10.1016/J.IFSET.2020.102424
Ordóñez-Santos, L. E., Esparza-Estrada, J., and Vanegas-Mahecha, P. (2021). Ultrasound-assisted Extraction of Total Carotenoids from Mandarin Epicarp and Application as Natural Colorant in Bakery Products. Lwt 139, 110598. doi:10.1016/J.LWT.2020.110598
PanReac AppliChem (2017a). Acetone (USP, BP, Ph. Eur.) Pure, Pharma Grade. Available at: https://www.itwreagents.com/download_file/tds/141007/en/tds_141007_en.pdf (Accessed October 13, 2021).
PanReac AppliChem (2017b). Di-Sodium Hydrogen Phosphate Anhydrous (Reag. Ph. Eur.) for Analysis, ACS.
PanReac AppliChem (2013). Ethyl Acetate, 99.5% for Synthesis. Available at: https://www.itwreagents.com/download_file/tds/161318/en/tds_161318_en.pdf (Accessed: October 13, 2021).
PanReac AppliChem (2019). Hydrochloric Acid 37% (Reag. USP) for Analysis, ACS, ISO. Available at: https://www.itwreagents.com/download_file/tds/131020/en/tds_131020_en.pdf (Accessed December 4, 2021).
PanReac AppliChem (2011). Sodium Di-hydrogen Phosphate Anhydrous for Analysis. Available at: https://www.itwreagents.com/download_file/tds/122018/en/tds_122018_en.pdf (Accessed December 4, 2021).
PanReac AppliChem (2020). Sodium Hydroxide Pellets (Reag. USP) for Analysis, ACS, ISO. Available at: https://itwreagents.com/download_file/tds/131687/en/tds_131687_en.pdf (Accessed December 4, 2021).
Passport, Euromonitor (2020). Packaged Food in Colombia. Available at: https://www-portal-euromonitor-com.ezproxy.uniandes.edu.co/portal/analysis/tab (Accessed: December 1, 2021).
Pathania, S., and Kaur, N. (2022). Utilization of Fruits and Vegetable By-Products for Isolation of Dietary Fibres and its Potential Application as Functional Ingredients. Bioact. Carbohydrates Diet. Fibre 27, 100295. doi:10.1016/j.bcdf.2021.100295
Rahimi, S., and Mikani, M. (2019)., 146. Elsevier, 1033–1042. doi:10.1016/J.MICROC.2019.02.039Lycopene Green Ultrasound-Assisted Extraction Using Edible Oil Accompany with Response Surface Methodology (RSM) Optimization Performance: Application in Tomato Processing WastesMicrochem. J.
Rosati, C., Aquilani, R., Dharmapuri, S., Pallara, P., Marusic, C., Tavazza, R., et al. (2000). Metabolic Engineering of Beta-Carotene and Lycopene Content in Tomato Fruit. Plant J. 24 (3), 413–420. doi:10.1046/J.1365-313X.2000.00880.X
Sensory Dimensions (2000). Just about Right Scales and Penalty Analysis. Available at: https://www.sensorydimensions.com/blog/just-about-right-scales-and-penalty-analysis/(Accessed: November 28, 2021).
Shaik, M. I., Chong, J. Y., and Sarbon, N. M. (2021). Effect of Ultrasound-Assisted Extraction on the Extractability and Physicochemical Properties of Acid and Pepsin Soluble Collagen Derived from Sharpnose Stingray (Dasyatis Zugei) Skin. Biocatal. Agric. Biotechnol. 38, 102218. doi:10.1016/J.BCAB.2021.102218
Sharma, M., Hussain, S., Shalima, T., Aav, R., and Bhat, R. (2022). Valorization of Seabuckthorn Pomace to Obtain Bioactive Carotenoids: An Innovative Approach of Using Green Extraction Techniques (Ultrasonic and Microwave-Assisted Extractions) Synergized with Green Solvents (Edible Oils). Industrial Crops Prod. 175, 114257. doi:10.1016/J.INDCROP.2021.114257
Shi, J., and Maguer, M. L. (2000). Lycopene in Tomatoes: Chemical and Physical Properties Affected by Food Processing. Crit. Rev. Food Sci. Nutr. 40 (1), 1–42. doi:10.1080/10408690091189275
Szabo, K., Emőke Teleky, B., Ranga, F., Simon, E., Lelia Pop, O., Babalau-Fuss, V., et al. (2021). Bioaccessibility of Microencapsulated Carotenoids, Recovered from Tomato Processing Industrial By-Products, Using In Vitro Digestion Model. Lwt 152, 112285. doi:10.1016/j.lwt.2021.112285
Tan, S. P., Kha, T. C., Parks, S. E., Stathopoulos, C. E., and Roach, P. D. (2015). Effects of the Spray-Drying Temperatures on the Physiochemical Properties of an Encapsulated Bitter Melon Aqueous Extract Powder. Powder Technol. 281, 65–75. doi:10.1016/J.POWTEC.2015.04.074
Tilahun, S., Park, D. S., Seo, M. H., Hwang, I. G., Kim, S. H., Choi, H. R., et al. (2018). Prediction of Lycopene and β-carotene in Tomatoes by Portable Chroma-Meter and VIS/NIR Spectra. Postharvest Biol. Technol. 136, 50–56. doi:10.1016/J.POSTHARVBIO.2017.10.007
Turchiuli, C., Jimenez Munguia, M. T., Hernandez Sanchez, M., Cortes Ferre, H., and Dumoulin, E. (2014). Use of Different Supports for Oil Encapsulation in Powder by Spray Drying. Powder Technol. 255, 103–108. doi:10.1016/J.POWTEC.2013.08.026
Universidad Nacional de Colombia (2016). Procedimiento Operativo Estándar: Fibra Dietaría. Bogotá. Available at: https://uniandes-my.sharepoint.com/personal/jf_aldana_uniandes_edu_co/Documents/Proyecto de Grado - IALI/Documentos/5-FIBRA.pdf?CT=1633303259941&OR=ItemsView (Accessed October 3, 2021).
Wu, L., Lv, X., Zhang, Y., Xin, Q., Zou, Y., and Li, X. (2021). Tartrazine Exposure Results in Histological Damage, Oxidative Stress, Immune Disorders and Gut Microbiota Dysbiosis in Juvenile Crucian Carp (Carassius carassius). Aquat. Toxicol. 241, 105998. doi:10.1016/J.AQUATOX.2021.105998
Zhang, C., Ada Khoo, S. L., Chen, X. D., and Quek, S. Y. (2020). Microencapsulation of Fermented Noni Juice via Micro-fluidic-jet Spray Drying: Evaluation of Powder Properties and Functionalities. Powder Technol. 361, 995–1005. doi:10.1016/J.POWTEC.2019.10.098
Žilić, S., Aktağ, I. G., Dodig, D., and Gökmen, V. (2021). Investigations on the Formation of Maillard Reaction Products in Sweet Cookies Made of Different Cereals. Food Res. Int. 144, 110352. doi:10.1016/J.FOODRES.2021.110352
Keywords: β-carotene, functional food products, lycopene, sustainability, total dietary fiber, ultrasound-assisted extraction
Citation: López Bermúdez YN, Aldana Heredia JF, Sánchez-Camargo AdP and Hernández-Carrión M (2022) Valorization Strategies for a By-Product of Organic Tomato Processing as Potential Ingredient in Functional Food Formulations. Front. Food. Sci. Technol. 2:893795. doi: 10.3389/frfst.2022.893795
Received: 10 March 2022; Accepted: 31 May 2022;
Published: 15 July 2022.
Edited by:
Patricia Arcia, Latitud LATU Foundation, UruguayReviewed by:
Bhagwan Sakhale, Dr. Babasaheb Ambedkar Marathwada University, IndiaCopyright © 2022 López Bermúdez, Aldana Heredia, Sánchez-Camargo and Hernández-Carrión. This is an open-access article distributed under the terms of the Creative Commons Attribution License (CC BY). The use, distribution or reproduction in other forums is permitted, provided the original author(s) and the copyright owner(s) are credited and that the original publication in this journal is cited, in accordance with accepted academic practice. No use, distribution or reproduction is permitted which does not comply with these terms.
*Correspondence: María Hernández-Carrión, bS5oZXJuYW5kZXoxQHVuaWFuZGVzLmVkdS5jbw==
†These authors have contributed equally to this work
Disclaimer: All claims expressed in this article are solely those of the authors and do not necessarily represent those of their affiliated organizations, or those of the publisher, the editors and the reviewers. Any product that may be evaluated in this article or claim that may be made by its manufacturer is not guaranteed or endorsed by the publisher.
Research integrity at Frontiers
Learn more about the work of our research integrity team to safeguard the quality of each article we publish.