 Chul-Young Bae1
 Yoori Im1*
 Jonghoon Lee2
 Choong-Shik Park3Miyoung Kim1
 Hojeong Kwon4
 Boseon Kim1Hye ri Park1Chun-Koo Lee1
 Inhee Kim1JeongHoon Kim1
- 1Department of Mediage R&D Center, Corporation Growth Center, Seong-nam, South Korea
- 2Department of AI Laboratory, Moadata, Corporation Growth Center, Seong-nam, South Korea
- 3Department of Smart It, U1 University(Asan Campus), Chungnan-do, South Korea
- 4Department of Global Public Health and Anthropology, New York University Undergraduate, New York, NY, United States
In this work, we used the health check-up data of more than 111,000 subjects for analysis, using only the data with all 35 variables entered. For the prediction of biological age, traditional statistical methods and four AI techniques (RF, XGB, SVR, and DNN), which are widely used recently, were simultaneously used to compare the predictive power. This study showed that AI models produced about 1.6 times stronger linear relationship on average than statistical models. In addition, the regression analysis on the predicted BA and CA revealed similar differences in terms of both the correlation coefficients (linear model: 0.831, polynomial model: 0.996, XGB model: 0.66, RF model: 0.927, SVR model: 0.787, DNN model: 0.998) and R2 values. Through this work, we confirmed that AI techniques such as the DNN model outperformed traditional statistical methods in predicting biological age.
Introduction
Chronological age (CA) is a commonly used indicator of aging. However, life expectancy varies considerably among individuals with equal or similar CAs due to diversity in genotypes, living habits, and environments. An individual aged 50 may have a physical function of those aged 60, and many people look older or younger compared to others at the same CA (even in twins). Therefore, it is well known that CA is not an optimal indicator for the aging progress (Jia et al., 2017).
Therefore, it has been acknowledged that there is an increasing need to obtain various aging-related biomarkers and translate them into statistical models capable of reflecting overall aging status of an individual. Various statistical models have been devised based on cognitive age, physical health age, biological age (BA), work ability index, and vulnerability index, combining physical, physiological, and biochemical parameters using mathematical methods in consideration of the absence of standardized measures for aging in statistical models (Jia et al., 2017).
Among these, BA is a commonly used age estimation on an individual basis. One of the most well-known literatures on aging is BA estimation based on biomarkers identified for high correlation with age (Nakamura et al., 1998; Ingram et al., 2001; Jackson et al., 2003; Bae et al., 2008; Jee et al., 2012; Bae et al., 2013; KYE HWA LEE, 2013; Sebastiani et al., 2017; Horvath and Raj, 2018; Le Goallec and Patel, 2019). The underlying hypothesis for such BA estimation studies is that BA measured in relatively healthy adults better reflects their actual health status than CA does (Thompson and Voss, 2009; Li et al., 2018; Liu et al., 2019).
To predict BA, previous studies have employed traditional statistical methods such as the multiple linear regression (MLR), the principal component analysis (PCA), the Hochschild’s method, and the Klemera and Doubal’s method (KDM), using clinical biomarkers. In particular, statistical methods such as MLR and PCA have been the most popular for BA prediction using clinical biomarkers (Jia et al., 2017; Li et al., 2018; Liu et al., 2019; Liu, 2021).
Recently, numerous papers have been published about BA estimation with application of AI techniques using diverse biomarkers, and they are found to have, in most cases, higher predictive power than conventional statistical methods (Putin et al., 2016; Extracting biological age, 2018; Pyrkov et al., 2018; Gialluisi et al., 2019; Pyrkov and Fedichev, 2019; Rahman and Adjeroh, 2019; Cao et al., 2020; Galkin et al., 2020; Huang et al., 2020; Pei et al., 2020; Rahman et al., 2020; Sagers et al., 2020; Xu et al., 2020; Zhong et al., 2020; Gialluisi et al., 2021; Wang et al., 2021). However, there are few studies that compare AI techniques with traditional statistical methods to construct a BA prediction model using clinical biomarkers. This study was conducted to compare models employing AI and traditional statistical methods in BA prediction using clinical biomarkers that are commonly measured in clinical practice. In addition, this study compared the accuracy of BA prediction between various AI models. Lastly, this study compared the influence of each clinical biomarker on BA prediction between traditional statistical method-based and AI technique-based models.
Methods
Subjects
This study was conducted on 116,829 subjects aged 20 or older, comprising 80,373 men and 36,456 women, who received routine health check-ups from 2015 through 2017 at the university medical centers and community hospitals in Korea. We obtained permission from subjects who visited the hospitals for their annual health check-up to use their data excluding any identifiable items (e.g., name, resident id, etc.,) Informed consent for this was obtained from all participants.
Those who have been found to have severe diseases such as cancer, malignant hypertension, uncontrolled diabetes, and heart, lung, liver, pancreas, and renal failure during health check-ups were excluded in order to comprehend changes in actual BA of each subject in the normal aging process.
Clinical Biomarkers
A routine health check-up included anthropometric measurements, cardiovascular and respiratory functions, and laboratory tests (blood and urine). The height, weight, lean body mass, and body fat were measured by using InBody (Biospace, Korea), a different segmental multi-frequency bioelectrical impedance device.
As for the waist circumference, the thinnest area between the inferior part of the lowest rib and the iliac crest was measured in an upright position. Hip circumference was measured at the level of the widest circumference over the great trochanters.
Blood pressure was measured manually using a sphygmomanometer after resting 5 min in a sitting position. Both forced vital capacity and forced expiratory volume in 1 s were measured by an electronic spirometer two times in a standing position, and better record was taken. Blood and urine samples were collected in the morning after an overnight fasting of longer than 10 h.
To develop BA prediction model, clinical biomarkers used 35 variables in total that are commonly used in the clinical settings and are known to have statistically significant associated with age by the previous studies (Bae et al., 2008; Bae et al., 2013). The anthropometric biomarkers include height (HT), weight (WT), waist circumference (WC), systolic blood pressure (SBP), diastolic blood pressure (DBP), lean body mass (LBM), body fat (BF), forced vital capacity (FVC), and forced expiratory volume in 1 s (FEV1). Other blood biomarkers include lactate dehydrogenase (LDH), creatine phosphokinase (CPK), total cholesterol (TC), high-density lipoproteins cholesterol (HDL-C), triglycerides (TG), total protein (TP), albumin (ALB), alkaline phosphatase (ALP), aspartate aminotransferase (AST), alanine aminotransferase (ALT), gamma-glutamyl transpeptidase (G-GTP), total bilirubin (TB), direct bilirubin (DB), fasting blood sugar (FBS), hemoglobinA1c (HbA1c), creatinine, and blood urea nitrogen (BUN). Urinalysis biomarkers include urine specific gravity (USG) and urine acidity (urine PH, UPH).
Project Pipeline
The project pipeline for this work is as follows. We used 116,829 samples of data and normalized the raw data of 36 markers, composing the dataset of 35 biomarkers excluding age. Then Linear/2nd Polynomial/XGB/RF/SVR/DNN Regression models trained on the final dataset to predict BA. Additionally, we applied the Permutation Feature Importance (PFI) function on each trained model to compute the Feature Importance (Figure 1).
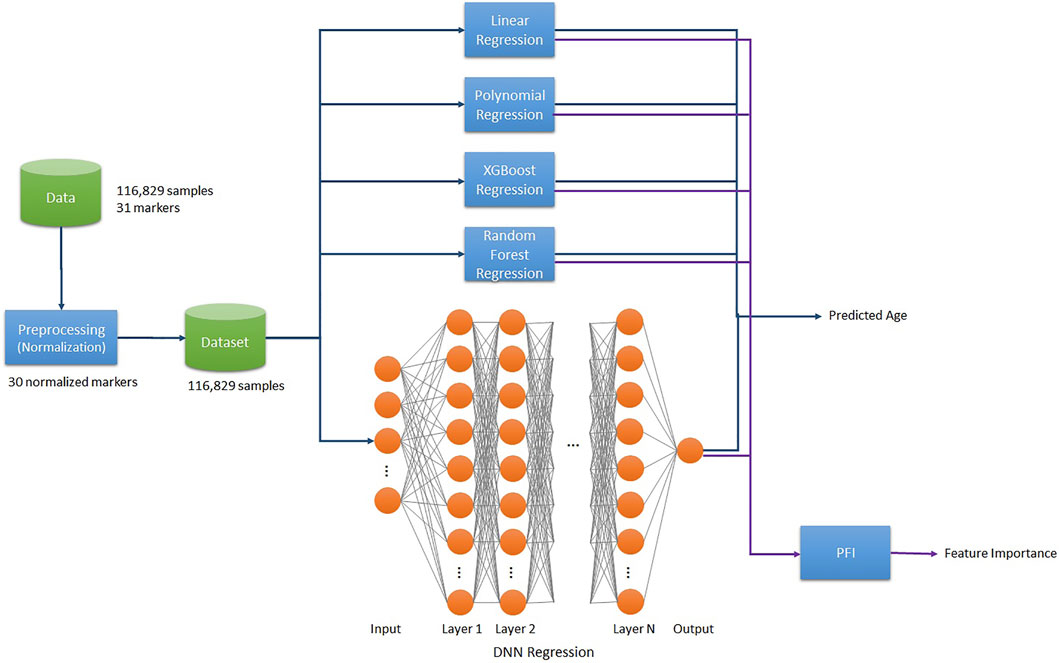
FIGURE 1. Project pipeline.
Statistical Methods and AI Techniques Used in BA Prediction Models
The K-Fold cross-validation was performed to train each model with splitting the dataset into five folds. That is, 105,146 samples out of the total 116,829 samples were used as the training dataset, while 11,683 samples (10%) served as the test dataset. The training and validation procedures were sequentially repeated five times.
Linear Regression Model
Linear regression analysis is an important statistical method for the analysis of medical data as it enables the identification and characterization of relationships among multiple factors (Mamoshina et al., 2018). In particular, polynomial regression analysis analyzes the relationship between two or more independent variables and one dependent variable, expressed as a polynomial as shown in Eq. 1 (Schneider et al., 2010).
In polynomial linear regression analysis, the least squared error estimation is used to produce a determinant as presented in Eq. 2, allowing calculation of the dependent variable Y through the independent variable X (Schneider et al., 2010).
In this paper, polynomial regression model using 30 independent variables was applied, and Y ̂ could be inferred by calculating the regression coefficient β ̂ through application of the training dataset. To evaluate the performance of this model,
2nd Polynomial Regression Model
Nonlinear regression analysis was applied. In doing so, we calculated BA by applying the independent variable X of Eq. 1 (polynomial linear regression), with the addition of the quadratic terms, to Eq. 2. Then,
XGB Regression Model
XGB, a scalable end-to-end tree boosting algorithm, has improved the performance of Gradient Boosting Machine (GBM) by proposing a novel sparsity-aware algorithm and weighted quantile sketch. XGB algorithm also effectively reduced over-fitting (Chen and Guestrin, 2016). XGB algorithm can be useful in developing biomarkers as it can calculate the feature importance, which helps determine the usefulness of each variable. The XGB model can improve efficiency of booster by setting parameters for tree booster. This study was conducted by setting the parameters as shown in Table 1 below, and BA was derived from Eqs 1, 2. Based on these results, was calculated for performance evaluation.

TABLE 1. hyperparameters of XGBoost model.
RF Regression Model
RF regression analysis is an ensemble algorithm that operates by constructing a multitude of decision trees. RF applies bagging randomly to construct sub-trees, resulting in reduction of variance, bias, and noise, thereby making up for shortfalls of decision trees (Breiman, 2001). It consists of numerous randomized sub-trees, and training is run independently. Prediction is done on the basis of voting on the results of each sub-tree to produce an optimal result. As was the case in XGB, RF is also capable of computing the feature importance, making it possible to measure how each variable is useful. As the RF model requires parameters in constructing sub-trees, we set them as shown in Table 2 below.
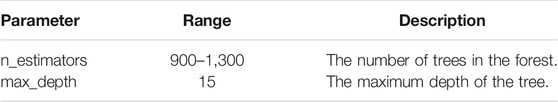
TABLE 2. Hyperparameters of Random Forest model.
SVR Model
Support Vector Regression (SVR) is one of the regression method and uses the same principles as the SVM (Support Vector Machine) for classification. SVR constructs a hyperplane or set of hyperplane in a high-dimensional space that can be used for linear or nonlinear regression. As the SVR model requires parameters in constructing hyperplanes, we set them as shown in Table 3 below.
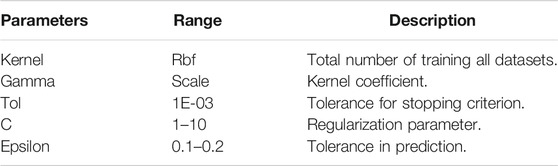
TABLE 3. Hyperparameters of SVR model.
DNN Regression Model
Deep learning solves problems of neural network algorithms and applies multilayer neural networks composition and backpropagation algorithms, allowing training of data with multiple levels of abstraction. It has been widely used in speech recognition, image recognition, object detection, drug discovery, and genomes (LeCun et al., 2015). As for the healthcare field, various deep learning methods, including DNN, Deep Autoencoder, Deep Belief Network (DBN), Deep Boltzmann Machine (DBM), and Recurrent Neural Network (RNN), have been used for public health, medical informatics, pervasive sensing, medical imaging, and bioinformatics (Ravì et al., 2017). This study was conducted by applying the DNN regression technique, widely used for classification and regression analysis as described by the authors (Ravì et al., 2017) who summarized the strengths and weaknesses of each deep learning architecture.
As shown in Figure 2, a DNN model uses the backpropagation algorithm, where the difference between the error and the correct answer is calculated and used to adjust the weight values (LeCun et al., 2015). Similar to the statistical technique, DNN regression defines the mean squared error (MSE) loss function as shown in Eq. 3, and aims to obtain highly accurate results by calculating weights that minimize the MSE. As was the case in abovementioned polynomial regression analysis, the loss function is expressed as a determinant, and gradient descent (GD) is used to find a value that minimizes the error. The MSE is calculated by comparing the outputs and the weights are updated in connection with gradient (error derivative) while going through the backpropagation process (Figure 2). The core operation of DNN regression is to find the weight values that gradually minimize the MSE by repeating the above process.
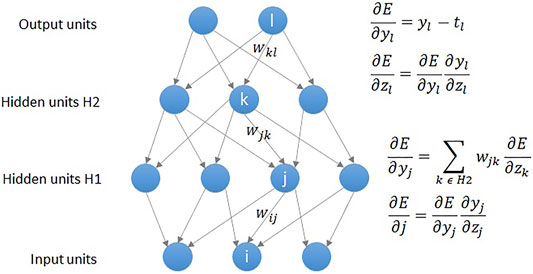
FIGURE 2. Backpropagation: Compare outputs with correct answer to get error derivatives.
We built the neural network for DNN regression by setting the parameters as shown in Table 4 below.
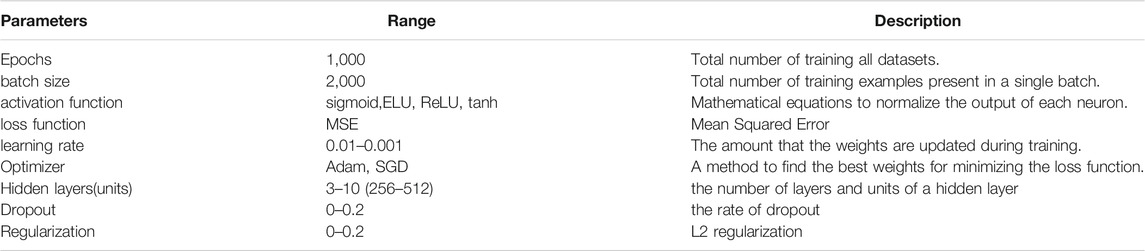
TABLE 4. Hyperparameters of DNN model.
Statistical Analysis
In this work, we used Python version 3.9.0 software with the statistical significance set at p < 0.05. As for the validation of BA prediction accuracy,
Ethical Permission
This study is approved by the Korea Institute of Bioethics Policy (KoNIBP) Electromagnetic Concern Committee (e-IRB) as it was judged to be exempt from examination (confirmation of exemption from examination). All methods were performed in accordance with the relevant ethical guidelines and regulations.
Results
Characteristics of Study Subjects and Correlation Between Age and Biomarkers
The data obtained from routine health check-ups (from 2015 through 2017) included 116,829 subjects consisting of 80,373 males and 36,456 females. Mean age was 45.51 ± 10.13 years, and the details of data analysis are presented in Table 5.
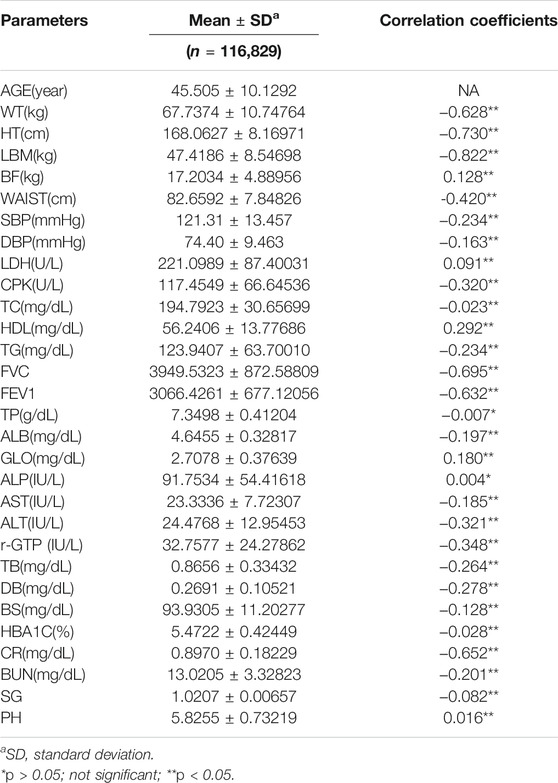
TABLE 5. Pearson correlation coefficients between age and biomarkers.
To investigate the correlation between CA and each clinical biomarker, we performed the Pearson correlation analysis between age and biomarkers. The statistical significance of clinical biomarkers was set at p < 0.05. With regard to the correlation between the variables in this study, the variables exhibiting the strongest correlation were LBM (r = −0.822, p < 0.001), HT(r = −0.730, p < 0.001), and FVC(r = −0.695, p < 0.001) in that order (Table 5).
Diagnosis of BA by Regression Models
Machine learning by optimizing the hyperparameters of the regression model was performed to evaluate the adequacy of the calculated BA. Our evaluation consists of an inner-loop step, which is optimizing the hyperparameter of the regression models, and the outer cross-validation step, as shown in Figure 3. Except for the linear regression and the 2nd-order nonlinear regression model, we got the optimal hyperparameters through estimated
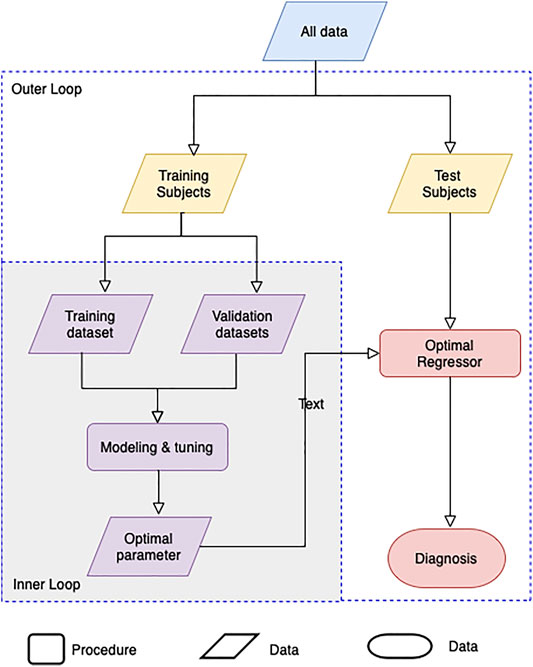
FIGURE 3. Schematic workflow for the construction of BA regression models
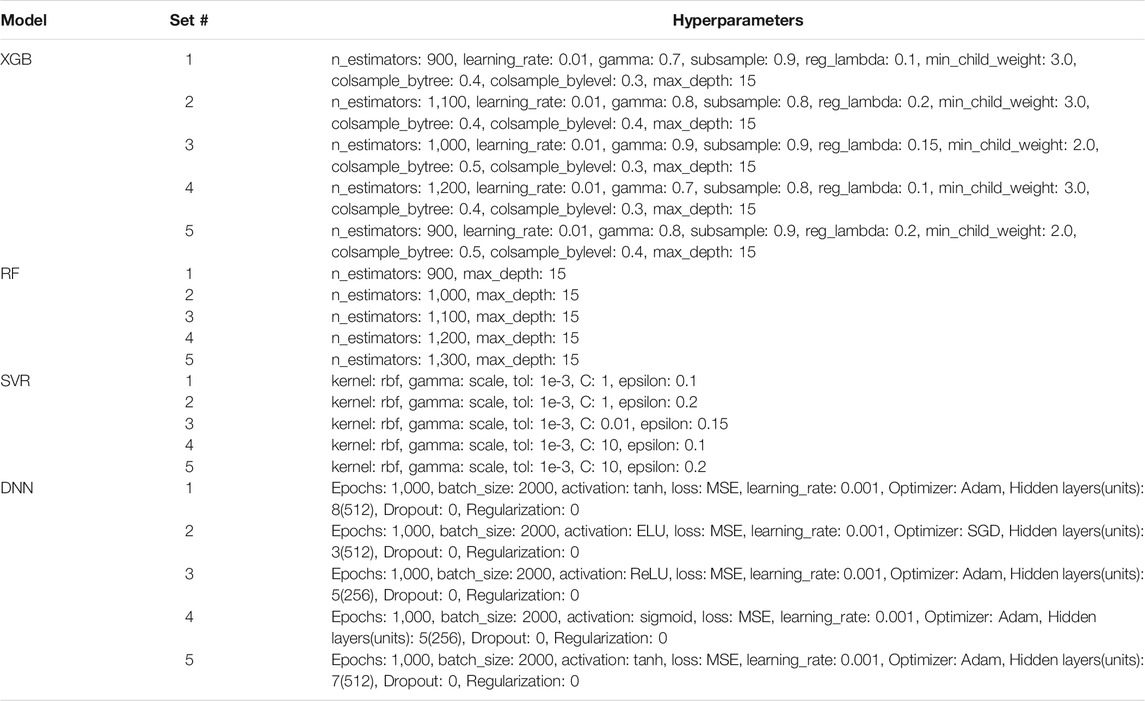
TABLE 6. The example of hyperparameters subsets for machine learning models.
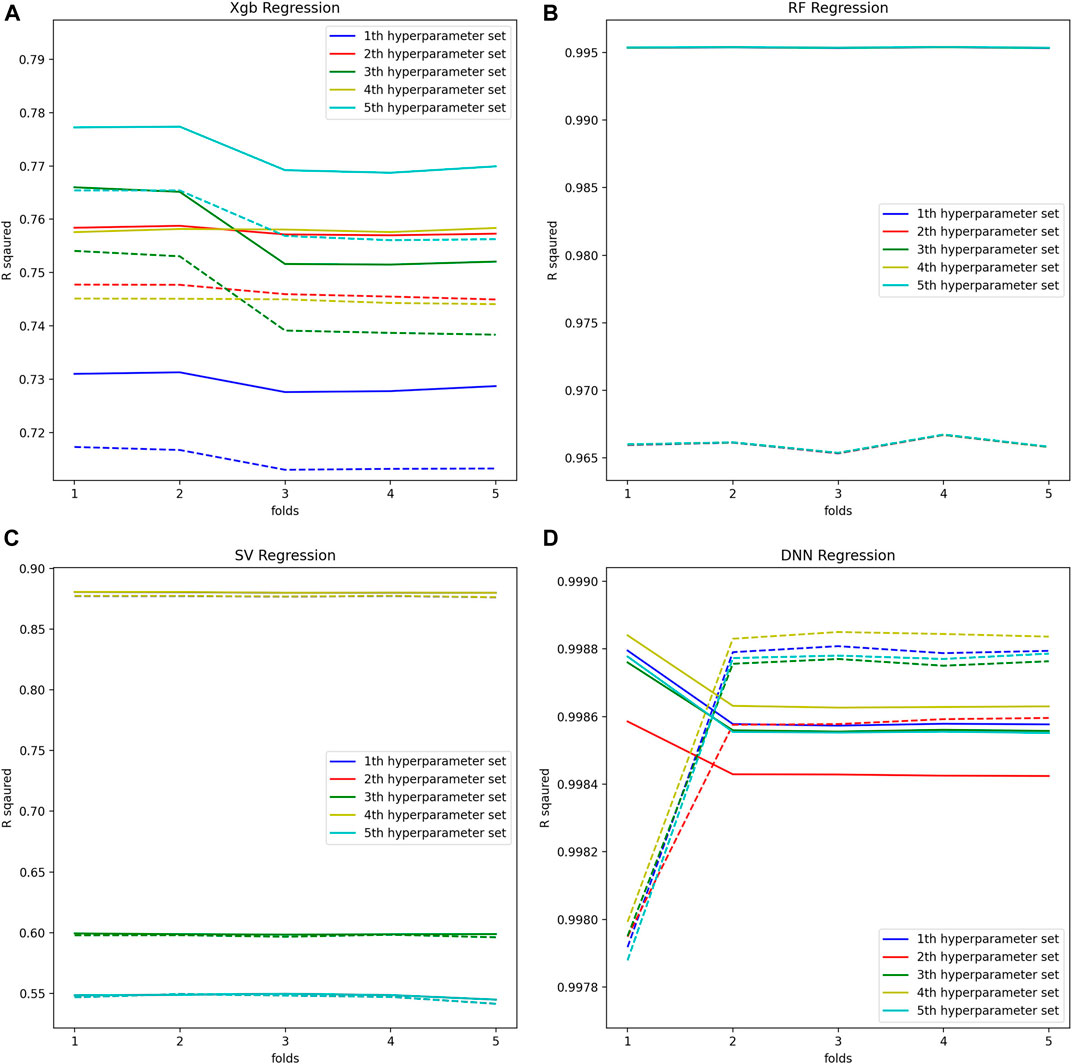
FIGURE 4. (A) Optimal hyperparameters of XGB Regression model, (B) Optimal hyperparameters of RF Regression model, (C) Optimal hyperparameters of SV Regression model, (D) Optimal hyperparameters of DNN Regression model.
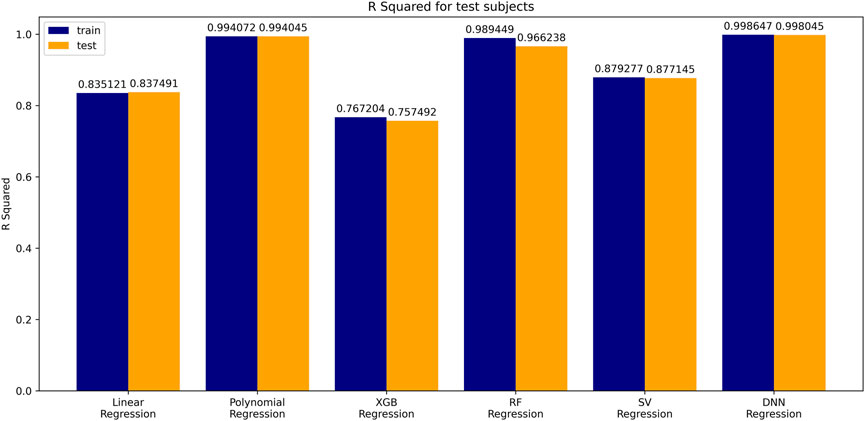
FIGURE 5. Comparison of train/test R2.
Comparison of Six Age Prediction Models Used in AI
The coefficient of determination (
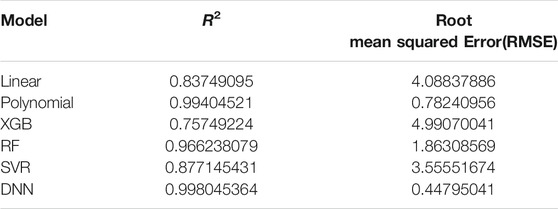
TABLE 7. Coefficient of determination and RMSE in 6 age prediction models.
The Regression Between CA and BA
A simple linear regression analysis was performed to find out the linear relationship between the predicted BA and CA. We applied a conventional statistical method, instead of a machine learning technique, in investigating a linear relationship in each model. As shown in Table 8, the linear regression analysis revealed that AI models yielded higher correlation coefficients than statistical models. In particular, the correlation coefficient in the DNN regression model was about 0.99817, exhibiting a stronger linear relationship than any others. The linear relationships have been clearly confirmed through the observation of both regression analysis and distribution of BA and CA, as illustrated in Figure 6. In addition, AI models resulted in smaller RMSE values than traditional regression analysis models, implying better BA prediction accuracy.
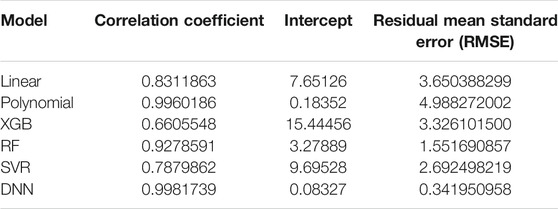
TABLE 8. Relation between chronological age and biological age by regression analysis.
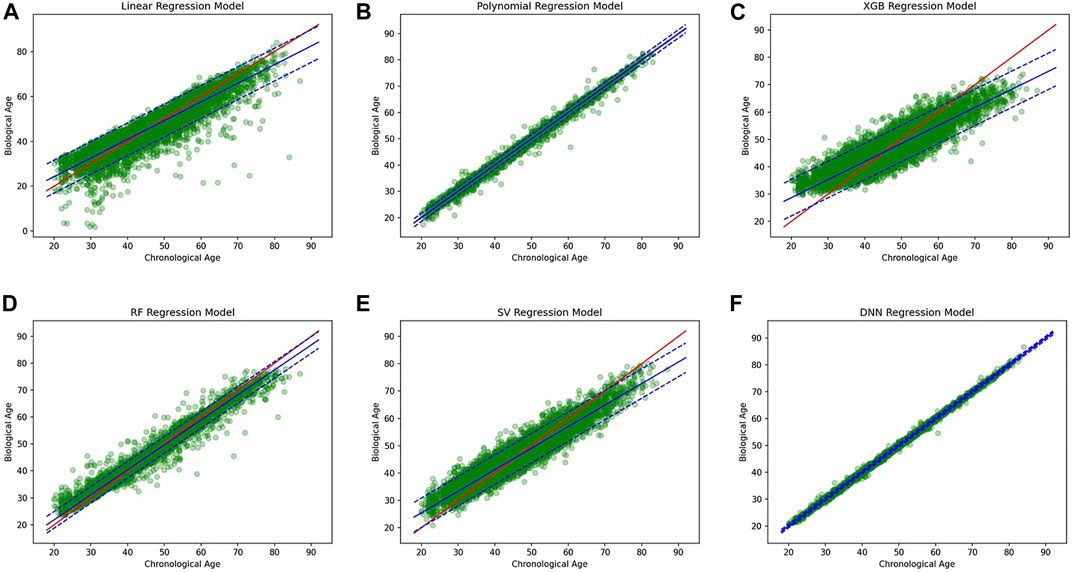
FIGURE 6. (A) Linear regression model, (B) polynomial regression model, (C) XGBoost regression model, (D) Random forest regression model, (E) Support vector regression model, (F) DNN regression model.
Comparison of PFI Scores Between Six Age Prediction Models
Figure 7show PFI scores of six BA prediction models. With regard to traditional models, a small number of variables had the effects on BA prediction. However, almost all variables had the effects in the case of AI models. For instance, it was CCR and CR that had the most effects on BA prediction in the 2nd polynomial model. By contrast, all features in the DNN model affected BA prediction with the mean value of PFI score recording 0.39, higher than any other models.
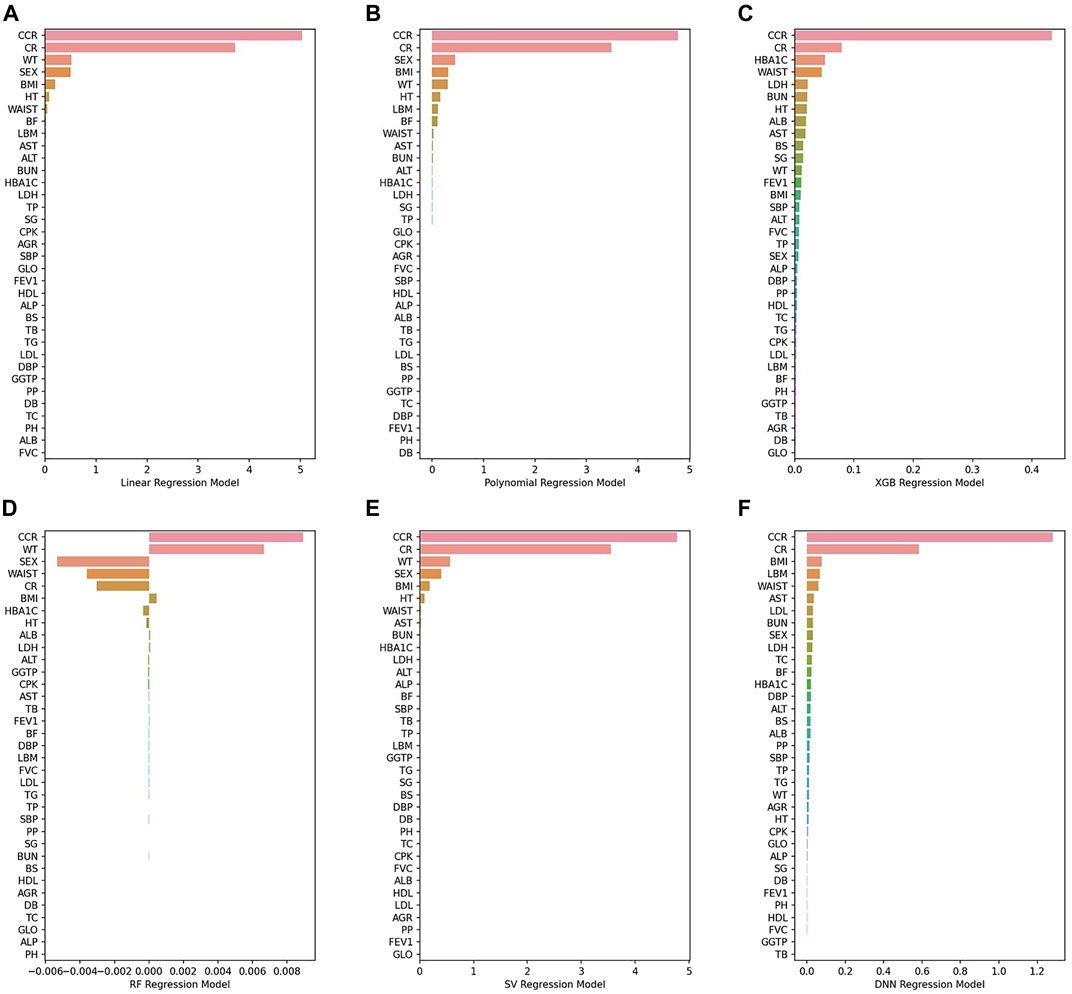
FIGURE 7. (A) Linear regression model, (B) 2nd polynomial regression model, (C) XGBoost regression model, (D) Random forest regression model, (E) Support vector regression model, (F) DNN regression model.
Figure 8shows the top 10 features that had the greatest impact on BA prediction. Regarding the variables that six models have in common: WT is shared by all four models. SEX, BMI, HT, and AST are shared by five models. CCR, CR, and WAIST are shared across all six models. The 2nd polynomial model that achieved better result among the statistical methods, the XGB model from the decision-tree-based ensemble series, and the DNN model from deep learning share the same three features shared by all five models (CCR, CR, and WAIST) with the addition of one more feature, AST.
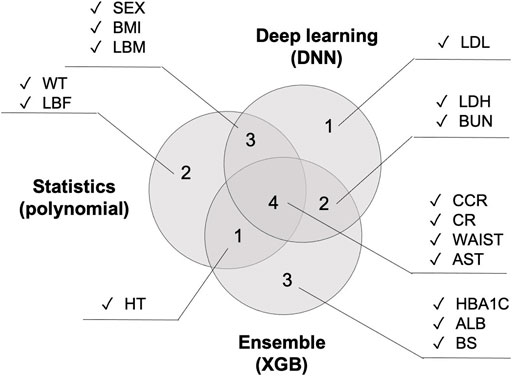
FIGURE 8. Top ten most important features in all.
Discussion
In this work, we applied traditional regression methods (Linear, Polynomial) and ensemble methods (RF, XGB), and non-linear methods (SVR, DNN) for BA prediction. We also analyzed which regression model is proper in prediction of BA by estimating
According to the results of our experiments, it was confirmed that a nonlinear or an ensemble regression model is more suitable than a linear regression model. In order to explore the characteristics of the biomarkers we used, we checked the mean of biomarkers by age as shown in Table 9. As a result, it was confirmed that there are more nonlinear characteristics than linear characteristics. Therefore, it is reasonable that a nonlinear model is suitable as a regression model for BA due to many biomarkers of nonlinear characteristics. Also, among nonlinear models, the DNN model seems to be the most robust model in BA. It is caused by a nonlinear transformation that occurs while passing through the activation functions of several hidden layers. Specifically, it caused huge performance issues depending on the activation function chosen. Therefore, it is important to choose an activation function to build a good DNN regression model.

TABLE 9. Characteristics of mean of the biomarkers by age.
Regarding
This study could make up for the disadvantages of DNN regression model, mostly concerned about lack of explainability, by comparing the effects of each variable on BA prediction using PFI. Recently, numerous studies on explainable (XAI) have been carried out in the field of DNN regression model, using the feature importance. If researchers keep making progress on such studies, we can expect to see realization of explainable AI (XAI) services that are interpretable and explainable.
In this work, we used the health check-up data of more than 111,000 subjects for analysis, using only the data with all 35 variables entered. To compare BA prediction accuracy, we implemented both AI techniques and traditional statistical methods. It is noteworthy in that this study is the first to make such an attempt.
The key achievements of this study are as follows. First, this study compared and analyzed both traditional statistical methods and popular AI techniques to predict BA, finding out that AI models (especially the DNN regression model) outperformed statistical models in prediction accuracy. Secondly, BA prediction accuracy of the DNN model in this study was better than similar studies conducted before. Third, we compared and analyzed the effects of biomarkers on BA prediction accuracy by using a new technique like PFI score.
To conclude, this work confirmed that AI techniques such as the DNN model outperformed traditional statistical methods in predicting BA. If technical development continues on such areas as explainable AI (XAI), AI techniques will be more widely applied across medical and health management fields.
Data Availability Statement
The raw data supporting the conclusions of this article will be made available by the authors, without undue reservation.
Ethics Statement
The studies involving human participants were reviewed and approved by International St Mary’s Hospital. The patients/participants provided their written informed consent to participate in this study.
Author Contributions
CB and YI designed the computational experiments and analyzed the results. JL and CP performed calculations using statistical methods and AI techniques. MK, BK, HK, HP, and CL performed all other calculations, theoretical modeling, and statistical analysis of all the results. All authors reviewed the article.
Conflict of Interest
Author JL was employed by the company Moadata, Corporation Growth Center.
The remaining authors declare that the research was conducted in the absence of any commercial or financial relationships that could be construed as a potential conflict of interest.
Publisher’s Note
All claims expressed in this article are solely those of the authors and do not necessarily represent those of their affiliated organizations, or those of the publisher, the editors, and the reviewers. Any product that may be evaluated in this article, or claim that may be made by its manufacturer, is not guaranteed or endorsed by the publisher.
References
Adadi, A., and Berrada, M. (2018). Peeking inside the Black-Box: A Survey on Explainable Artificial Intelligence (XAI). (IF: 4.098). IEEE Access 6, 52138. doi:10.1109/ACCESS.2018.2870052
Bae, C.-Y., Kang, Y. G., Kim, S., Cho, C., Kang, H. C., Yu, B. Y., et al. (2008). Development of Models for Predicting Biological Age (BA) with Physical, Biochemical, and Hormonal Parameters. Arch. Gerontol. Geriatr. 47 (2), 253–265. doi:10.1016/j.archger.2007.08.009
Bae, C.-Y., Kang, Y. G., Piao, M.-H., Cho, B., Cho, K. H., Park, Y. K., et al. (2013). Models for Estimating the Biological Age of Five Organs Using Clinical Biomarkers that Are Commonly Measured in Clinical Practice Settings. Maturitas 75 (3), 253–260. doi:10.1016/j.maturitas.2013.04.008
Bzdok, D., Altman, N., and Krzywinski, M. (2018). Statistics versus Machine Learning. Nat. Methods 15 (4), 233–234. doi:10.1038/nmeth.4642
Cao, J., Shi, X., Gurav, D. D., Huang, L., Su, H., Li, K., et al. (2020). Metabolic Fingerprinting on Synthetic Alloys for Medulloblastoma Diagnosis and Radiotherapy Evaluation. Adv. Mater. 32 (23), 2000906. doi:10.1002/adma.202000906
Chen, T., and Guestrin, C. (2016). “XGBoost,” in Proceedings of the 22nd ACM SIGKDD International Conference on Knowledge Discovery and Data Mining. doi:10.1145/2939672.2939785
Extracting Biological Age from Biomedical Data via Deep Learning: Too Much of a Good Thing? (IF : 4.122) Nature. 2018;8(1):5210. doi:10.1038/s41598-018-23534-9
Galkin, F., Mamoshina, P., Aliper, A., de Magalhães, J. P., Gladyshev, V. N., and Zhavoronkov, A. (2020). Biohorology and Biomarkers of Aging: Current State-Of-The-Art, Challenges and Opportunities. Ageing Res. Rev. 60, 101050. doi:10.1016/j.arr.2020.101050
Gialluisi, A., Di Castelnuovo, A., Costanzo, S., Bonaccio, M., Persichillo, M., Magnacca, S., et al. (2021). Exploring Domains, Clinical Implications and Environmental Associations of a Deep Learning Marker of Biological Ageing. Eur. J. Epidemiol. Online ahead of print. doi:10.1007/s10654-021-00797-7
Gialluisi, A., Di Castelnuovo, A., Donati, M. B., De Gaetano, G., and Iacoviello, L.Moli-sani Study Investigators (2019). Machine Learning Approaches for the Estimation of Biological Aging: the Road Ahead for Population Studies. Front. Med. 6, 146. doi:10.3389/fmed.2019.00146
Hannum, G., Guinney, J., Zhao, L., Zhang, L., Hughes, G., Sadda, S. V., et al. (2013). Genome-wide Methylation Profiles Reveal Quantitative Views of Human Ageing Rates. (IF: 15.584). Mol. Cel 49, 359. doi:10.1016/j.molcel.2012.10.016
Horvath, S. (2013). DNA Methylation Age of Human Tissues and Cell Types. (IF: 10.806). Genome Biol. 14, R115. doi:10.1186/gb-2013-14-10-r115
Horvath, S., and Raj, K. (2018). DNA Methylation-Based Biomarkers and the Epigenetic Clock Theory of Ageing. Nat. Rev. Genet. 19 (6), 371–384. doi:10.1038/s41576-018-0004-3
Huang, L., Wang, L., Hu, X., Chen, S., Tao, Y., Su, H., et al. (2020). Machine Learning of Serum Metabolic Patterns Encodes Early-Stage Lung Adenocarcinoma. Nat. Commun. 11 (1), 3556. doi:10.1038/s41467-020-17347-6
Ingram, D., Nakamura, E., Smucny, D., Roth, G. S., and Lane, M. A. (2001). Strategy for Identifying Biomarkers of Aging in Long-Lived Species. Exp. Gerontol. 36 (7), 1025–1034. doi:10.1016/s0531-5565(01)00110-3
Jackson, S. H. D., Weale, M. R., and Weale, R. A. (2003). Biological Age-What Is it and Can it Be Measured? Arch. Gerontol. Geriatr. 36 (2), 103–115. doi:10.1016/s0167-4943(02)00060-2
Jee, H., Jeon, B. H., Kim, Y. H., Kim, H.-K., Choe, J., Park, J., et al. (2012). Development and Application of Biological Age Prediction Models with Physical Fitness and Physiological Components in Korean Adults. Gerontology 58 (4), 344–353. doi:10.1159/000335738
Jia, L., Zhang, W., and Chen, X. (2017). Common Methods of Biological Age Estimation. Clin. Interv. Aging 12, 759–772. doi:10.2147/cia.s134921
Kye Hwa Lee (2013). Search for Pattern of Aging by Analysis of Biomarker of Aging. A Thesis of the Master’s Degree. Seoul: The Department of Biomedical Sciences, Seoul National University College of Medicine.
Le Goallec, A., and Patel, C. J. (2019). Age-dependent Co-dependency Structure of Biomarkers in the General Population of the United States. Aging 11 (5), 1404–1426. doi:10.18632/aging.101842
LeCun, Y., Bengio, Y., and Hinton, G. (2015). Deep Learning. (IF: 43.070). Nature 521, 436. doi:10.1038/nature14539
Li, X., Zhang, J., Sun, C., Zhang, Y., Cai, R., Fu, S., et al. (2018). Application of Biological Age Assessment of Chinese Population in Potential Anti-ageing Technology. Immun. Ageing 15, 33. doi:10.1186/s12979-018-0140-9
Liu, Z., Chen, X., Gill, T. M., Ma, C., Crimmins, E. M., and Levine, M. E. (2019). Associations of Genetics, Behaviors, and Life Course Circumstances with a Novel Aging and Healthspan Measure: Evidence from the Health and Retirement Study. Plos Med. 16 (6), e1002827. doi:10.1371/journal.pmed.1002827
Liu, Z. (2021). Development and Validation of 2 Composite Aging Measures Using Routine Clinical Biomarkers in the Chinese Population: Analyses from 2 Prospective Cohort Studies. The Journals Gerontol. Ser. A 76 (9), 1627–1632. doi:10.1093/gerona/glaa238
Mamoshina, P., Kochetov, K., Putin, E., Cortese, F., Aliper, A., Lee, W-S., et al. (2018). Population Specific Biomarkers of Human Aging: A Big Data Study Using South Korean, Canadian, and Eastern European Patient Populations. (IF: 4.711). J. Gerontol. A. Biol. Sci. Med. Sci. 73, 1482. doi:10.1093/gerona/gly005
Nakamura, E., Lane, M. A., Roth, G. S., and Ingram, D. K. (1998). A Strategy for Identifying Biomarkers of Aging: Further Evaluation of Hematology and Blood Chemistry Data from a Calorie Restriction Study in Rhesus Monkeys. Exp. Gerontol. 33 (5), 421–443. doi:10.1016/s0531-5565(97)00134-4
Pei, C., Liu, C., Wang, Y., Cheng, D., Li, R., Shu, W., et al. (2020). FeOOH@Metal-Organic Framework Core-Satellite Nanocomposites for the Serum Metabolic Fingerprinting of Gynecological Cancers. Angew. Chem. Int. Ed. 59 (27), 10831–10835. doi:10.1002/anie.202001135
Peters, M. J., Joehanes, R., Pilling, L. C., Schurmann, C., Conneely, K. N., Powell, J., et al. (2015). The Transcriptional Landscape of Age in Human Peripheral Blood. Nat. Commun. 6, 8570. doi:10.1038/ncomms9570
Putin, E., Mamoshina, P., Aliper, A., Korzinkin, M., Moskalev, A., Kolosov, A., et al. (2016). Deep Biomarkers of Human Aging: Application of Deep Neural Networks to Biomarker Development (IF : 5.515). Aging (Albany NY) 8 (5), 1021–1030. doi:10.18632/aging.100968
Pyrkov, T. V., and Fedichev, P. O. (2019). “Biological Age Is a Universal Marker of Aging, Stress, and Frailty,” in Biomarkers of Human Aging (Springer, Cham: Springer International Publishing), 23–36.
Pyrkov, T. V., Slipensky, K., Barg, M., Kondrashin, A., Zhurov, B., Zenin, A., et al. (2018). Extracting Biological Age from Biomedical Data via Deep Learning: Too Much of a Good Thing? Sci. Rep. 8 (1), 5210. doi:10.1038/s41598-018-23534-9
Rahman, S. A., Giacobbi, P., Pyles, L., Mullett, C., Doretto, G., and Adjeroh, D. A. (2020). Deep Learning for Biological Age Estimation (IF: 9.101). Brief. Bioinform. 22, bbaa021. doi:10.1093/bib/bbaa021
Rahman, S. A., and Adjeroh, D. A. (2019). Deep Learning Using Convolutional LSTM Estimates Biological Age from Physical Activity. Sci. Rep. 9 (1), 11425. doi:10.1038/s41598-019-46850-0
Ravì, D., Wong, C., Deligianni, F., Berthelot, M., Andreu-Perez, J., Lo, B., et al. (2017). Deep Learning for Health Informatics. (IF: 4.217. IEEE J. Biomed. Health Inform. 21, 4. doi:10.1109/JBHI.2016.2636665
Sagers, L., Melas-Kyriazi, L., Patel, C. J., and Manrai, A. K. (2020). Prediction of Chronological and Biological Age from Laboratory Data. Aging 12 (9), 7626–7638. doi:10.18632/aging.102900
Schneider, A., Hommel, G., and Blettner, M. (2010). Linear Regression Analysis: Part 14 of a Series on Evaluation of Scientific Publications. (IF: 4.469). Deutsches Arzteblatt Int. 107, 776. doi:10.3238/arztebl.2010.0776
Sebastiani, P., Thyagarajan, B., Sun, F., Schupf, N., Newman, A. B., Montano, M., et al. (2017). Biomarker Signatures of Aging. Aging cell 16 (2), 329–338. doi:10.1111/acel.12557
Thompson, H. J., and Voss, J. G. (2009). Health- and Disease-Related Biomarkers in Aging Research. Res. gerontological Nurs. 2 (2), 137–148. doi:10.3928/19404921-20090401-09
Wang, C., Guan, X., Bai, Y., Feng, Y., Wei, W., Li, H., et al. (2021). A Machine Learning-Based Biological Aging Prediction and its Associations with Healthy Lifestyles: the Dongfeng-Tongji Cohort. Ann. N.Y. Acad. Sci. Online ahead of print. doi:10.1111/nyas.14685
Xu, W., Lin, J., Gao, M., Chen, Y., Cao, J., Pu, J., et al. (2020). Rapid Computer‐Aided Diagnosis of Stroke by Serum Metabolic Fingerprint Based Multi‐Modal Recognition. Adv. Sci. 7 (21), 2002021. doi:10.1002/advs.202002021
Zhavoronkov, A., Mamoshina, P., Vanhaelen, Q., Scheibye-Knudsen, M., Moskalev, A., and Aliper, A. (2019). Artificial Intelligence for Aging and Longevity Research: Recent Advances and Perspectives. Ageing Res. Rev. 49, 49–66. doi:10.1016/j.arr.2018.11.003
Keywords: biological age (BA), artifitial intelligence, age prediction model, clinical biomarkers, traditional statistical methods
Citation: Bae C-Y, Im Y, Lee J, Park C-S, Kim M, Kwon H, Kim B, Park Hr, Lee C-K, Kim I and Kim J (2021) Comparison of Biological Age Prediction Models Using Clinical Biomarkers Commonly Measured in Clinical Practice Settings: AI Techniques Vs. Traditional Statistical Methods. Front. Anal. Sci. 1:709589. doi: 10.3389/frans.2021.709589
Received: 14 May 2021; Accepted: 21 October 2021;
Published: 10 December 2021.
Edited by:
Liang Qiao, Fudan University, ChinaReviewed by:
Ruo-Can Qian, East China University of Science and Technology, ChinaKun Qian, Shanghai Jiao Tong University, China
Copyright © 2021 Bae, Im, Lee, Park, Kim, Kwon, Kim, Park, Lee, Kim and Kim. This is an open-access article distributed under the terms of the Creative Commons Attribution License (CC BY). The use, distribution or reproduction in other forums is permitted, provided the original author(s) and the copyright owner(s) are credited and that the original publication in this journal is cited, in accordance with accepted academic practice. No use, distribution or reproduction is permitted which does not comply with these terms.
*Correspondence: Yoori Im, imyoori@mediage.co.kr