 Haile Mekonnen Fenta
 Ding-Geng Chen
 Temesgen T. Zewotir
 Najmeh Nakhaei Rad
94% of researchers rate our articles as excellent or good
Learn more about the work of our research integrity team to safeguard the quality of each article we publish.
Find out more
ORIGINAL RESEARCH article
Front. Public Health , 22 January 2025
Sec. Children and Health
Volume 13 - 2025 | https://doi.org/10.3389/fpubh.2025.1408680
Background: Different strategies have been developed to minimize under-five mortality (U5M) in sub-Saharan African (sSA) countries; however, it is still a major health concern for children in the region. Spatiotemporal modeling is important for areal data collected over time. However, when the number of time points and spatial areas is large and the areas are disconnected, fitting the model becomes computationally complex because of the high number of required parameters to be estimated. Therefore, the main aim of this study is to adopt a spatiotemporal dynamic model that includes the confounding effects between time, space, and their interactions with fixed covariates, with a special emphasis on U5M across disconnected sSA countries.
Method: We used nationally publicly representative Demographic and Health Survey (DHS) data for the period from 2000 to 2020. Bayesian spatiotemporal hierarchical modeling with an integrated nested Laplace approximation (INLA) program was used to model the spatiotemporal distribution of U5M among children across 37 districts located in four disconnected sSA regions: Ethiopia, Nigeria, Zimbabwe, and Ghana.
Results: A total of 170,356 under-five children from 37 districts were considered, and 15,467 died before the age of five. The relative risk of U5M in the first DHS was 2.02, which sharply decreased to 0.5 in the recent phase. The proportion of improved access to water, sanitation, clean fuel use, urbanization, and access to health facilities in the district had a significant negative association with U5M. The higher the proportion of these covariates, the lower is the prevalence of childhood mortality.
Conclusion: This study revealed evidence of strong spatial, temporal, and interaction effects that influence under-five mortality risk across districts. Improving the women’s literacy index, access to improved water, the use of clean fuel, and the wealth index are associated with an improvement in the risk of mortality among under-five children across the districts. Districts in Nigeria and Ethiopia have the highest risk of U5M; hence, districts in these countries require special attention.
Under-five mortality (U5M) is the probability that a certain child will die before celebrating the age of five. This is considered one of the benchmarks of a given country’s health indicators and progress toward the achievement of development goals (1, 2). In 1990, the World Summit for Children set the goal of reducing U5M births by a third (70 per 1,000 live) between 1990 and 2000 (3). This was approved by the Millennium Development Goal (MDG) 4, which proposed a two-thirds reduction between 1990 and 2015 (4). As part of the Sustainable Development Goals (SDG), target 3.2 seeks to end preventable under-five child deaths and reduce the U5M rate to 25 per 1,000 live births by 2030 (5). Between 1990 and 2015, a 53% reduction in U5M was obtained globally (1, 6), but the lowest reduction was recorded in sub-Saharan African (sSA) countries. The international development goal benchmark on the U5M has improved over time owing to the accessibility of data and increased advanced methodology. In all countries, the burden of U5M is expected to be concentrated in some districts over time; identifying these highly concentrated areas and directing suitable interventions to these areas will accelerate national U5M reductions to ensure effective resource allocation.
The spatiotemporal models have become increasingly common in different areas of applications, such as public health and medicine, epidemiology, energy research, environmental sciences (7, 8), etc. To describe the pattern of disease counts and identify the hot/cold spot areas of the incidence level as well as time trends, spatiotemporal disease mapping models are commonly employed (9, 10). Moreover, in spatial and spatiotemporal statistics, the spatial dependency between neighboring regions should be properly defined prior to the analysis. The intrinsic conditional autoregressive (ICAR) model is a widely used approach for specifying spatial dependency (9). In the ICAR model, the map comprises nodes and edges that represent the respective areas and their neighboring relationships (11). In connected maps, all the prior nodes are connected, but sometimes a disconnected graph can arise when there are edges and nodes with no neighbors or when the study areas are split with subgraphs (11). There is limited literature on the specification of the ICAR approach for disconnected graphs, and few researchers have highlighted the situation of ICAR in disconnected regions (11, 12). We employed these techniques using childhood under-five mortality in four sSA-disconnected countries (Ethiopia, Ghana, Nigeria, and Zimbabwe). Bayesian framework approaches have been used, including parametric and non-parametric (13, 14) formulations of spatial areas, time trends, and space–time interactions. The parameter estimates were obtained from Markov chain Monte Carlo (MCMC) algorithms, which are computationally expensive and might also induce Monte Carlo error in parameter estimates, especially for space–time interaction effects (15, 16). As a result, to compute the posterior marginals of all parameters of interest, a new approach called the integrated nested Laplace approximation (INLA) was developed (17), which has a short computational time and is also more effective (18). Many studies on the spatial and temporal distribution of U5M have been conducted (1, 3, 19–22); however, their conclusions were limited because they failed to account for spatial, temporal, and spatiotemporal random effects with covariates. Often, in disease mapping, we assume that the graph is connected, meaning that all nodes connect to at least one other node. However, disconnected graphs can arise when there is free space between regions (islands with no neighbors or when the study region is split), resulting in separate subgraphs. Another important aspect is that using INLA for disconnected regions has a lower error than using separated regions (12, 23). We also aimed to find an overall estimate of the under-five mortality across the four sSA countries. This is because, in the spatiotemporal context, the covariates can exhibit temporal patterns in each area and spatial patterns in each year. As the model includes both spatial and temporal random effects, along with interaction terms, the source of confounding covariates may be temporal, spatial, or their interaction. Therefore, in this study, we adopt a model that accounts for spatiotemporal models with covariates and temporal, spatial, and spatiotemporal random effects to estimate the U5M rate across the districts of four disconnected countries in sSA.
This study used the nationally representative Demographic and Health Survey (DHS) dataset, mainly conducted in low-income countries1 and shapefiles of administrative districts.2 In the DHS, multistage sampling was used to select the sample for each survey from the countries included in this analysis. The first step of the sampling procedure involved the selection of clusters (enumeration areas, or EAs), followed by systematic household sampling within the selected EA. The number of clusters is the first stage, which is selected from the list of EAs created in the recent population census of each country and households that are randomly selected in each EAs. From the selected households, women aged 15–49 years were selected for in-depth interviews (24). The DHS questionnaire was revised over different phases: the first phase DHS (1997–2003), second phase (2004–2008), third phase (2009–2013), fourth phase (2014–2018), and the most recent DHS, eighth phase (2019–2023), to observe the differences in the spatial, temporal, and spatiotemporal prevalence and associated factors of the U5M rate across districts in the study areas.
The DHS contains the population size of each country/district, with different geospatial covariates. The DHS has two-stage designs, and the number of clusters is the first stage, which is selected from the list of enumeration areas (EAs) created in the recent population census of each country. Households were randomly selected in each EA. From the selected households, women aged 15–49 years were selected for in-depth interviews (24). The sSA is a portion of the African continent and consists of 49 countries, including Ethiopia, Ghana, Nigeria, and Zimbabwe (25). For this study, we retained the DHS data collected in sSA countries that had at least four surveys representative at a sub-national (district, region) level, with a consistent set of district boundaries across DHS surveys. This requirement is very important for pooling information from different surveys across time. Moreover, when district boundaries changed over time across the surveys, we used the location of clusters (GPS) to relocate them into coherent district units. This led us to select 16 surveys conducted in four disconnected sSA countries (Ethiopia, Nigeria, Ghana, and Zambia) between 2000 and 2020. Birth record files of under-five children from the sSA countries, which consisted of data on the full birth history of all reproductive women interviewed and information on health indicators of fertility and mortality rates, were used (Figure 1). Figure 2 shows the locations of 1,310, 2,230, 3,287, and 2,632 clusters in the four disconnected sSA countries over four different DHS data collection periods.
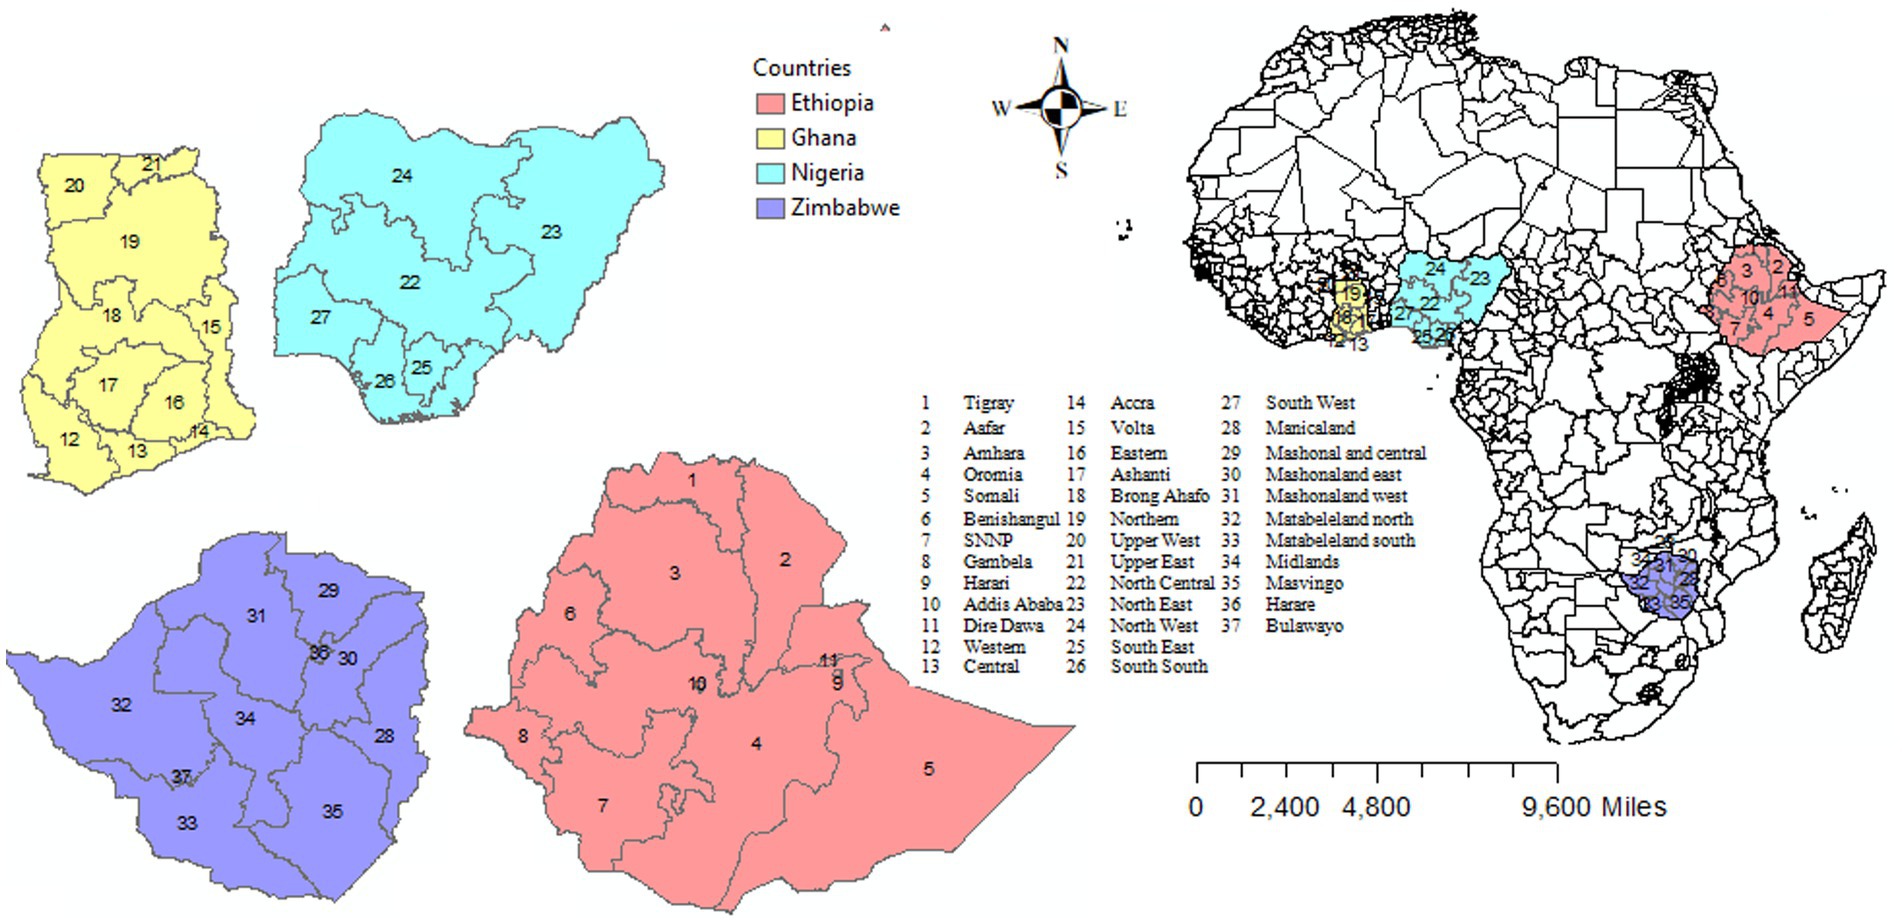
Figure 1. Map of eligible sub-Saharan African countries included in the study.
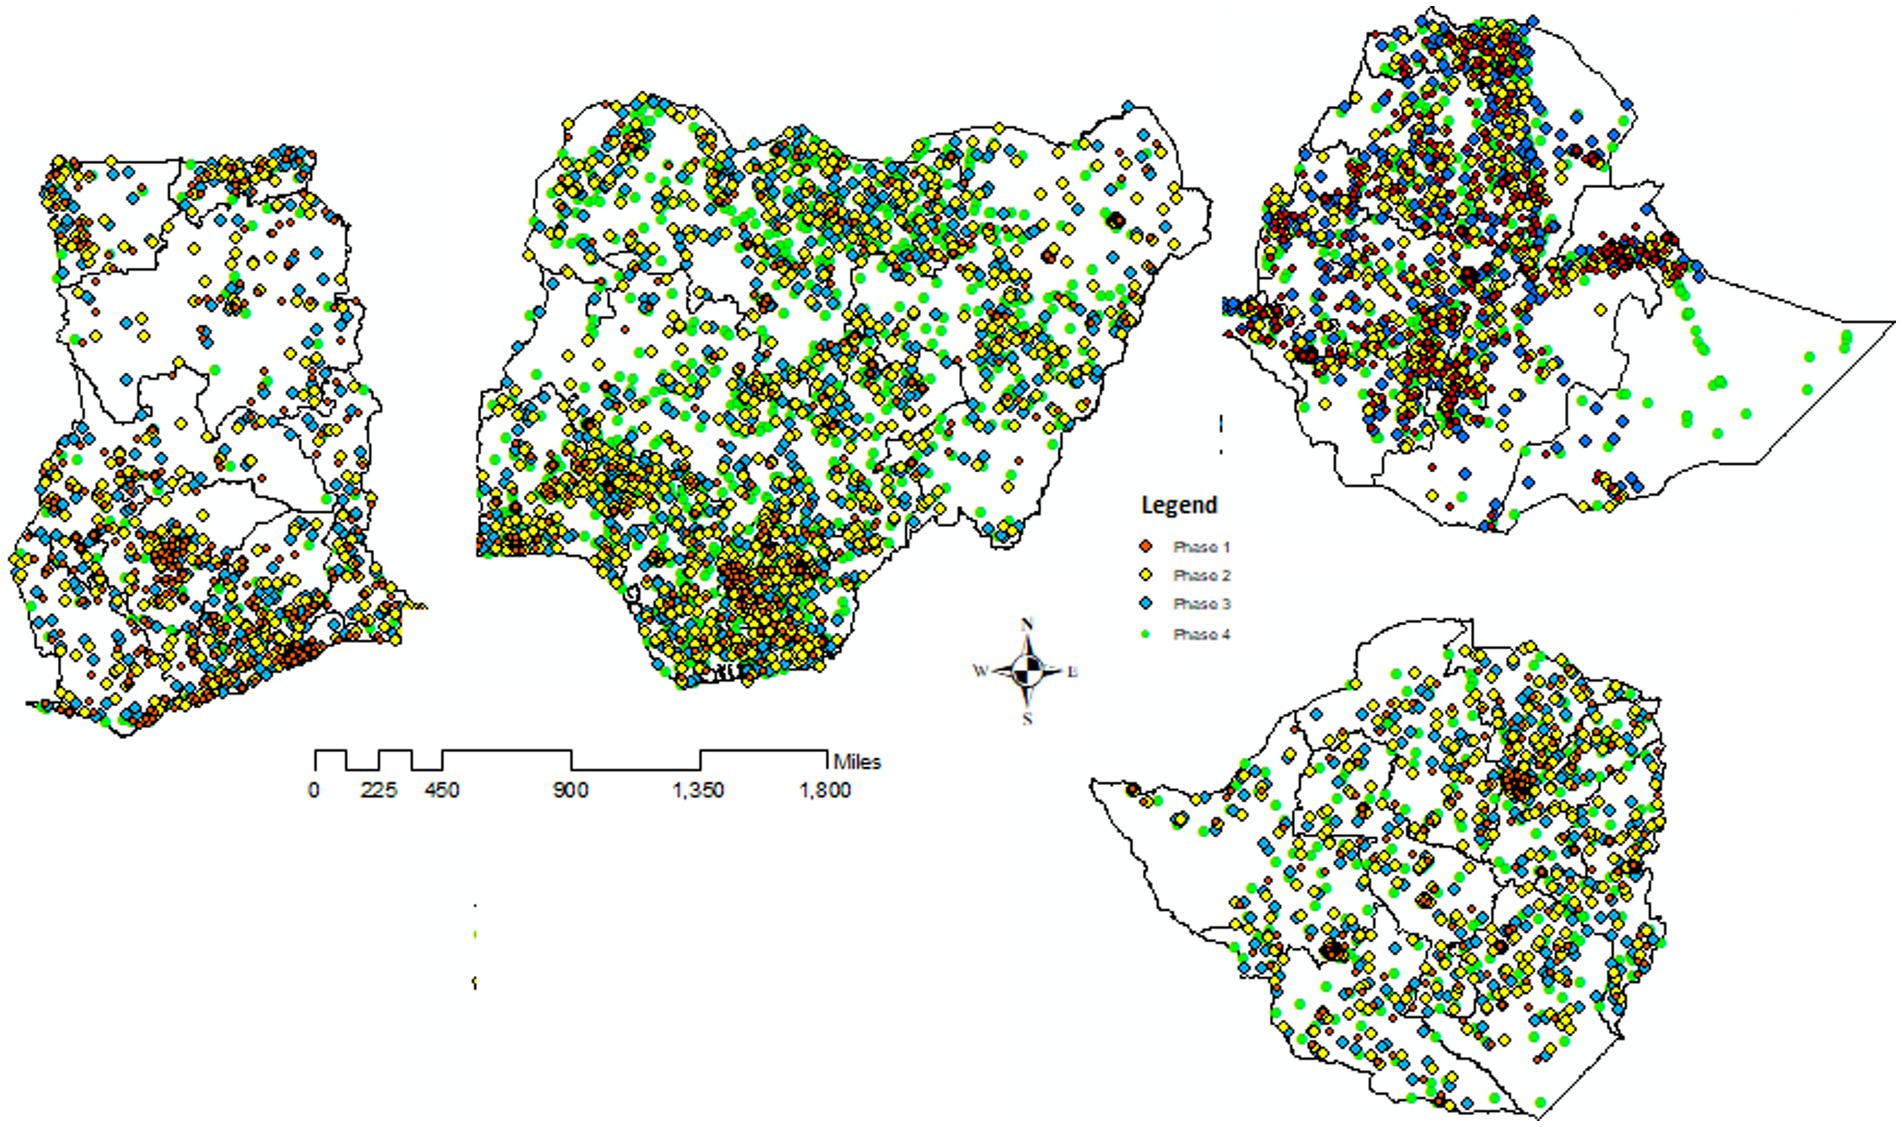
Figure 2. Locations of four disconnected countries with their clusters (Enumeration Areas) in the four phases of DHS that we consider, with boundaries of 37 districts in the four sSA countries.
The outcome variable of interest for this study was the under-five mortality rate per 1,000 live births (19–21). The values of the variables were dichotomized as (1 = yes and 0 = no). The number of under-five child mortalities aggregated at the district level of the four disconnected sSA countries over the study period from 2000 to 2020 in the five preceding DHS survey rounds was the outcome of interest.
The independent variables extracted were based on a review of the literature (19–22, 26–29). The independent variables were also aggregated over the districts, and the proportion of the variable of interest was computed. The variables included in the analysis are summarized in Table 1.
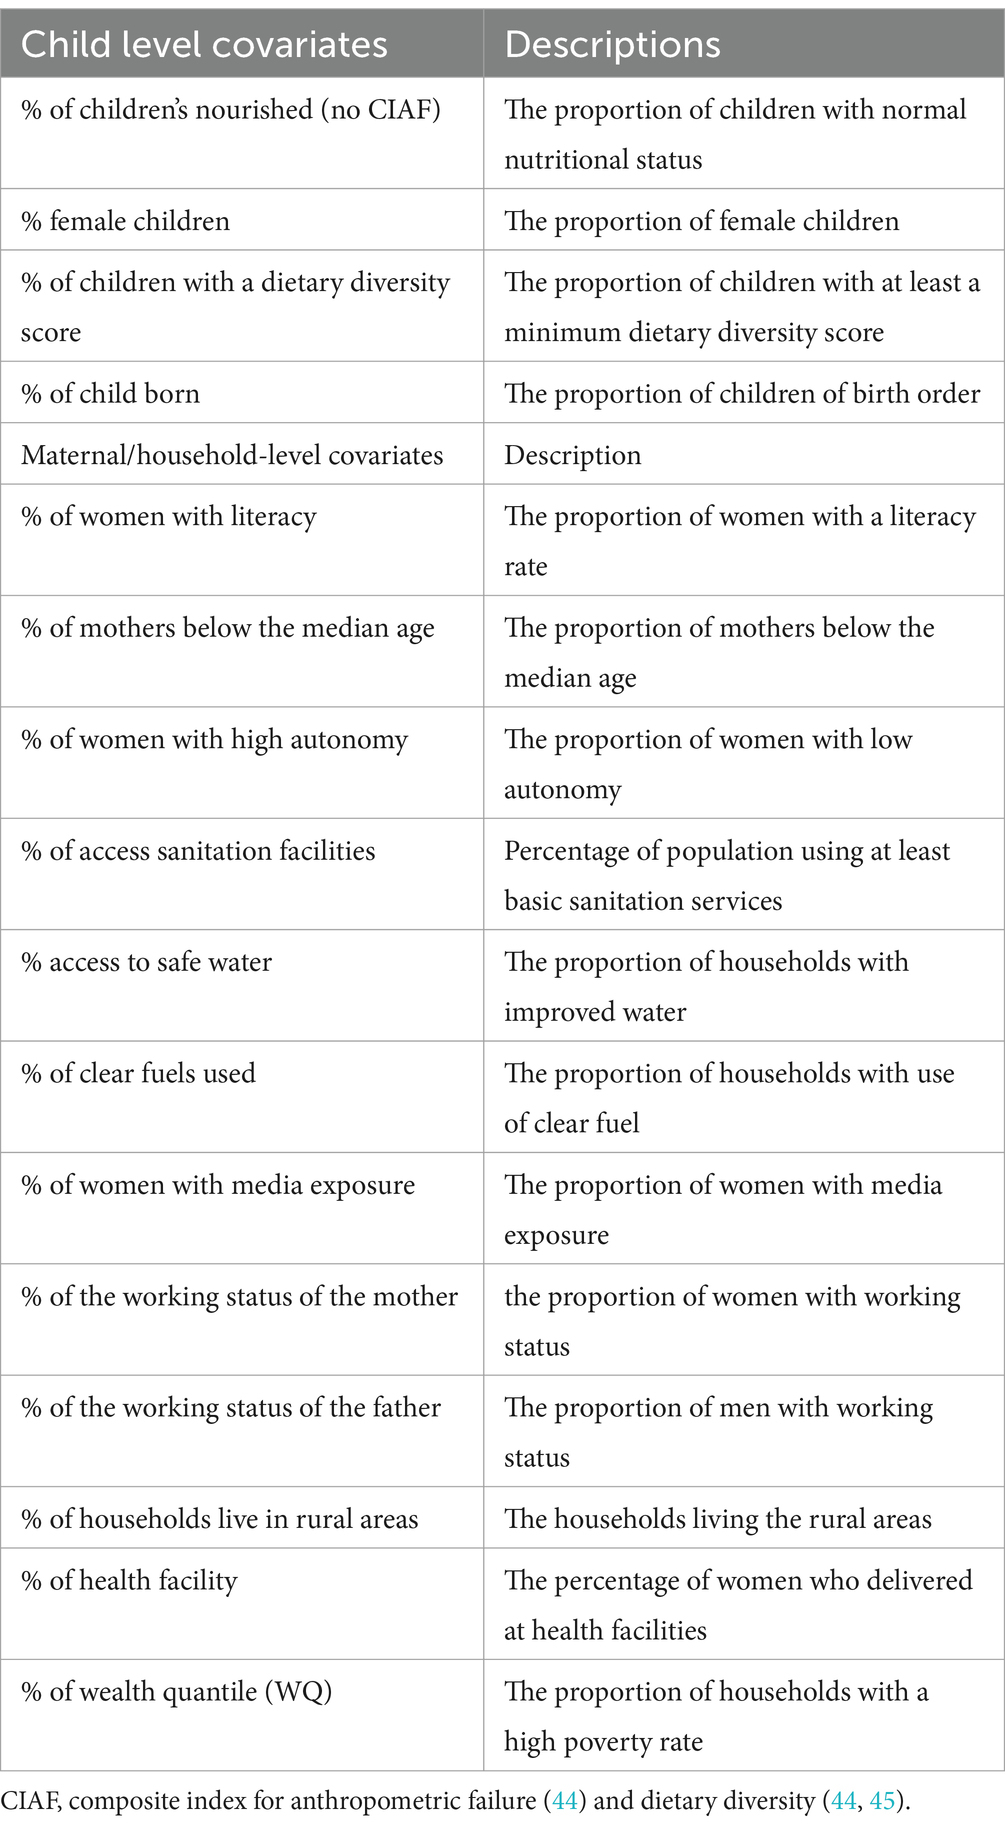
Table 1. The description of the covariates included in the model.
Several statistical approaches to model spatiotemporal data features have been implemented in the last two decades within the disease mapping framework (15, 16), and have recently become extensively used to describe the temporal evolution of district patterns of rates. In majority of previous studies, the hierarchical Bayesian under the fully Bayes approach based on Markov Chain Carlo (MCMC) methods (9, 16, 30) was used to model the spatiotemporal dataset; however, a novel method called integrated nested Laplace approximation (INLA) has become an alternative estimation procedure, which overcomes some of the limitations of the MCMC estimation technique, such as the computation burden needed when high-dimensional datasets are available (17, 31, 32).
Let be the areas to be considered and the set of all areas and be the time considered in the study. Let is the vector of standardized spatiotemporal covariates for fixed effects in areal units and time t, is the -vector of the fixed effect parameters. Let and , respectively, be the observed and expected number of subjects in area i at period t, is the total population in area i and time t, where depends on the aggregated (total) number of subjects at risk in area i at time t. The crude prevalence rate and expected number of subjects in the population are given as . The follows a Poisson distribution with a mean of defined as . Where, , are the expected cases and is a relative risk (RR).
The RR will be decomposed additively into components depending on time, space, and/or both given as:
where is the intercept, the overall RR in the district, which is common to all the districts and years, is the spatial random effect, models spatially-uncorrelated heterogeneity of the outcome variable, is a vector of unstructured temporal effect, is the overall time trend (main) effect, and is the area-level time effect (interaction between linear time trend and the district effect). Equation 1 can be expressed in matrix form as
where , and are columns of ones of length and respectively, and are and, identity matrices, respectively, and is the matrix of the standardized spatiotemporal covariates. The unstructured location level effects were modeled through independent normal distribution, . According to the Besag (9), the vector of structured spatial effects were assigned by the intrinsic conditional auto-regressive (ICAR), , where and . The spatial dependence parameter for the mean of is shown by the weight matrix (21) is stated as:
The vector of structure temporal effect were assigned the first-order random walk (RW1) with prior distribution specified as; , and is the RW1’s structure matrix (32), where the unstructured temporal effect assumes no temporal structure for priors and an independent mean-zero and unknown variance . Moreover, the vector of interaction effects between location and time is assumed to follow a Gaussian kernel distribution with , where .
Four types of spatiotemporal interactions (Equation 2) are (unstructured/structured between location and time); interaction effects are observed (15), and each possible interaction effect is summarized in Figure 3.
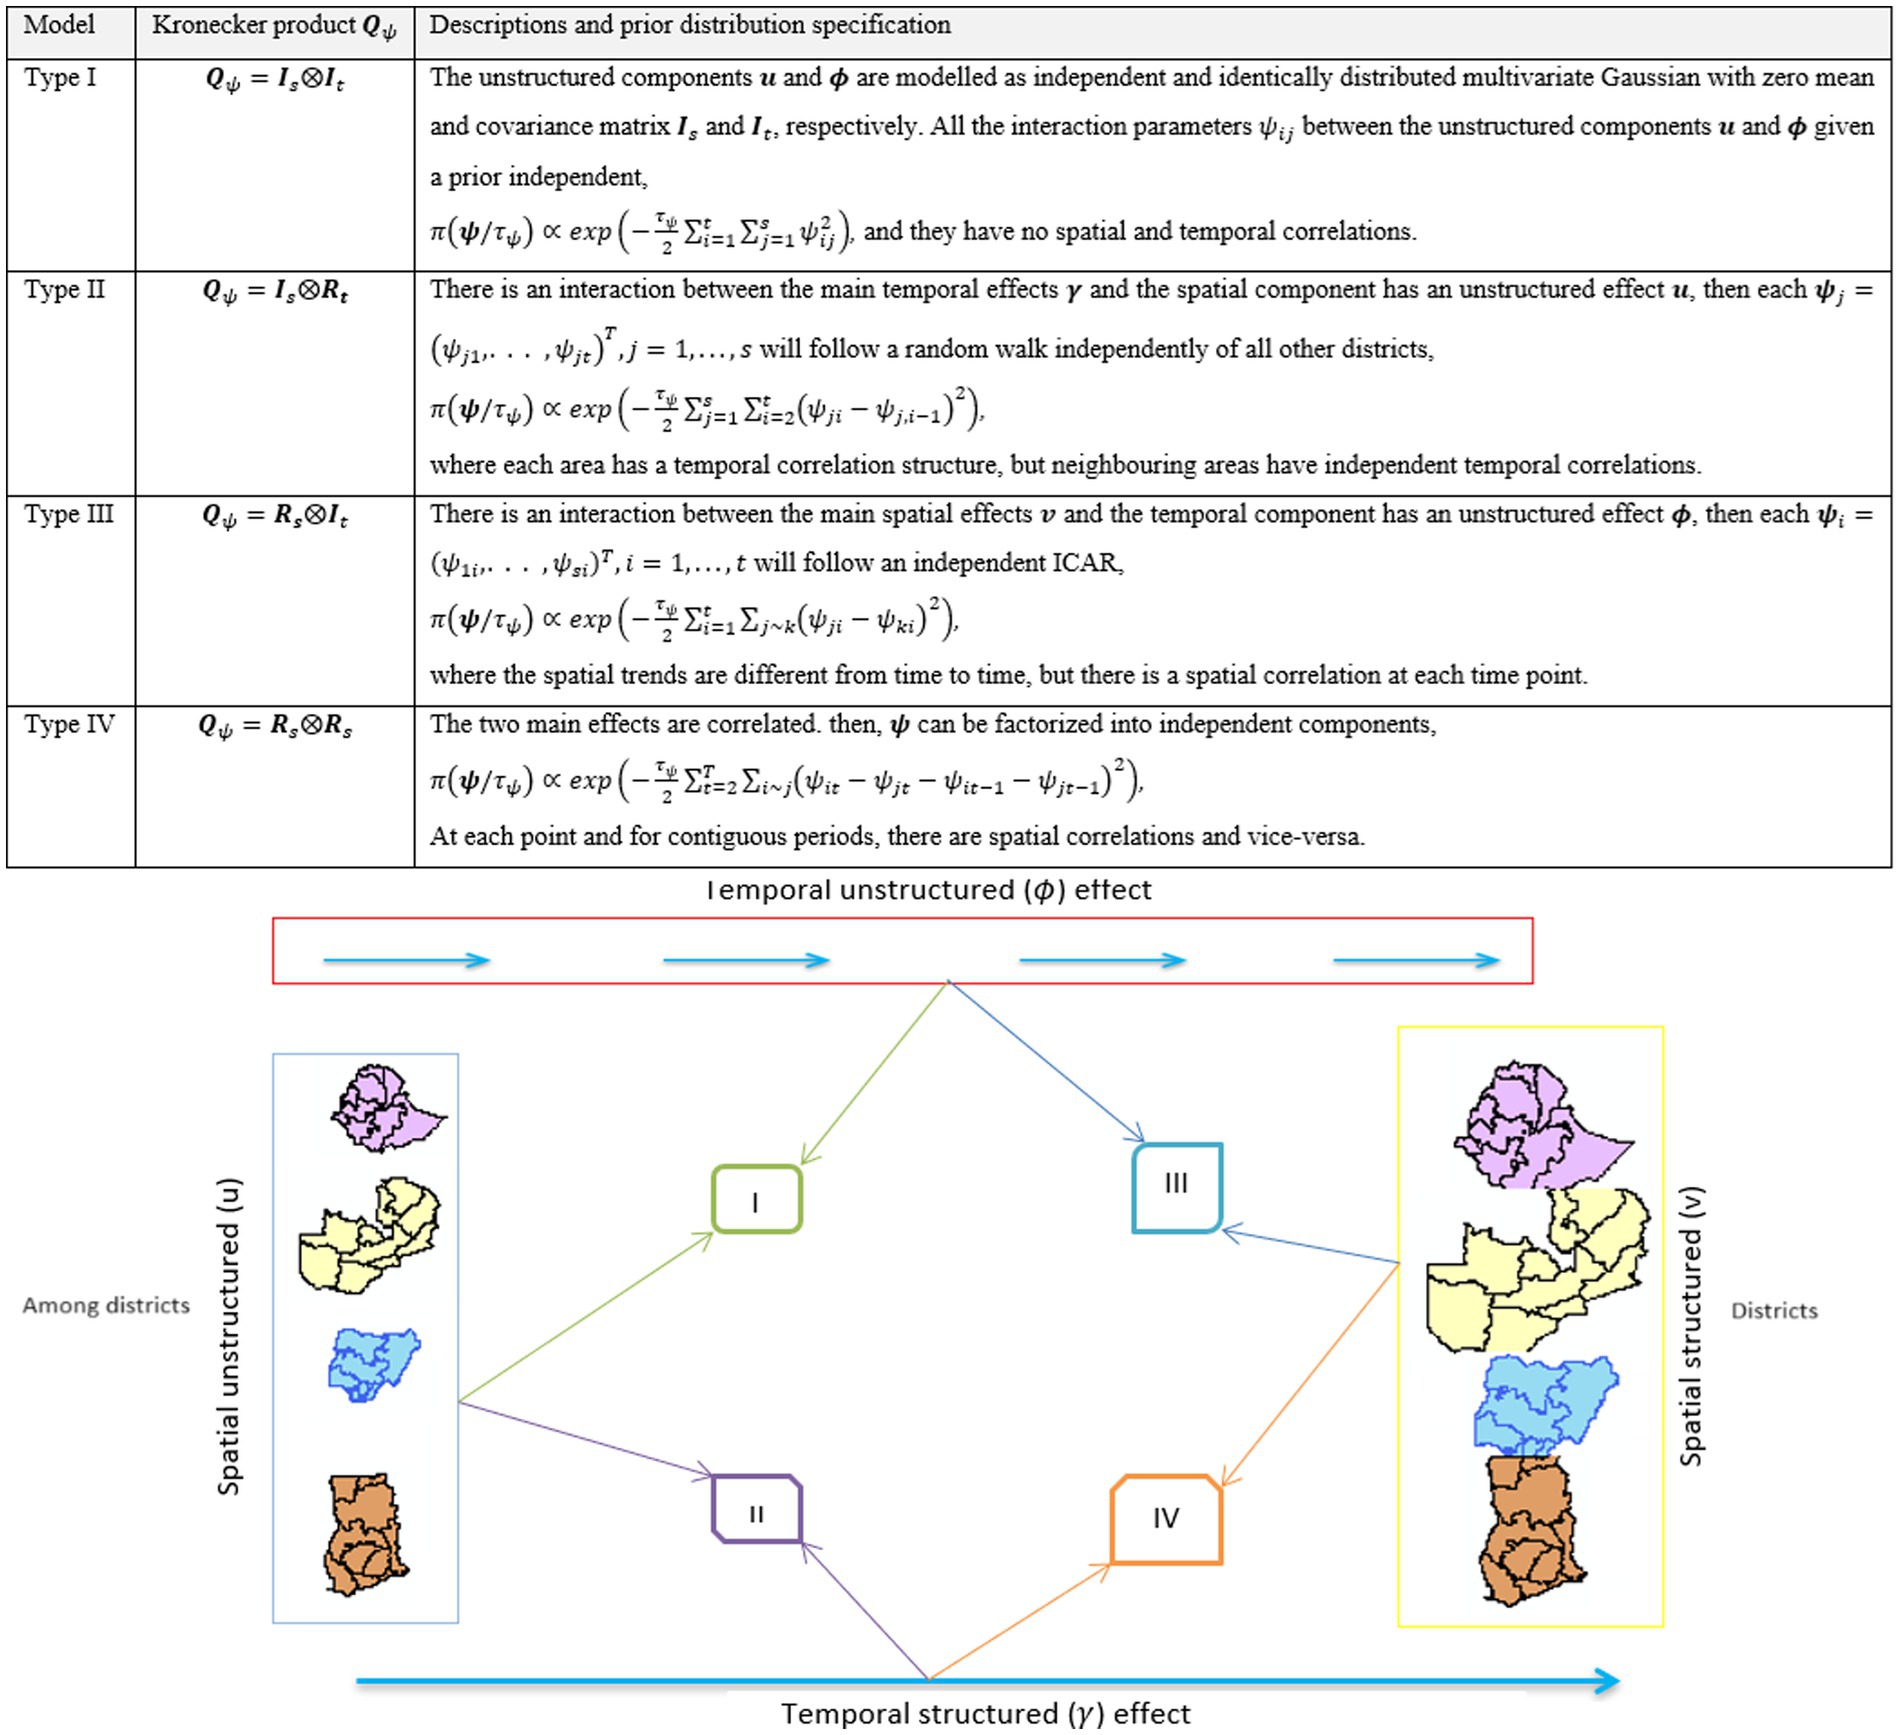
Figure 3. Illustration of the four interaction types.
In this study, we considered the most complex interaction (type IV), as it incorporates spatial and temporal dependence, which produces spatial and/or temporal confounding (33, 34). Details of the model descriptions are provided in the S1 file. The effect of time is different for each area because it depends on the covariates in that area, and the spatial effect associated with the area is different each time. As a result, this model has time-varying spatial and space-varying temporal effects. Since the disconnected regions can be different in terms of infrastructure, development, demographic, and socioeconomic situations, we assume that the spatial variations in the countries are quite different; hence, we split the random effect of the spatial components into four countries (9, 11, 12, 23). In this study, the U5M rates were aggregated over 37 districts in four sSA countries over four different waves of the DHS datasets. Data from the enumeration areas (EAs) of the districts were also available. To account for the variation in the size of the number of U5M children survey areas, the total number of under-five children (U5C) in the given district was included in the model as an offset (35) variable.
Different techniques were used to select the best model, including the Deviance Information Criterion (DIC) and the Widely Applicable Information Criterion (WAIC), with the lowest values indicating a better fit. For convenience, a DIC value greater than 3 was considered significant (18, 31).
A total of 170,356 under-five children were recorded for all 37 districts for the entire DHS phase (Phase 1: Phase 4) in four disconnected sSA countries (Ethiopia, Ghana, Nigeria, and Zimbabwe). There were 15,467 U5M cases among the children (2,684, 4,544, 4,155, and 4,084 in phase I, II, III, and IV, respectively). For the first phase of the DHS (1997–2004), the districts that had a U5M rate greater than 100 per 1,000 live births included 17 districts (Northeast, Northwest, South–South, and North-central from Nigeria; Afar, Gambela, Oromia, Amhara, Dire Daw, Somali, Tigray, and Harari from Amhara; Upper West from Ghana; and Manicaland in Zimbabwe). However, in the recent DHS phase (2015–2019), almost all districts in Ghana, Addis Ababa, Tigray in Ethiopia, Matabeleland North, Masvingo, and Bulawayo in Zimbabwe had less than 50 U5M rates per 1,000 live births. The prevalence of U5M improved over time (11.4–7.9%) across the study areas. The district pattern in the U5M rate changed considerably throughout the different phases of the DHS data-collection period. Many regions in Nigeria and Ethiopia had the highest mortality among children under-five, but the regions in Ghana had the lowest U5M rate. In the first phase, almost none of the districts achieved any of the goals set to reduce the U5M rates. However, over time, some districts have achieved their goals. Moreover, Figure 4 shows the standardized mortality ratio (SMR) and number of deaths for the years 2000–2020 for the four sSA countries. This result indicates that in the first DHS waves, Benshangul Gumuz and Afar in Ethiopia, Mashonland Central and Matabeleland in Zimbabwe, and Volta and Upper West in Ghana had the highest under-five mortality ratios. Moreover, we observed that SMRs have been decreasing steadily over the last 20 years, indicating and illustrating continuous progress regarding mortality (Figure 4).
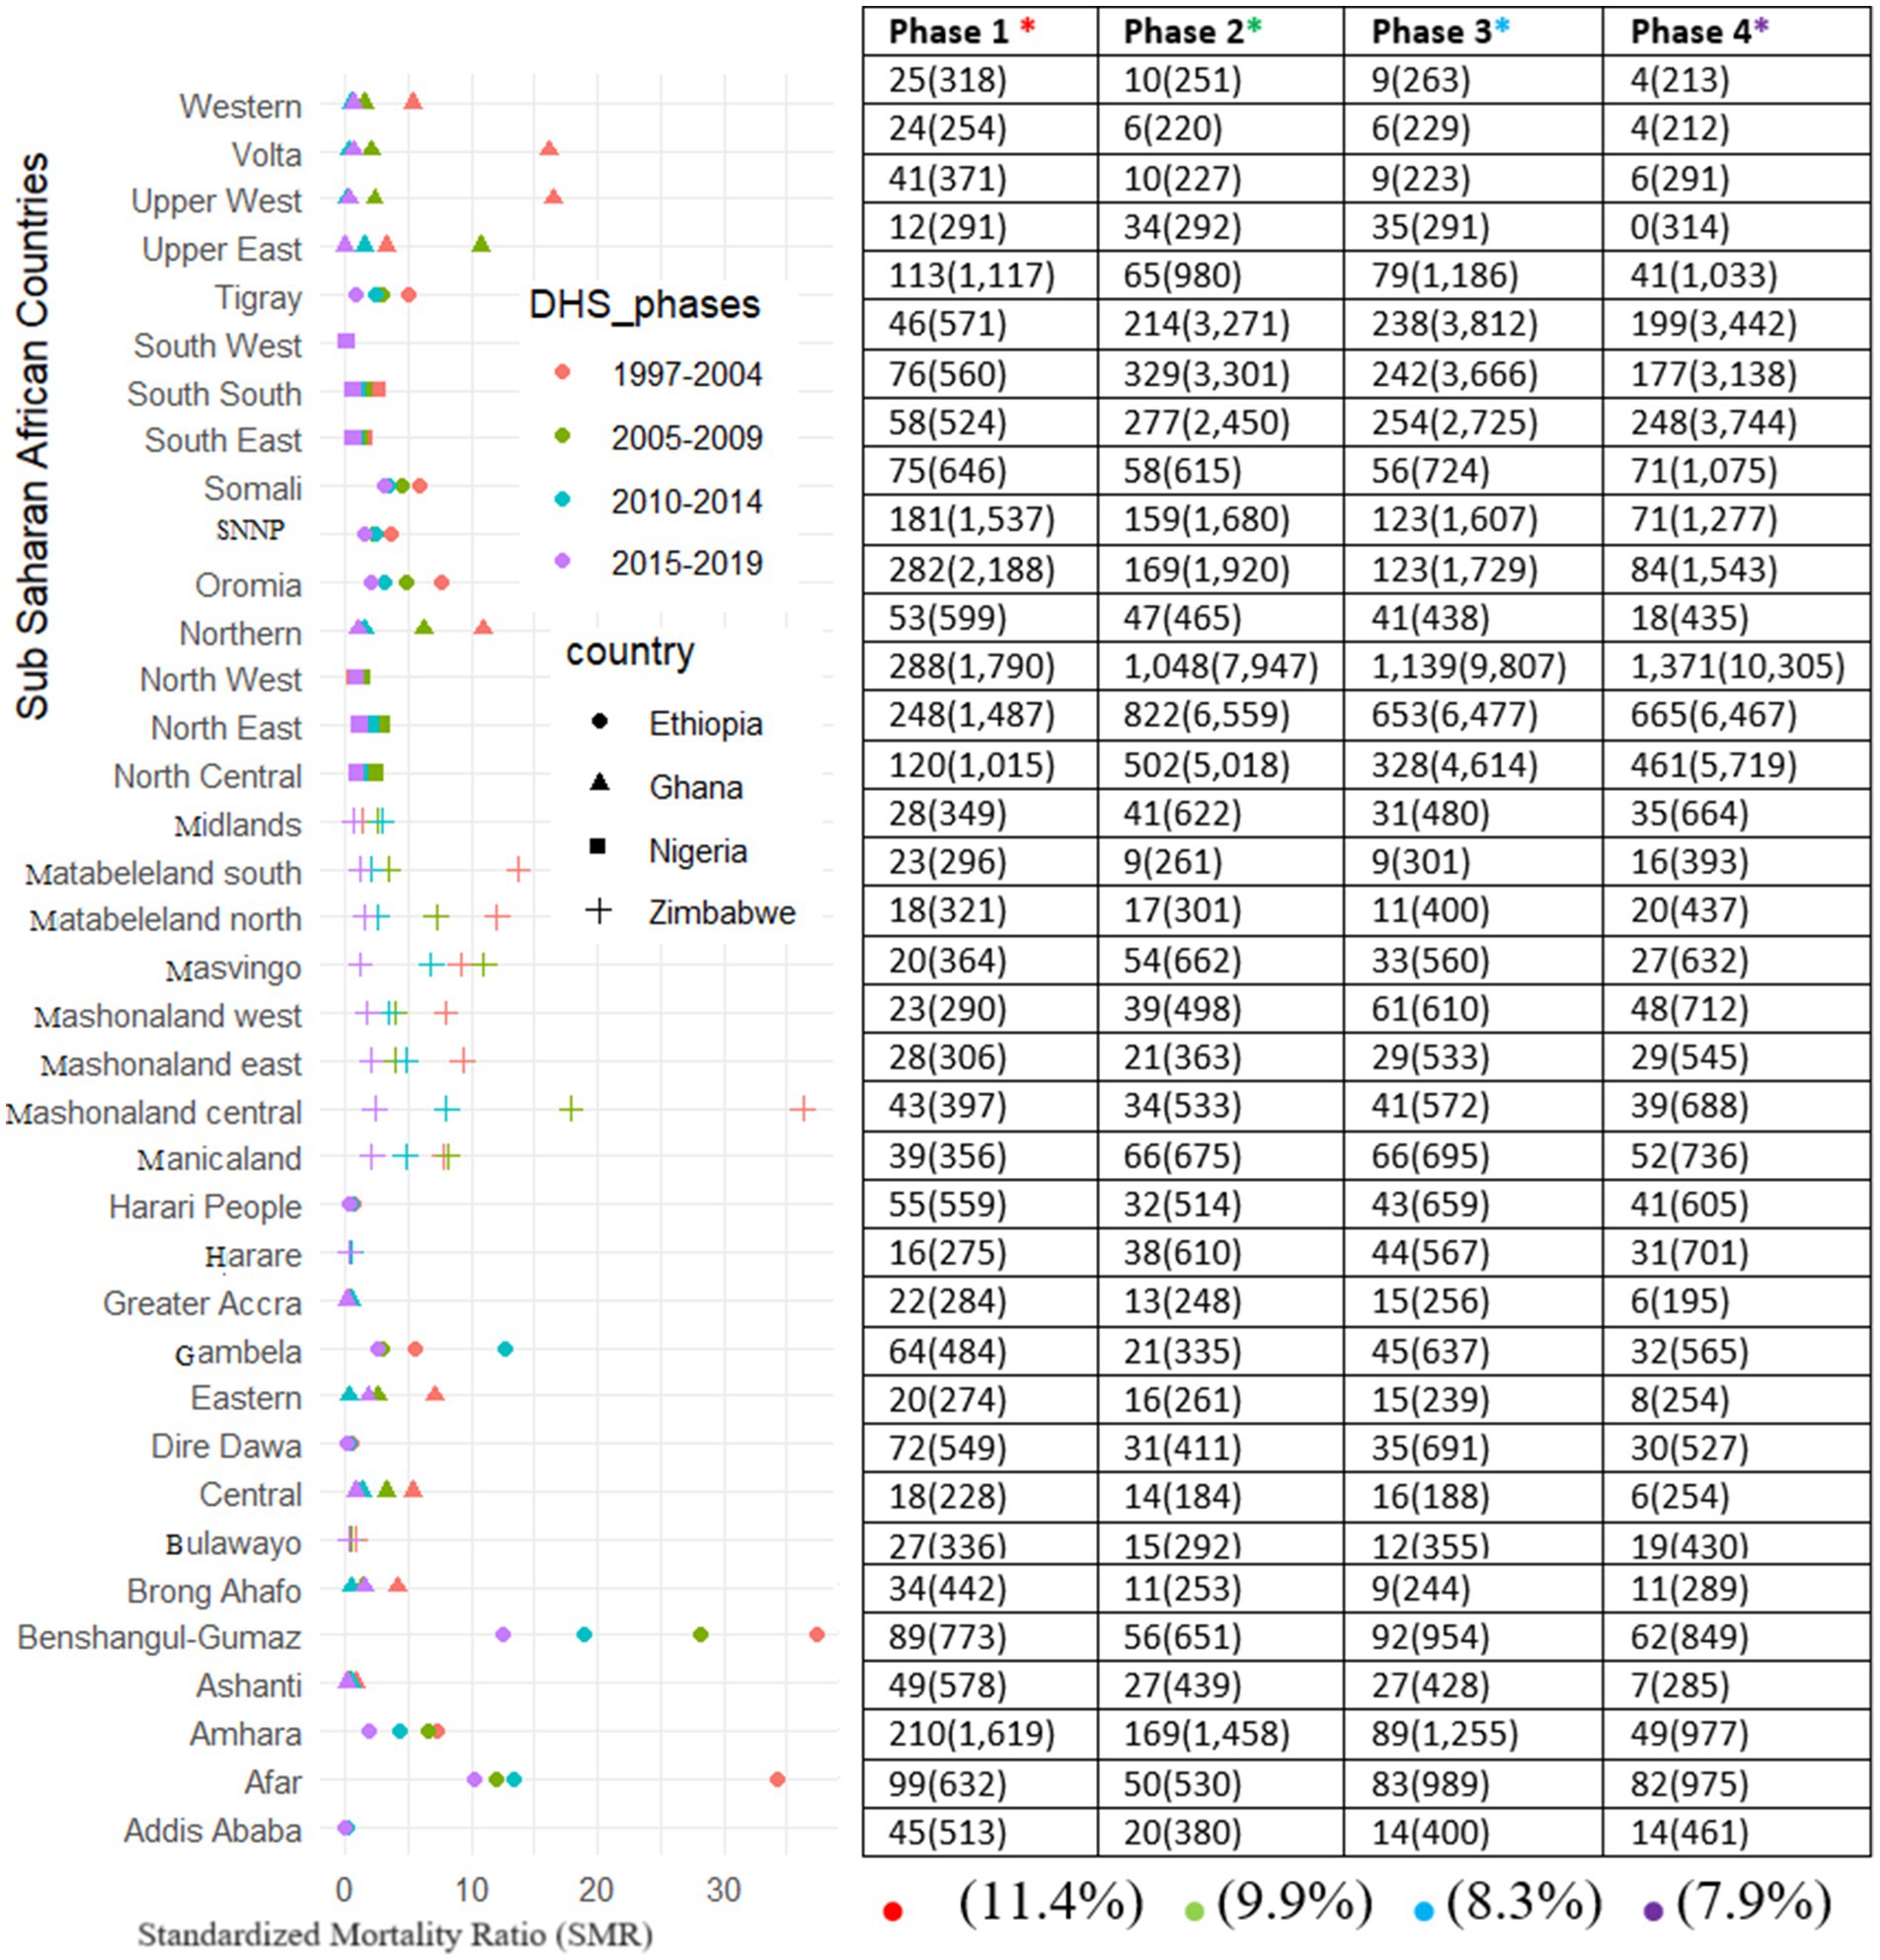
Figure 4. Standardized Mortality Rate and mean under-five mortalities per 1,000 live births and number surveyed (cases) of under-five children for each of the districts across the study period in four sSA countries.
The three different models were compared using different statistical metrics (mean deviance, effective number of parameters, and deviance information criteria). The spatiotemporal model (Model 3), with the interaction effects of covariates with both random effects of time and space, had the lowest DIC and WAIC, implying that it was the best-fit model (Table 2). Therefore, the Bayesian inference of fixed-effect parameters with a 95% credible interval for Model 3 was computed using INLA.
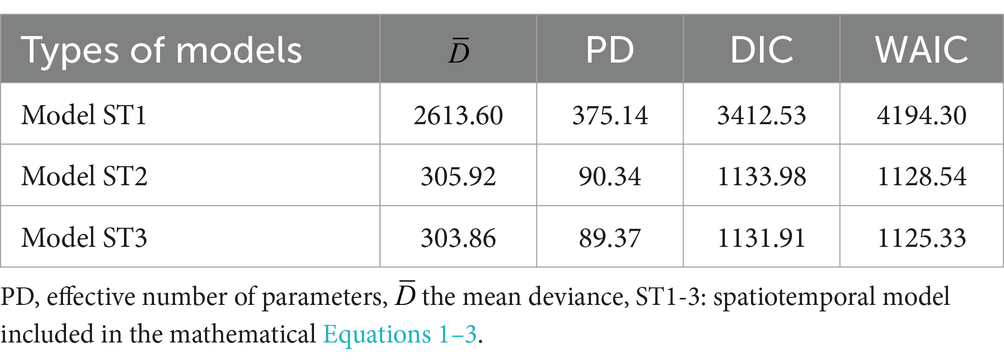
Table 2. Model comparison and selection for different spatiotemporal models with different specifications for each of the random effects with R-INLA.
The posterior mean estimates of the marginal spatial log odds for the U5M cases for each of the 37 administrative areas and a summary of the posterior mean estimate of the marginal temporal log odds of the U5M cases are summarized in Figure 5. The upper row shows the posterior log odds that the red color is toward high risk and the green color toward low risk of U5M among the districts across the countries. The spatial map reveals that a high risk is associated with the majority of the districts in Ethiopia and Zimbabwe, whereas a low risk is associated with the majority of the districts in Nigeria and Ghana. Finally, the temporal component revealed the posterior log odds of U5M among the four disconnected countries. The common risk to all districts for each of the disconnected countries and the table of the posterior mean of the main temporal effect in Figure 5 reveal a slight decrease in the global trend over time passes, indicating that there might be an effect on the whole district that produces a decrease in risk of U5M along the phases. The improvement of U5M in Zimbabwe is better than the others, and in Nigeria, it is relatively low, but in all countries, it sharply improved over time.
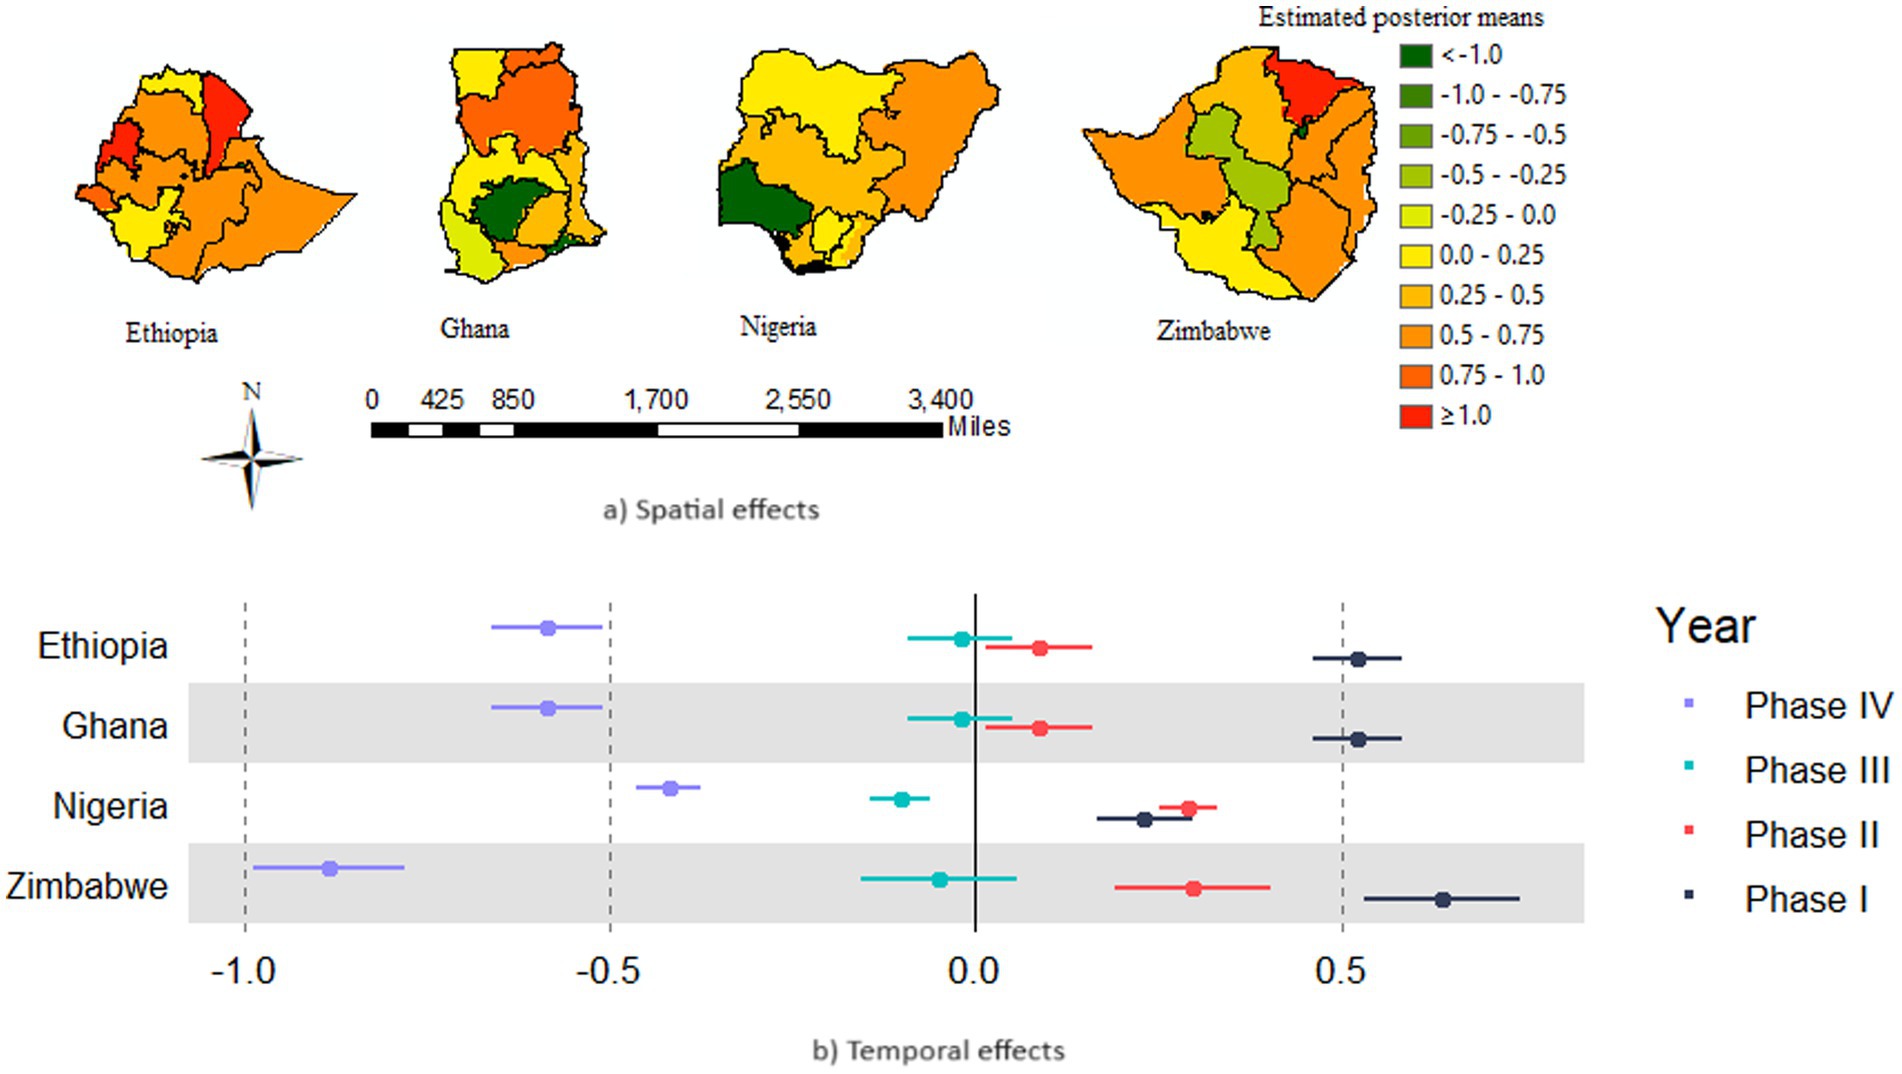
Figure 5. Spatial and temporal effects in the U5M rate across districts of four sSA countries (A) mean posterior log odds of U5M for districts (B) provides the common posterior temporal mean log odds (trend) of U5M for the districts of each country.
The posterior mean estimates of the log odds of the spatiotemporal model for the U5M cases for the 37 districts over the four waves of the DHS datasets are presented in Figure 6. This showed that specific temporal trends vary across districts; hence, including the interaction term in the model is appropriate. The posterior log odds of the spatial effect for a given district were different in each phase of the DHS period. A posterior log odds mean greater than one indicates an excess risk of U5M among children in each of the four sSA countries. Moreover, an increased risk of U5M was observed in the maps that became darker red, and a lower risk became darker green. Over time, from DHS phases 1 to 4, the risk of U5M decreased in the majority of the districts. However, in the majority districts of Nigeria and Ethiopia, the U5M improved slowly, indicating that there are confounding factors associated with the posterior log odds of U5M across a particular district in the country. Most of the districts in Ghana (except Ashanti and Brong Ahafo) were consistently at a lower U5M risk, especially after the third DHS phase. Specifically, for the recent DHS phase (2015–2019), the predicted posterior risk revealed that the highest mortality rates were those in the Somali, SNNP, and Afar regions in Ethiopia; Northwest and Southwest in Nigeria; and Brong Ahafo and Ashanti in Ghana. However, the majority of the regions in Nigeria and Ethiopia have the highest posterior U5M rates compared to Ghana and Zimbabwe (Figure 6).
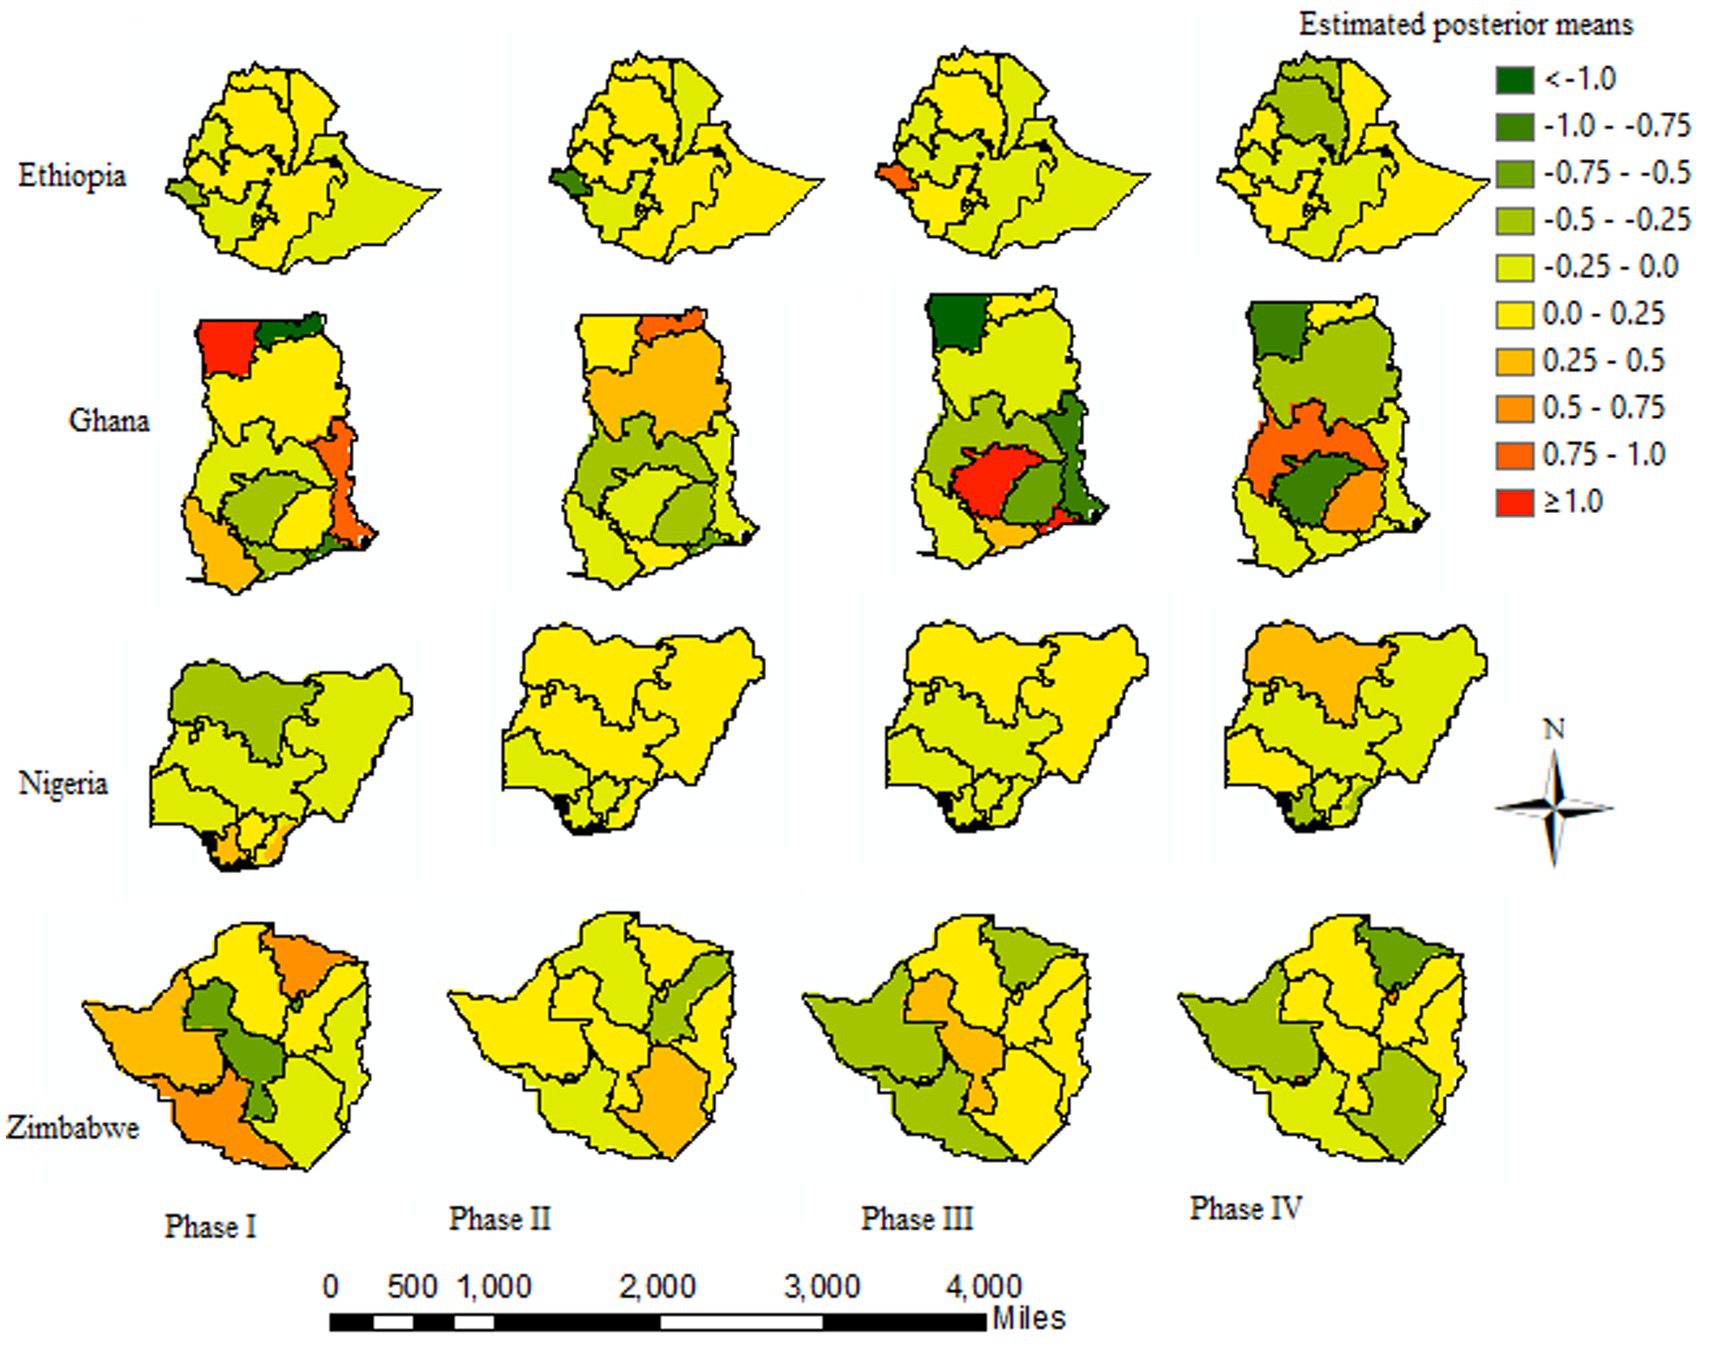
Figure 6. Posterior log odds of U5M by districts over the study period: darker red (high risk) and darker green (lower risk).
Table 3 shows the estimated coefficients of covariates (fixed effects) in the selected model, together with the estimated hyperparameters of the spatial, temporal, and spatiotemporal random effects on the under-five mortality cases. Some fixed effects reveal that the 95% credible intervals of the estimates do not contain zero. This suggests that these factors have a major effect on the heterogeneity of the U5M risk across sSA countries. An increase of one unit in the access to improved sanitation index (standard deviation) is associated with a decrease of approximately 34% (exponent of the log odds), 59, 4, and 14% in the relative risk of U5M in Ethiopia, Ghana, Nigeria, and Zimbabwe, respectively. Although an increase of 1 unit index in improved water is associated with 11, 28, 20, and 30% decreases of the relative risk in U5M rate across Ethiopia, Ghana, Nigeria, and Zimbabwe, respectively. Moreover, an increase of one unit index in rural residence settlement and poor wealth quantile index is associated with an increase of around 45, 48, 68, and 15% and 67, 14, 62, and 82%, respectively, in the risk of under-five mortality in Ethiopia, Ghana, Nigeria, and Zimbabwe, respectively. The estimated hyperparameters and proportions of the total variability explained by the spatial, temporal, and spatiotemporal random effects of the spatiotemporal model are summarized in Table 3. From the total variance explained by random effects, the estimated contribution of temporal effects is larger than that of the spatial and interaction effects in all countries.
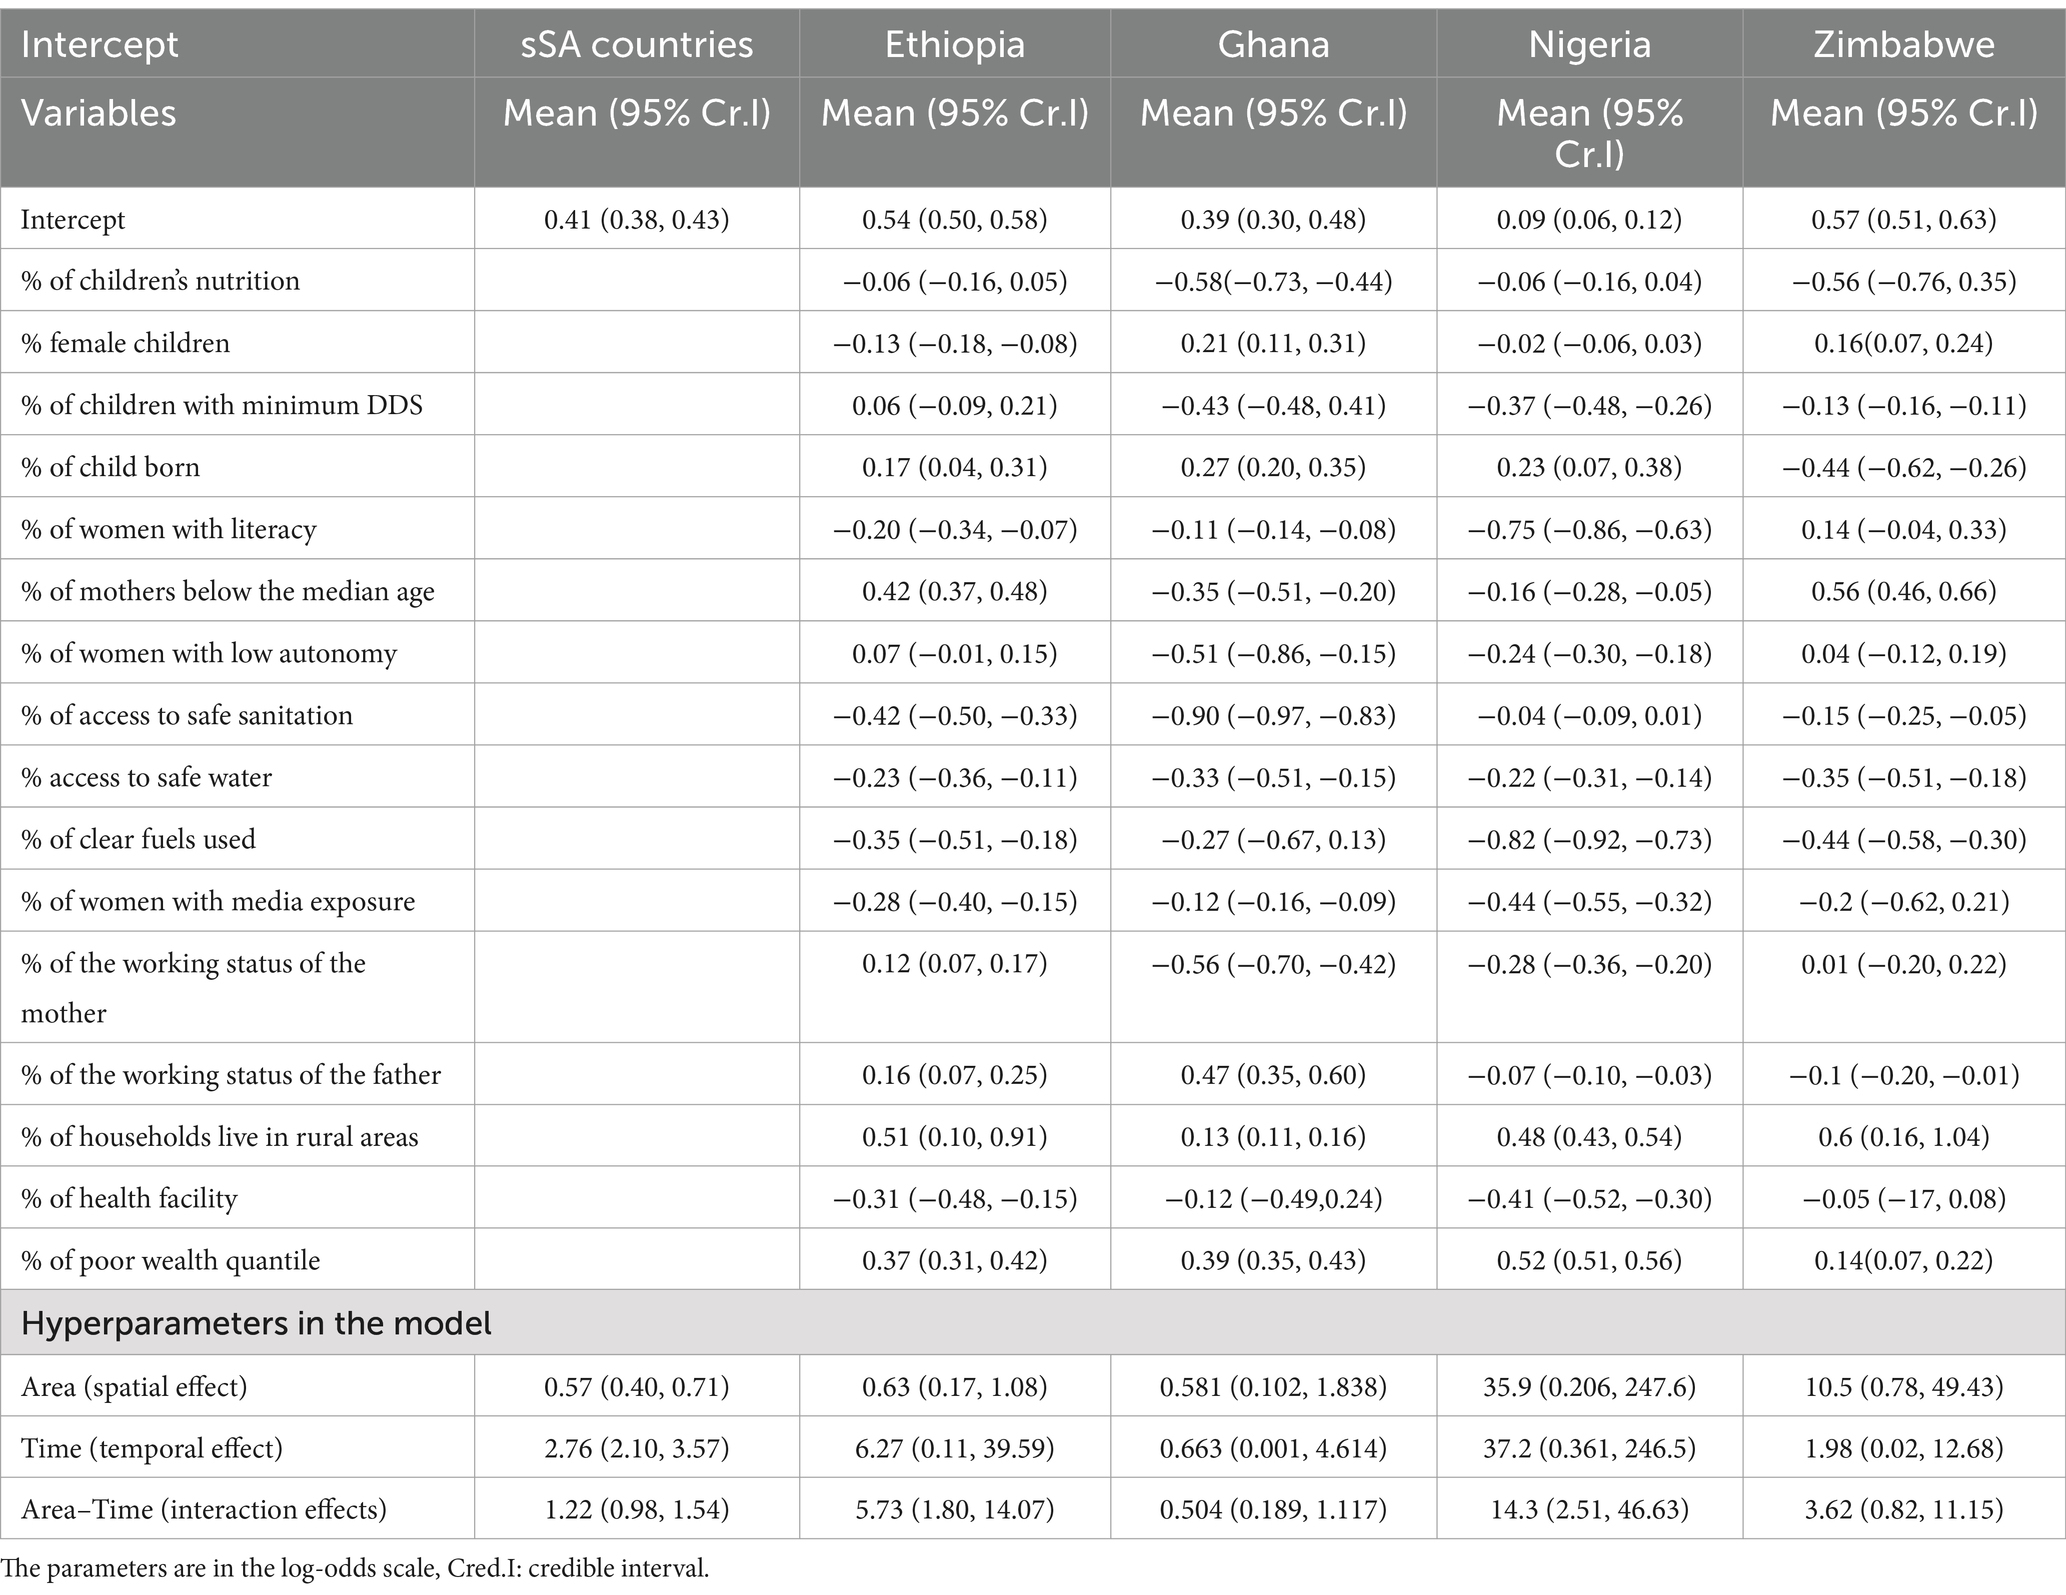
Table 3. Posterior mean, standard deviation, and the 95% credible intervals for the fixed effects for the selected model with R-INLA.
Under-five mortality is a major global public health issue that disproportionately affects children, mainly in less developed nations, including sub-Saharan Africa (36). Previous studies of area-level variation in under-five mortality disparities have been limited to large administrative areas where stable estimates of under-five mortality rates by lower administrative districts can be determined, leaving many sSA countries unexplored. The district-level direct estimates (crude) of certain variables are less common and unstable in showing the real distribution of the variables of interest. The objective of this study was to describe the district-level disparities in U5M rates across the 37 districts using the birth record dataset in four disconnected sSA country files (2000–2019) with the application of spatiotemporal models. A number of models with different assumptions have been used to explore the spatiotemporal effects of covariates in U5M (1, 3, 19–22, 30, 37, 38), but this is the first study to incorporate interactions of spatiotemporal random effects with time-varying confounders to estimate U5M across districts using the R-INLA package for four disconnected sSA countries. The study revealed a significant effect of both time and space main effects on U5M risk, and the effects of either of the two depend on the other and the interaction. Generally, there is notable evidence of a steady decline in the district levels of under-five mortality risk for the 20-year study period, although the levels remain high. These findings are in line with prior studies that reported similar temporal decreases in under-five mortality risk across the sub-Saharan African districts (17, 39–42). However, the U5M across four sSA countries in the period of 2000–2019 reveals a general decline in U5M risks; the mortality rates in the Ethiopia and Nigeria districts were relatively higher than those in Ghana and Zimbabwe. The reason why these districts in Nigeria and Ethiopia are high might be that these two countries are the most populated in Africa. Previous studies have shown the effects of different covariates on the U5M rate using different models (1, 3, 19–21, 39, 40, 43). In the majority of these previous studies, the spatial distribution and variation trends of under-five mortality have been explored at the country level (1, 3, 20, 21, 43), and these studies did not observe the potential interaction effects between the covariates and the random effects of time, space, and their possible interactions. Therefore, our study examined the effects of different covariates on the spatial and temporal trends of under-five mortality rates, as well as spatiotemporal variations across the study areas. Specifically, we found that a child with an undernutrition status is directly associated with, which is in line with the study reported by UNICEF (1, 21). Children living in rural areas are more likely to die than those living in urban areas are. This is in line with the study conducted (1, 3, 17, 20, 21, 35, 37, 41, 43), and this is the fact that individuals living in rural residences are frequently economically worse than their urban counterparts. A child born at a health facility had a lower risk than their home-born counterparts, which is in line with previous studies (21, 22, 39, 42); this is likely because mothers may be provided with an important understanding of health practices needed to improve their nutritional status and that of their families. Moreover, the use of improved health facilities (water and fuel use) is linked to a decrease in the under-five mortality risk because improved water, sanitation, and use of clean fuel will minimize the direct effect of infectious diseases.
Among the given models, the contributions of different time and space components were examined using DIC, and the effective number of parameters was estimated. The best-fitting model captured the temporal dependence structure and spatial autocorrelation of the data and was further improved by incorporating time-varying covariates, accounting for the extra variability that was not captured by the main district and time effects. Most previous studies did not see the potential interaction effects between the covariates and the random effects of time, space, and their possible interactions. One of the aims of the present study was to examine the effects of different covariates on the spatial and temporal trends of under-five mortality rates as well as spatiotemporal variations across the study areas. In our analysis, we addressed the potential challenges associated with spatial confounding caused by the district-level covariates. We also illustrate techniques for the specification of graphs for disconnected regions. We explored whether the spatial patterns of U5M risk differed significantly during the study period and quantified the spatiotemporal interactions across the districts. First, spatiotemporal models incorporate spatial, temporal, and interaction effects without introducing district-level covariates. In the second model, we incorporated neighborhood-level covariates. In our analysis, we addressed the potential challenges associated with spatial confounding accounted for by the district-level covariates. To the best of our knowledge, this is the first study to describe district-level disparities in under-five mortality across sub-Saharan African countries. Describing the district-level variation of under-five mortality rate variation within the country may inform future research on the determinants of these disparities, as well as efforts to reduce inequalities and the burden of under-five mortality risks across the sub-Saharan African countries. This study had some limitations. We specified widely used neighborhood structure definitions: two districts are neighbors if they share a common border (contiguity). However, there are other options, such as distance-based methods that measure the distance between two centroids or points, which are worth further investigation in future research.
The original contributions presented in the study are included in the article/supplementary material, further inquiries can be directed to the corresponding author.
HF: Conceptualization, Data curation, Formal analysis, Investigation, Methodology, Software, Visualization, Writing – original draft, Writing – review & editing. D-GC: Conceptualization, Funding acquisition, Methodology, Project administration, Resources, Supervision, Writing – review & editing. TZ: Methodology, Supervision, Writing – review & editing. NR: Formal analysis, Software, Writing – review & editing.
The author(s) declare that financial support was received for the research, authorship, and/or publication of this article. This study is partially based upon research supported by the South Africa Department of Research and Innovation (DSI), National Research Foundation (NRF), and South Africa Medical Research Council (SAMRC) (South Africa DSI-NRF-SAMRC SARChI Research Chair in Biostatistics, Grant number 114613). Opinions expressed and conclusions arrived at are those of the author and are not necessarily to be attributed to the NRF and SAMRC.
The datasets used in this study were obtained from the DHS program, thanks to the authorization received to download the dataset on the website.
The authors declare that the research was conducted in the absence of any commercial or financial relationships that could be construed as a potential conflict of interest.
All claims expressed in this article are solely those of the authors and do not necessarily represent those of their affiliated organizations, or those of the publisher, the editors and the reviewers. Any product that may be evaluated in this article, or claim that may be made by its manufacturer, is not guaranteed or endorsed by the publisher.
1. Wang, H, Bhutta, ZA, Coates, MM, Coggeshall, M, Dandona, L, Diallo, K, et al. Global, regional, national, and selected subnational levels of stillbirths, neonatal, infant, and under-5 mortality, 1980–2015: a systematic analysis for the global burden of disease study 2015. Lancet. (2016) 388:1725–74. doi: 10.1016/S0140-6736(16)31575-6
2. Reidpath, DD, and Allotey, P. Infant mortality rate as an indicator of population health. J Epidemiol Community Health. (2003) 57:344–6. doi: 10.1136/jech.57.5.344
3. Macharia, PM, Giorgi, E, Thuranira, PN, Joseph, NK, Sartorius, B, Snow, RW, et al. Sub national variation and inequalities in under-five mortality in Kenya since 1965. BMC Public Health. (2019) 19:1–12. doi: 10.1186/s12889-019-6474-1
4. MacFeely, S. Measuring the sustainable development goals: what does it mean for Ireland? Administration. (2017) 65:41–71. doi: 10.1515/admin-2017-0033
5. Kim, EM. Gender and the sustainable development goals. Glob Soc Policy. (2017) 17:239–44. doi: 10.1177/1468018117703444
6. Song, P, Theodoratou, E, Li, X, Liu, L, Chu, Y, Black, RE, et al. Causes of death in children younger than five years in China in 2015: an updated analysis. J Glob Health. (2016) 6:802. doi: 10.7189/jogh.06.020802
7. Auffhammer, M, and Carson, RT. Forecasting the path of China's CO2 emissions using province-level information. J Environ Econ Manag. (2008) 55:229–47. doi: 10.1016/j.jeem.2007.10.002
8. Yu, H. The influential factors of China's regional energy intensity and its spatial linkages: 1988–2007. Energy Policy. (2012) 45:583–93. doi: 10.1016/j.enpol.2012.03.009
9. Besag, J, York, J, and Mollié, A. Bayesian image restoration, with two applications in spatial statistics. Ann Inst Stat Math. (1991) 43:1–20. doi: 10.1007/BF00116466
10. Banerjee, S, Carlin, BP, and Gelfand, AE. Hierarchical modeling and analysis for spatial data. New York: Chapman and Hall/CRC (2003).
11. Freni-Sterrantino, A, Ventrucci, M, and Rue, H. A note on intrinsic conditional autoregressive models for disconnected graphs. Spatial Sspatio Temp Epidemiol. (2018) 26:25–34. doi: 10.1016/j.sste.2018.04.002
12. Mohamad, MS, Abdul Maulud, KN, and Faes, C. A practical illustration of spatial smoothing methods for disconnected regions with INLA: spatial survey on overweight and obesity in Malaysia. Int J Health Geogr. (2023) 22:14. doi: 10.1186/s12942-023-00336-5
13. Bernardinelli, L, Clayton, D, Pascutto, C, Montomoli, C, Ghislandi, M, and Songini, M. Bayesian analysis of space—time variation in disease risk. Stat Med. (1995) 14:2433–43. doi: 10.1002/sim.4780142112
14. Assuncao, RM, Reis, IA, and Oliveira, CDL. Diffusion and prediction of Leishmaniasis in a large metropolitan area in Brazil with a Bayesian space–time model. Stat Med. (2001) 20:2319–35. doi: 10.1002/sim.844
15. Knorr-Held, L, and Rue, H. On block updating in Markov random field models for disease mapping. Scand J Stat. (2002) 29:597–614. doi: 10.1111/1467-9469.00308
16. Schmid, V, and Held, L. Bayesian extrapolation of space–time trends in cancer registry data. Biometrics. (2004) 60:1034–42. doi: 10.1111/j.0006-341X.2004.00259.x
17. Schrödle, B, and Held, L. Spatio-temporal disease mapping using INLA. Environmetrics. (2011) 22:725–34. doi: 10.1002/env.1065
18. Spiegelhalter, DJ, Best, NG, Carlin, BP, and van der Linde, A. Bayesian measures of model complexity and fit. J R Stat Soc Ser B Stat Methodol. (2002) 64:583–639. doi: 10.1111/1467-9868.00353
19. Adebowale, AS, Fagbamigbe, AF, Morakinyo, O, Obembe, T, Afolabi, RF, and Palamuleni, ME. Parental educational homogamy and under-five mortality in sub-Saharan Africa: clarifying the association's intricacy. Sci Afr. (2020) 7:e00255. doi: 10.1016/j.sciaf.2019.e00255
20. van, C, Amouzou, A, Barros, A, Masquelier, B, van, H, and Speybroeck, N. Socioeconomic factors contributing to under-five mortality in sub-Saharan Africa: a decomposition analysis. BMC Public Health. (2019) 19:760–19. doi: 10.1186/s12889-019-7111-8
21. Zike, DT, Fenta, HM, Workie, DL, and Swain, PK. Determinants of under-five mortality in Ethiopia: an application of cox proportional Hazard and frailty models. Turkiye Klinikleri journal of. Biostatistics. (2018) 10:123–36. doi: 10.5336/biostatic.2018-60550
22. Fenta, SM, Fenta, HM, and Ayenew, GM. The best statistical model to estimate predictors of under-five mortality in Ethiopia. J Big Data. (2020) 7:1–14. doi: 10.1186/s40537-020-00339-0
23. Hodges, JS, Carlin, BP, and Fan, Q. On the precision of the conditionally autoregressive prior in spatial models. Biometrics. (2003) 59:317–22. doi: 10.1111/1541-0420.00038
24. Aliaga, A, and Ren, R. The optimal sample sizes for two-stage cluster sampling in demographic and health surveys. United States: ORC Macro (2006).
25. Juju, D, Baffoe, G, Lam, RD, Karanja, A, Naidoo, M, Ahmed, A, et al. Sustainability challenges in sub-Saharan Africa in the context of the sustainable development goals (SDGs) In: A Gasparatos, editor. Sustainability Challenges in Sub-Saharan Africa I. Science for Sustainable Societies. Singapore: Springer ((2020). 3–50.
26. Bryce, J, Victora, CG, and Black, RE. The unfinished agenda in child survival. Lancet. (2013) 382:1049–59. doi: 10.1016/S0140-6736(13)61753-5
27. Fenta, SM, Ayenew, GM, Fenta, HM, Biresaw, HB, and Fentaw, KD. Community and individual level determinants of infant mortality in rural Ethiopia using data from 2016 Ethiopian demographic and health survey. Sci Rep. (2022) 12:16879. doi: 10.1038/s41598-022-21438-3
28. Brockerhoff, M, and Hewett, P. Inequality of child mortality among ethnic groups in sub-Saharan Africa. Bull World Health Organ. (2000) 78:30–41.
29. Rutherford, ME, Mulholland, K, and Hill, PC. How access to health care relates to under-five mortality in sub-Saharan Africa: systematic review. Trop Med Int Health. (2010) 15:508–19. doi: 10.1111/j.1365-3156.2010.02497.x
30. Wang, S, Ren, Z, and Liu, X. Spatiotemporal trends in neonatal, infant, and child mortality (1990–2019) based on Bayesian spatiotemporal modeling. Front Public Health. (2023) 11:996694. doi: 10.3389/fpubh.2023.996694
31. Carroll, R, Lawson, AB, Faes, C, Kirby, RS, Aregay, M, and Watjou, K. Comparing INLA and OpenBUGS for hierarchical Poisson modeling in disease mapping. Spatial Sspatio Temp Epidemiol. (2015) 14-15:45–54. doi: 10.1016/j.sste.2015.08.001
32. Vicente, G, Goicoa, T, and Ugarte, M. Bayesian inference in multivariate spatio-temporal areal models using INLA: analysis of gender-based violence in small areas. Stoch Env Res Risk A. (2020) 34:1421–40. doi: 10.1007/s00477-020-01808-x
33. Adin, A, Goicoa, T, Hodges, JS, Schnell, PM, and Ugarte, MD. Alleviating confounding in spatio-temporal areal models with an application on crimes against women in India. Stat Model. (2023) 23:9–30. doi: 10.1177/1471082X211015452
34. Fattah, E.A., and Rue, H., (2022). Approximate Bayesian inference for the interaction types 1, 2, 3 and 4 with application in disease mapping. arXiv preprint arXiv:2206.09287.
35. Mizanur, M, Islam, N, Mahamuda, M, and Nawar, A. Determinants of fertility trend at district, divisional and regional levels and policy implication for poverty alleviation. Int J Health Econom Policy. (2021) 6:92–9. doi: 10.11648/j.hep.20210603.13
36. Andriano, L, and Monden, CW. The causal effect of maternal education on child mortality: evidence from a quasi-experiment in Malawi and Uganda. Demography. (2019) 56:1765–90. doi: 10.1007/s13524-019-00812-3
37. Rossen, LM, Khan, D, and Schoendorf, KC. Mapping geographic variation in infant mortality and related Black–White disparities in the US. Epidemiology. (2016) 27:690–6. doi: 10.1097/EDE.0000000000000509
38. Amegbor, PM, and Addae, A. Spatiotemporal analysis of the effect of global development indicators on child mortality. Int J Health Geogr. (2023) 22:9. doi: 10.1186/s12942-023-00330-x
39. Zondi, MM, Mwambi, HG, and Melesse, SF. Spatio-temporal modelling of under-five mortality in Lesotho using demographic and health survey data. Afr Health Sci. (2023) 23:168–80. doi: 10.4314/ahs.v23i3.21
40. Macharia, PM, Joseph, NK, Sartorius, B, Snow, RW, and Okiro, EA. Subnational estimates of factors associated with under-five mortality in Kenya: a spatio-temporal analysis, 1993–2014. BMJ Glob Health. (2021) 6:e004544. doi: 10.1136/bmjgh-2020-004544
41. Khagayi, S, Amek, N, Bigogo, G, Odhiambo, F, and Vounatsou, P. Bayesian spatio-temporal modeling of mortality in relation to malaria incidence in Western Kenya. PLoS One. (2017) 12:e0180516. doi: 10.1371/journal.pone.0180516
42. Dedefo, M, Oljira, L, and Assefa, N. Small area clustering of under-five children's mortality and associated factors using geo-additive Bayesian discrete-time survival model in Kersa HDSS, Ethiopia. Spatial Sspatio Temp Epidemiol. (2016) 16:43–9. doi: 10.1016/j.sste.2015.11.003
43. Fenta, SM, and Fenta, HM. Risk factors of child mortality in Ethiopia: application of multilevel two-part model. PLoS One. (2020) 15:e0237640. doi: 10.1371/journal.pone.0237640
44. Fenta, HM, Zewotir, T, and Muluneh, EK. Disparities in childhood composite index of anthropometric failure prevalence and determinants across Ethiopian administrative zones. PLoS One. (2021) 16:e0256726. doi: 10.1371/journal.pone.0256726
Keywords: spatial random effects, confounding, spatiotemporal models, space-time interactions, variance partitioning
Citation: Fenta HM, Chen D-G, Zewotir TT and Rad NN (2025) Spatiotemporal models with confounding effects: application on under-five mortality across four sub-Saharan African countries. Front. Public Health. 13:1408680. doi: 10.3389/fpubh.2025.1408680
Edited by:
Md. Moyazzem Hossain, Jahangirnagar University, BangladeshReviewed by:
Joanna Wang, University of Technology Sydney, AustraliaCopyright © 2025 Fenta, Chen, Zewotir and Rad. This is an open-access article distributed under the terms of the Creative Commons Attribution License (CC BY). The use, distribution or reproduction in other forums is permitted, provided the original author(s) and the copyright owner(s) are credited and that the original publication in this journal is cited, in accordance with accepted academic practice. No use, distribution or reproduction is permitted which does not comply with these terms.
*Correspondence: Haile Mekonnen Fenta, aGFpbGVtZWtvbm5lbkBnbWFpbC5jb20=
Disclaimer: All claims expressed in this article are solely those of the authors and do not necessarily represent those of their affiliated organizations, or those of the publisher, the editors and the reviewers. Any product that may be evaluated in this article or claim that may be made by its manufacturer is not guaranteed or endorsed by the publisher.
Research integrity at Frontiers
Learn more about the work of our research integrity team to safeguard the quality of each article we publish.