
94% of researchers rate our articles as excellent or good
Learn more about the work of our research integrity team to safeguard the quality of each article we publish.
Find out more
BRIEF RESEARCH REPORT article
Front. Public Health , 20 January 2021
Sec. Children and Health
Volume 8 - 2020 | https://doi.org/10.3389/fpubh.2020.526477
 André B. Coelho1,2*
 Fábio Y. Nakamura3,4
 Micaela C. Morgado5
 Francisco Alves6
 Angela Di Baldassarre3
 Andrew Flatt7
 Luis Rama1
This study aimed to develop a predictive explanatory model for the 1,000-m time-trial (TT) performance in young national-level kayakers, from biomechanical and physiological parameters assessed in a maximal graded exercise test (GXT). Twelve young male flat-water kayakers (age 16.1 ± 1.1 years) participated in the study. The design consisted of 2 exercise protocols, separated by 48 h, on a kayak ergometer. The first protocol consisted of a GXT starting at 8 km.h−1 with increments in speed of 1 km.h−1 at each 2-min interval until exhaustion. The second protocol comprised the 1,000-m TT.
Results: In the GXT, they reached an absolute O2max of 3.5 ± 0.7 (L.min−1), a maximum aerobic power (MAP) of 138.5 ± 24.5 watts (W) and a maximum aerobic speed (MAS) of 12.8 ± 0.5 km/h. The TT had a mean duration of 292.3 ± 15 s, a power output of 132.6 ± 22.0 W and a O2max of 3.5 ± 0.6 (L.min−1). The regression model [TT (s) = 413.378–0.433 × (MAP)−0.554 × (stroke rate at MAP)] presented an R2 = 84.5%.
Conclusion: It was found that O2max, stroke distance and stroke rate during the GXT were not different from the corresponding variables (O2peak, stroke distance and stroke rate) observed during the TT. The MAP and the corresponding stroke rate were strong predicting factors of 1,000 m TT performance. In conclusion, the TT can be useful for quantifying biomechanical parameters (stroke distance and stroke rate) and to monitor training induced changes in the cardiorespiratory fitness (O2max).
Olympic male flat-water kayak competitions comprise 200 and 1,000 m distances. At Rio 2016, medals won within 35.195 to 35.662 s and 211.447 to 213.363 s, respectively, for 200 and 1,000 m. Performance in different competitive distances requires a distinct combination of physiological and anthropometric factors (1). At the adult national and international level, 200 m race time recorded over a flat-water course was significantly correlated to maximal accumulated oxygen deficit and performance during a kayak ergometer adapted Wingate test (1). Besides, upper body strength and some selected anthropometric characteristics (e.g., humerus breadth) significantly correlated with 200 m race performances (1). In young kayakers, on-water performances in both 200 and 1,000 m distances could be predicted (88 and 85%) from a kayak ergometer protocol, using multiple regression, including the maximal oxygen uptake, the maximal aerobic power, and near-infrared spectroscopy derived deoxyhaemoglobin (2). Despite the high explanatory power of the “aerobic-derived” variables included in the statistical model, the referred authors did not explore the relationship between morphological and biomechanical variables and on-water kayak performance, which can also be considered determinants of competitive success (2).
Among the main variables considered in the biomechanical evaluation using kinematic parameters of kayaking, the stroke rate and the stroke distance can be highlighted, with stroke rate being the most common monitored variable by coaches during the competition (3–5).
Special care is needed while working with young athletes concerning maturation since performance can be modulated by morphological and maturation status (6). Studies have shown that kayakers aged between 13 and 16 years are usually early maturers, possessing longer limbs, greater lean body mass and reduced subcutaneous fat, associated with higher stature and weight than non-athlete counterparts (7). Hence, young kayakers are predominantly ecto-mesomorphic (8). The influence of these maturational variables on specific performance still needs to be addressed in conjunction with physiological traits in young kayakers.
Despite the high ecological validity of on-water performance, there are difficulties in monitoring elite athletes in their competitive distance under real conditions. In race situation, the environmental changing conditions could affect performances and their interpretation. Coaches and sport scientists must use valid and accurate instruments with equally valid and reliable protocols to detect training adaptations that could influence performance (9). Ergometers simulate the movement patterns of a sport, allowing access to the physiological responses in a controlled laboratory environment (10). The comparison of ergometer with on-water kayaking performance has concluded that kayak ergometers accurately simulate the physiological demands of short-term high-intensity kayaking (10, 11). The use of ergometers offers advantages in the evaluation of athletes performance in a laboratory context (3–5, 9), bringing advantages of methodological rigor in the control of athletes in the laboratory context.
The study aims first to verify the predictive power of biomechanical, physiological, maturational and the morphological characteristics on a 1,000 m time-trial performance (TT), assessed by a maximal graded exercise test (GXT) in young kayakers. Second, compare biomechanical and physiological parameters between both tests (TT and GXT–O2max). The knowledge of the most influential variables affecting the 1,000 m TT in kayak ergometer in young kayakers, could help coaches to interpret relevant physiological and biomechanical variables, assisting in the selection for competitive proposes.
Twelve (n = 12) Portuguese national-level male young sprint kayakers volunteered to take part in this study [mean ± SD; age 16.1 ± 1.1 years (yr), stature 175.0 ± 7.0 cm, siting height 92.5 ± 3.8 cm, weight 63.7 ± 7.1 kg, body fat 6.8 ± 2.1 kg, % body fat 10.7 ± 2.9 %, training experience 2.7 ± 0.7 yr, mean weekly training volume 10.6 ± 2.4 h]. The same experienced researcher performed the anthropometric measurements. The athletes visited the laboratory on two occasions during which they accomplished two experimental protocols (GXT and TT). The athletes were familiar with the kayak ergometer and testing procedures applied. On the first visit, upon arrival at the laboratory, the athletes completed a pre-test questionnaire to characterize the training and food intake in the last 24 h. The questionnaire was adapted from Tanner and Gore (12) and was used to verify if the athletes maintained the same pattern of activity and nutrition before the protocols. The data were analyzed and returned to the athletes, indicating to keep the same nutrition and hydration schedule for the second visit. Briefly the macronutrients distribution was as follows: protein 21.9 ± 6.3%; fat 30.0 ± 8.0%, and CHO 48.1 ± 11.3%. They also completed a symptoms questionnaire to evaluate the health status and perception of the athlete's recovery level. The distance from seat to foot-bar and hand position on the carbon shaft were adjusted individually and maintained constant across the tests. The maturational status was estimated through the maturity offset that predicts years from peak height velocity (PHV), based on anthropometric variables (height, sitting height, weight, leg length) (13). The athletes presented 2.20 ± 1.03 years post-PHV. The legal guardians and the young athletes gave their written consent after receiving a detailed explanation of the purposes and procedures of the study. The local Ethics Committee of the Faculty of Sports Science and Physical Education, University of Coimbra (CE/FCDEF-UC/00292019) approved the procedures.
The athletes were familiar with the kayak ergometer and testing procedures applied. The testing situations were conducted at least 24 h apart and completed within 10 days. All testing sessions were held in the same period of the day (17:00–19:00 h). The day before testing, athletes were required to avoid fatigue accumulation; all participants were asked to abstain from intense physical exertion and only a light intensity workout 24 h prior to each testing session was allowed.
The anthropometric and body composition assessments were done during the first visit to the laboratory. Body mass was measured using a calibrated scale (Seca 770, Hamburgo, Germany) and stature and sitting height were measured using a standard stadiometer (Harpenden 98.607, Holtain, UK). Body composition was assessed through plethysmography (Bodpod 2006, Concord, California). Both protocols were performed in an air-braked, drag adjustable ergometer designed to assess flat-water kayakers (Kayak-Ergometer Dansprint, Hvidovre, Denmark).
Ergometer drag was adjusted for body mass of each athlete according to manufacturer's instructions to reproduce on-water surface when on the kayak (www.dansprint.com). The same warm-up procedures were implemented before both tests. Briefly, after 10′ of freely chosen light stretching exercises, they paddled for 15′ at an intensity lower than 70% of their estimated HRmax, during which athletes were asked to perform 5 short sprints of 3″ (4), followed by a passive rest period of 10′. An active recovery on cycle ergometer lasting 15 min with reduced power output [35 watts (W)] at a pace of 60 rpm was performed after each kayak-specific testing protocol. During the graded maximal test and time-trial, speed, stroke rate, distance per stroke, and mechanical power output were continuously measured through the Dansprint software.
The values of temperature (24.9 ± 0.8°C), ambient humidity (44.3 ± 2.1%) and pressure (763.7 ± 1.0 mmHg) were maintained constant during the tests (Oregon Instruments USA). After both tests, blood lactate (La) was determined at 1, 3, 5, and 7 min of recovery from capillary blood samples collected using heparinized ear-lobe tubes for determination of peak lactate value (Lactate Pro®). Ventilatory parameters were monitored breath by breath with a Quark CPET COSMED® gas analyser (Quark-CPET COSMED, Roma, Italy) calibrated before each testing session according to manufacturer's instructions.
Maximal graded test: Speed started with paddling at 8 km.h−1, with increments of 1 km.h−1 each 2 min, until exhaustion. The data was averaged in 30 s segments. Additionally, maximum aerobic power (MAP), maximum aerobic speed (MAS), power output, stroke rate and distance per stroke at each intensity were calculated. Before testing, the gas analyser system (Quark CPET, Cosmed, Rome, Italy) was calibrated for room and gas with known O2 and CO2 concentrations following the manufacturer's recommendations. The determination of ventilatory thresholds (VT1 and VT2) and O2max followed the criteria proposed by Howley et al. (14). Briefly, VT1 corresponds to the last point before the first non-linear increase in both VE and VE/VO2. VT2 corresponds to the point before the second non-linear increase in both VE and VE/VO2, accompanied by a non-linear increase in VE/VCO2. Three experienced researchers identified the ventilatory parameters and a fair agreement was obtained. Coefficients of variation (CV) between researchers ranged from 0.3 to 2.7%. The determined intraclass-correlations (ICC) were 0.93, 0.90 and 1 for VT1, VT2, and O2max, respectively, for the values reported by the three researchers. Accordingly, the mean of each of the value were used in the ventilatory data analysis.
1,000 m time-trial: The athletes were required to perform the 1,000 m time-trial (TT) in the shortest time, while receiving verbal encouragement to maintain speed as high as possible. The athletes had full access to a visual display of TT variables, such as distance traveled, time, and stroke rate. During the 1,000 m time-trial the same gas analyser system (Quark CPET, Cosmed, Rome, Italy) was used and the peak oxygen uptake (O2peak) was determined. The O2peak was defined as the highest continuous 30 s during the exercise bout.
All data are presented as mean and standard deviation values. The normality and the homogeneity of the data were checked using the Shapiro–Wilke and Levene tests, respectively. A priori sample size estimation was computed. For a sample size of 12 subjects a statistical power of β = 0.9 was found in the linear regression approach of 2 predictors, with an ES = 0.7 and α = 0.05. The student's t-test for pairwise comparison was used between the variables obtained in the GXT and TT. Effect sized was computed to ascertain magnitude of the difference of the mean trivial (0–0.19), small (0.20–0.49), medium (0.50–0.79), and large (0.80 and greater) (15). If normal distribution was not verified, the non-parametric Wilcoxon test was used. Correlation analysis was conducted with Pearson (or Spearman–rho correlation coefficient, when normal distribution was not observed) while analyzing the data derived from the GXT and performance during the TT. A multiple regression analysis was used to predict TT performance selecting the GXT's variables that were significantly correlated with performance, being entered into backward multiple regression analysis to predict performance with the lowest standard error of the estimate. The statistical analyses were performed using SPSS (version 24.0, SPSS, Chicago, IL, USA) program and p ≤ 0.05 determined the statistical significance.
The results of the GXT and the physiological, metabolic and biomechanical variables observed during the 1,000 m time-trial are presented in Table 1. The 1,000 m time-trial lasted 292.2 ± 15.0 s. Although the mean values of the same studied variables were not significant (p > 0.05), correlations between VO2peak, stroke rate and stroke distance obtained during the TT and the corresponding in the GXT were found. Between protocols (GXT and TT) correlation of the mean speed and mean power output also founded (see Table 2). Additionally, we observed significant lower values during TT when compared to those achieved during the GXT, namely MAS (t = −3.888; p = 0.003) and a medium mean difference (ES = 0.79; CI = −0.385, 1.965) and MAP (t = −2.472; p = 0.031) with a small mean difference (ES = 0.25; CI = −0.885, 1.387). Higher blood lactate values were observed at the end of the TT when compared to that recorded after finishing the GXT (t = −3.793; p = 0.003) and a high mean difference (ES = −0.976; CI = −2.173, 0.221).
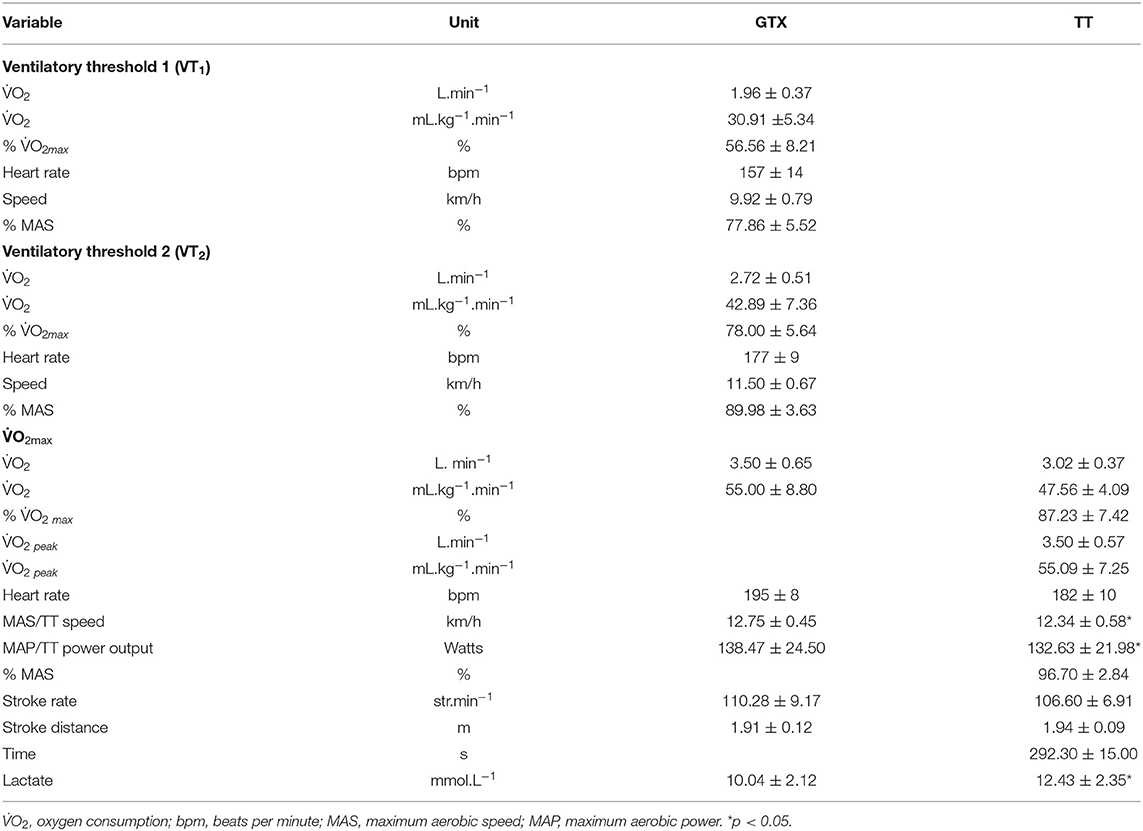
Table 1. Descriptive data, of maximal graded exercise test and 1,000 m time trial (mean ± SD).
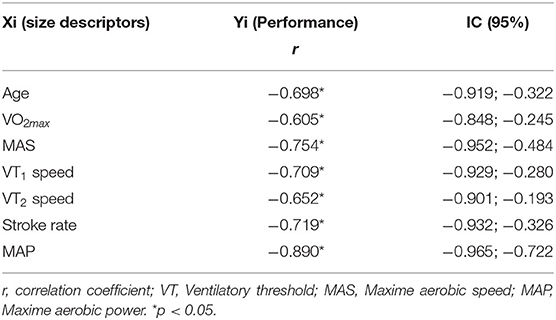
Table 2. Bivariate correlation between variables of performance and morphological, biomechanical, and physiological parameters.
Table 2 displays the significant correlations obtained between athletes' characteristics and physiological/biomechanical variables obtained in the GXT and performance during the TT. Age, O2max, MAS, VT1, and VT2 velocities, stroke rate and MAP displayed significant and negative correlations with time during TT. No morphological and maturational variables were significantly correlated with TT performance.
The multiple regressions enter method analysis revealed that MAP (β = −0.43, p = 0.001) and the corresponding stroke rate (β = −0.55, p = 0.04) were strong predictors of TT performance. The regression model explained (adjusted R2) 84.5% of the 1,000 m TT performance [F(2, 12) = 30.985 p < 0.000].
The resulting predictive equation is as follows:
This study aimed first to analyse the predictive value of biomechanical, maturational, morphological characteristics, and physiological parameters determined through a GXT on the 1,000 m TT performance in kayak-ergometer in young national-level kayakers. Second, compare biomechanical and physiological parameters between both tests (TT and GXT–O2max). It was found that O2peak, the stroke distance and stroke rate during the GXT were not different from the corresponding variables observed during the TT. Besides, the MAP and the corresponding stroke rate were strong predictive factors of 1,000 m TT performance.
Our results showed that O2peak measured during the 1,000 m TT was not different and highly correlated with O2max determined during the GXT. Hence, this study demonstrated that in well-trained young kayakers, cardiorespiratory fitness could be assessed during a time-trial test that mimics the performance attained in flat water. This result is of practical interest since athletes prefer to complete a TT instead of progressive tests. Performance (i.e., time to complete the task) can also be monitored using the former. The agreement between the GXT and TT founded in our study agrees with that obtained in O2peak reached during the incremental test and time-trial in cycling athletes (16). The mean relative O2max value found in our study is very similar to that measured in junior kayakers reported before (2). Besides, the average stroke rate and stroke distance recorded during the TT were also identical to those obtained during the GXT. Therefore, the 1,000 m TT can offer several parameters that are useful in assessing athletes while being easier to implement than GXT. Moreover, TT may be performed more often as a method to control performance without the influence of environmental factors (e.g., wind) (10).
Is well-accepted that in young athletes, the older athletes trend performed better, which could be explained by maturation relative factors. Athletes maturational advanced tend to show better performances as observed in Spanish young canoe sprint athletes which reinforce the need to evaluate age and maturity to interpret the performance in young canoe sprint athletes (8, 17). In our study, we did not observe the association of maturity on the performance due to the homogeneity of the sample that clearly surpass the PHV.
Comparing the results of the GXT and TT, we found differences on the percentage of MAP (4.2%), MAV (3.2%), absolute O2 (13.7%), and HR (6.7%). In another study, the model regression analysis showed that the O2max was the best predictor of performance in 1,000 m TT, which is in line with our results (2). A study involving Australian canoe sprint elite athletes showed that the smallest change of 0.3% in 200 m race time could be achieved with a 0.9% change in O2max (18). In longer distance events with a higher aerobic contribution (e.g., 2,000 m), it can be expected that a similar increase will further improve 1,000 m performance in O2max. The relative intensity of VT1 and VT2 found in our study are also in agreement with others (19). Previous research did not report the verified correlation of the velocity at VT1 and VT2 intensities with that of 1,000 m. These results support the importance of the aerobic-fitness variables as a valuable and useful marker for monitoring longitudinal athlete development and. They could also reinforce that better submaximal (velocity) performance influences the all-out time-trial performance.
The biomechanical variables showed that the athletes with the highest stroke rate and highest mechanical power output performed better in the TT, being able to apply and maintain a power value close to the MAP (17). However, in the study mentioned above conducted on water, the stroke distance and the stroke rate were reported as critical factors for mechanical efficiency and performance in young kayakers (20), whereas stroke distance was not significantly correlated with performance in the current study.
The lactate concentration values found in this study highlights the contribution of the anaerobic energy pathway to kayak TT performance and reinforces the role of the significant contribution of anaerobic energy sources in sprint kayak performance (5). The lactate value at the end of TT is in line with that reported in another study (3). The higher value found at the end of TT could be explained by greater exercising time at high intensity, in the TT, than GXT protocol where the sample remained up to 120 s at similar intensity.
The equation developed in our study showed higher explanatory power than that of Van Someren et al. (21) probably because we added the stroke rate at O2max which is a critical kinematic variable to performance, in conjunction with the maximal aerobic power.
In conclusion, we found that O2max, stroke distance and stroke rate during the GXT were not different from the corresponding variables (O2peak, stroke distance and stroke rate) observed during the TT, and that MAP and the corresponding stroke rate were strong predictors of 1,000 m TT performance. Our results confirmed that O2max, chronological age, the speed at VT1 and VT2, stroke rate and power output are significantly correlated with the performance in a 1,000 m time-trial. This study demonstrated that in well-trained young kayakers, cardiorespiratory fitness could be assessed during a time-trial test that mimics the actual performance attained in flat water. The final lactate confirmed the high contribution of the lactic anaerobic pathway (5). Therefore, coaches can use these variables (O2max, chronological age, the speed at VT1 and VT2, stroke rate and power output) as performance markers when monitoring their athletes with regards to predictive factors of sport-specific performance. Programming training to improve these variables may therefore also improve 1,000-m kayaking performance.
TT testing on a kayak ergometer may be a suitable and preferable alternative to graded exercise testing for determining O2max, the stroke distance and stroke rate among young, national-level kayakers due to its practicality and the ability to mimic actual performance. Findings from the current study suggest that O2max, chronological age, the speed at VT1 and VT2, stroke rate and power output are significant predictors of 1,000 m kayaking performance. Therefore, coaches can use these variables as performance indicators when monitoring their athletes with regards to predictive factors of sport-specific performance. Programming training to improve these variables may hence also improve 1,000 m kayaking performance.
The main limitation of the study was the small sample size. However, the athletes in the sample, are representative of the Portuguese national age group in flatwater. Unfortunately, we are not possible to research the ecological environment due to the equipment limitations. Nevertheless, the laboratory equivalent conditions in the applied protocols seem to be an appropriate research option with some advantages.
All datasets generated for this study are included in the article/supplementary material.
The studies involving human participants were reviewed and approved by Local Ethics Committee of the Faculty of Sports Science and Physical Education, University of Coimbra (CE/FCDEF-UC/00292019) approved the procedures. Written informed consent to participate in this study was provided by the participants' legal guardian/next of kin.
AC and LR conceived the experiment. AC, MM, FN, and LR designed and conducted the experiment. AC, FN, FA, AF, AD, MM, and LR analyzed the data, performed statistical analysis, and primary responsibility for the final content. All authors have read and approved the manuscript.
Portuguese Foundation for Science and Technology, CIDAF (uid/dtp/04213/2019).
The authors declare that the research was conducted in the absence of any commercial or financial relationships that could be construed as a potential conflict of interest.
We would like to thank the Portuguese Canoe Federation Team and the clubs for them participation in this study.
1. Van Someren KA, Palmer GS. Prediction of 200-m sprint kayaking performance. Can J Appl Physiol. (2003) 28:505–17. doi: 10.1139/h03-039
2. Borges TO, Dascombe B, Bullock N, Coutts AJ. Physiological characteristics of well-trained junior sprint kayak athletes. Int J Sports Physiol Perform. (2015) 10:593–9. doi: 10.1123/ijspp.2014-0292
3. Bishop D, Bonetti D, Dawson B. The influence of pacing strategy on VO2 and supramaximal kayak performance. Med Sci Sports Exerc. (2002) 34:1041–7. doi: 10.1097/00005768-200206000-00022
4. Bishop D, Bonetti D, Dawson B. The effect of three different warm-up intensities on kayak ergometer performance. Med Sci Sports Exerc. (2001) 33:1026–32. doi: 10.1097/00005768-200106000-00023
5. Gomes BB, Massart A, Figueiredo P, Santos MC, Fernandes RJ, Education P. Gross efficiency and energy expenditure in kayak ergometer exercise. Int J Sports Med. (2012) 654–60. doi: 10.1055/s-0032-1301907
6. Malina RM, Claessens AL, Van Aken K, Thomis M, Lefevre J, Philippaerts R, et al. Maturity offset in gymnasts: application of a prediction equation. Med Sci Sports Exerc. (2006) 38:1342–7. doi: 10.1249/01.mss.0000227321.61964.09
8. Alacid F, Marfell-Jones M, López-Miñarro P, Martínez I, Muyor J. Morphological characteristics of young elite paddlers. J Hum Kinet. (2011) 27:95–110. doi: 10.2478/v10078-011-0008-y
9. Losnegard T, Myklebust H, Skattebo O, Stadheim HK, Sandbakk, Hallén J. The influence of pole length on performance, O2 cost, and kinematics in double poling. Int J Sports Physiol Perform. (2017) 12:211–7. doi: 10.1123/ijspp.2015-0754
10. Van Someren KA, Hawley JA, Phillips GRW, Palmer GS. Comparison of physiological responses to open water kayaking and kayak ergometry. Int J Sports Med. (2000) 30:5. doi: 10.1055/s-2000-8877
11. Van Someren KA, Oliver JE. The efficacy of ergometry determined heart rates for flatwater kayak training. Int J Sports Med. (2002) 23:28–32. doi: 10.1055/s-2002-19268
12. Tanner RK, Gore CJ. Physiological Tests for Elite Athletes. 2nd Edition. Champaign, IL: Human Kinetics (2013).
13. Mirwald RL, Baxter-Jones ADG, Bailey DA, Beunen GP. An assessment of maturity from anthropometric measurements. Med Sci Sports Exerc. (2002) 34:689–94. doi: 10.1249/00005768-200204000-00020
14. Howley ET, Bassett DR, Welch HG. Criteria for maximal oxygen uptake: review and commentary. Med Sci Sports Exerc. (1995) 27:1292–301. doi: 10.1249/00005768-199509000-00009
15. Cohen J. Statiscal power analysis. Psychol. Sci. (1992) 1:98–101. doi: 10.1111/1467-8721.ep10768783
16. Karsten B, Baker J, Naclerio F, Klose A, Bianco A, Nimmerichter A. Time trials versus time to exhaustion tests: effects on critical power, w' and oxygen uptake kinetics. Int J Sports Physiol Perform. (2017) 13:183–8. doi: 10.1123/ijspp.2016-0761
17. López-Plaza D, Alacid F, Muyor JM, López-Miñarro PÁ. Sprint kayaking and canoeing performance prediction based on the relationship between maturity status, anthropometry and physical fitness in young elite paddlers. J Sports Sci. (2016) 35:1083–90doi: 10.1080/02640414.2016.1210817
18. Pickett CW, Nosaka K, Zois J, Hopkins WG, Blazevich JA. Maximal upper body strength and oxygen uptake are associated with performance in high-level 200-M sprint kayakers. J Strength Cond Res. (2017) 32:3186–90. doi: 10.1519/JSC.0000000000002398
19. Cottin F, Leprêtre PM, Lopes P, Papelier Y, Médigue C, Billat V. Assessment of ventilatory thresholds from heart rate variability in well-trained subjects during cycling. Int J Sports Med. (2006) 27:959–67. doi: 10.1055/s-2006-923849
20. Alacid F, Ferrer V, Martínez E, Carrasco L. Análisis cuantitativo de la técnica de paleo en kayakistas infantiles. Eur J Hum Mov. (2005) 13:133–146.
Keywords: maturation, canoe sprint, young kayakers, 1,000 m, time-trial, VO2max, canoeing and kayaking, ventilatory threshhold
Citation: Coelho AB, Nakamura FY, Morgado MC, Alves F, Di Baldassarre A, Flatt A and Rama L (2021) Prediction of Simulated 1,000 m Kayak Ergometer Performance in Young Athletes. Front. Public Health 8:526477. doi: 10.3389/fpubh.2020.526477
Received: 13 January 2020; Accepted: 21 December 2020;
Published: 20 January 2021.
Edited by:
Fernando Alacid, University of Almeria, SpainReviewed by:
Daniel López-Plaza, Catholic University San Antonio of Murcia, SpainCopyright © 2021 Coelho, Nakamura, Morgado, Alves, Di Baldassarre, Flatt and Rama. This is an open-access article distributed under the terms of the Creative Commons Attribution License (CC BY). The use, distribution or reproduction in other forums is permitted, provided the original author(s) and the copyright owner(s) are credited and that the original publication in this journal is cited, in accordance with accepted academic practice. No use, distribution or reproduction is permitted which does not comply with these terms.
*Correspondence: André B. Coelho, YW5kcmViYXN0b3Njb2VsaG9AaG90bWFpbC5jb20=
Disclaimer: All claims expressed in this article are solely those of the authors and do not necessarily represent those of their affiliated organizations, or those of the publisher, the editors and the reviewers. Any product that may be evaluated in this article or claim that may be made by its manufacturer is not guaranteed or endorsed by the publisher.
Research integrity at Frontiers
Learn more about the work of our research integrity team to safeguard the quality of each article we publish.