
94% of researchers rate our articles as excellent or good
Learn more about the work of our research integrity team to safeguard the quality of each article we publish.
Find out more
ORIGINAL RESEARCH article
Front. Psychol., 13 February 2025
Sec. Quantitative Psychology and Measurement
Volume 16 - 2025 | https://doi.org/10.3389/fpsyg.2025.1535140
 Halime Arıkan1*
 Meral Sertel2
Introduction: While studies on version adaptation, validity, and reliability are common, no tools exist in Turkish literature to assess exercise preferences in stroke patients. This research aimed to translate the Stroke Exercise Preference Inventory (SEPI) into Turkish and evaluate its validity and reliability in stroke patients.
Methods: Ninety stroke patients completed the SEPI, Exercise Benefits/ Barriers Scale (EBBS), Behavioral Regulation in Exercise Questionnaire (BREQ-2), Stroke-Specific Quality of Life Scale (SSQoLS), and Frenchay Activities Index (FAI). The SEPI was translated into Turkish using a standard forward-backward translation process. Psychometric properties such as structural and construct validity, test–retest reliability, and internal consistency were assessed.
Results: Reliability analysis demonstrated high internal consistency for SEPI-13, with Cronbach’s α values of 0.931. Validity testing revealed a 3-factor structure for SEPI-13, explaining 69.029% of total variance. CFA confirmed the model with acceptable fit indices. Construct validity showed good correlations with EBBS (r = −0.771; p < 0.001) and BREQ-2 (r = from −0.541 to 0.732; p < 0.001) for convergent validity, while divergent validity was supported by weak correlations with SSQoLS (r = 0.165; p = 0.120) and FAI (r = 0.137; p = 0.197). No floor or ceiling effects were observed for SEPI-13.
Discussion: The Turkish SEPI is a reliable and valid tool for assessing exercise preferences in stroke patients, aiding their rehabilitation.
Stroke is a significant concern for public health systems globally (Organization WH, 2006). Billinger et al. identify physical inactivity as a major contributing factor to stroke (Billinger et al., 2014). The mortality rate following a stroke has declined due to interventions like managing cardiovascular risks, smoking cessation, and hypertension prevention programs. Furthermore, studies show that individuals aged 20–59 who engage in regular physical activity have a lower prevalence of stroke. However, physical activity typically diminishes with age (Mozaffarian et al., 2015). Previous research indicates that 77% of stroke survivors lead sedentary lifestyles or have low levels of physical activity (Senes, 2006).
Recent research indicates that regular physical activity aids motor recovery, enhances cardiorespiratory fitness, boosts walking speed and balance, and reduces the risk of recurrent stroke (Mead and Bernhardt, 2011; Saunders et al., 2020). There are strong evidence that there are a bidirectional relationship between participation and higher levels of physical activity in stroke survivors regardless time since stroke (de Diego-Alonso et al., 2024a). Consequently, identifying strategies to enhance participation and adherence in post-stroke physical activity programs is crucial for maintaining and improving physical function and quality of life. Exercise preferences vary across health conditions, such as breast cancer (Rogers et al., 2007; Rogers et al., 2009) and aging (Banks et al., 2012). According to Banks et al., stroke survivors tend to prefer structured group exercises in gyms and community centers (Banks et al., 2012). Moreover, there are studies emphasizing the importance of understanding the needs of stroke survivors when prescribing physical activity and exercise in intervention programs by healthcare professionals, considering the individual perceptions after stroke, the reasons for and against physical activity and exercise, and their impact on daily lives and activities (de Diego-Alonso et al., 2024c). Thus, exercise preferences are influenced by health conditions, living environments, and cultural and social factors (Rogers et al., 2009; Banks et al., 2012).
Validity and reliability studies are essential in developing and adapting measurement tools, as they ensure that the instruments accurately and consistently capture the intended constructs. Such studies are particularly crucial in clinical and rehabilitation settings, where the outcomes directly impact patient care and decision-making (Bazancir-Apaydin and Sari, 2024). To date, there are limited tools available for evaluating exercise preferences and barriers among stroke survivors, and no such scale has been developed or adapted for use in the Turkish language. While some general scales, such as the Exercise Benefits and Barriers Scale (EBBS) (Dilek and Akyol, 2019), have been utilized to assess exercise-related constructs, these tools do not comprehensively address the specific preferences and barriers unique to stroke survivors. The SEPI stands out as a robust tool that integrates both exercise preferences and barriers, providing clinicians and researchers with a more nuanced understanding of this population’s needs. By adapting SEPI to Turkish, this study addresses a critical gap in the literature and provides a valuable resource for clinical and research applications in Turkey.
The Stroke Exercise Preference Inventory (SEPI), originally developed in English, has been used with stroke survivors in Australia (Bonner et al., 2016). Currently, there are no tools available in Turkish literature to assess exercise preferences in stroke patients or other patient groups. The SEPI serves as a useful scale for exploring exercise preferences in individuals who have experienced a stroke, aiding in the development and planning of tailored exercise programs (Bonner et al., 2016). This study aims to validate and analyze the reliability of the Turkish version of SEPI for assessing exercise preferences in stroke patients. The findings highlight the significance of exercise preferences in physiotherapy and rehabilitation practices, with potential for future evaluation in other conditions.
This study was planned as cross-sectional research. The research sample consisted of 99 individuals over the age of 18 referred to Kırıkkale University, Faculty of Health Sciences, Department of Physiotherapy and Rehabilitation, who had a stroke and good cognitive status.
Individuals who had a stroke, had good cognitive status (to have 24 or more from the Mini-Mental Status Assessment), to be able to walk at least 10 min dependently, could speak, read and write Turkish, and volunteered to participate were included in the study. Individuals who were pregnant, could not speak, read or write Turkish, and had any other concomitant neurological and psychiatric disorders were excluded from the study.
The study was carried out in accordance with the Helsinki Declaration. Informed Consent Forms were signed by all participants. This consent allows the use of data collected from individuals. Ethical approval was obtained from the Tokat Gaziosmanpaşa University Clinical Research Ethics Committee (13 April 2023 – decision no.: 83116987–272). The study was registered on ClinicalTrials.gov (NCT05839808).
In the original version of the SEPI, the Intraclass Correlation Coefficient (ICC) value was not calculated. And no other version study has been encountered. Therefore, based on the literature (Portney and Watkins, 2009), the expected reliability level (0.75–0.90) (ρ1 = 0.85), the minimum acceptable reliability level (ρ0 = 0.75) (Andresen, 2000), α = 0.05, β = 0.20 were taken, and the sample size was determined as 99. The sample size calculation was based on psychometric property evaluations, aligned with Consensus-based Standards for the Selection of Health Measurement Instruments (COSMIN) recommendations. A minimum of 5–10 participants per item was targeted for factor analysis, ensuring sufficient power for reliability and validity assessments (Mokkink et al., 2019). For the 13-item main inventory of the SEPI, including at least 65 individuals was sufficient. The item properties for the SEPI were analyzed among 90 participants as part of the scale development process, while reliability analyses were conducted with 70 participants.
The participants were stable between repeated measurements, as confirmed by their consistent clinical status. The time interval between the test and retest measurements was 7–14 days, ensuring an adequate duration to minimize recall bias while maintaining clinical stability (Arikan et al., 2023). Data collection was conducted by a two rater.
Permission was obtained from the survey developer at the beginning of the study (Bonner et al., 2016). The adaptation process was performed according to the guideline suggested by Beaton et al. (2000).
Forward translation: Two forward translations were obtained by two bilingual translators, one (T1) familiar with the research concept and the other (T2) unaware. The original English version of the SEPI was translated into Turkish.
Synthesis: The resulting translations were checked and turned into a single translation (T12).
Backward translation: The Turkish version created (T12) was translated back into English by two native English-speaking translators who did not know the original version of the questionnaire. Two English back translations (BT1 and BT2) were obtained.
Expert board: The original version of the inventory and all translations (T1, T2, T12, BT1, BT2) were reviewed by the expert committee, and the inventory was finalized. While creating the final version of the inventory, the translations were evaluated in terms of semantic, idiomatic, experiential, and conceptual equivalences.
Prefinal version: The final version created was tested on 30 individuals. Both the meaning features of the items and the answers of the individuals were examined. No unfavorable status was detected.
The expert committee reviewed the translations for semantic, idiomatic, experiential, and conceptual equivalences. Throughout the review process, there was complete agreement among the experts on all items, and no discrepancies were observed. Therefore, statistical analyses to quantify inter-rater reliability, such as the coefficient of variation, were deemed unnecessary.
Content validity was assessed by an expert committee, who evaluated the items for semantic, idiomatic, experiential, and conceptual equivalences. The committee reached full consensus on all items, ensuring that the inventory comprehensively addressed the construct of exercise preferences in stroke survivors.
SEPI, developed in 2016, is a 13-item inventory that also includes 9 items assessing exercise barriers. The SEPI is a useful tool for clinicians to identify the exercise preferences of stroke survivors and to understand their attitudes toward continuing exercise and rehabilitation programs. It facilitates the creation and planning of personalized exercise regimens for individuals who have experienced a stroke. Each item in the SEPI is scored as a percentage. The maximum score for the 13-item exercise preference inventory (SEPI-13) is 1,300, while the minimum score is 0. For the 9-item exercise barriers section, the maximum score is 900, and the minimum is 0. An increasing score in SEPI-13 indicates a higher degree of positive engagement in exercise preferences, whereas an increasing score in the exercise barriers section reflects greater barriers to exercise (Bonner et al., 2016). The SEPI structure consists of seven factors, confirmed via confirmatory factor analysis. While each factor can be calculated individually as the mean of its respective items, the factors are composed as follows:
Factor 1 (Supervision-support): Mean of items Q1 and Q8.
Factor 2 (Confidence-challenge): Mean of items Q2 and Q9.
Factor 3 (Health-wellbeing): Mean of items Q3 and Q10.
Factor 4 (Exercise context): Mean of items Q4 and Q11.
Factor 5 (Home-alone): Mean of items Q5 and Q12.
Factor 6 (Similar others): Mean of items Q6 and Q13.
Factor 7 (Music-TV): Single-item score (Q7).
In this study, however, a total score was calculated by summing all items across factors to provide a comprehensive measure of exercise preferences and barriers. This approach was used for subsequent correlation analyses with external parameters, as it allows for a holistic understanding of participants’ preferences. There is no Turkish version of SEPI. This study was the first to produce a Turkish version.
The MMT was employed to quantitatively evaluate cognitive performance. It comprises 11 items organized under five main categories: orientation, recording memory, attention and calculation, recall, and language, with a total possible score of 30. A score of at least 24 is required. The Turkish version’s validity and reliability were established by Folstein et al. (1975) and Gungen (2002).
The FAI is a 15-item index designed to assess the frequency of daily and social activities in individuals with stroke. The initial 10 items request individuals to indicate how often they performed household chores, such as cooking and doing laundry, in the last 3 months. The subsequent five items ask about the frequency of social activities, like traveling and gardening, over the past 6 months. Responses are scored from 0 (never) to 3 (at least once per week), with total scores ranging from 0 (no participation) to 45 (frequent participation) (Schuling et al., 1993). The Turkish version of the FAI has undergone validity and reliability testing (Alaca, 2020).
The SSQoL is a 49-item scale comprising 12 domains designed to evaluate the quality of life in individuals diagnosed with stroke. These domains include energy (3 items), work/productivity (3 items), vision (3 items), personality traits (3 items), family roles (3 items), thinking (3 items), language (5 items), social roles (5 items), self-care (5 items), mood (5 items), upper extremity function (5 items), and mobility (6 items). Each item is rated using a Likert scale ranging from 1 to 5, where a higher score reflects a higher quality of life, and a lower score indicates a lower quality of life (Williams et al., 1999). The Turkish version of the SSQoL has been validated and found reliable (Hakverdioğlu Yönt and Khorshid, 2012).
The EBBS consists of 24 items, two open-ended questions, and is organized into six sub-dimensions. Of the 24 items, 12 are statements regarding the benefits of exercise, while the other 12 pertain to barriers to exercise, with negative items being reverse-coded. The scale uses a 4-point Likert rating system, with total scores ranging from 24 to 96. Higher scores reflect a greater perception of exercise benefits and fewer perceived barriers (Sechrist et al., 1987). The Turkish version of the EBBS has been validated and found reliable (Dilek and Akyol, 2019).
The BREQ-2 consists of 19 items divided into five subscales: amotivation, external regulation, introjected regulation, identified regulation, and intrinsic regulation. It uses a 5-point Likert scale with scores ranging from 0 to 4 (Mullan et al., 1997). A validity and reliability study has been conducted for the Turkish population (Ersöz et al., 2012).
Ambulation level was assessed using the Functional Ambulation Category (FAC), a tool designed to classify walking ability into six categories ranging from 0 (non-functional ambulation) to 5 (independent ambulation on all surfaces). Higher scores indicate better ambulation capacity (Mehrholz et al., 2007).
Statistical analysis was performed using the Statistical Package for Social Sciences (SPSS 22.0, SPSS Inc., Chicago, Illinois) for Windows. Confirmatory factor analysis was conducted with Lisrel version 8.80. Statistical data are presented as mean ± standard deviation (X ± SD), median, or percentage (%). The Kolmogorov–Smirnov test was employed to determine whether the data followed a parametric or nonparametric distribution.
Reliability analysis was conducted by testing internal consistency with Cronbach’s alpha and test–retest reliability with the Intraclass Correlation Coefficient (ICC). Cronbach’s α values meaning “weak,” “moderate,” “good” and “excellent/strong” are 0–0.69, 0.70–0.79, 0.80–0.89, and 0.90–1.00, respectively. ICC values indicating poor, moderate, good, and excellent reliability are <0.5, 0.5–0.75, 0.75–0.90, and > 0.90, respectively. ICC were calculated using a two-way random effects model ICC (Billinger et al., 2014; Organization WH, 2006) to assess agreement between test–retest measurements. This model accounts for variability across participants and measurements, ensuring a robust evaluation of reliability. To evaluate the agreement and systematic differences between test–retest scores and Bland–Altman plots (95% limits of agreement) were utilized.
Reproducibility was assessed through the standard error of measurement (SEM) and the minimum detectable change (MDC), calculated using the following formulas (Portney, 2020):
MDC95: z * SEM * √2, where z = 1.96 (reflecting a 95% confidence) and SEM is the standard error of measurement.
MDC90: z * SEM * √2, where z = 1.65 (reflecting a 90% confidence) and SEM is the standard error of measurement.
SEM: SD * √(1-ICC), where SD is the standard deviations of participants, and ICC is the reliability coefficient.
The structural validity of the SEPI was evaluated using both exploratory factor analysis (EFA) and confirmatory factor analysis (CFA). The suitability of the sample tests was evaluated with the Bartlett test, and the sample adequacy was evaluated with the Kaiser Meyer Olkin test (Feise and Menke, 2001). The resulting factor structure was tested with CFA. Fit indices regarding this analysis were also examined (İlhan and Çetin, 2014).
The relationship of SEPI-13 with EBBS, BREQ-2, SSQoLS, and FAI scores was tested with Pearson correlation analysis. Correlation coefficients were interpreted as follows: 0.81–1.00 (excellent), 0.61–0.80 (very good), 0.41–0.60 (good), 0.21–0.40 (weak), and 0.00–0.20 (poor) (Feise and Menke, 2001). To evaluate convergent validity, we hypothesized that SEPI-13 and exercise barriers scores would show strong negative correlations with EBBS and amotivation (BREQ-2), and strong positive correlations with intrinsic motivation (BREQ-2). For divergent validity, we expected SEPI-13 scores to show weak or non-significant correlations with unrelated constructs, such as specific domains of the SSQoLS and FAI.
To assess ceiling and floor effects, the percentages of the minimum and maximum SEPI scores were calculated (Terwee et al., 2007).
Statistical significance value was accepted as p < 0.05.
Although the sample size calculation indicated that 99 participants would be ideal for evaluating psychometric properties, a total of 90 stroke survivors were included in the study. This sample size was determined to be sufficient for conducting validity and reliability analyses based on the results obtained.
The translation process followed the standard forward-backward translation methodology. Two independent bilingual translators performed forward translations of the original SEPI into Turkish, followed by a synthesis of the translations. The synthesized version was then back-translated into English by two native English speakers who were blinded to the original version. An expert committee reviewed the translations for semantic, idiomatic, experiential, and conceptual equivalences, ensuring the Turkish version accurately reflected the original content. The final Turkish version was tested and finalized for validity and reliability.
The expert committee unanimously agreed on the evaluations of semantic, idiomatic, experiential, and conceptual equivalences of the translations. As there were no disagreements among the experts, formal statistical measures of agreement, such as the coefficient of variation, were not performed.
Present study included 90 individuals, 32 female and 58 male, with an average age of 57.56 ± 15.25 years. While the average MMT score of the individuals was 25.77 ± 2.20, the average ambulation level was 3.23 ± 2.41. Other descriptive information about the individuals was presented in Table 1.
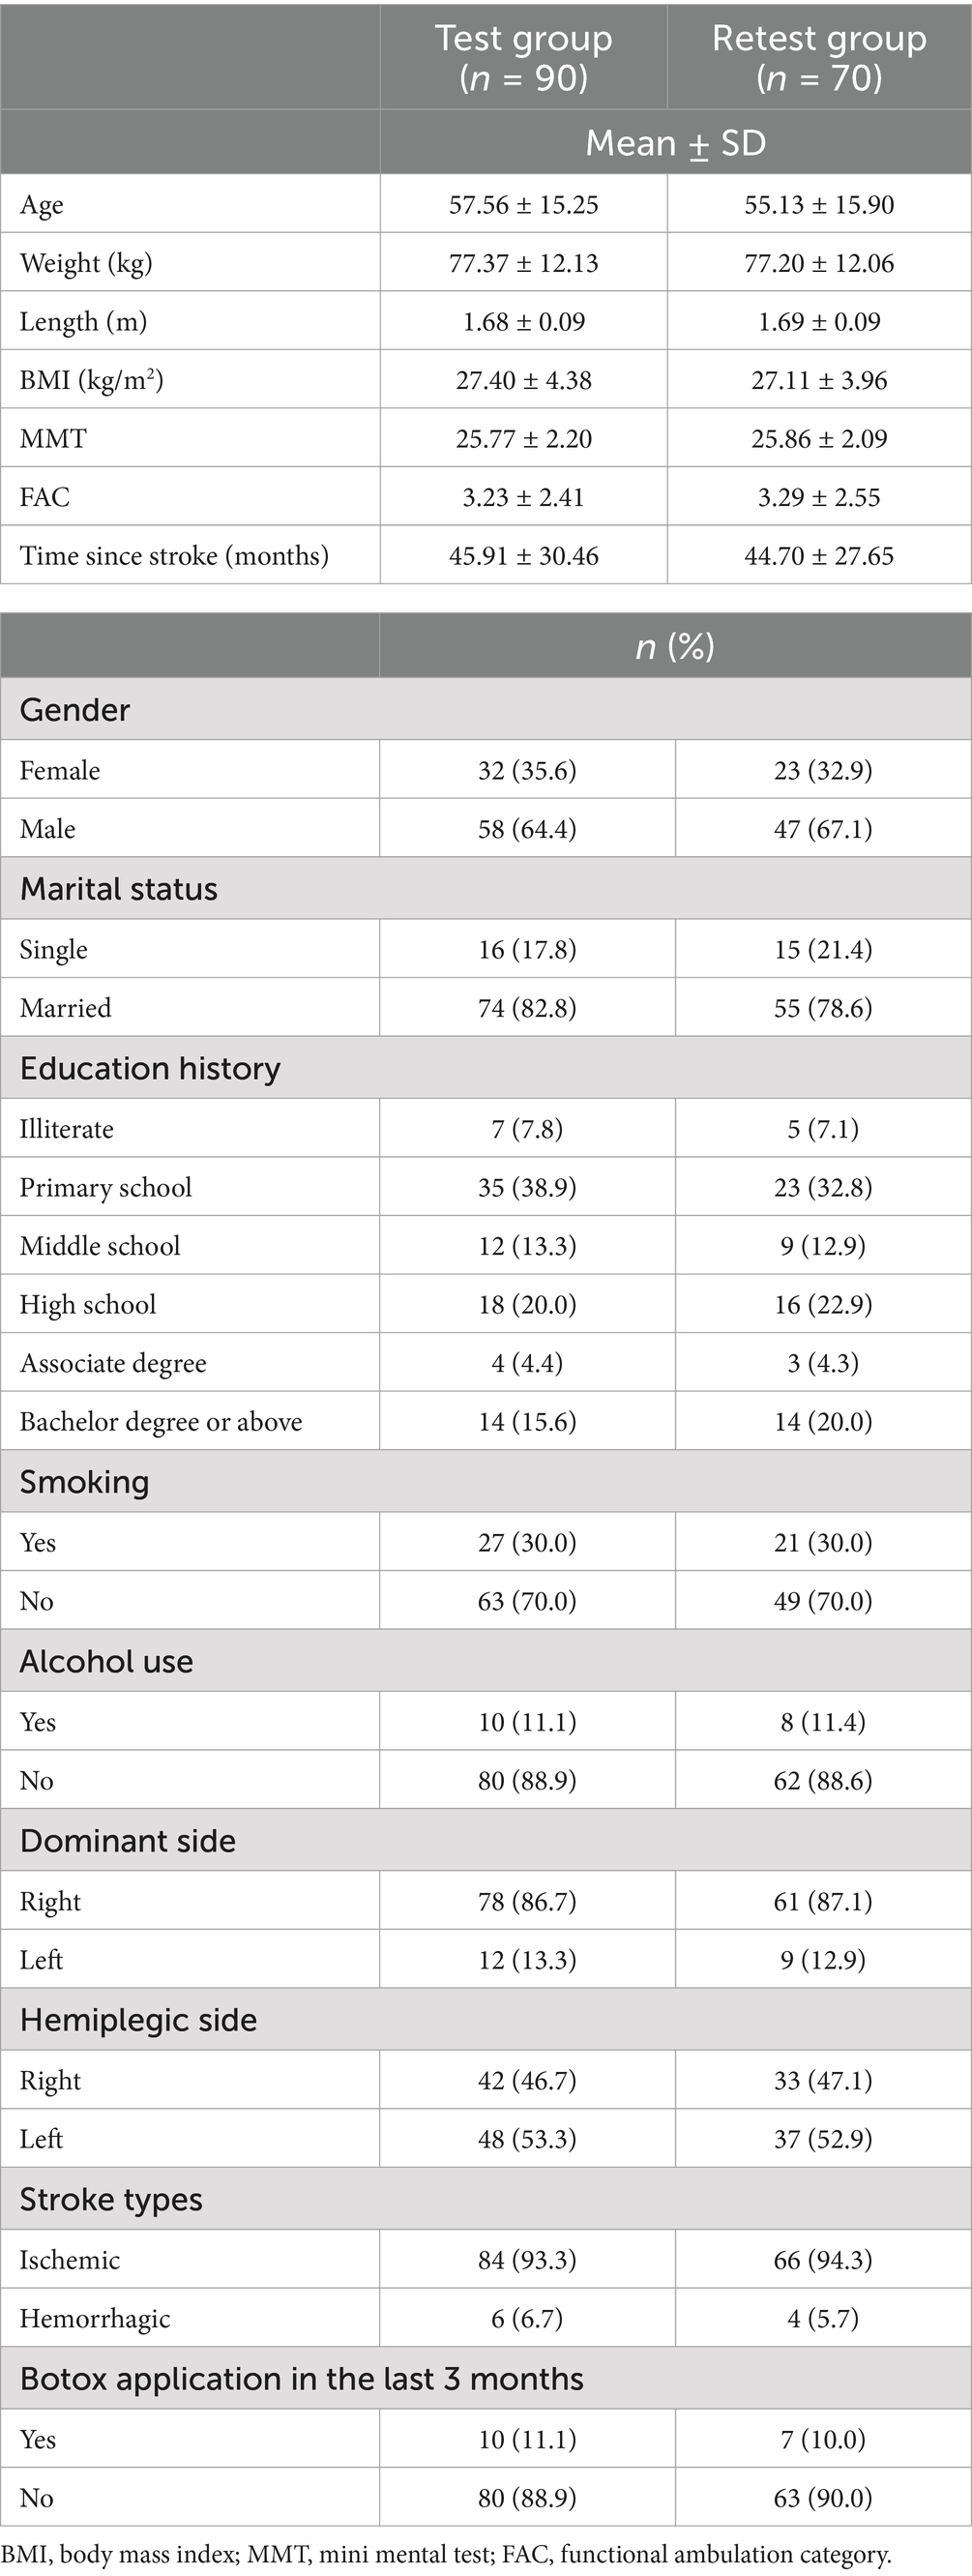
Table 1. Descriptive characteristics of individuals.
Content validity of the Turkish version of the SEPI was ensured through evaluations by an expert committee. The experts reached unanimous agreement on all items, confirming that the inventory appropriately addresses the construct of exercise preferences in stroke survivors. The inclusion of participants with preserved good cognitive status aligns with prior studies, enabling accurate comprehension and response to the inventory, and supporting its applicability in regular clinical practice (de Diego-Alonso et al., 2024b).
The questionnaire consisted of two sections: SEPI-13 and exercise barriers. During the retest phase, some participants did not complete the exercise barriers section, resulting in a smaller dataset for this analysis (n = 53). This was taken into account when interpreting the results.
The mean scores for individual items ranged from 47.20 to 82.76%, with corresponding standard deviations between 23.95 and 34.04%. The total score for SEPI-13 had a mean of 824.8 (out of 1,300) with a standard deviation of 278.7. Exercise barriers had a mean score of 342.8% (standard deviation: 204.0%), reflecting the overall scores for the questionnaire. Internal consistency analysis results showed that Cronbach’s α was 0.93 for SEPI-13 and 0.90 for exercise barriers. The Cronbach’s alpha values, if each item were deleted, ranged from 0.89 to 0.91, indicating strong internal consistency. ICC values were 0.87 for SEPI-13 and 0.82 for exercise barriers, further supporting the reliability of the scale. The SEM values for SEPI-13 and exercise barriers were 96.9 and 90.0, respectively, while the MDC values were 268.8 and 249.5 within the 95% confidence interval and 226.3 and 210.0 within the 90% confidence interval. These values indicate acceptable measurement precision for both scales (Table 2). The Turkish version of SEPI-13 demonstrated good reliability, with Cronbach’s α values in the excellent range (>0.90) and ICC values between 0.75 and 0.90, classified as good reliability. Bland–Altman plots also demonstrated agreement and consistency between test and retest scores (Figure 1). Bland–Altman plots demonstrated the agreement between test and retest scores. For SEPI-13, the mean difference was 57.90, corresponding to a percentage difference of approximately 4.45% (calculated based on the maximum score of 1,300). For exercise barriers, the mean difference was 25.47, corresponding to a percentage difference of approximately 2.83% (calculated based on the maximum score of 900). These results indicate good agreement and minimal bias between test and retest measurements.
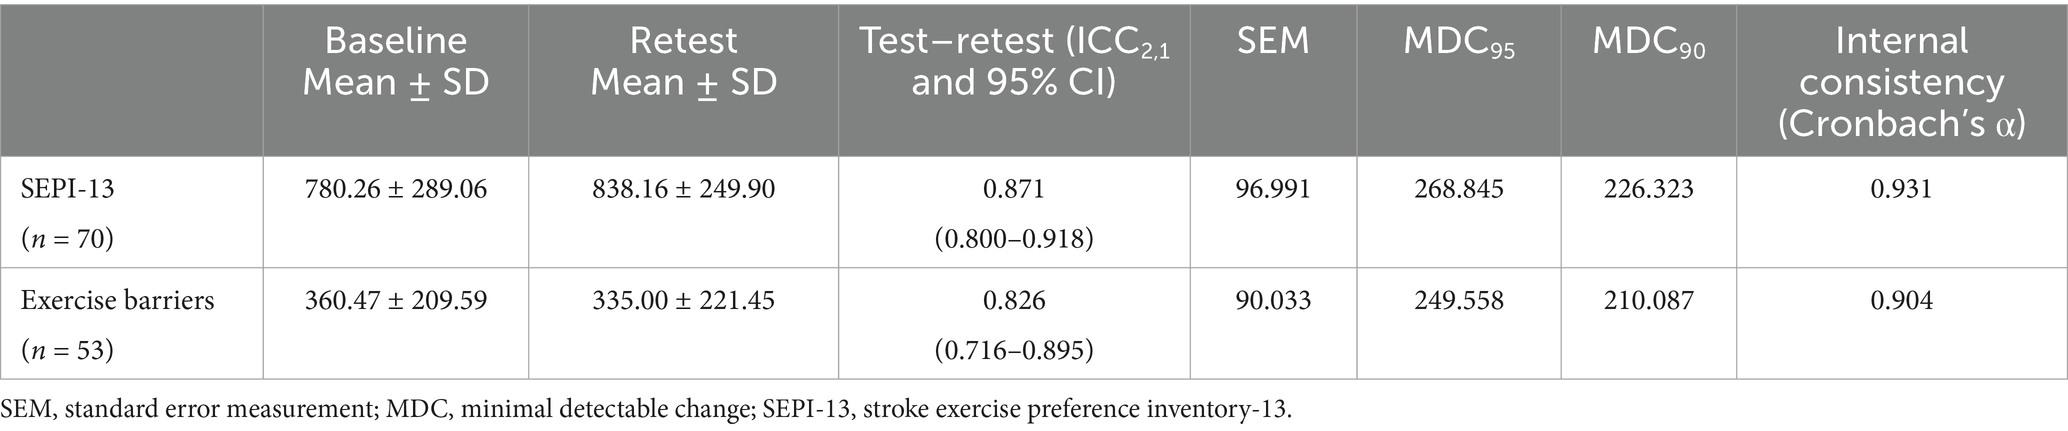
Table 2. Test–retest reliability and internal consistency values of the SEPI-13 and exercise barriers (n = 70).
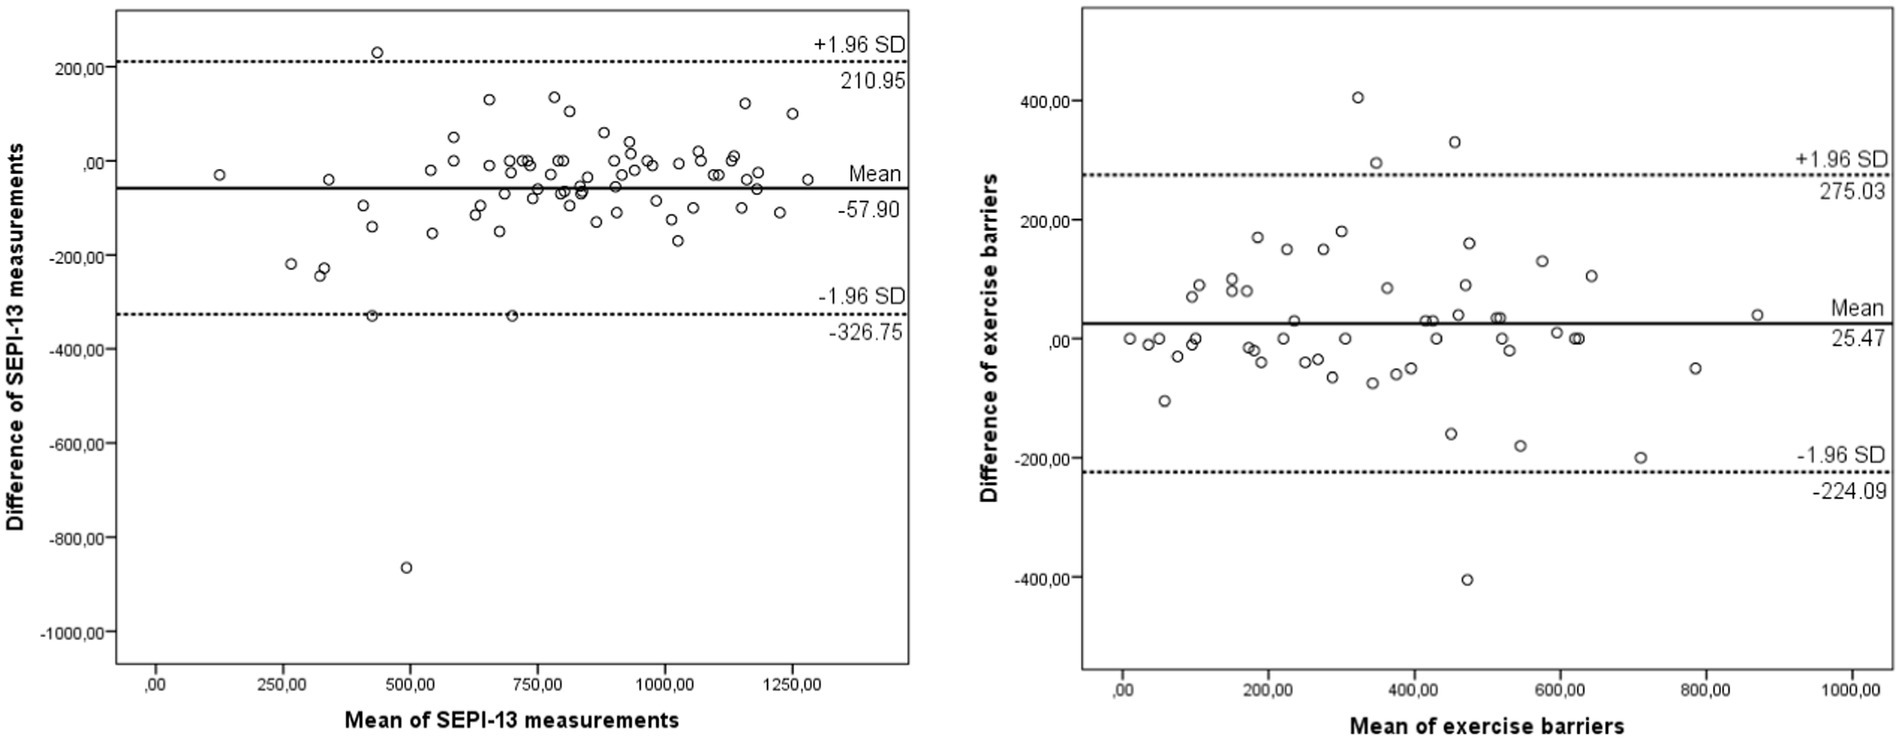
Figure 1. Bland–Altman plots of test and retest scores in SEPI-13 and exercise barriers.
The Turkish version of SEPI-13 showed a 3-factor structure (Figure 2). The Kaiser–Meyer–Olkin measure was 0.874. Bartlett’s test of sphericity result was 712.244 (p < 0.001). The total variation percentage was found to be 69.029 (Table 3). The 3-factor structure was tested with CFA (Figure 3). The fit indices were largely good (Table 4).
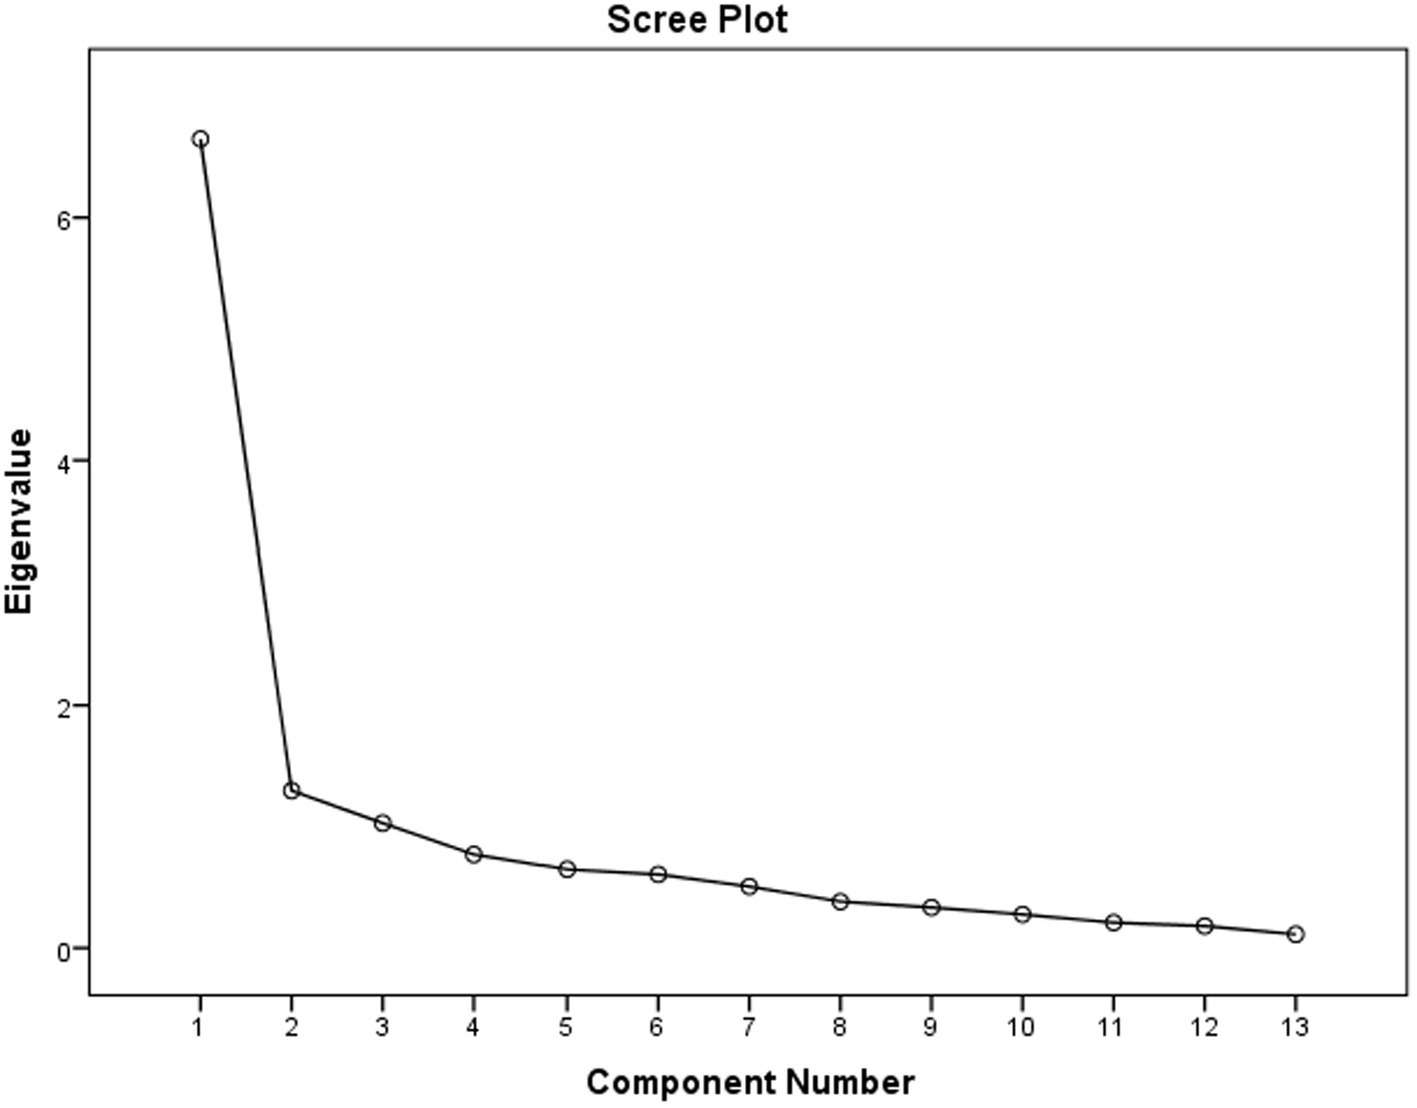
Figure 2. Scree plot of the three-factor structure of SEPI-13.
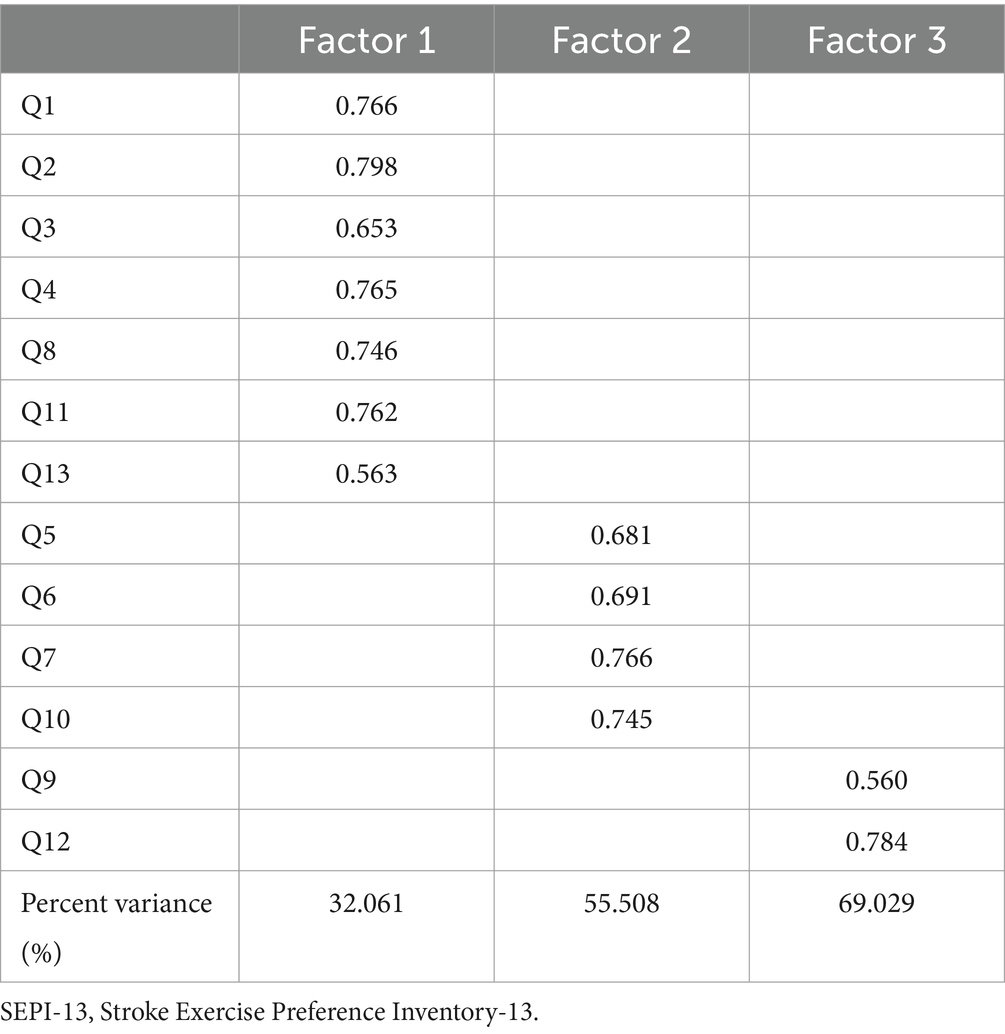
Table 3. Three factor structure of SEPI-13 (n = 90).
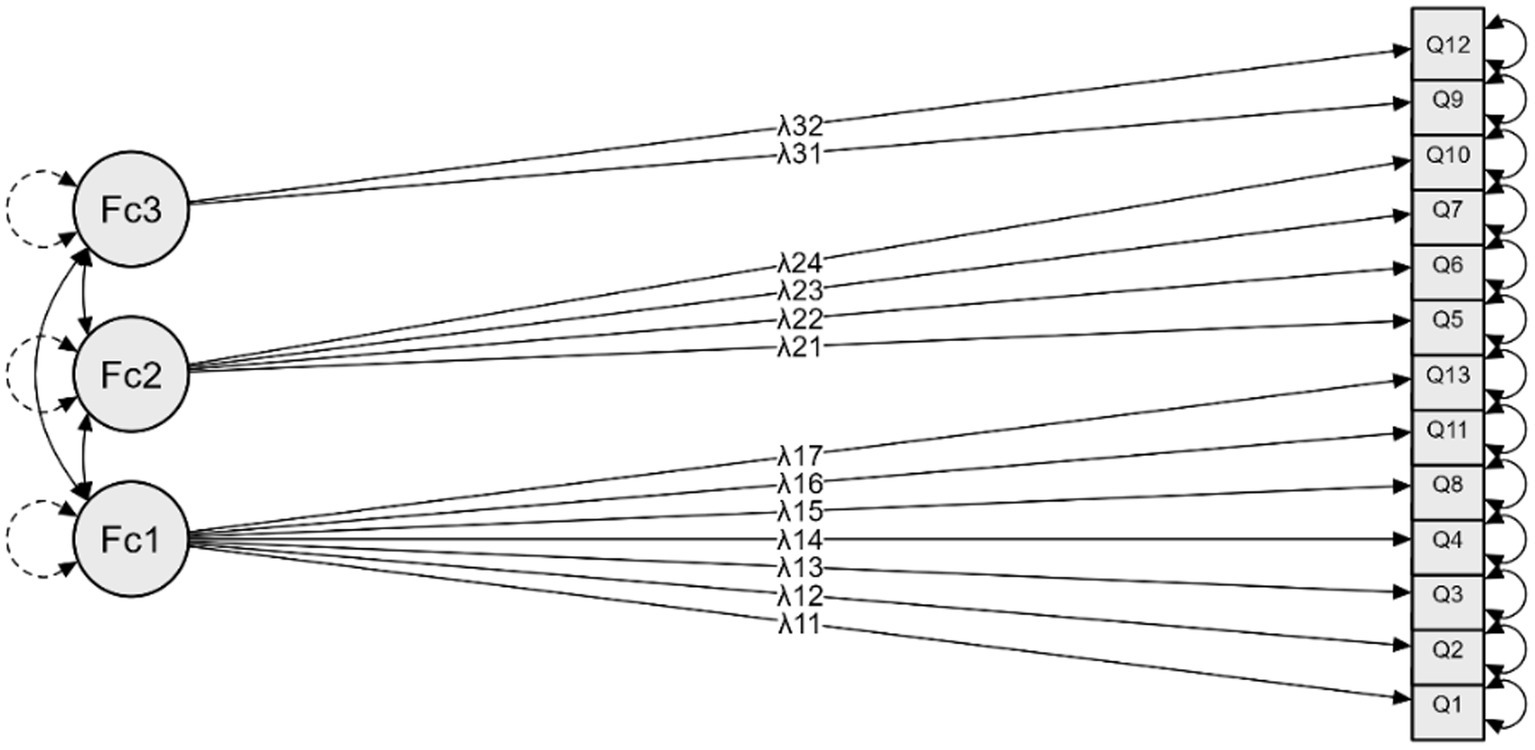
Figure 3. Confirmatory Factor Analysis model plot supporting the three-factor structure of SEPI-13.
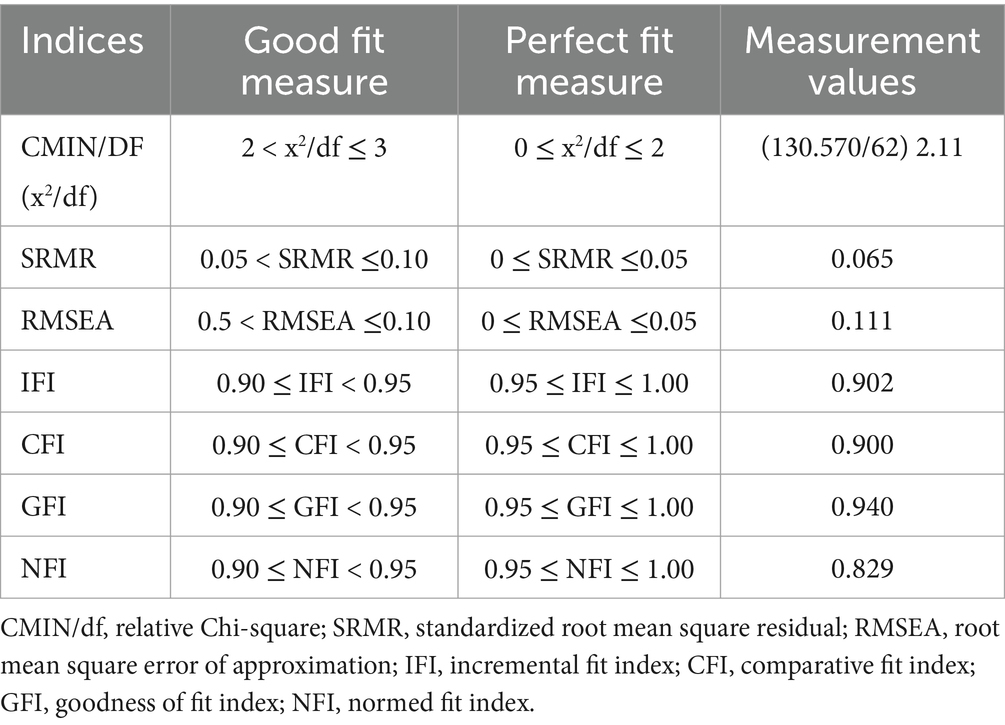
Table 4. Confirmatory Factor Analysis results of the three-factor SEPI-13 model obtained with Principal Component Analysis and Varimax rotation (n = 90).
To provide additional context for the correlation results, we have included the mean and standard deviation values for all variables in Table 5. This table offers detailed descriptive statistics to complement the correlations presented in Table 6. The relationship between SEPI-13 and exercise barriers with EBBS, BREQ-2, SSQoLS, and FAI scores was determined for construct validity. For convergent validity, the correlation of SEPI-13 and exercise barriers with EEBS and BREQ-2 was found to be −0.771, 0.719 and 0.732, −0.736, respectively. For divergent validity, SEPI-13 and exercise barriers had insignificant and weak correlations with SSQoLS and FAI, respectively. The correlation of 0.64 between barriers assessed by EBBS and barriers assessed by SEPI indicates that while both scales assess exercise barriers, they may capture different dimensions or levels of barriers. SEPI is designed to explore individual-specific barriers, whereas EBBS captures broader categories of barriers, which may result in a very good correlation rather than a perfect agreement (Table 6). The observed correlations between SEPI-13 and related constructs were consistent with our pre-established hypotheses regarding both magnitude and direction. These findings support the validity of SEPI-13 in assessing exercise preferences and barriers.
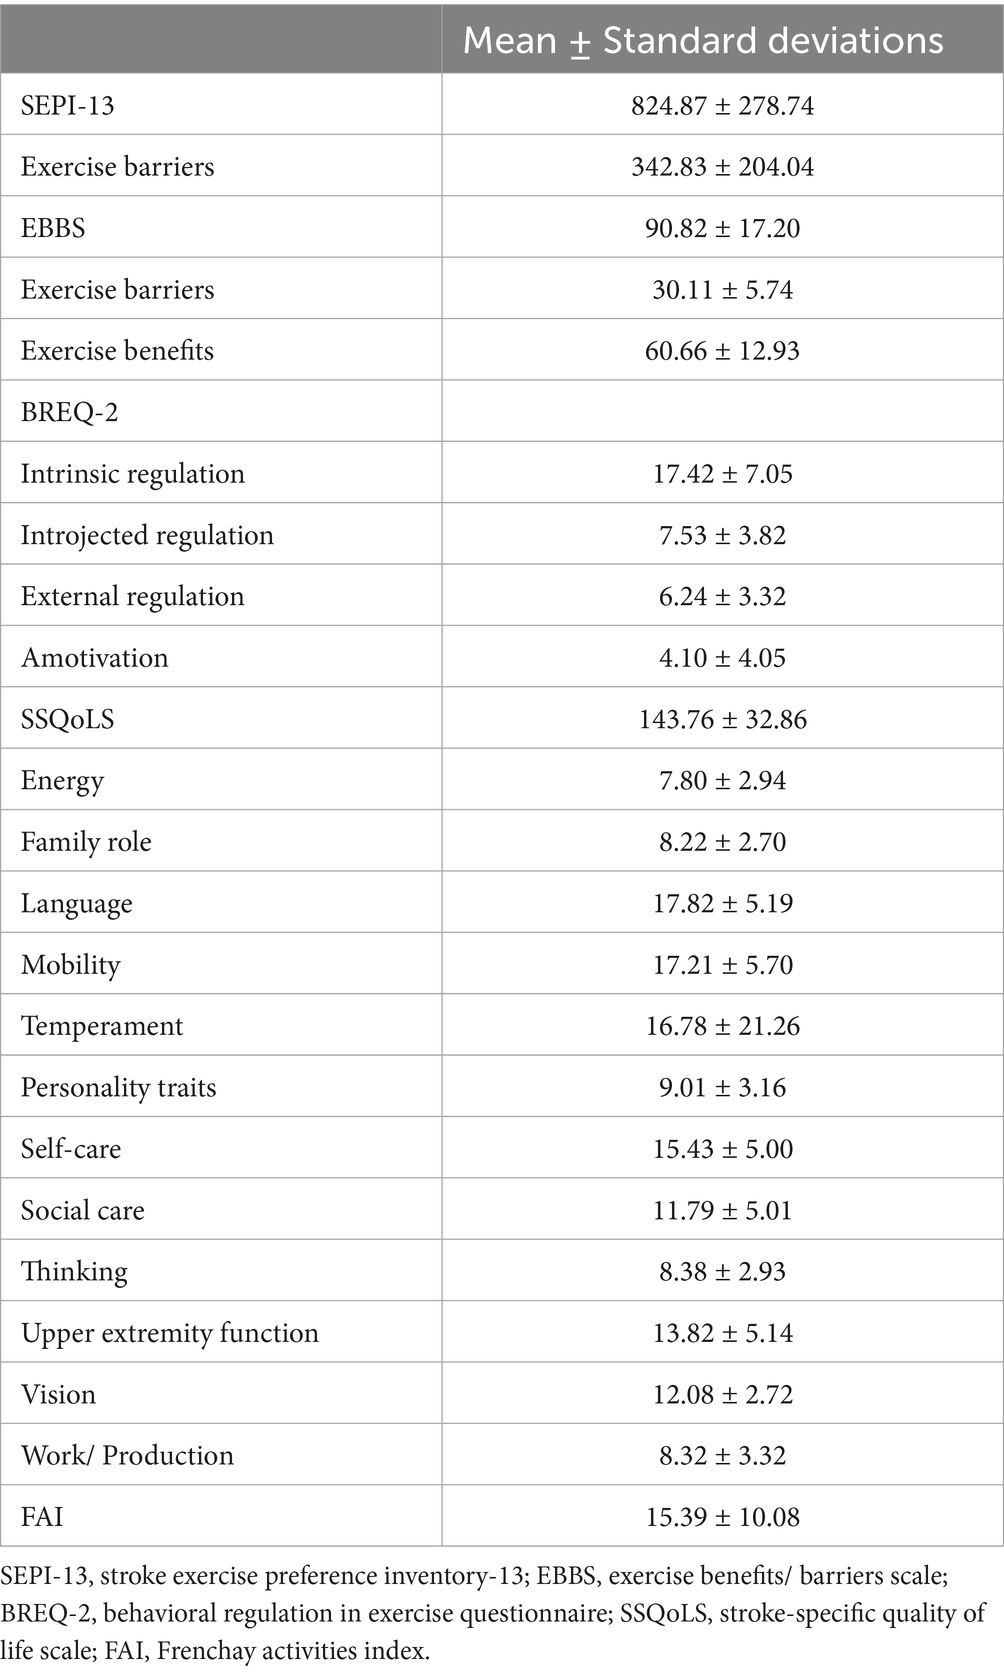
Table 5. Means and standard deviations of SEPI-13, exercise barriers, EBBS, BREQ-2, SSQoLS, and FAI scores (n = 90).
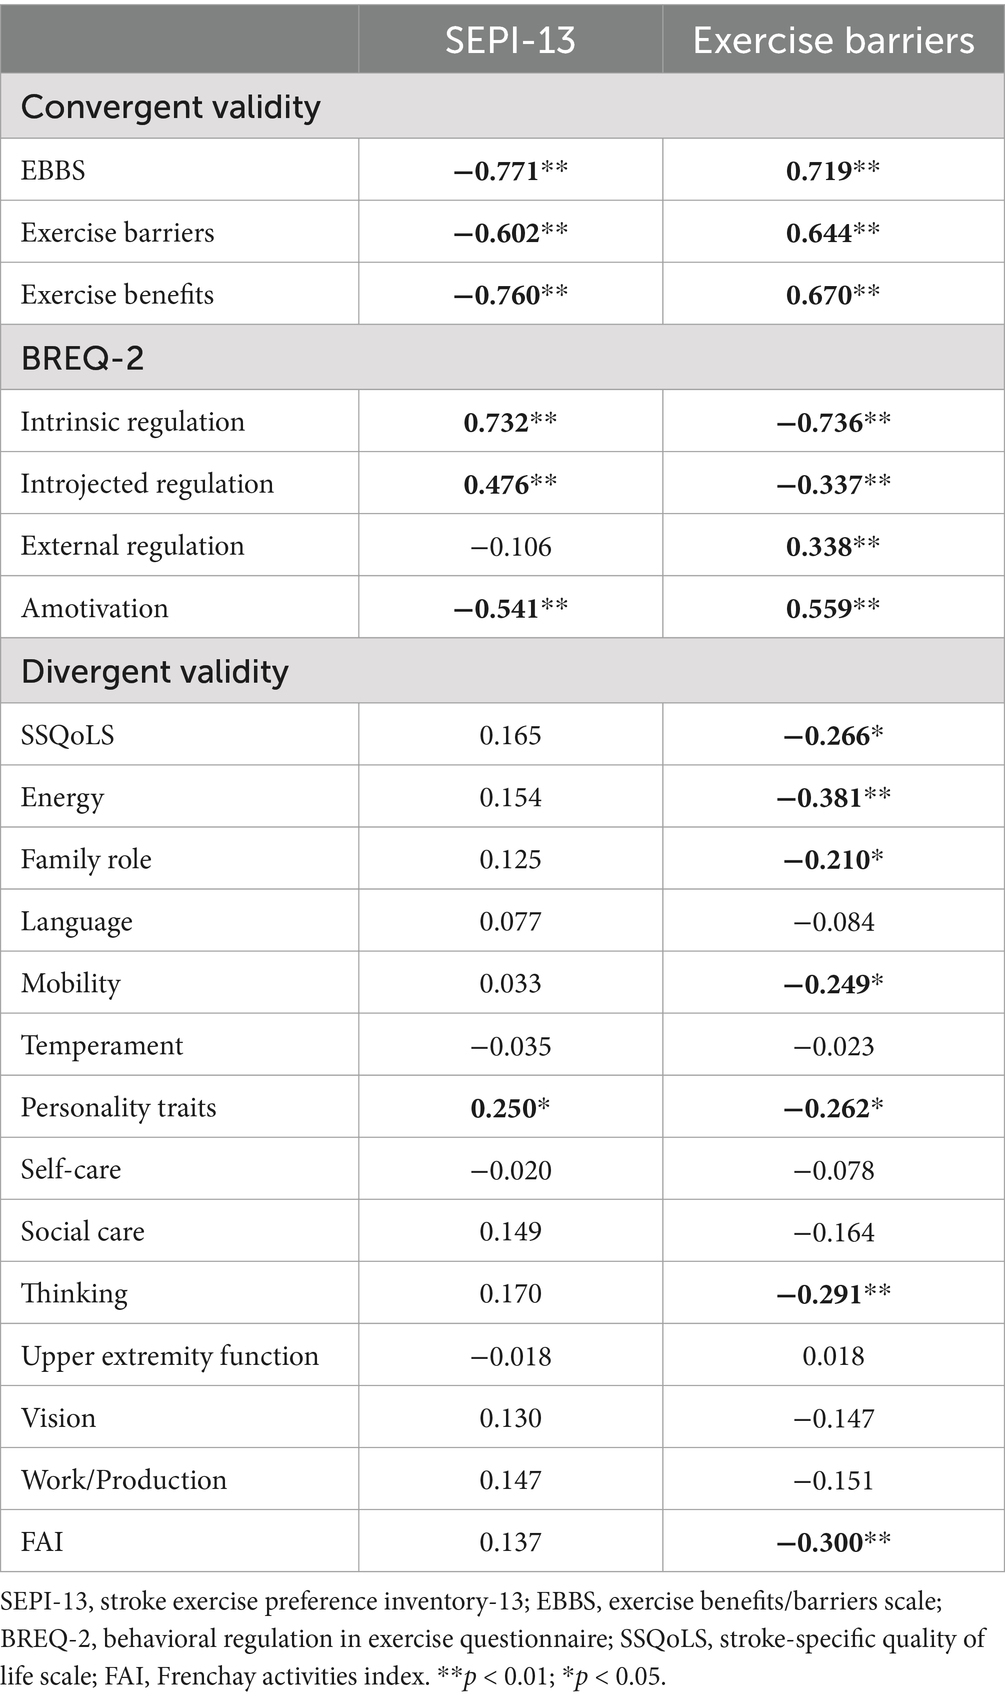
Table 6. SEPI-13 questionnaire correlations with the EBBS, BREQ-2, SSQoLS, and FAI scores (n = 90).
The questionnaire showed no floor effect and a minimal ceiling effect, with only 2.2% of participants reaching the maximum score. For exercise barriers, the mean score was 342.83 with a standard deviation of 204.04, and the median was 305, ranging from 5 to 890. The percentage of participants who scored the maximum or minimum on the exercise barriers scale was 0%. No floor or ceiling effects were observed for exercise barriers.
In this study, the cultural adaptation, validity, and reliability of the SEPI for individuals with stroke were assessed. The analyses revealed that the Turkish version of the SEPI demonstrated high correlations with the EBBS (exercise barriers and exercise benefits) and intrinsic regulation (BREQ-2), as well as strong internal consistency and test–retest reliability. The translation and cultural adaptation were conducted according to recommended guidelines, with no systematic issues encountered.
According to the test–retest results, the ICC value was found to be 0.87 for SEPI and 0.82 for exercise barriers. As a result of the internal consistency analysis, Cronbach’s α value was 0.93 for SEPI and 0.90 for exercise barriers. While the SEM value was 96.99 and 90.03 for SEPI and exercise barriers, respectively, the MDC value was 268.84 and 249.55 for SEPI and exercise barriers, respectively. Additionally, the MDC values at the 90% confidence interval for SEPI-13 and exercise barriers were 226.3 and 210.0, respectively. In line with recent statistical recommendations, the MDC values were reported at both 95 and 90% confidence levels to reflect their utility in different contexts. The MDC at 90% confidence level, which represents a smaller and more clinically achievable change compared to the MDC at 95%, can provide valuable insights for ordinary clinical practice, especially in setting realistic goals and evaluating intervention outcomes. These analyzes were not available in the original version of SEPI (Bonner et al., 2016). At the same time, there are no versions in other languages. However, the results obtained in this study support the high reliability and time-dependent invariance of the Turkish SEPI. Bland Altman plots also consistently supported this conclusion.
The structural validity of the Turkish version of SEPI was assessed through an EFA, resulting in the extraction of a 3-factor structure. This structure was subsequently confirmed using CFA. The Kaiser-Meyer-Olkin sampling adequacy coefficient (0.874) exceeded the recommended threshold (> 0.60) for conducting factor analysis, indicating satisfactory sampling adequacy. In contrast to this study, the original version yielded a 7-factor structure (Bonner et al., 2016). This disparity could be attributed to cultural differences, as perspectives and preferences regarding exercise may vary across populations. However, the confirmation of the factor structure for the Turkish version through CFA demonstrated compatibility between EFA and CFA findings. Consequently, it can be concluded that the Turkish version exhibits structural validity. Our study identified a 3-factor structure for the Turkish version of SEPI, whereas the original study by Bonner et al. (2016) reported a 7-factor structure. This discrepancy may be explained by differences in cultural and linguistic contexts, as well as the methodologies used in factor extraction and rotation. Furthermore, while our sample size (n = 90) was smaller than Bonner et al.’s sample (n = 134), it still satisfies the recommended criteria for factor analysis, with a sample-to-item ratio of approximately seven. This ratio ensures the robustness and validity of the findings, even with a smaller sample size.
The study assessed the construct validity of SEPI and exercise barriers by examining their relationships with EBBS and BREQ-2 sub-scores for convergent validity, and with FAI and SSQoLS sub-scores for divergent validity. Especially a very good correlation with EBBS and its sub-scores was expected. Likewise, the correlations between the intrinsic regulation and amotivation sub-scores of BREQ-2 and the good and very good level were not surprising. Although these are not the same as SEPI and exercise barriers, they include similar situations. Insignificant and weak correlations with SSQoLS and FAI, which evaluate the quality of life and activities in individuals with stroke, were also expected. Because SEPI, SSQoLS and FAI tools question different situations from each other. In the original version, the relationships of exercise barriers items with disability, depression, anxiety and fatigue were examined (Bonner et al., 2016). Varying degrees of correlation were found from insignificant to good. Although different questionnaires were used than those in the original version, the results obtained were satisfactory in terms of construct validity.
Turkish versions of SEPI and exercise barriers did not show any floor or ceiling effects. This was examined in this study, unlike the original study. This result showed that the survey was sensitive to variations and that the highest and lowest scores did not cause problems in practice.
SEPI is not intended to entirely replace other tools or the compulsory patient interview, but rather to complement them. It provides a structured and quantifiable approach to understanding stroke survivors’ exercise preferences and barriers. While traditional patient interviews allow for in-depth qualitative exploration, SEPI facilitates systematic assessment and comparison across different patient groups, making it a practical addition to clinical practice. By using SEPI alongside interviews, healthcare professionals can obtain both standardized quantitative data and rich qualitative insights, ensuring a comprehensive understanding of patient needs and preferences.
While this study comprehensively explored the psychometric properties of SEPI and exercise barriers, it did not assess responsiveness, which represents a limitation. Future investigations should focus on evaluating the instruments’ ability to detect changes over time or in response to treatment, thereby enhancing their clinical utility and comprehensiveness. While the expert committee demonstrated unanimous agreement on all aspects of the translation review, the absence of statistical measures for inter-rater reliability, such as the coefficient of variation, may be considered a limitation. Future studies could incorporate such analyses to align with standard reporting practices.
To conclude, we found the SEPI to be a highly reliable clinical tool for evaluating exercise barriers exhibit. The present study demonstrated that the Turkish versions of SEPI and exercise barriers exhibit validity and reliability among Turkish individuals with stroke. It is anticipated that these easy-to-administer and time-saving questionnaire will serve as valuable tools for identifying exercise preferences and barriers among this population, thus addressing a significant gap in the literature.
The datasets presented in this study can be found in online repositories. The names of the repository/repositories and accession number(s) can be found below: Data supporting the findings can be requested from the corresponding author.
The studies involving humans were approved by Ethical approval was obtained from the Tokat Gaziosmanpaşa University, Faculty of Medicine, Clinical Research Ethics Committee (13 April 2023 – decision no.: 83116987–272). The study was registered on ClinicalTrials.gov (NCT05839808). The study was carried out in accordance with the Helsinki Declaration. Informed Consent Forms were signed by all participants. This consent allows the use of data collected from individuals. The studies were conducted in accordance with the local legislation and institutional requirements. The participants provided their written informed consent to participate in this study.
HA: Conceptualization, Data curation, Formal analysis, Investigation, Methodology, Project administration, Supervision, Validation, Writing – original draft, Writing – review & editing. MS: Conceptualization, Data curation, Formal analysis, Investigation, Methodology, Validation, Writing – original draft, Writing – review & editing.
The author(s) declare that no financial support was received for the research, authorship, and/or publication of this article.
The authors thank the individuals who voluntarily participated in this study.
The authors declare that the research was conducted in the absence of any commercial or financial relationships that could be construed as a potential conflict of interest.
The authors declare that no Generative AI was used in the creation of this manuscript.
All claims expressed in this article are solely those of the authors and do not necessarily represent those of their affiliated organizations, or those of the publisher, the editors and the reviewers. Any product that may be evaluated in this article, or claim that may be made by its manufacturer, is not guaranteed or endorsed by the publisher.
The Supplementary material for this article can be found online at: https://www.frontiersin.org/articles/10.3389/fpsyg.2025.1535140/full#supplementary-material
Alaca, N. (2020). The Frenchay activities index: cross-cultural adaptation into Turkish assessing its psychometric properties. Sak Tıp Derg. 10:556–564. doi: 10.31832/smj.753473
Andresen, E. M. (2000). Criteria for assessing the tools of disability outcomes research. Arch. Phys. Med. Rehabil. 81, S15–S20. doi: 10.1053/apmr.2000.20619
Arikan, H., Citaker, S., and Ucok, C. (2023). Cross-cultural adaptation, reliability, and validity of the Turkish version of the craniofacial pain and disability inventory (CF-PDI/T) for individuals with temporomandibular disorders. Disabil. Rehabil. 45, 523–533. doi: 10.1080/09638288.2022.2028909
Banks, G., Bernhardt, J., Churilov, L., and Cumming, T. B. (2012). Exercise preferences are different after stroke. Stroke Res. Treat. 2012, 1–9. doi: 10.1155/2012/890946
Bazancir-Apaydin, Z., and Sari, F. (2024). Psychometric properties of the Turkish version of central sensitization Inventory-9 in patients with chronic musculoskeletal pain. Int. J. Rehabil. Res. 47, 122–128. doi: 10.1097/MRR.0000000000000617
Beaton, D., Bombardier, C., Guillemin, F., and Ferraz, M. (2000). Guidelines for the process of cross-cultural adaptation of self-report measures. Spine (Phila Pa 1976) 25, 3186–3191. doi: 10.1097/00007632-200012150-00014
Billinger, S. A., Arena, R., Bernhardt, J., Eng, J. J., Franklin, B. A., Johnson, C. M., et al. (2014). Physical activity and exercise recommendations for stroke survivors: a statement for healthcare professionals from the American Heart Association/American Stroke Association. Stroke 45, 2532–2553. doi: 10.1161/STR.0000000000000022
Bonner, N. S., O’Halloran, P. D., Bernhardt, J., and Cumming, T. B. (2016). Developing the stroke exercise preference inventory (SEPI). PLoS One 11:e0164120. doi: 10.1371/journal.pone.0164120
de Diego-Alonso, C., Bellosta-López, P., Blasco-Abadía, J., Buesa-Estéllez, A., Roldán-Pérez, P., Medina-Rincón, A., et al. (2024a). The relationship between levels of physical activity and participation in everyday life in stroke survivors: a systematic review and meta-analysis. Disabil. Health J. 17:101640. doi: 10.1016/j.dhjo.2024.101640 [Epub ahead of print].
de Diego-Alonso, C., Blasco-Abadía, J., Doménech-García, V., and Bellosta-López, P. (2024b). Validity and stability of the international physical activity questionnaire short-form for stroke survivors with preserved walking ability. Top. Stroke Rehabil. 1–10, 1–10. doi: 10.1080/10749357.2024.2417645 [Epub ahead of print].
de Diego-Alonso, C., Buesa-Estéllez, A., Roldán-Pérez, P., Bellosta-López, P., and Güeita-Rodríguez, J. (2024c). “More than effort, it’s dedicating time and perseverance.” experiences of physical activity and physical exercise in stroke survivor with high functional capacity: a qualitative study. Disabil. Rehabil., 1–9. doi: 10.1080/09638288.2024.2429753 [Epub ahead of print].
Dilek, T. A. Ş., and Akyol, A. (2019). Diyaliz Hastalarında Egzersiz Yararları/Engelleri Ölçeği” nin Türkçeye Uyarlanması: Geçerlik ve Güvenirlik Çalışması. Nefroloji Hemşireliği Derg 14, 17–25.
Ersöz, G., Aşçı, F. H., and Altıparmak, E. (2012). Egzersizde davranışsal düzenlemeler ölçeği-2: geçerlilik ve güvenilirlik çalışması. Türkiye Klin. J. Sport Sci. 4, 22–31.
Feise, R. J., and Menke, J. M. (2001). Functional rating index: a new valid and reliable instrument to measure the magnitude of clinical change in spinal conditions. Spine (Phila Pa 1976) 26, 78–87. doi: 10.1097/00007632-200101010-00015
Folstein, M. F., Folstein, S. E., and McHugh, P. R. (1975). “Mini-mental state”: a practical method for grading the cognitive state of patients for the clinician. J. Psychiatr. Res. 12, 189–198. doi: 10.1016/0022-3956(75)90026-6
Gungen, C. (2002). Standardize Mini Mental Test’in Turk toplumunda hafif demans tanisinda gecerlik ve guvenilirligi. Turk Psikiyatr Derg. 13, 273–281.
Hakverdioğlu Yönt, G., and Khorshid, L. (2012). Turkish version of the stroke-specific quality of life scale. Int. Nurs. Rev. 59, 274–280. doi: 10.1111/j.1466-7657.2011.00962.x
İlhan, M., and Çetin, B. (2014). LISREL ve AMOS programları kullanılarak gerçekleştirilen yapısal eşitlik modeli (yem) analizlerine ilişkin sonuçların karşılaştırılması. J. Meas. Eval. Educ. Psychol. 5, 26–42. doi: 10.21031/epod.31126
Mead, G., and Bernhardt, J. (2011). Physical fitness training after stroke, time to implement what we know: more research is needed. Int. J. Stroke 6, 506–508. doi: 10.1111/j.1747-4949.2011.00679.x
Mehrholz, J., Wagner, K., Rutte, K., Meiβner, D., and Pohl, M. (2007). Predictive validity and responsiveness of the functional ambulation category in hemiparetic patients after stroke. Arch. Phys. Med. Rehabil. 88, 1314–1319. doi: 10.1016/j.apmr.2007.06.764
Mokkink, L. B., Prinsen, C. A., Patrick, D. L., Alonso, J., Bouter, L. M., De Vet, H. C., et al. (2019). COSMIN study design checklist for patient-reported outcome measurement instruments, vol. 2019. Amsterdam, The Netherlands, 1–32.
Mozaffarian, D., Benjamin, E. J., Go, A. S., Arnett, D. K., Blaha, M. J., Cushman, M., et al. (2015). Heart disease and stroke statistics—2015 update: a report from the American Heart Association. Circulation 131, e29–e322. doi: 10.1161/CIR.0000000000000152
Mullan, E., Markland, D., and Ingledew, D. K. (1997). A graded conceptualisation of self-determination in the regulation of exercise behaviour: development of a measure using confirmatory factor analytic procedures. Pers Individ Dif. 23, 745–752. doi: 10.1016/S0191-8869(97)00107-4
Organization WH (2006). Neurological disorders: Public health challenges. Eds. Aarli, J. A., Avanzini, G., Bertolote, J. M., de Boer, H., Breivik, H., Dua, T., (Geneva, Switzerland: World Health Organization).
Portney, L. G. (2020). Foundations of clinical research: Applications to evidence-based practice. Philadelphia: F.A. Davis Company.
Portney, L. G., and Watkins, M. P. (Eds.) (2009). Foundations of clinical research: Applications to practice, vol. 892. NJ: Pearson/Prentice Hall Upper Saddle River.
Rogers, L. Q., Courneya, K. S., Shah, P., Dunnington, G., and Hopkins-Price, P. (2007). Exercise stage of change, barriers, expectations, values and preferences among breast cancer patients during treatment: a pilot study. Eur J Cancer Care (Engl). 16, 55–66. doi: 10.1111/j.1365-2354.2006.00705.x
Rogers, L. Q., Markwell, S. J., Verhulst, S., McAuley, E., and Courneya, K. S. (2009). Rural breast cancer survivors: exercise preferences and their determinants. Psycho-Oncol. J. Psychol. Soc. Behav. Dimens. Cancer. 18, 412–421. doi: 10.1002/pon.1497
Saunders, D. H., Sanderson, M., Hayes, S., Johnson, L., Kramer, S., Carter, D. D., et al. (2020). Physical fitness training for stroke patients. Cochrane Database Syst. Rev. 2020:3. doi: 10.1002/14651858.CD003316.pub7
Schuling, J., De Haan, R., Limburg, M., and Groenier, K. H. (1993). The Frenchay activities index. Assessment of functional status in stroke patients. Stroke 24, 1173–1177. doi: 10.1161/01.STR.24.8.1173
Sechrist, K. R., Walker, S. N., and Pender, N. J. (1987). Development and psychometric evaluation of the exercise benefits/barriers scale. Res. Nurs. Health 10, 357–365. doi: 10.1002/nur.4770100603
Senes, S. (2006). How we manage stroke in Australia. AIHW cat. no. CVD 31. Canberra: Australian Institute of Health and Welfare.
Terwee, C. B., Bot, S. D. M., de Boer, M. R., van der Windt, D. A. W. M., Knol, D. L., Dekker, J., et al. (2007). Quality criteria were proposed for measurement properties of health status questionnaires. J. Clin. Epidemiol. 60, 34–42. doi: 10.1016/j.jclinepi.2006.03.012
Keywords: validity, reliability, stroke, stroke exercise preference inventory, Turkish version
Citation: Arıkan H and Sertel M (2025) Cross-cultural adaptation, reliability and validity of the Turkish version of the stroke exercise preference inventory. Front. Psychol. 16:1535140. doi: 10.3389/fpsyg.2025.1535140
Edited by:
Atsushi Oshio, Waseda University, JapanReviewed by:
Pablo Bellosta-López, Universidad San Jorge, SpainCopyright © 2025 Arıkan and Sertel. This is an open-access article distributed under the terms of the Creative Commons Attribution License (CC BY). The use, distribution or reproduction in other forums is permitted, provided the original author(s) and the copyright owner(s) are credited and that the original publication in this journal is cited, in accordance with accepted academic practice. No use, distribution or reproduction is permitted which does not comply with these terms.
*Correspondence: Halime Arıkan, aGFsaW1lYXJpa2FuOTJAZ21haWwuY29t
Disclaimer: All claims expressed in this article are solely those of the authors and do not necessarily represent those of their affiliated organizations, or those of the publisher, the editors and the reviewers. Any product that may be evaluated in this article or claim that may be made by its manufacturer is not guaranteed or endorsed by the publisher.
Research integrity at Frontiers
Learn more about the work of our research integrity team to safeguard the quality of each article we publish.