 Jinlong Zhao
- 1School of Nursing, Faculty of Health and Social Sciences, The Hong Kong Polytechnic University, Kowloon, Hong Kong SAR, China
- 2Research Institute for Smart Ageing, PolyU Institutional Research Archive, The Hong Kong Polytechnic University, Kowloon, Hong Kong SAR, China
- 3Department of Statistics and Operations Research (DEIO). Universitat Politècnica de Catalunya BarcelonaTech (UPC), Barcelona, Spain
- 4Department of Nutrition and Food Studies, George Mason University, Fairfax, VA, United States
- 5Research, Innovation and Teaching Unit, Parc Sanitari Sant Joan de Déu, Sant Boi de Llobregat, Spain
- 6Instituto de Salud Carlos III, Centro de Investigación Biomédica en Red de Salud Mental, Centro de Investigación Biomédica en Red de Salud Mental (CIBERSAM), Madrid, Spain
Objective: Psychological frailty, an emerging concept, lacks a standardized definition, measuring instrument, and empirical evidence in Asian (especially Chinese) populations. An effective instrument to measure psychological frailty should be urgently developed. Therefore, this study aimed to develop and initially validate a Psychological Frailty Index (PFI) based on the China Health and Retirement Longitudinal Study (CHARLS). The study assessed the applicability of the PFI to adverse health outcomes as a secondary aim.
Results: Factor analysis of the 15-item PFI extracted four factors of psychological frailty (psychological distress, cognitive decline, physical vulnerability, and memory decline). The PFI demonstrated satisfactory internal consistency (Cronbach’s alpha = 0.764) and criterion validity (rho = 0.806). Psychological frailty was significantly associated with lower life expectancy (odds ratio [OR] 1.98, 95% confidence interval [CI] 1.71–2.29), higher outpatient treatments (1.25, 1.03–1.51), and increased hospitalization (1.45, 1.22–1.74).
Conclusion: The PFI could be a reliable instrument for identifying psychological frailty. The PFI is a novel tool that measures health indicators of older adults at risk of increased psychological vulnerability, but it requires further validation.
1 Introduction
Frailty is an age-associated state with greater vulnerability to adverse health outcomes and a decreased ability to preserve homeostasis following stressful events for older adults (Clegg et al., 2013; Dent et al., 2019). It is also considered multidimensional because of its physical, cognitive, psychological, and social domains (Fried et al., 2021; Rockwood and Mitnitski, 2007). Therefore, it has been contended that the definitions and measurements of frailty should include multiple domains, such as physical, cognitive, psychological, and social frailty (Khezrian et al., 2017; Pilotto et al., 2020).
Psychological frailty has emerged as a novel concept. Some researchers have explored its definitions and measurements. Psychological frailty has been operationally defined as the co-presence of emotional problems and loneliness (De Witte et al., 2013). Similar to physical frailty, as Fitten (2015) argues, psychological frailty should be defined as a decrease in individuals’ emotional or cognitive resilience triggered by their exposure to stressful events. Further, psychological frailty has been considered the coexistence of physical frailty and depression (Shimada et al., 2019), indicating the necessity of defining it with other domains (i.e., physical frailty). However until today, psychological frailty lacks a unified and consistently-accepted conceptual framework (Zhao et al., 2023).
Although several measures have been proposed to measure psychological frailty (e.g., the Tilburg Frailty Indicator [TFI]), most have not articulated a clear gold standard for measuring it (Zhao et al., 2023). Further, the multiple components of psychological frailty and the validation of its architecture (Zhao et al., 2023) have not been considered. Specifically, the TFI was developed to measure multidimensional frailty; however, it is often used to measure psychological frailty. It includes three domains: physical, psychological, and social (Gobbens et al., 2010a; Gobbens et al., 2010b). Only the physical domain has shown adequate internal consistency (Gobbens and Uchmanowicz, 2021), while the psychological domain has been reported to be insufficiently comprehensive (Zamora-Sánchez et al., 2022). Nevertheless, existing studies have often used TFI to measure psychological frailty (Zhao et al., 2023). Several researchers have proposed the combined utilization of the Fried frailty phenotype (FFP) and mental health scales (e.g., the Center for Epidemiologic Studies Depression Scale; CES-D) (Rietman et al., 2018; Shimada et al., 2019). However, this approach requires further validation because there is no evidence as to whether the attributes of psychological frailty or simply the comorbid state of frailty and mental disorders is measured (Zhao et al., 2023).
To the best of our knowledge, there is no current methodological consensus on creating a psychological frailty index (PFI), and no standardized measures have been developed using the China Health and Retirement Longitudinal Study (CHARLS). Nevertheless, previous studies have reported that the cumulative deficit model (the Frailty Index [FI]) is commonly considered an appropriate method for constructing frailty-associated indices (Rockwood, 2016; Zhao et al., 2023). One of the strengths of this model is that it involves diverse variables across multiple dimensions, which facilitate the development of a PFI (Theou et al., 2023). A recent scoping review (Zhao et al., 2023) highlighted that existing variables used to define psychological frailty differ significantly and are derived from different dimensions. Another strength of the cumulative deficit model is that it can yield continuous scores for psychological frailty instead of using the three categories of frailty phenotypes (Searle et al., 2008). Therefore, a PFI based on the cumulative deficit model may more accurately predict adverse health outcomes (Cesari et al., 2014).
Although it is controversial (Zhao et al., 2023), there are two main reasons to include physical vulnerability (physical frailty) when using a cumulative deficit model to generate a psychological frailty index. First, as part of (multidimensional) frailty (Gobbens et al., 2024), psychological frailty is bound to have the attributes of frailty. If not, it is challenging to differentiate “psychological frailty” from other similar psychological terms, such as psychological distress (Zhao et al., 2023). The core attribute of frailty can be vulnerability at the physiological and physical level (Dent et al., 2019; Fried et al., 2021; Khezrian et al., 2017). Therefore, coupled with physical vulnerability, it is a distinctive characteristic of psychological frailty that differentiates it from similar psychological terms. Second, physical frailty has been integrated into the conceptual framework of psychological frailty in a recently published work by Shimada et al. (2019). Other similar studies have demonstrated the integration of physical vulnerability (physical frailty) and cognitive problems to construct cognitive frailty (Kelaiditi et al., 2013; Sugimoto et al., 2022), reinforcing the view that physical vulnerability is integrated into the cognitive frailty framework. For the above reasons, we have considered adding physical vulnerability in our PFI construction.
A new instrument for psychological frailty is likely to facilitate the understanding of its essential properties, including potential opportunities to attenuate its course; however, such an instrument is lacking.
2 Methods
2.1 Aim, design, and setting
This study primarily aimed to create a PFI using the CHARLS, considering the FI approach. Its reliability and validity, including classification accuracy and applicability, were evaluated (partially) as secondary aims.
2.2 Data source and study population
The CHARLS is an ongoing, nationally-representative survey of the Chinese population covering health information, economic data, and health records (Zhao et al., 2020). A multi-stage probability-proportional-to-size sampling procedure was used to identify participants at baseline (2011–2012). Follow-up visits were conducted every 2 or 3 years and included Wave 2 (2012–2013), Wave 3 (2015), Wave 4 (2018), and Wave 5 (2021) visits. Ethical approval was granted by the Institutional Review Board of Peking University.
This study adopted a cross-sectional design and used CHARLS Wave 4 (2018) data. This study selected the sample in Wave 4 based on three criteria: (1) participants aged ≥65 years (Clegg et al., 2013); (2) participants who responded to psychological-frailty-related variables with less than 5% missing values (Theou et al., 2023); and (3) those who did not have missing values or who did not respond with “refuse to answer,” “not assessed,” or “do not know” (Mutz et al., 2021). The sample selection is shown in Supplementary Figure S1.
To better evaluate the PFI’s performance, a random sample (about 30%) was taken and partitioned. Creating a PFI using a relatively separate random sample addressed potential bias in relation to specific characteristics by randomly extracting data (Krstajic et al., 2014). Furthermore, the PFI could be evaluated using unseen and broader data to estimate its actual performance because the total sample was more extensive. After partitioning, the initial validation analyses used the total sample, facilitating a more efficient use of data (de Rooij and Weeda, 2020). Using a total sample rather than an “uncontaminated” sample was necessary because this study did not have a machine-learning design and aimed to evaluate the applicability of the PFI under specific health outcomes.
2.3 PFI
This study created the PFI by adapting standardized procedures outlined by Searle et al. (2008) and Tocchi et al. (2014).
2.3.1 Selecting variables for the PFI
Searle et al. (2008) recommended five criteria for selecting variables for a physical FI: (1) the variables must be deficits associated with the health status; (2) the prevalence of a deficit must generally increase with age; (3) chosen deficits must not saturate too early; (4) when candidate deficits are considered as a group, the deficits that comprise an FI must cover a range of systems; and (5) if a single FI is to be used serially on the same individuals, the variables that comprise the FI need to be the same from one iteration to the next. This study partially adhered to these criteria because the PFI is not precisely equivalent to a physical FI. Specifically, the first criterion was strictly adhered to; all potential variables in this study were associated with the health status. The second criterion was only partially fulfilled because the nature of psychological frailty makes it difficult for its subjective variables to accurately indicate changes in these variables with age. As for the third criterion, not all variables were oversaturated in the early stages of aging. The fourth and fifth criteria were adopted to facilitate the selection of variables. Accordingly, 35 potential variables were screened as initial PFI items (Supplementary Table S1).
2.3.2 Generating initial items for the PFI
These variables were then re-coded. For non-binary items, recoding was conducted to grade the ranking into a value between 0 (not present) and 1 (present), similar to the scoring strategy for an FI (Huang et al., 2022; Searle et al., 2008). Four- or five-level Likert-scale items derived from self-reported questions were re-coded as scores from 0 to 1 based on differing response levels in an equally spaced manner (e.g., very = 1, quite often = 0.75, somewhat = 0.5, a little = 0.25, and none = 0) (Supplementary Table S1). These re-coded levels were determined following previous studies (Mutz et al., 2022; Tyrovolas et al., 2018) and Searle et al. (2008) standard methodology on the creation of a frailty index.
2.3.3 Evaluating the initial items
Categorical principal component analysis (CatPCA) (Linting et al., 2007; Linting and van der Kooij, 2012) was used to evaluate the initial items of the PFI with a random sample (n = 1,290). CatPCA is a statistical technique used to reduce dimensionality when categorical variables are examined, as it is the nonlinear equivalent of the standard PCA where categorical variables are quantified while the number of dimensions in the data is reduced (Casacci, 2023; Linting et al., 2007).
2.3.4 Generating the scoring system and the cut-off value
A composed PFI was generated as the proportion of items present in an older adult out of the total number of items, similar to the construction of a physical FI (Searle et al., 2008). The entire score was derived using a non-weighted calculation ranging from 0 to 1, with a higher score indicating a more severe degree of psychological frailty. As no prior studies have investigated the optimal cut-off value or established a gold standard for psychological frailty (Zhao et al., 2023), the optimal cut-off value was determined using the Youden index. Additionally, population tertiles were also used to establish cut-off values, as many similar studies related to the FI have used population tertiles or quartiles (Clegg et al., 2016; Dunlay et al., 2014).
2.4 Additional calibration instruments
The TFI, developed by Gobbens et al. (2010b), is used to assess multidimensional frailty. This instrument has 15 items covering physical, psychological, and social domains. The psychological domain is measured using four items related to coping, depression, anxiety, and cognition. A score > 5 indicates frailty (Gobbens et al., 2010b). The TFI has been validated among older Chinese adults (Dong et al., 2017; Si et al., 2021). This study followed the TFI based on 14 relevant variables derived from Wave 4. The variable related to weight was not applied owing to data unavailability (Supplementary Table S2).
The 10-item CES-D is an instrument used for assessing depression worldwide. The full version consists of 20 items used to inquire how often an individual experienced depression-related symptoms in the past week (Radloff, 1977). The 10-item version, developed by Andresen et al. (1994), has been validated in Chinese populations with a recommended cut-off value of 10 (Fu et al., 2022; Yang et al., 2018) and used as a routine item in the CHARLS questionnaire.
Owing to the absence of a gold standard, the TFI and the 10-item CES-D were chosen as the “quasi-gold” standards for validating the PFI. The TFI was selected because it is a widely used measure of multidimensional frailty (Zamora-Sánchez et al., 2022), and existing studies frequently use its subscale (psychological domain) to assess psychological frailty (Zhao et al., 2023). The 10-item CES-D was adopted as it is a standard measure of depression (Schein and Koenig, 1997), which is considered a core construct of psychological frailty (Zhao et al., 2023).
2.5 Adverse health outcomes
This study considered three outcomes. Lower life expectancy was defined as having an individual’s lower subjective life expectancy; that is, participants were less likely to assume that they would live 10–15 years at the time of measurement. Missing values, including “do not know,” were contained in this outcome. While item-level missingness (Newman, 2014) was involved, their effect on the results was likely to be small. This outcome was retained because it was a critical variable for representing the structure of subjective life expectancy. Similar to missing-data treatments utilized in previous studies (Denman et al., 2018; Mirzaei et al., 2022), missing values were treated as neutral responses because they had no real value. This outcome was transformed, and the original five responses were dichotomized into “No” (0) and “Yes” (1). This reduction in responses considerably simplified the outcome’s categorical hierarchy, explicitly improving the interpretability of this outcome. That is, this outcome is more understandable and interpreted in a way that aligns more with the readers’ categorical expectations of this outcome (Wittink and Bayer, 1994). In addition, we ran an ordinal regression analysis using this outcome (lower life expectancy rated using a five-point Likert), and the results remain consistent with the binary analysis for the total sample as well as for subgroups (data not shown in the text). Outpatient treatment was measured using the question, “In the last month, have you visited a public hospital, private hospital, public health center, clinic, health worker’s or doctor’s practice, or been visited by a health worker or doctor for outpatient care (not including physical examination)?” (Yes/No). Hospitalization was assessed using the question, “Have you received inpatient care in the past year?” (Yes/No). The rationale for selecting these three variables as outcomes included: (1) increased potential risks of these outcomes emerging in older adults with psychological frailty (Calciolari and Luini, 2023; Yong et al., 2021; Zhang et al., 2018); and (2) the previous use of these variables in relevant studies (Daniels et al., 2012; Gobbens et al., 2012).
2.6 Covariates
Covariates included age, sex, the total number of chronic diseases, financial status (additional income: “Did you receive any wage and bonus income (excluding pensions) in the past year?”; Yes/No), highest educational qualification (four levels: being illiterate or not completing primary school, receiving home or primary school education; secondary school education; and higher education), physical disability (Yes/No), light physical activity: walking (e.g., at home, and for exercise or recreation) at least 10 min every week (Yes/No), moderate physical activity: allowing you to breathe faster than usual (e.g., doing Tai Chi) at least 10 min every week (Yes/No), and smoking status: “Have you ever chewed tobacco, smoked a pipe, smoked self-rolled cigarettes, or smoked cigarettes/cigars?” (Yes/No). Previous research has demonstrated that these covariates have a substantial relationship with psychological and general frailty (Tyrovolas et al., 2018; Uchmanowicz et al., 2022; Zhao et al., 2023). For example, age is a critical covariate in psychological frailty as it is directly associated with physiological declines of the brain, increased vulnerability, and multiple adverse health outcomes.
2.7 Statistical analysis
Descriptive statistics were used to characterize the basic features of the sample. Frequencies and percentages (%) were reported for categorical variables, and the mean ± standard deviation (SD) (or median ± interquartile range [IQR]) was reported for continuous variables. Spearman’s ρ coefficient was used to assess the criterion-related validity, while the Kolmogorov–Smirnov test was used to assess the distribution normality of the PFI. CatPCA with varimax and Kaiser normalization was performed to explore the multidimensional nature of psychological frailty and select appropriate variables. This study relied on both Kaiser’s criterion and Comrey’s (1973) criterion: (1) all factors with an eigenvalue above one were retained; (2) variables with loadings higher than 0.25 were used to explain the components obtained; and (3) the variance accounted for (VAF) of each component was assessed using the following criteria: 0.10, poor; 0.20, fair; 0.30, good; 0.40, very good; and 0.50, excellent (Linting and van der Kooij, 2012; Saukani and Ismail, 2019). Cronbach’s alpha value ≥0.70 is good, while a value ≥0.80 is excellent (Flora, 2020; Kalkbrenner, 2023; Kline, 2000; Taylor, 2021). Confirmatory factor analysis (CFA) was conducted to validate the hypothetical construction of the PFI using maximum likelihood estimation. The criteria for the goodness-of-fit indices are presented in Table 2. Receiver operating characteristic (ROC) curve analysis was used to identify cutoff values and assess the classification accuracy. Binary logistic regression models were used to examine associations between the odds ratios (ORs) of the PFI and lower (subjective) life expectancy, outpatient treatment, and hospitalization after adjusting for all covariates. Analyses were further stratified by sex and age (young-old: 65–74 years; old-old: ≥75 years) according to the age criterion of Au et al. (2017). Binary regression models and ordinal regression models were implemented using the glm function from the package stats and the polr function from the package mass of R statistical software, respectively. Statistical significance was set at a two-tailed p-value <0.05. Statistical analyses were performed on R version 4.3.2 (R Foundation for Statistical Computing, Vienna, Austria), SPSS (version 27.0; SPSS Inc., Chicago, IL, USA) and AMOS (version 25.0; SPSS Inc., Chicago, IL, USA) software.
3 Results
3.1 Basic characteristics of participants
In Wave 4, 12,137 (61.25%) of 19,817 participants did not meet the age criteria. A further 108 participants (0.55%) were excluded owing to missing outcome variables, leaving 3,934 participants in the total sample. Of these, 1,290 (33.3%) were treated as random samples (Supplementary Figure S1). Of the total sample, more than half (53.6%, n = 2,108) were males. The mean age was 71.04 (SD = 5.24). In total, 1,630 (41.4%) were psychologically frail (PFI score > 0.3083 used as psychological frailty cut-off point based on youden index methodology see section 3.3 for more detail). Participants with psychological frailty were older in both females (mean 71.10 years [SD: 5.28] vs. 70.32 years [4.92], respectively) and males (71.95 [5.58] vs. 71.01 [5.18], respectively). As for participants with psychological frailty, multimorbid diseases are reported more among females (mean 3.23 [SD: 2.12] vs. 2.39 [1.81], respectively) than among males (3.23 [2.11] vs. 2.17 [1.75], respectively) (Supplementary Table S3).
3.2 CatPCA results
CatPCA results suggested psychological frailty had a four-factor structure, including 15 variables out of the 35 initial ones, and explaining 57.39% of the total variance (Table 1). Specifically, the eigenvalue of the first factor was 2.883, indicating that it explained 19.219% (2.883/15) of variance. The eigenvalues of the remaining three factors were 2.09, 2.021, and 1.616, representing a VAF share of approximately 38%. Based on the included 15 items grouping, these four factors were named as psychological distress, cognitive decline, physical vulnerability, and memory decline.
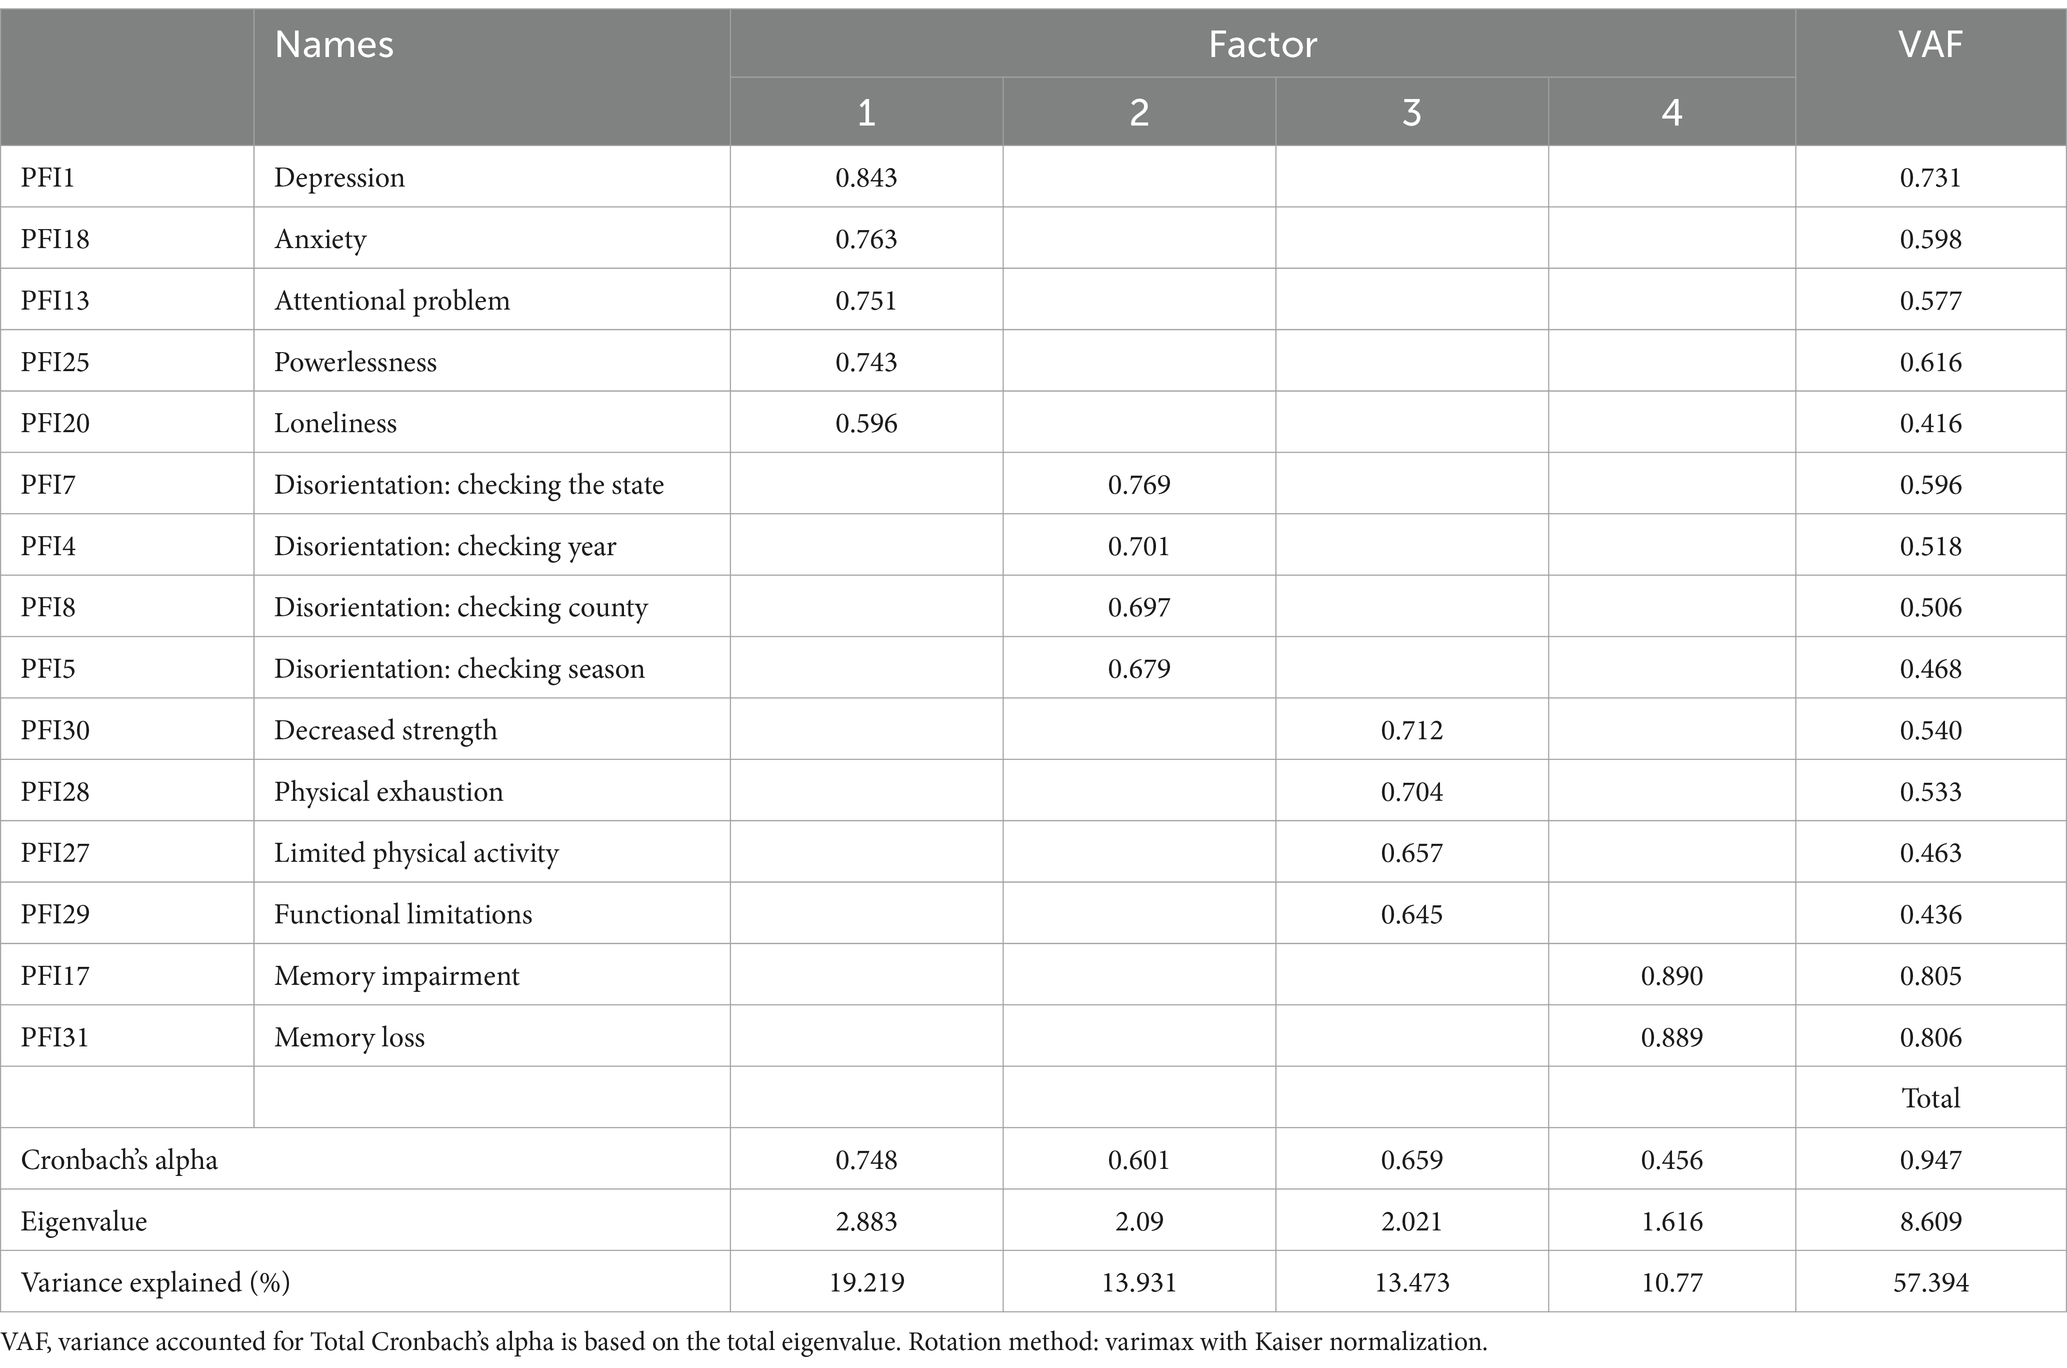
Table 1. Factor loadings and eigenvalues of the psychological frailty index (PFI).
3.3 Cut-off values of the PFI
The maximum value of the Youden index (J = sensitivity+specificity-1) was 0.667 for identifying psychological frailty, indicating that the optimal cut-off value was 0.3083 (sensitivity = 83.5%; specificity = 83.2%). As aforementioned in methodology, PFI ranges from 0 to 1. Both sensitivity and specificity were > 70%, indicating that 0.3083 was adequate for identifying psychological frailty (Supplementary Figure S3A). Additionally, we also used population’s tertiles to assess the cut-off values for the three types of psychological frailty— the lowest tertile (≤0.20) indicated a robust state; the middle (>0.20 to <0.35) indicated pre-psychological frailty; and the highest (≥ 0.35) indicated psychological frailty.
3.4 Reliability and validity assessment results
3.4.1 Reliability
Cronbach’s alpha for the PFI was 0.764 (95% confidence interval [CI]: 0.753–0.775). Since it is usually challenging to fulfill Cronbach’s α coefficient assumptions (Flora, 2020; McNeish, 2018), other alternative indicators were also reported. The PFI performed well, with a total omega coefficient of 0.757 (0.746–0.775), greatest lower bound (GLB) of 0.817, and coefficient H of 0.834.
3.4.2 Criterion-related validity
Spearman’s ρ coefficient between the PFI and TFI was 0.806 (p < 0.001). A high correlation was also observed between the PFI and the 10-item CES-D (rho = 0.773, p < 0.001). Spearman’s ρ coefficient was greater than 0.70, indicating good criterion-related validity (Spearman, 1904). The TFI and the 10-item CES-D had good internal consistency reliability (TFI: Cronbach’s α = 0.730, 95% CI: 0.717–0.742; 10-item CES-D: 0.797, 0.788–0.806).
3.4.3 Construct validity and classification accuracy
In the CFA model, when applied to the total sample, all paths of items were significantly loaded to the hypothesized factors (loading range: 0.45 to 0.78) (Supplementary Figure S2). Since characteristics of PFI may differ across genders we also applied a CFA for the subgroup of men and women, and the results showed that the PFI exhibited weak invariance and satisfied strong and strict invariance, supporting the stability of the consistent factor structure across genders (data not shown in text). In terms of the total sample model’s fitness, the following values were obtained: chi-square (χ2/df), 2.715 (< 3); standardized root mean square residual, 0.019 (p < 0.06), indicating a better fit to the hypothesized model; root mean square error of approximation value, 0.021 (90% CI: 0.018–0.024; < 0.06), indicating an excellent fit; and satisfactory goodness-of-fit index, 0.993 (>0.950); adjusted goodness-of-fit index, 0.989 (>0.950); normed fit index, 0.983 (>0.950); Tucker-Lewis index, 0.986 (>0.950); incremental fit index, 0.986 (>0.950); comparative fit index, 0.989 (>0.950); relative fit index, 0.978 (>0.950), and parsimony-adjusted comparative fit index, 0.740 (>0.50) (Table 2).

Table 2. Summary of results of goodness-of-fit indices.
PFI classification accuracy (discriminative ability) was evaluated using the area under the ROC curve (AUC). Swets (1988) recommended that AUC values be interpreted as follows: 0.5 to 0.7 for acceptable accuracy, 0.7 to 0.9 for good accuracy, and higher than 0.9 for excellent accuracy. The AUC for multidimensional frailty was 0.913 (95% CI: 0.904–0.922), which indicated that the PFI had excellent discriminative ability and could correctly identify robust and frail participants. The AUC for categorizing diagnosed emotional or psychiatric problems was 0.677 (0.623–0.732). The AUC for classifying diagnosed memory-related diseases was 0.657 (0.620–0.694). An AUC of 0.846 (95% CI: 0.828–0.864) represented a good discriminative ability for depression (Supplementary Figure S3).
3.5 Evidence of applicability
The PFI’s applicability was confirmed by its significant associations with lower life expectancy (OR = 1.98, 95% CI 1.71–2.29, p < 0.001), outpatient treatment (1.25, 1.03–1.51, p = 0.022), and hospitalization (1.45, 1.22–1.74, p < 0.001). Young-old adults with psychological frailty increased the odds of lower life expectancy (2.01, 1.70–2.38, p < 0.001) and hospitalization (1.39, 1.13–1.72, p = 0.002). Old-old adults with psychological frailty had higher odds of lower life expectancy (1.81, 1.33–2.46, p < 0.001), outpatient treatment (1.53, 1.03–2.27, p = 0.037), and hospitalization (1.58, 1.13–2.21, p = 0.007). Significant associations with lower life expectancies were found in both sexes (p < 0.001). The adjusted odds of rating life expectancy as lower were greater for males with psychological frailty than for females with the same condition (2.09 vs. 1.92, respectively, p < 0.001). Males with psychologically frailty had higher odds of being hospitalized (1.60, 1.26–2.04, p < 0.001) (Table 3).
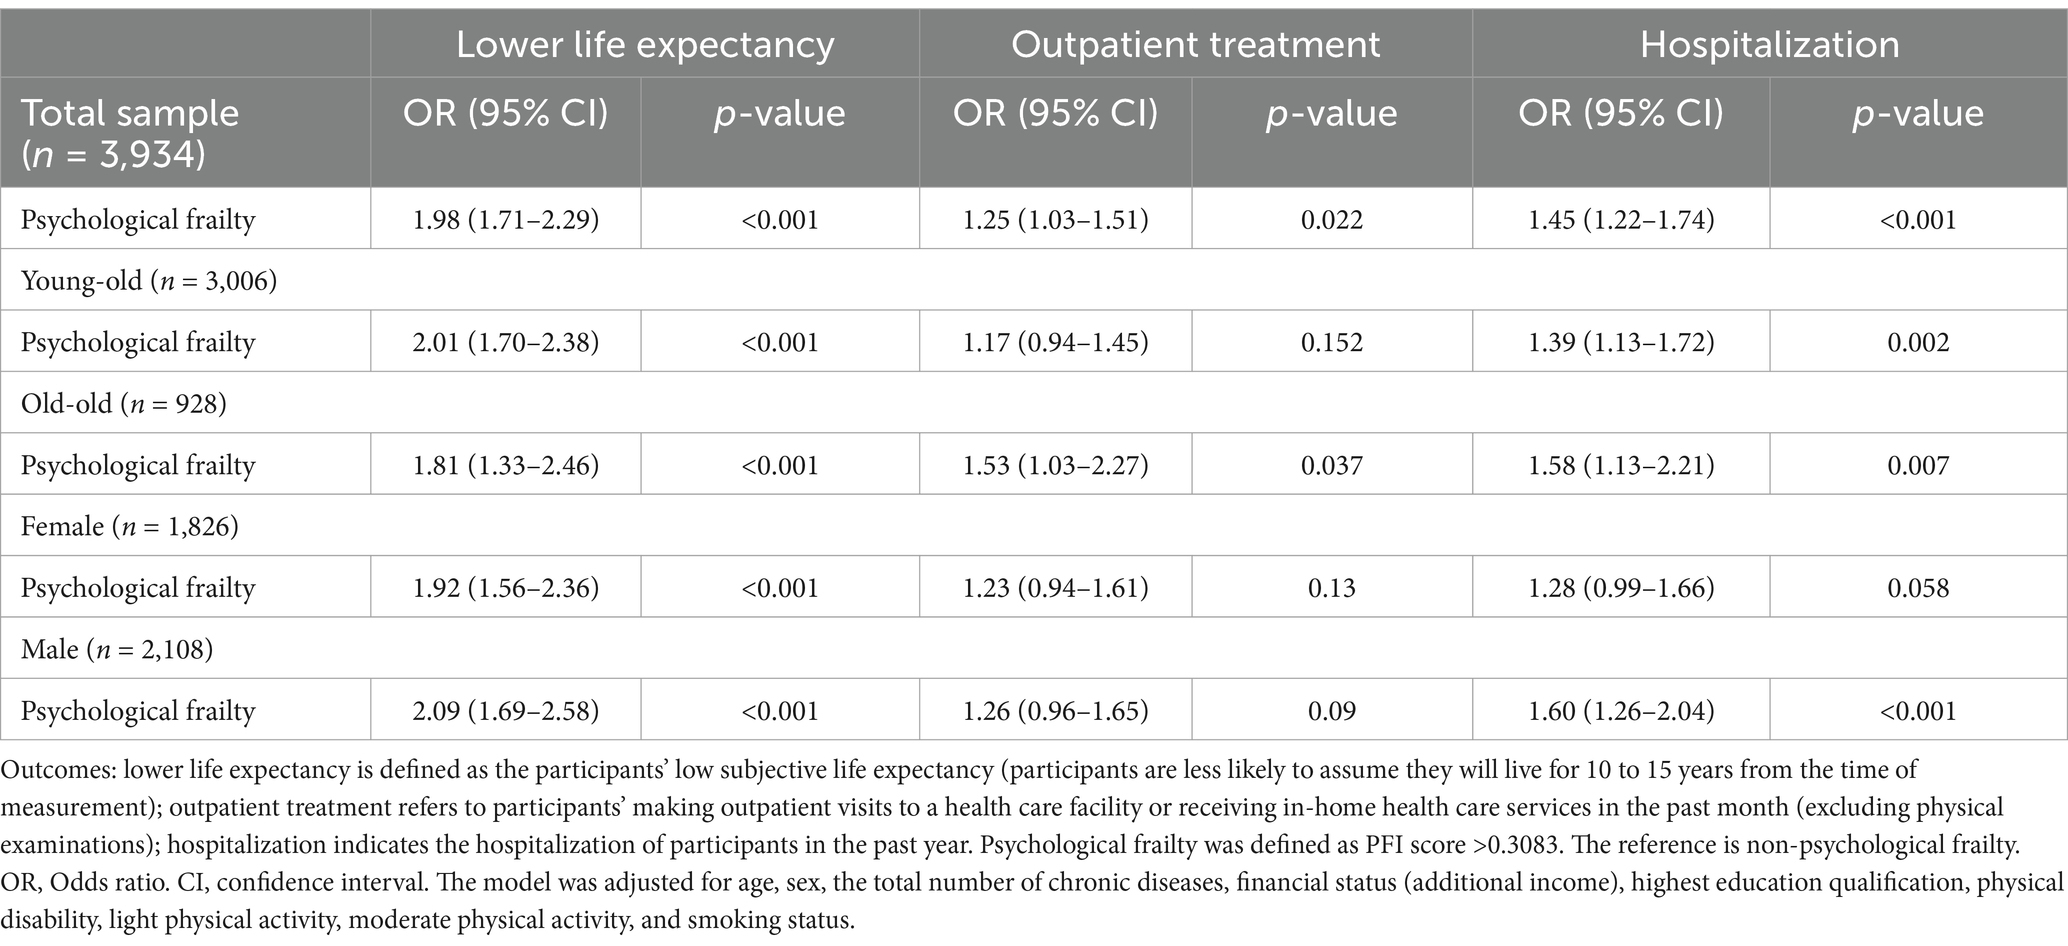
Table 3. Associations of psychological frailty with lower life expectancy, outpatient treatment, and hospitalization.
4 Discussion
4.1 Main findings
This study presents processes in the development of a PFI and its psychometric properties. This PFI was partially validated as an effective instrument for measuring psychological frailty. It demonstrated good performance in terms of both internal consistency, reliability, and criterion-related validity. It also showed sound construct validity and conformed to a four-factor model that included psychological distress, cognitive decline, physical vulnerability, and memory decline. Furthermore, the good discriminative ability of the PFI for identifying frailty and depression was highlighted. Its applicability was tested by showing association with lower life expectancy, higher outpatient treatment, and increased hospitalization. When stratified according to age and sex, these associations remained consistent.
To date, no cut-off value or optimal methodologies have been established for PFI (Zhao et al., 2023). This study provides the first evidence for a cutoff value in a PFI, facilitating its application in screening for psychological frailty. The PFI demonstrated satisfactory internal consistency, based on Cronbach’s alpha and other alternative indicators. The alpha value in this study was better than Cronbach’s alpha values (0.37 through 0.63) obtained for the commonly-used measure of psychological frailty (i.e., the TFI’s psychological domain) across eight studies (Gobbens and Uchmanowicz, 2021). This study also demonstrated that the PFI’s criterion-related reliability was satisfactory. Although the criteria used in this reliability analysis were not optimal, they were the most relevant options available because optimal criteria are still lacking.
The PFI also demonstrated satisfactory construct validity. CatPCA results showed that the total VAF across the four factors was over 50%, indicating that the PFI had an adequate degree of variance to explain psychological frailty. CFA results also supported the PFI’s four-factor structure, indicating its robustness and reproducibility.
This study also verified the classification accuracy (discriminative ability) of the PFI. Regarding frailty, the PFI showed excellent discriminative ability. Similarly, the PFI showed good or acceptable discriminative ability for depression, emotional and psychiatric problems, and memory-related diseases. This evidence suggests the potential of the PFI for clinical application. Nevertheless, Fan et al. (2006) emphasized the potential lack of clinical value where the relevant AUC values are <0.75. The AUC values for both doctor-diagnosed diseases were < 0.75; therefore, the value of the PFI in clinical applications requires further validation. However, the classification accuracy test in this study was intended to utilize these two doctor-diagnosed diseases as objective metrics to assess the PFI.
The findings validated the applicability of the PFI in terms of its association with a lower (subjective) life expectancy, higher outpatient treatment, and increased hospitalization. The association with lower life expectancy has not been previously explored. However, previous studies have found that frailty is associated with decreased life expectancy (Gao et al., 2023; Shamliyan et al., 2013). Moreover, several studies have identified an association between psychological frailty and mortality (Gobbens et al., 2021; Lee et al., 2022), which indirectly support this study’s findings.
This study considered life expectancy as representing an individual’s perception of longevity (O’Connell, 2011). Lower life expectancy is often associated with (psychological) distress (Bodner and Bergman, 2016; Deeg et al., 2021; Griffin et al., 2013), poorer health status (Chen et al., 2021), and limited social connectedness (Bae et al., 2017). Psychological frailty can significantly affect older adults’ perceptions of their life expectancy. Older adults with psychological frailty can hold a pessimistic view of their future health, which causes their belief that they will not survive beyond 10 to 15 years.
Our findings support the association between psychological frailty and outpatient treatment, consistent with previous studies on frailty (Fan et al., 2021; Ge et al., 2020; Li et al., 2021). Nevertheless, all these studies focused on physical or other frailty, which may differ from psychological frailty. Despite insufficient evidence, a significant positive association between psychological frailty and the number of doctor visits has been demonstrated (Calciolari and Luini, 2023). Older adults with psychological frailty tend to suffer from multiple physical and mental conditions (Gobbens et al., 2024; Mutz et al., 2022) and thus may be more likely to exhibit a higher likelihood of receiving outpatient treatment.
Additionally, this study showed that psychological frailty was associated with hospitalization, which is consistent with previous findings (Calciolari and Luini, 2023; Lee et al., 2022). Older adults with psychological frailty are more vulnerable to poor health and multimorbidity (Gobbens et al., 2024; Teo et al., 2019), such as acute exacerbations of physical or mental conditions, resulting in a greater likelihood of hospitalization. The overall pattern of findings from the age-stratified analysis was comparable to that of the principal analysis. In the sex-stratified analysis, a significant association between psychological frailty and hospitalization was found only in males. Several studies have found significant associations between frailty and hospitalization, such as the frequency of inpatient visits, hospital admissions, and the length of hospital stay (Daniels et al., 2012; Fan et al., 2021; Ge et al., 2020; Quach et al., 2023). Furthermore, compelling evidence of these associations exists in systematic reviews (Uchmanowicz et al., 2020; Vermeiren et al., 2016).
The conceptual framework of psychological frailty in our study is worthy of further discussion. Our addition of physical vulnerability in the psychological framework further highlights the complex interactions between mental and physical phenomena. Psychological frailty and physical vulnerability are inherently interrelated due to similar or shared physiological mechanisms. Specifically, psychological stress or depression can lead to inflammation or hormonal imbalances, which can directly affect physical resilience (Fried et al., 2021; Unsar and Sut, 2010; Wolkowitz et al., 2001). Similarly, physical vulnerabilities can increase the risk of psychological problems such as anxiety and depression, which can contribute to the onset of psychological frailty (Ma et al., 2023; Makizako et al., 2015; Zhao et al., 2023). This mutual relationship emphasizes that physical vulnerability can be a key factor influencing psychological frailty. Furthermore, the conceptual framework of this study highlights that critical physiological mechanisms, such as the stress response, may play a mediating role between physical vulnerability and psychological frailty. Physical vulnerability, characterized by reduced physiological reserves and increased susceptibility to stressors (Dent et al., 2019), typically interacts with psychological frailty (Gobbens et al., 2010a), including cognitive decline, mood dysregulation, and decreased memory function (Fitten, 2015; Zhao et al., 2023). Items related to physical vulnerability in our index can represent physical declines caused by aging and stress responses while also causing psychological stress. Conversely, items related to psychological components (psychological distress, cognitive and memory declines) can heighten psychological stress and simultaneously hasten physical declines. The bidirectional relationships can result in a mind–body loop of frailty, with dysregulated stress responses aggravating the mind–body vulnerability (Bot and Kuiper, 2017; Schneiderman et al., 2005). Therefore, incorporating physical vulnerability as a component into the conceptual framework of psychological frailty emphasizes the importance of addressing shared physiological mechanisms. As has been marked by previous researchers, attention should be given not only to the stress response (Pearlin, 1999) but also to other aging-associated mechanisms (Guo et al., 2022; Jin et al., 2024), such as the inflammatory response. Finally, including physical vulnerability in the PFI aligns with a previously proposed psychological frailty framework (Shimada et al., 2019). Notably, our proposed index presents a multifaceted construct of psychological frailty, thereby emphasizing its new contribution to understanding the mind–body link to frailty. Although, until today, there is no consensus on the theories and conceptual frameworks of PFI (Lameirinhas et al., 2024; Zhao et al., 2023), there are several studies that support the notion that mind–body interactions could be considered as one of the fundamental components of psychological frailty (Shimada et al., 2019; Zhao et al., 2023).
4.2 Strengths and limitations
This study has several strengths. This study is the first to create and initially validate a PFI. Although some studies have used several instruments to assess psychological frailty, these instruments lack sound constructs and validation. The present study addresses this gap and provides a more reliable measure of psychological frailty. Additionally, this study adopted a standard FI development procedure (Searle et al., 2008; Theou et al., 2023; Zhao et al., 2023), ensuring an appropriately normative process for creating the PFI. Finally, the PFI can be generalized to similar contexts.
This study has some limitations. The first limitation is related to the selection of potential variables and there were no objective variables. However, psychological frailty is too complex to be described sufficiently with any objective variable and currently lacks a consistent definition (Fitten, 2015; Zhao et al., 2023), which explains the lack of criteria for selecting variables and different interpretations. Researchers have different interpretations of whether certain variables are the attributes of psychological frailty (Fitten, 2015; Kelaiditi et al., 2013; van Oostrom et al., 2017). Therefore, selecting variables related to psychological frailty is challenging. The second limitation is that the cut-off value yielded by the Youden index is debatable because no objective psychological frailty metric exists. The third limitation is that the TFI and 10-item CES-D were utilized as criteria for reliability analysis. Criterion-related reliability may be over- or underestimated owing to the utilization of these two criteria because they are imperfect as the standards of psychological frailty; in this study, they were considered as “quasi-gold” standard alternatives. Perfect identification is challenging because the definition and measurement criteria for psychological frailty currently lack consistency (Zhao et al., 2023). However, the selection of these two criteria facilitated the findings of both theoretical and practical significance. Fourth, the conceptual framework of psychological frailty that we have developed may lack breadth. As a domain of multidimensional frailty, psychological frailty could have both psychological and frail attributes (Zhao et al., 2023). Therefore, we defined psychological frailty as the coexistence of psychological problems and physical vulnerability (frailty). Most definitions or descriptions of psychological frailty in existing research have adopted a multidimensional framework (Lameirinhas et al., 2024; Zhao et al., 2023), which can and has led us to consider multidimensional attributes when operationalizing the term. Establishing a conceptual framework for psychological frailty is challenging and complicated due to the variety of psychological problems. Coupled with the fact that our choice of variables may not be complete due to the variable limitations of the CHARLS database, our conceptual framework may not be comprehensive enough. Fifth, we include physical constructs/vulnerability in conceptualizing psychological frailty based on previous literature. Shimada et al. (2019) have integrated physical frailty into the conceptual framework of psychological frailty. The mind–body interactions also support the notion that physical construct/vulnerability is an important component of psychological frailty (Fitten, 2015; Zhao et al., 2023). However, the absence of a consensus and extensive testing of this conceptual framework necessitates further research and validation. Sixth, although our study provides initial insights into the development of the PFI, it is significant to recognize its limitations related to validation; for this reason, our validation efforts should be considered preliminary. Seventh, the shift in response levels of lower life expectancy may have resulted in some loss of information; however, our ordinal regression analyses showed that the findings were still in the same direction. Eighth, our study used the CFA to validate the factor structure of psychological frailty for the total sample. However, given gender differences in the prevalence of psychological frailty, the factor structure might not apply equally to men and women. As such, we conducted additional analyses to examine cross-gender validity, and the CFA results support the stability of the factor structure across genders. Finally, the cross-sectional design of this study did not facilitate the examination of time sequences, precluding the determination of causal associations.
4.3 Future directions and implications
The PFI provides a new approach for classifying psychological frailty, opening avenues for subsequent research to examine its manifestations across diverse contexts. This study offers insights particularly into the operationalization of psychological frailty, its multidimensional attributes, and its interaction with physical vulnerability, which may serve as a foundation for future theoretical and empirical studies.
5 Conclusion
This study generated and partially validated a novel measurement instrument for assessing psychological frailty (a 15-item PFI) using CHARLS Wave 4 data. The findings highlight the potential capability of the PFI to predict adverse health outcomes. Although this study revealed good psychometric properties of the PFI, further research is needed to refine the validation process and enhance the interpretability of the PFI across diverse cohorts.
What is already known?
• Psychological frailty is currently measured in two approaches: (1) the psychological domains of the multidimensional frailty instruments and (2) the combinations of the Fried frailty phenotype and psychological assessments.
• There is a lack of a measurement tool that specifically addresses psychological frailty.
What this paper adds?
• A tailored measurement tool for psychological frailty was developed, which can have positive implications for a clear understanding of psychologically frail adults.
• Added a new measurement framework for psychological frailty that may offer potential value in reaching a consistent definition and measurement of psychological frailty.
• A positive association of psychological frailty with subjective life expectancy, outpatient treatments, and hospitalization was found in the CHARLS sample.
Data availability statement
Publicly available datasets were analyzed in this study. This data can be found here: all data were sourced from the China Health and Retirement Longitudinal Study (CHARLS).
Ethics statement
The CHARLS was approved by the Institutional Review Board of Peking University (IRB00001052-11015), and all participants signed informed consent at participation.
Author contributions
JZ: Writing – original draft, Writing – review & editing, Validation, Software, Methodology, Formal analysis, Conceptualization. JL: Writing – review & editing, Supervision, Conceptualization. DF: Writing – review & editing. ST: Writing – review & editing, Supervision, Conceptualization.
Funding
The author(s) declare that financial support was received for the research, authorship, and/or publication of this article. Daniel Fernández is a Serra-Húnter Fellow and his work has been supported by the Ministerio de Ciencia e Innovación y Universidades (Spain) [PID2023-148033OB-C21], and by grant 2021 SGR 01421 (GRBIO) administrated by the Departament de Recerca i Universitats de la Generalitat de Catalunya (Spain).
Conflict of interest
The authors declare that the research was conducted in the absence of any commercial or financial relationships that could be construed as a potential conflict of interest.
The author(s) declared that they were an editorial board member of Frontiers, at the time of submission. This had no impact on the peer review process and the final decision.
Publisher’s note
All claims expressed in this article are solely those of the authors and do not necessarily represent those of their affiliated organizations, or those of the publisher, the editors and the reviewers. Any product that may be evaluated in this article, or claim that may be made by its manufacturer, is not guaranteed or endorsed by the publisher.
Supplementary material
The Supplementary material for this article can be found online at: https://www.frontiersin.org/articles/10.3389/fpsyg.2025.1495733/full#supplementary-material
References
Andresen, E. M., Malmgren, J. A., Carter, W. B., and Patrick, D. L. (1994). Screening for depression in well older adults: evaluation of a short form of the CES-D (Center for Epidemiologic Studies Depression Scale). Am. J. Prev. Med. 10, 77–84. doi: 10.1016/S0749-3797(18)30622-6
Au, A. M., Chan, S. C., Yip, H. M., Kwok, J. Y., Lai, K. Y., Leung, K. M., et al. (2017). Age-friendliness and life satisfaction of Young-old and old-old in Hong Kong. Curr. Gerontol. Geriatr. Res. 2017, 6215917–6215910. doi: 10.1155/2017/6215917
Bae, J., Kim, Y. Y., and Lee, J. S. (2017). Factors associated with subjective life expectancy: comparison with actuarial life expectancy. J. Prev. Med. Public Health 50, 240–250. doi: 10.3961/jpmph.17.036
Bodner, E., and Bergman, Y. S. (2016). Loneliness and depressive symptoms among older adults: the moderating role of subjective life expectancy. Psychiatry Res. 237, 78–82. doi: 10.1016/j.psychres.2016.01.074
Bot, I., and Kuiper, J. (2017). Stressed brain, stressed heart? Lancet 389, 770–771. doi: 10.1016/S0140-6736(17)30044-2
Byrne, B. M. (2006). Structural equation modeling with EQS and EQS/windows: Basic concepts, applications, and programming. 2nd Edn. Thousand Oaks, California: Routledge.
Calciolari, S., and Luini, C. (2023). Effects of the bio-psycho-social frailty dimensions on healthcare utilisation among elderly in Europe: a cross-country longitudinal analysis. Soc. Sci. Med. 339:116352. doi: 10.1016/j.socscimed.2023.116352
Carmines, E. G., and McIver, C. (1981). “Analyzing models with unobserved variables: analysis of covariance structures” in Social measurement: Current issues. eds. G. W. Bohrnstedt and E. F. Borgatta (Beverly Hills: Sage).
Casacci, S. (2023). “Categorical principal component analysis” in Encyclopedia of quality of life and well-being research. ed. F. Maggino (New York, USA: Springer International Publishing), 677–678.
Cesari, M., Gambassi, G., van Kan, G. A., and Vellas, B. (2014). The frailty phenotype and the frailty index: different instruments for different purposes. Age Ageing 43, 10–12. doi: 10.1093/ageing/aft160
Chen, Z., Zhu, D., Hu, X., and Gao, G. (2021). Subjective life expectancy and associated factors among cancer survivors over 45 years old: evidence from the CHARLS. Qual. Life Res. 30, 1571–1582. doi: 10.1007/s11136-020-02751-8
Clegg, A., Bates, C., Young, J., Ryan, R., Nichols, L., Ann Teale, E., et al. (2016). Development and validation of an electronic frailty index using routine primary care electronic health record data. Age Ageing 45, 353–360. doi: 10.1093/ageing/afw039
Clegg, A., Young, J., Iliffe, S., Rikkert, M. O., and Rockwood, K. (2013). Frailty in elderly people. Lancet 381, 752–762. doi: 10.1016/s0140-6736(12)62167-9
Daniels, R., van Rossum, E., Beurskens, A., van den Heuvel, W., and de Witte, L. (2012). The predictive validity of three self-report screening instruments for identifying frail older people in the community. BMC Public Health 12:69. doi: 10.1186/1471-2458-12-69
de Rooij, M., and Weeda, W. (2020). Cross-validation: a method every psychologist should know. Adv. Methods Pract. Psychol. Sci. 3, 248–263. doi: 10.1177/2515245919898466
De Witte, N., De Donder, L., Dury, S., Buffel, T., Verte, D., and Schols, J. (2013). A theoretical perspective on the conceptualisation and usefulness of frailty and vulnerability measurements in community dwelling older persons. Aporia 5, 13–21. doi: 10.18192/aporia.v5i1.2894
Deeg, D. J. H., Timmermans, E. J., and Kok, A. A. L. (2021). Capturing subjective age, subjective life expectancy, and their links with older Adults' health: the Dutch longitudinal aging study Amsterdam. J. Aging Health 33, 633–644. doi: 10.1177/08982643211004001
Denman, D. C., Baldwin, A. S., Betts, A. C., McQueen, A., and Tiro, J. A. (2018). Reducing "I Don't know" responses and missing survey data: implications for measurement. Med. Decis. Mak. 38, 673–682. doi: 10.1177/0272989x18785159
Dent, E., Martin, F. C., Bergman, H., Woo, J., Romero-Ortuno, R., and Walston, J. D. (2019). Management of frailty: opportunities, challenges, and future directions. Lancet 394, 1376–1386. doi: 10.1016/S0140-6736(19)31785-4
Dong, L., Liu, N., Tian, X., Qiao, X., Gobbens, R. J. J., Kane, R. L., et al. (2017). Reliability and validity of the Tilburg frailty Indicator (TFI) among Chinese community-dwelling older people. Arch. Gerontol. Geriatr. 73, 21–28. doi: 10.1016/j.archger.2017.07.001
Dunlay, S. M., Park, S. J., Joyce, L. D., Daly, R. C., Stulak, J. M., McNallan, S. M., et al. (2014). Frailty and outcomes after implantation of left ventricular assist device as destination therapy. J. Heart Lung Transplant. 33, 359–365. doi: 10.1016/j.healun.2013.12.014
Fan, L., Tian, Y., Wang, J., Ding, Y., Wang, S., Xue, H., et al. (2021). Frailty predicts increased health care utilization among community-dwelling older adults: a longitudinal study in China. J. Am. Med. Dir. Assoc. 22, 1819–1824. doi: 10.1016/j.jamda.2021.01.082
Fan, J., Upadhye, S., and Worster, A. (2006). Understanding receiver operating characteristic (ROC) curves. CJEM 8, 19–20. doi: 10.1017/s1481803500013336
Fitten, L. J. (2015). Psychological frailty in the aging patient. Nestle Nutr. Inst. Workshop Ser. 83, 45–53. doi: 10.1159/000382060
Flora, D. B. (2020). Your coefficient alpha is probably wrong, but which coefficient omega is right? A tutorial on using R to obtain better reliability estimates. Adv. Methods Pract. Psychol. Sci. 3, 484–501. doi: 10.1177/2515245920951747
Fried, L. P., Cohen, A. A., Xue, Q.-L., Walston, J., Bandeen-Roche, K., and Varadhan, R. (2021). The physical frailty syndrome as a transition from homeostatic symphony to cacophony. Nat. Aging 1, 36–46. doi: 10.1038/s43587-020-00017-z
Fu, H., Si, L., and Guo, R. (2022). What is the optimal cut-off point of the 10-item Center for Epidemiologic Studies Depression Scale for screening depression among Chinese individuals aged 45 and over? An exploration using latent profile analysis. Front. Psych. 13:820777. doi: 10.3389/fpsyt.2022.820777
Gao, J., Wang, Y., Xu, J., Jiang, J., Yang, S., and Xiao, Q. (2023). Life expectancy among older adults with or without frailty in China: multistate modelling of a national longitudinal cohort study. BMC Med. 21:101. doi: 10.1186/s12916-023-02825-7
Ge, L., Yap, C. W., Heng, B. H., and Tan, W. S. (2020). Frailty and healthcare utilisation across care settings among community-dwelling older adults in Singapore. BMC Geriatr. 20:389. doi: 10.1186/s12877-020-01800-8
Gobbens, R. J. J., Kuiper, S., Dijkshoorn, H., and van Assen, M. (2024). Associations of individual chronic diseases and multimorbidity with multidimensional frailty. Arch. Gerontol. Geriatr. 117:105259. doi: 10.1016/j.archger.2023.105259
Gobbens, R. J., Luijkx, K. G., Wijnen-Sponselee, M. T., and Schols, J. M. (2010a). Towards an integral conceptual model of frailty. J. Nutr. Health Aging 14, 175–181. doi: 10.1007/s12603-010-0045-6
Gobbens, R. J., and Uchmanowicz, I. (2021). Assessing frailty with the Tilburg frailty Indicator (TFI): a review of reliability and validity. Clin. Interv. Aging Volume 16, 863–875. doi: 10.2147/cia.S298191
Gobbens, R. J. J., van Assen, M. A. L. M., Augustijn, H., Goumans, M., and van der Ploeg, T. (2021). Prediction of mortality by the Tilburg frailty Indicator (TFI). J. Am. Med. Dir. Assoc. 22, 607.e1–607.e6. doi: 10.1016/j.jamda.2020.07.033
Gobbens, R. J., van Assen, M. A., Luijkx, K. G., and Schols, J. M. (2012). The predictive validity of the Tilburg frailty Indicator: disability, health care utilization, and quality of life in a population at risk. Gerontologist 52, 619–631. doi: 10.1093/geront/gnr135
Gobbens, R. J., van Assen, M. A., Luijkx, K. G., Wijnen-Sponselee, M. T., and Schols, J. M. (2010b). The Tilburg frailty Indicator: psychometric properties. J. Am. Med. Dir. Assoc. 11, 344–355. doi: 10.1016/j.jamda.2009.11.003
Griffin, B., Loh, V., and Hesketh, B. (2013). A mental model of factors associated with subjective life expectancy. Soc. Sci. Med. 82, 79–86. doi: 10.1016/j.socscimed.2013.01.026
Guo, J., Huang, X., Dou, L., Yan, M., Shen, T., Tang, W., et al. (2022). Aging and aging-related diseases: from molecular mechanisms to interventions and treatments. Signal Transduct. Target. Ther. 7:391. doi: 10.1038/s41392-022-01251-0
Hoelter, J. W. (1983). The analysis of covariance structures: goodness-of-fit indices. Sociol. Methods Res. 11, 325–344. doi: 10.1177/0049124183011003003
Hu, L., and Bentler, P. M. (1999). Cutoff criteria for fit indexes in covariance structure analysis: conventional criteria versus new alternatives. Struct. Equ. Model. Multidiscip. J. 6, 1–55. doi: 10.1080/10705519909540118
Huang, E. Y. Z., Cheung, J., Liu, J. Y. W., Kwan, R. Y. C., and Lam, S. C. (2022). Groningen frailty Indicator-Chinese (GFI-C) for pre-frailty and frailty assessment among older people living in communities: psychometric properties and diagnostic accuracy. BMC Geriatr. 22:788. doi: 10.1186/s12877-022-03437-1
Jin, H., Li, M., Jeong, E., Castro-Martinez, F., and Zuker, C. S. (2024). A body–brain circuit that regulates body inflammatory responses. Nature 630, 695–693. doi: 10.1038/s41586-024-07469-y
Kalkbrenner, M. T. (2023). Alpha, omega, and H internal consistency reliability estimates: reviewing these options and when to use them. Couns. Outcome Res. Eval. 14, 77–88. doi: 10.1080/21501378.2021.1940118
Kelaiditi, E., Cesari, M., Canevelli, M., van Kan, G. A., Ousset, P. J., Gillette-Guyonnet, S., et al. (2013). Cognitive frailty: rational and definition from an (I.A.N.A./I.A.G.G.) international consensus group. J. Nutr. Health Aging 17, 726–734. doi: 10.1007/s12603-013-0367-2
Khezrian, M., Myint, P. K., McNeil, C., and Murray, A. D. (2017). A review of frailty syndrome and its physical, cognitive and emotional domains in the elderly. Geriatrics (Basel) 2, 1–10. doi: 10.3390/geriatrics2040036
Kline, P. (2000). The handbook of psychological testing. 2nd Edn. London, UK: Taylor & Frances/Routledge.
Kline, R. B. (2016). Principles and practice of structural equation modeling. 4th Edn. New York, USA: Guilford Press.
Krstajic, D., Buturovic, L. J., Leahy, D. E., and Thomas, S. (2014). Cross-validation pitfalls when selecting and assessing regression and classification models. J. Cheminform. 6:10. doi: 10.1186/1758-2946-6-10
Lameirinhas, J., Gorostiaga, A., and Etxeberria, I. (2024). Definition and assessment of psychological frailty in older adults: a scoping review. Ageing Res. Rev. 100:102442. doi: 10.1016/j.arr.2024.102442
Lee, Y., Kim, E., Yun, J., and Chuck, K. W. (2022). The influence of multiple frailty profiles on institutionalization and all-cause mortality in community-living older adults. J. Cachexia. Sarcopenia Muscle 13, 2322–2330. doi: 10.1002/jcsm.13033
Li, C.-M., Lin, C.-H., Li, C.-I., Liu, C.-S., Lin, W.-Y., Li, T.-C., et al. (2021). Frailty status changes are associated with healthcare utilization and subsequent mortality in the elderly population. BMC Public Health 21:645. doi: 10.1186/s12889-021-10688-x
Linting, M., Meulman, J. J., Groenen, P. J., and van der Koojj, A. J. (2007). Nonlinear principal components analysis: introduction and application. Psychol. Methods 12, 336–358. doi: 10.1037/1082-989X.12.3.336
Linting, M., and van der Kooij, A. (2012). Nonlinear principal components analysis with CATPCA: a tutorial. J. Pers. Assess. 94, 12–25. doi: 10.1080/00223891.2011.627965
Ma, T., Chen, M., Cheng, X., and Bai, Y. (2023). Assessment of bidirectional relationships between frailty and mental disorders: a bidirectional Mendelian randomization study. J. Am. Med. Dir. Assoc. 25, 506–513.e29. doi: 10.1016/j.jamda.2023.10.009
Makizako, H., Shimada, H., Doi, T., Yoshida, D., Anan, Y., Tsutsumimoto, K., et al. (2015). Physical frailty predicts incident depressive symptoms in elderly people: prospective findings from the Obu study of health promotion for the elderly. J. Am. Med. Dir. Assoc. 16, 194–199. doi: 10.1016/j.jamda.2014.08.017
McNeish, D. (2018). Thanks coefficient alpha, we'll take it from here. Psychol. Methods 23, 412–433. doi: 10.1037/met0000144
Mirzaei, A., Carter, S. R., Patanwala, A. E., and Schneider, C. R. (2022). Missing data in surveys: key concepts, approaches, and applications. Res. Soc. Adm. Pharm. 18, 2308–2316. doi: 10.1016/j.sapharm.2021.03.009
Mulaik, S. A., James, L. R., Van Alstine, J., Bennett, N., Lind, S., and Stilwell, C. D. (1989). Evaluation of goodness-of-fit indices for structural equation models. Psychol. Bull. 105, 430–445. doi: 10.1037/0033-2909.105.3.430
Mutz, J., Choudhury, U., Zhao, J., and Dregan, A. (2022). Frailty in individuals with depression, bipolar disorder and anxiety disorders: longitudinal analyses of all-cause mortality. BMC Med. 20:274. doi: 10.1186/s12916-022-02474-2
Mutz, J., Roscoe, C. J., and Lewis, C. M. (2021). Exploring health in the UK biobank: associations with sociodemographic characteristics, psychosocial factors, lifestyle and environmental exposures. BMC Med. 19:240. doi: 10.1186/s12916-021-02097-z
Newman, D. A. (2014). Missing data:five practical guidelines. Organ. Res. Methods 17, 372–411. doi: 10.1177/1094428114548590
O’Connell, A. (2011). How long do we expect to live? A review of the evidence. J. Popul. Ageing 4, 185–201. doi: 10.1007/s12062-011-9049-1
Pearlin, L. I. (1999). Stress and mental health: A conceptual overview. In A handbook for the study of mental health: Social contexts, theories, and systems. eds. A. V. Horwitz and T. L. Scheid (Cambridge University Press), pp. 161–175.
Pilotto, A., Custodero, C., Maggi, S., Polidori, M. C., Veronese, N., and Ferrucci, L. (2020). A multidimensional approach to frailty in older people. Ageing Res. Rev. 60:101047. doi: 10.1016/j.arr.2020.101047
Quach, J., Kehler, D. S., Giacomantonio, N., McArthur, C., Blanchard, C., Firth, W., et al. (2023). Association of admission frailty and frailty changes during cardiac rehabilitation with 5-year outcomes. Eur. J. Prev. Cardiol. 30, 807–819. doi: 10.1093/eurjpc/zwad048
Radloff, L. S. (1977). The CES-D scale:a self-report depression scale for research in the general population. Appl. Psychol. Meas. 1, 385–401. doi: 10.1177/014662167700100306
Rietman, M. L., van der, A. D., van Oostrom, S. H., Picavet, H. S. J., Dollé, M. E. T., van Steeg, H., et al. (2018). The association between BMI and different frailty domains: a U-shaped curve? J. Nutr. Health Aging 22, 8–15. doi: 10.1007/s12603-016-0854-3
Rockwood, K. (2016). Conceptual models of frailty: accumulation of deficits. Can. J. Cardiol. 32, 1046–1050. doi: 10.1016/j.cjca.2016.03.020
Rockwood, K., and Mitnitski, A. (2007). Frailty in relation to the accumulation of deficits. J. Gerontol. A Biol. Sci. Med. Sci. 62, 722–727. doi: 10.1093/gerona/62.7.722
Saukani, N., and Ismail, N. A. (2019). Identifying the components of social capital by categorical principal component analysis (CATPCA). Soc. Indic. Res. 141, 631–655. doi: 10.1007/s11205-018-1842-2
Schein, R. L., and Koenig, H. G. (1997). The Center for Epidemiological Studies-Depression (CES-D) scale: assessment of depression in the medically ill elderly. Int. J. Geriatr. Psychiatry 12, 436–446. doi: 10.1002/(SICI)1099-1166(199704)12:4<436::AID-GPS499>3.0.CO;2-M
Schneiderman, N., Ironson, G., and Siegel, S. D. (2005). Stress and health: psychological, behavioral, and biological determinants. Annu. Rev. Clin. Psychol. 1, 607–628. doi: 10.1146/annurev.clinpsy.1.102803.144141
Schreiber, J. B., Nora, A., Stage, F. K., Barlow, E. A., and King, J. (2006). Reporting structural equation modeling and confirmatory factor analysis results: a review. J. Educ. Res. 99, 323–338. doi: 10.3200/JOER.99.6.323-338
Searle, S. D., Mitnitski, A., Gahbauer, E. A., Gill, T. M., and Rockwood, K. (2008). A standard procedure for creating a frailty index. BMC Geriatr. 8:24. doi: 10.1186/1471-2318-8-24
Shamliyan, T., Talley, K. M. C., Ramakrishnan, R., and Kane, R. L. (2013). Association of frailty with survival: a systematic literature review. Ageing Res. Rev. 12, 719–736. doi: 10.1016/j.arr.2012.03.001
Shimada, H., Lee, S., Doi, T., Bae, S., Tsutsumimoto, K., and Arai, H. (2019). Prevalence of psychological frailty in Japan: NCGG-SGS as a Japanese National Cohort Study. J. Clin. Med. 8, 1–14. doi: 10.3390/jcm8101554
Si, H., Jin, Y., Qiao, X., Tian, X., Liu, X., and Wang, C. (2021). Comparison of 6 frailty screening tools in diagnostic properties among Chinese community-dwelling older people. Geriatr. Nurs. 42, 276–282. doi: 10.1016/j.gerinurse.2020.08.017
Spearman, C. (1904). The proof and measurement of association between two things. Am. J. Psychol. 15, 72–101. doi: 10.2307/1412159
Sugimoto, T., Arai, H., and Sakurai, T. (2022). An update on cognitive frailty: its definition, impact, associated factors and underlying mechanisms, and interventions. Geriatr Gerontol Int 22, 99–109. doi: 10.1111/ggi.14322
Swets, J. A. (1988). Measuring the accuracy of diagnostic systems. Science 240, 1285–1293. doi: 10.1126/science.3287615
Taylor, J. M. (2021). Coefficient omega. J. Nurs. Educ. 60, 429–430. doi: 10.3928/01484834-20210722-02
Teo, N., Yeo, P. S., Gao, Q., Nyunt, M. S. Z., Foo, J. J., Wee, S. L., et al. (2019). A bio-psycho-social approach for frailty amongst Singaporean Chinese community-dwelling older adults - evidence from the Singapore longitudinal aging study. BMC Geriatr. 19:350. doi: 10.1186/s12877-019-1367-9
Theou, O., Haviva, C., Wallace, L., Searle, S. D., and Rockwood, K. (2023). How to construct a frailty index from an existing dataset in 10 steps. Age Ageing 52, 1–7. doi: 10.1093/ageing/afad221
Tocchi, C., Dixon, J., Naylor, M., Jeon, S., and McCorkle, R. (2014). Development of a frailty measure for older adults: the frailty index for elders. J. Nurs. Meas. 22, 223–240. doi: 10.1891/1061-3749.22.2.223
Tyrovolas, S., Escriva, N. G., Ayuso-Mateos, J. L., Chatterji, S., Koyanagi, A., Miret, M., et al. (2018). Frailty and health status of older individuals in three European countries: the COURAGE cross-sectional study. Exp. Gerontol. 106, 137–144. doi: 10.1016/j.exger.2018.02.028
Uchmanowicz, I., Lee, C. S., Vitale, C., Manulik, S., Denfeld, Q. E., Uchmanowicz, B., et al. (2020). Frailty and the risk of all-cause mortality and hospitalization in chronic heart failure: a meta-analysis. ESC Heart Failure 7, 3427–3437. doi: 10.1002/ehf2.12827
Uchmanowicz, I., Pasieczna, A. H., Wójta-Kempa, M., Gobbens, R. J. J., Młynarska, A., Faulkner, K. M., et al. (2022). Physical, psychological and social frailty are predictive of heart failure: a cross-sectional study. J. Clin. Med. 11, 1–10. doi: 10.3390/jcm11030565
Unsar, S., and Sut, N. (2010). Depression and health status in elderly hospitalized patients with chronic illness. Arch. Gerontol. Geriatr. 50, 6–10. doi: 10.1016/j.archger.2008.12.011
van Oostrom, S. H., van der, A. D. L., Rietman, M. L., Picavet, H. S. J., Lette, M., Verschuren, W. M. M., et al. (2017). A four-domain approach of frailty explored in the Doetinchem cohort study. BMC Geriatr. 17:196. doi: 10.1186/s12877-017-0595-0
Vermeiren, S., Vella-Azzopardi, R., Beckwée, D., Habbig, A. K., Scafoglieri, A., Jansen, B., et al. (2016). Frailty and the prediction of negative health outcomes: a Meta-analysis. J. Am. Med. Dir. Assoc. 17, 1163.e1–1163.e17. doi: 10.1016/j.jamda.2016.09.010
Wheaton, B., Muthén, B., Alwin, D. F., and Summers, G. F. (1977). Assessing reliability and stability in panel models. Sociol. Methodol. 8:84. doi: 10.2307/270754
Wolkowitz, O. M., Epel, E. S., and Reus, V. I. (2001). Stress hormone-related psychopathology: pathophysiological and treatment implications. World J. Biol. Psychiatry 2, 115–143. doi: 10.3109/15622970109026799
Yang, W., Xiong, G., Garrido, L. E., Zhang, J. X., Wang, M. C., and Wang, C. (2018). Factor structure and criterion validity across the full scale and ten short forms of the CES-D among Chinese adolescents. Psychol. Assess. 30, 1186–1198. doi: 10.1037/pas0000559
Yong, S. J., Gwini, S. M., Tembo, M. C., Ng, B. L., Low, C. H., Malon, R. G., et al. (2021). Frailty associations with socioeconomic status, healthcare utilisation and quality of life among older women residing in regional Australia. J. Frailty Sarcopenia Falls 6, 209–217. doi: 10.22540/jfsf-06-209
Zamora-Sánchez, J.-J., Urpí-Fernández, A.-M., Sastre-Rus, M., Lumillo-Gutiérrez, I., Gea-Caballero, V., Jodar-Fernández, L., et al. (2022). The Tilburg frailty Indicator: a psychometric systematic review. Ageing Res. Rev. 76:101588. doi: 10.1016/j.arr.2022.101588
Zhang, D., Chan, D. C., Niu, L., Liu, H., Zou, D., Chan, A. T., et al. (2018). Meaning and its association with happiness, health and healthcare utilization: a cross-sectional study. J. Affect. Disord. 227, 795–802. doi: 10.1016/j.jad.2017.11.082
Zhao, J., Liu, Y. W. J., Tyrovolas, S., and Mutz, J. (2023). Exploring the concept of psychological frailty in older adults: a systematic scoping review. J. Clin. Epidemiol. 159, 300–308. doi: 10.1016/j.jclinepi.2023.05.005
Zhao, Y., Strauss, J., Chen, X., Wang, Y., Gong, J., Meng, Q., et al. (2020). Health and retirement longitudinal study wave 4 User’s guide. Avilable at: https://charls.charlsdata.com/Public/ashelf/public/uploads/document/2018-charls-wave4/application/CHARLS_2018_Users_Guide.pdf (Accessed March 15, 2024).
Keywords: frailty, psychological frailty, CHARLS database, scale development, gerontology
Citation: Zhao J, Liu JYW, Fernández D and Tyrovolas S (2025) Development of a psychological frailty index: results from the China health and retirement longitudinal study. Front. Psychol. 16:1495733. doi: 10.3389/fpsyg.2025.1495733
Edited by:
Kwanghee Jung, Texas Tech University, United StatesReviewed by:
Kyungtae Kim, Tennessee Department of Education, United StatesThomas J. Huggins, University of Monterrey, Mexico
Copyright © 2025 Zhao, Liu, Fernández and Tyrovolas. This is an open-access article distributed under the terms of the Creative Commons Attribution License (CC BY). The use, distribution or reproduction in other forums is permitted, provided the original author(s) and the copyright owner(s) are credited and that the original publication in this journal is cited, in accordance with accepted academic practice. No use, distribution or reproduction is permitted which does not comply with these terms.
*Correspondence: Justina Yat Wa Liu, anVzdGluYS5saXVAcG9seXUuZWR1Lmhr; Stefanos Tyrovolas, c3R5cm92b2xAZ211LmVkdQ==