 Katrine Nyvoll Aadland
 Arne Lervåg
 Yngvar Ommundsen3
 Eivind Aadland
94% of researchers rate our articles as excellent or good
Learn more about the work of our research integrity team to safeguard the quality of each article we publish.
Find out more
CORRECTION article
Front. Psychol. , 15 May 2023
Sec. Quantitative Psychology and Measurement
Volume 14 - 2023 | https://doi.org/10.3389/fpsyg.2023.1178961
A Commentary on
Structural validity of the Norwegian version of the Strengths and Difficulties Questionnaire in children aged 3–6 years
by Aadland, K. N., Lervåg, A., Ommundsen, Y., and Aadland, E. (2022). Front. Psychol. 13:1024918. doi: 10.3389/fpsyg.2022.1024918
In the published article, there was an error. In the published manuscript, re-coding of the positively worded items 7, 11, 14, 21, and 25 in the SDQ was erroneous. The response “Not true” was incorrectly coded as “Somewhat true,” and vice versa. The authors have corrected the error in the datafile and reanalyzed the data. In the correction, all estimates provided in text, tables, and figures have been corrected. Some minor corresponding corrections have been done in the discussion. The conclusion is not changed.
A correction has been made to Results, Paragraph 1. The corrected paragraph is shown below.
“Children with data on at least one item on the SDQ were included in the analysis (n = 1,142, 48% girls). We included 1,130–1,141 observations on each item (0.5% missing observations in total). The mean age of the children were 4.3 years (SD 0.9), and the mean difficulties score was 6.42 (SD 5.04) [5.22 (4.35) in girls and 7.54 (5.36) in boys]. Children's scores are presented in Supplementary Table 1, and bivariate correlations between scales are presented in Table 1.”
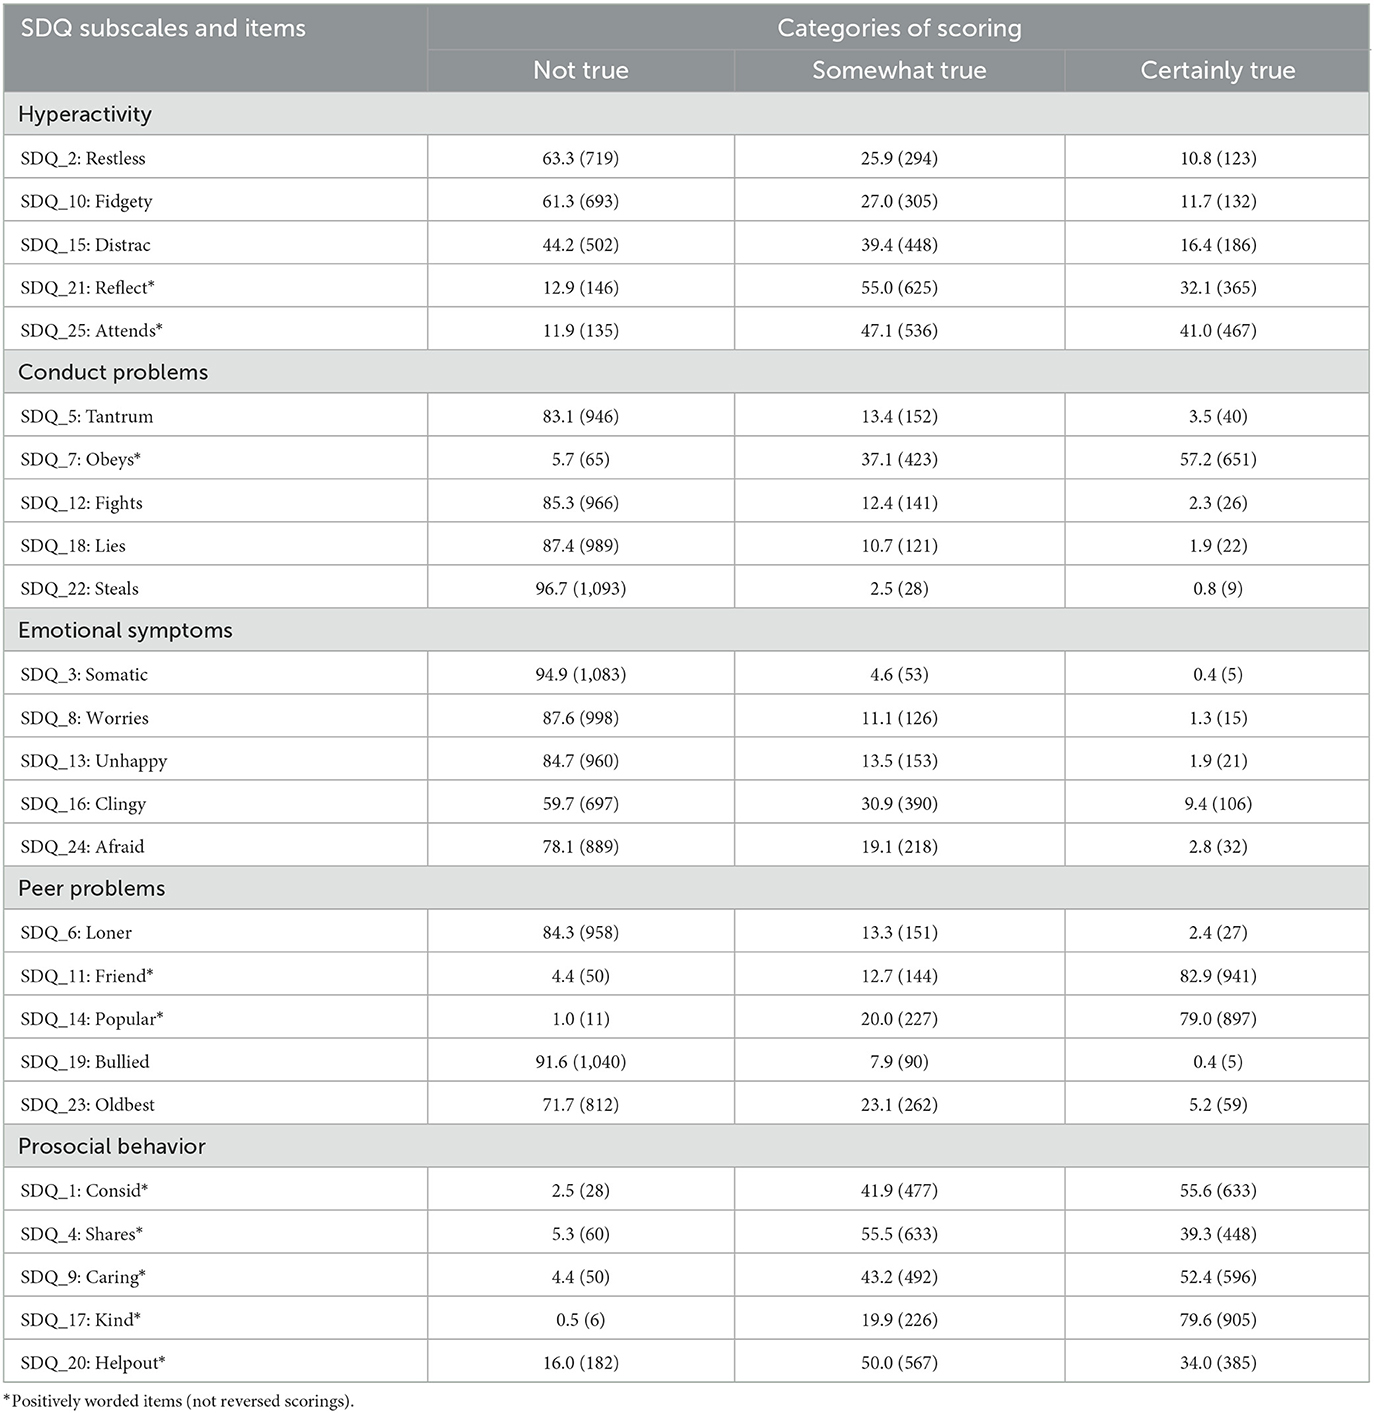
Supplementary Table 1. Proportions and counts (in brackets) of scoring on each category for all items of SDQ.
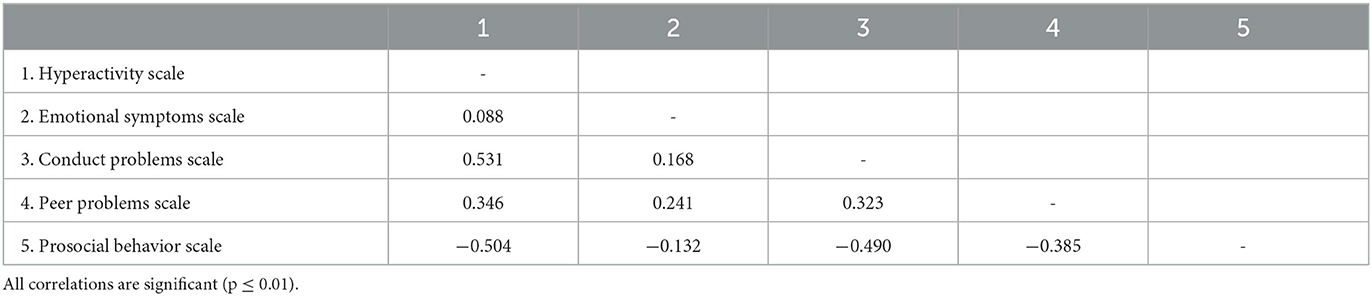
Table 1. Bivariate correlation matrix for all scales (sum scores) in SDQ.
Corrections have been made to Results, “Confirmatory factor analysis,” Paragraphs 1–6. The corrected paragraphs are shown below.
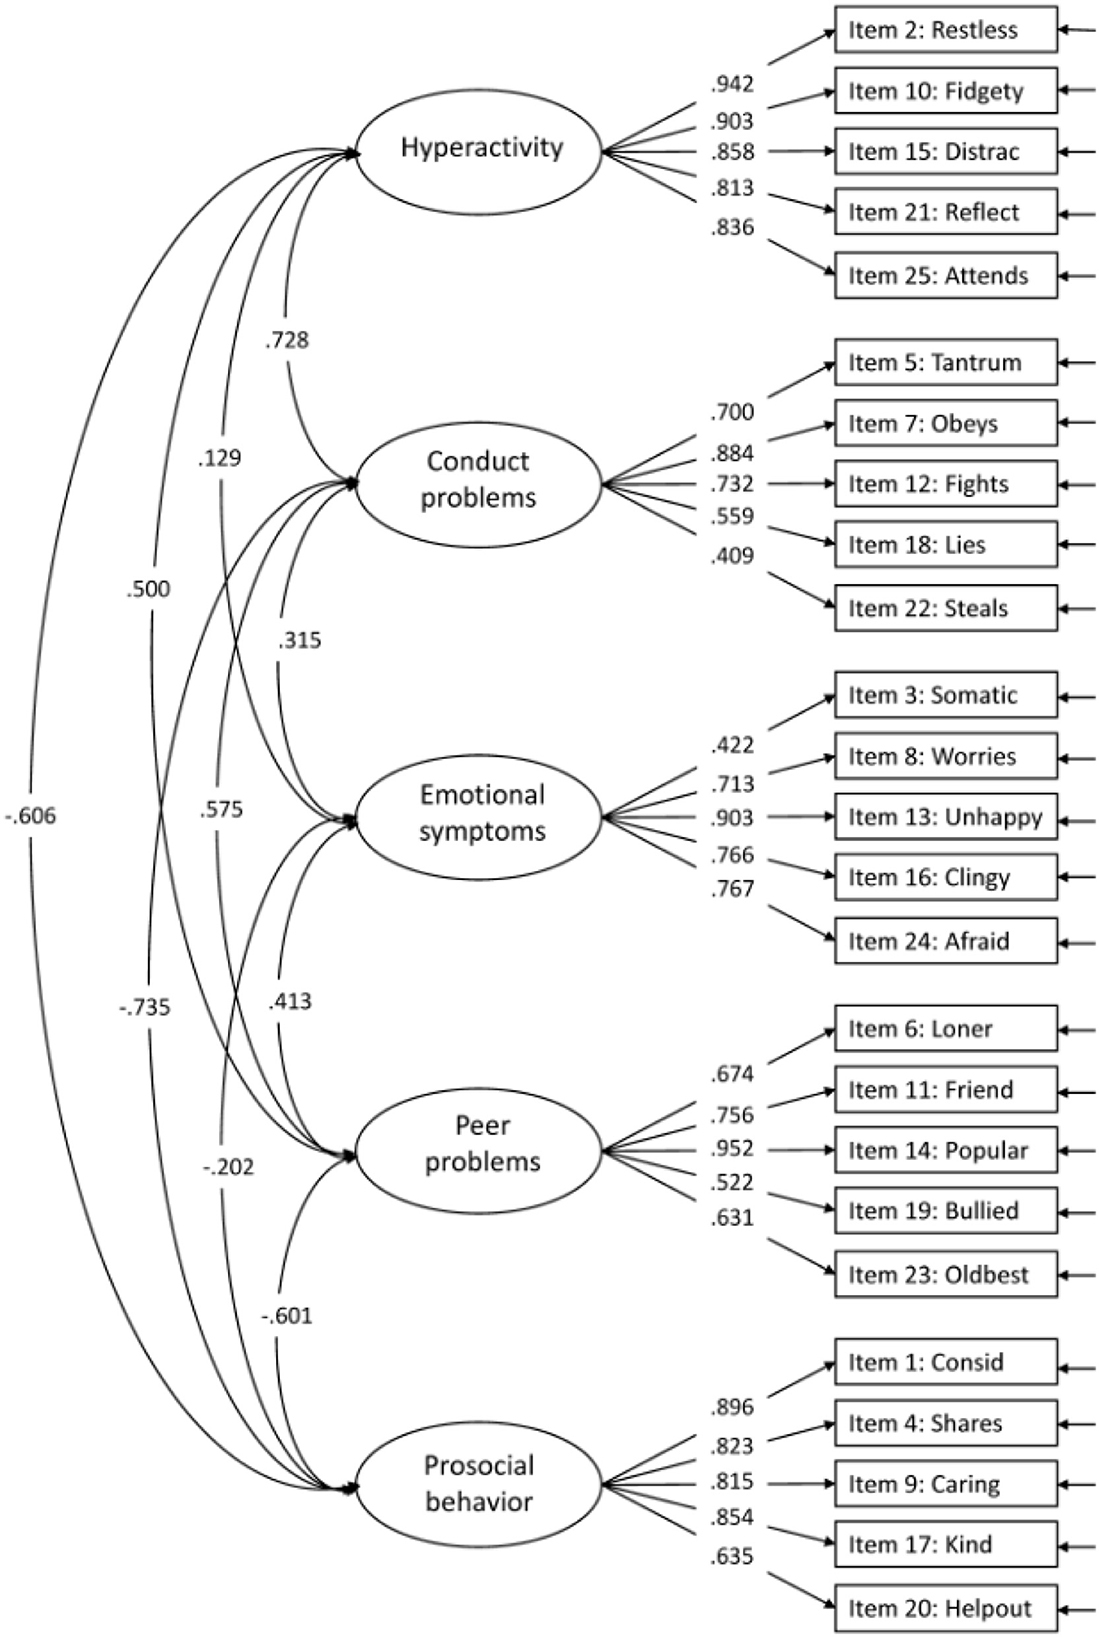
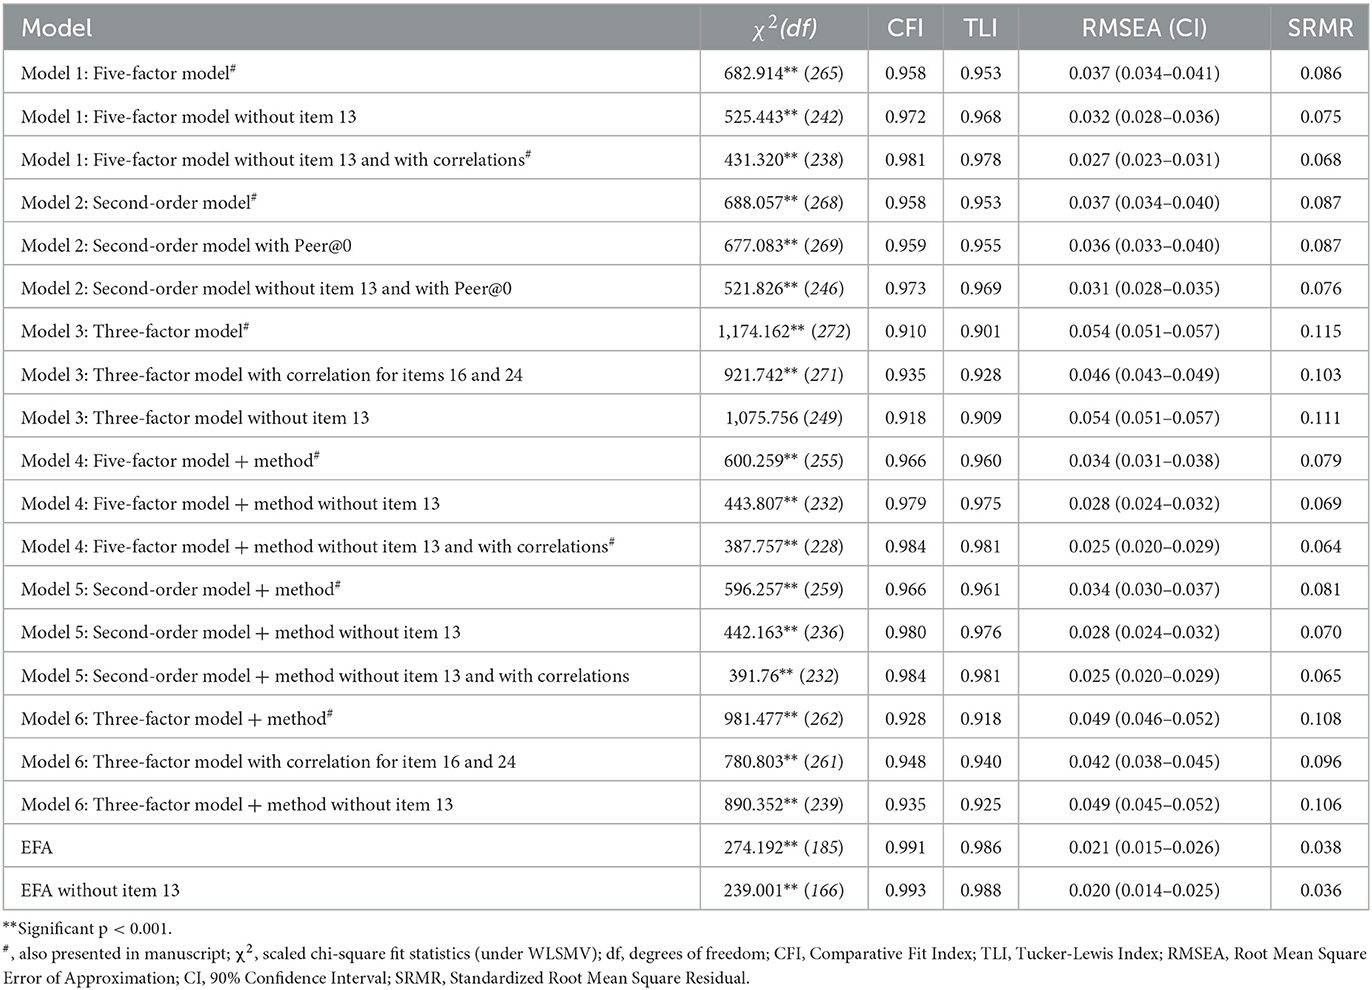
“The original five-factor model (model 1) suggested by Goodman (1997) showed good model fit for CFI (0.958) RMSEA (0.037) and TLI (0.953), but not for SRMR (0.086; Supplementary Figure 1). The internal consistency for the five factors were all above 0.80 (Emotional symptoms; ω = 0.853, Conduct problems; ω = 0.811, Hyperactivity; ω = 0.942, Peer problems; ω = 0.843, and Prosocial behavior; ω = 0.904). Several modifications were suggested, with the highest modification index for item 13: Unhappy. This item was suggested to cross-load on all factors (modification indices range 66.03–83.53). These cross-loadings might indicate that item 13 is not well-suited for the youngest children. The wording of the item is “Ofte lei seg, nedfor eller på gråten” (“Often unhappy, down-hearted or tearful”), where the last part, “på gråten” (“tearful”), possibly is problematic, since children at this age tend to cry for many reasons and in different situations. For this reason, we omitted item 13 in further analyses. Removing item 13 from the five-factor model resulted in better model fit for all indices (CFI = 0.972, RMSEA = 0.032, TLI = 0.968, and SRMR = 0.075), all within the accepted criteria. The modification indices further suggested cross-loadings for some items and correlations between items. We allowed correlations for items with reasonable similarities within the same factor (i.e., item 2 with item 10, item 23 with item 6, item 9 with item 20, and item 24 with item 16). These minor modifications (correlations), except for the correlation between item 9 and item 20, were also seen in the five-factor models by Goodman et al. (2010). After taking these modifications into account, model fit indices for the original five-factor model (model 1) with modifications were all within the criteria for good model fit (Table 2), with standardized factor loadings ≥ 0.404 (Figure 7).
Supplementary Figure 1. Confirmatory Factor Analysis of the five-factor model (no modifications).
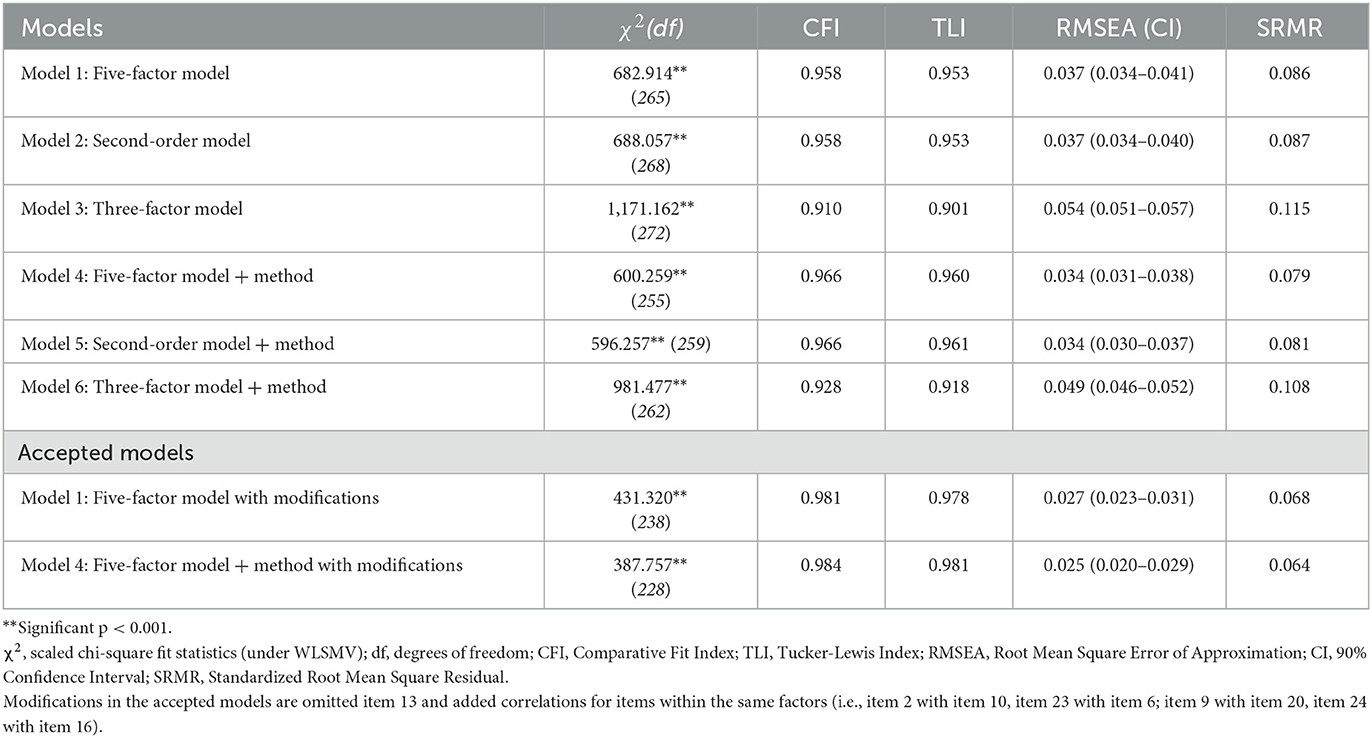
Table 2. Model fit indices for the confirmatory factor analysis of the six tested models of the SDQ structure (n = 1,142).
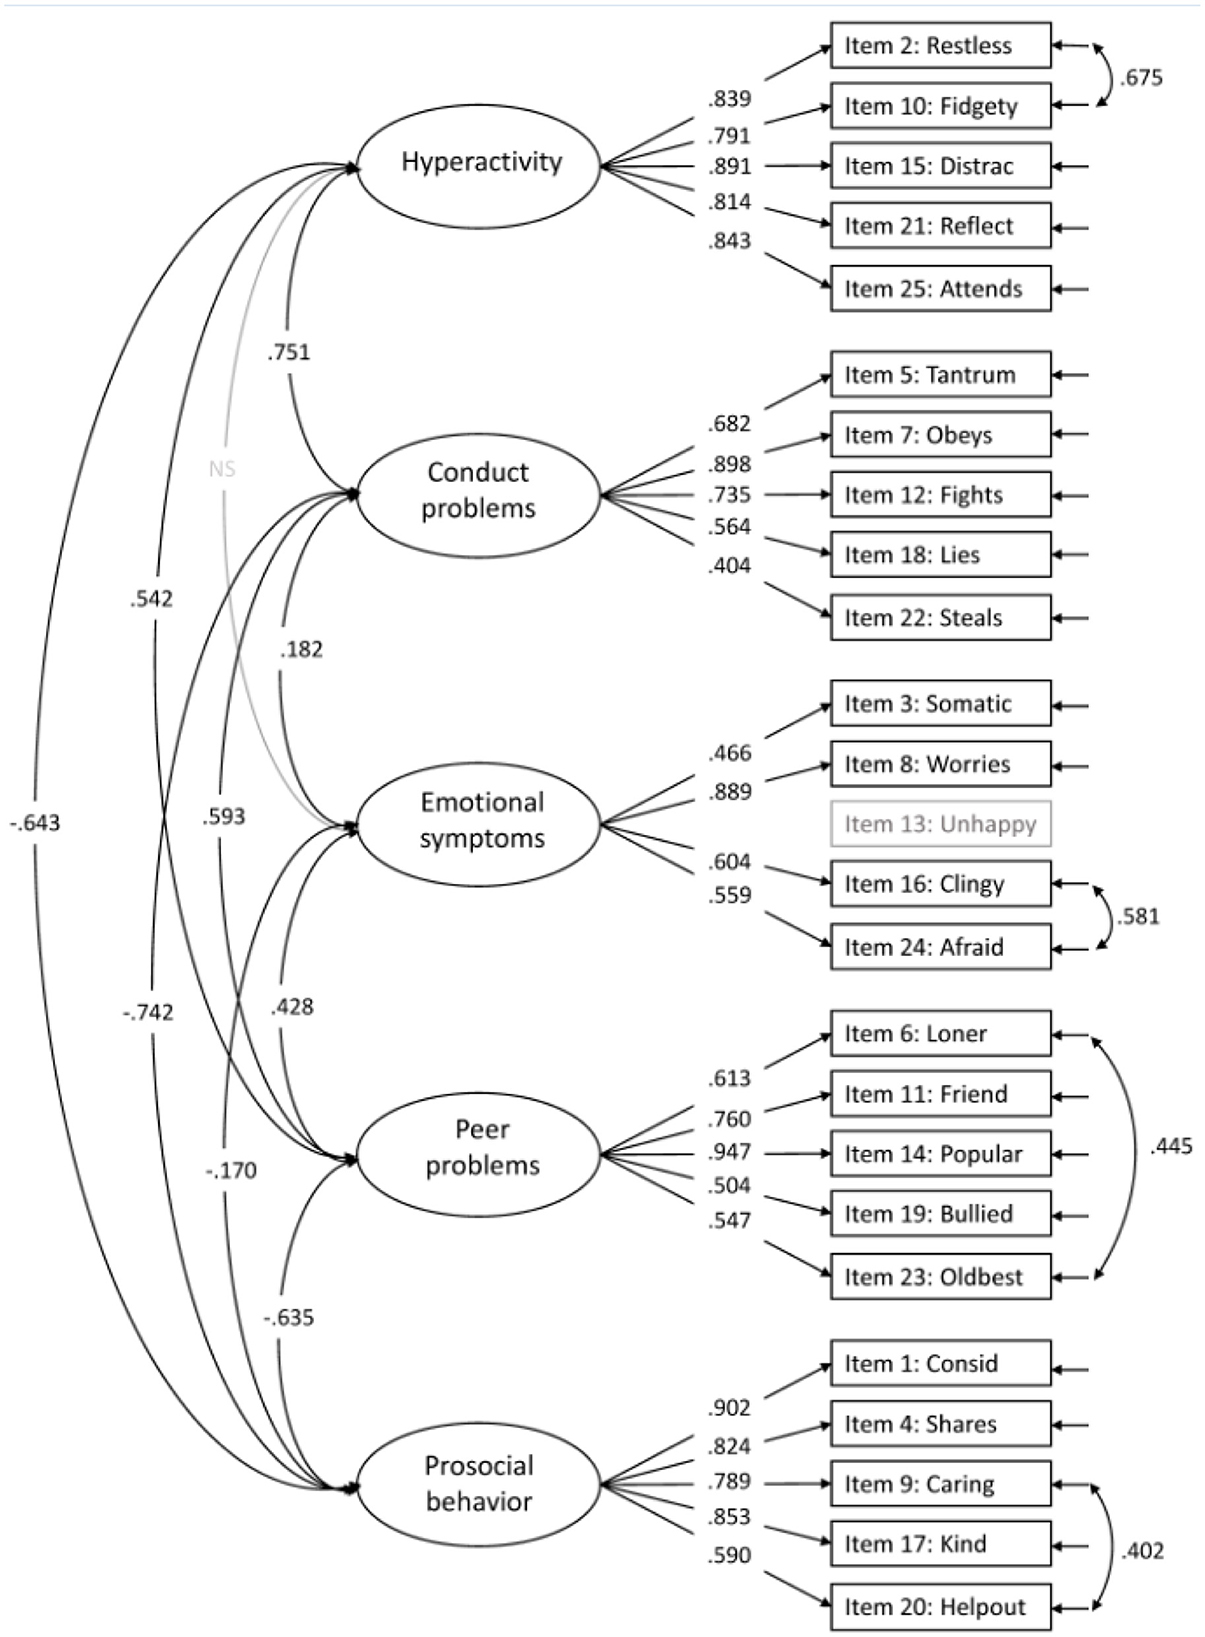
Figure 7. The accepted five-factor model (model 1). All paths are significant unless marked NS. Item 13 is not included in the CFA.
Adding a positive construal factor for all positively worded items to the five-factor structure (Model 4) increased the model fit indices (Table 2). All positive items loaded significantly on the method factor, with factor loadings ranging from 0.154–0.558 (Figure 8 for model with modifications and Supplementary Figure 2 for model without modifications).
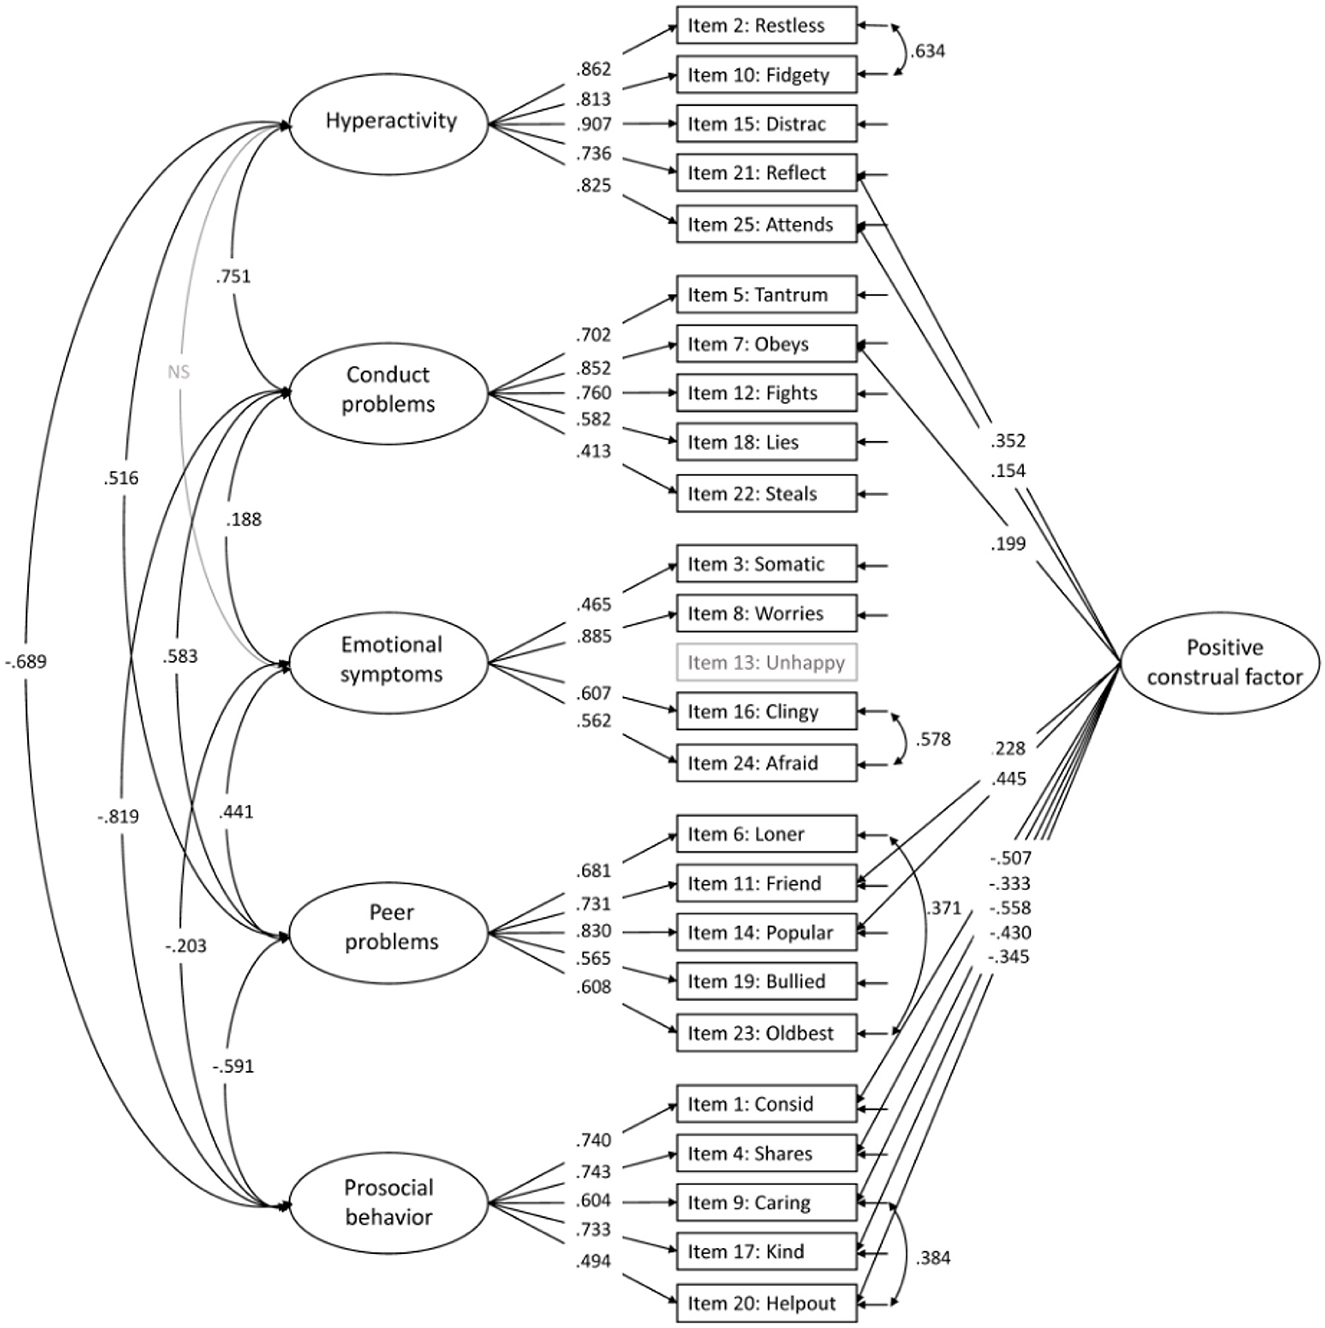
Figure 8. The accepted five-factor model with a positive construal method factor (model 4). All paths are significant unless marked NS. Item 13 is not included in the CFA.
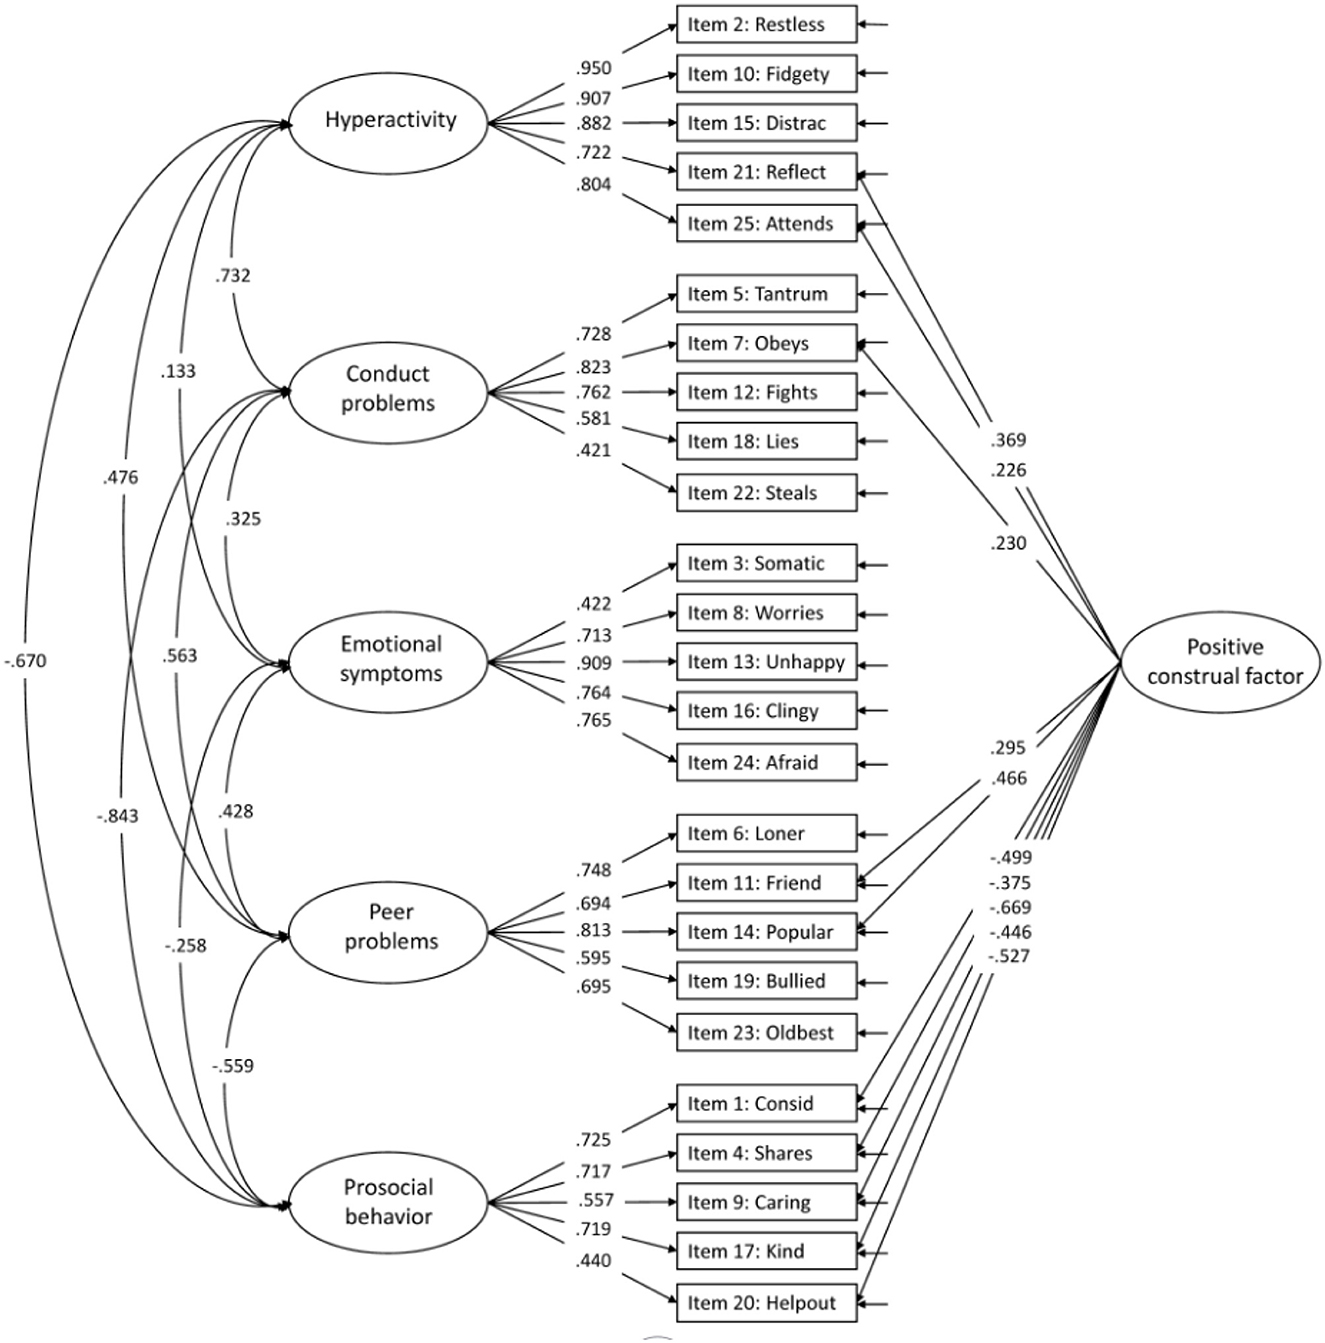
Supplementary Figure 2. Confirmatory Factor Analysis of the five-factor model with a method factor (no modifications).
The more parsimonious second-order model (Model 2), with internalizing and externalizing as second-order factors, did not have a different model fit than the original five-factor model (Table 2). However, we observed a Heywood case with a negative residual variance in the Peer problems factor and a low correlation (0.39) between the two first-order factors for the Internalizing factor, questioning the second-order structure. The same was found for the second-order model with a method factor (Model 5); it showed good model fit but a low correlation (0.43) between the first-order factors.
For the three-factor model (Model 3), model indices were poorer than for other models, and only the RMSEA was within the criteria for good model fit (Table 2). The variance for the Internalizing factor was low (0.091), questioning its role in the model. The modification indices suggested several modifications. The highest modification index was suggested for the positively worded item 14: Popular on the prosocial behavior factor, which might be explained by common variance that will be accounted for in the three-factor model including the methods factor taking positively worded items into account. Hence, we did not add this cross-loading in the three-factor model. The correlation between items 16: Clingy and 24: Afraid added in the other models was also included in the three-factor model. This modification gave better model fit (Supplementary Table 2) but resulted in insignificant variance in the Internalizing factor (0.075, p = 0.159). The internal consistency for the three factors were all above 0.86 (Internalizing; ω = 0.863, Externalizing; ω = 0.929, and Prosocial behavior; ω = 0.903).
Supplementary Table 2. Model fit indices for the confirmatory and exploratory factor analysis of the six tested models of the SDQ structure (n = 1,142) without and with modifications.
Adding a method factor to the three-factor model (Model 6) resulted in a better model fit than for Model 3; however, only the RMSEA was within the criteria for good model fit (Table 2). The model fit indices were better for the modified three-factor model with a method factor (correlation between item 16 and item 24), but still, only within the criteria of good model fit for the RMSEA (Supplementary Table 2). The variance in the internalizing factor was not significant. Factor loadings ranged between 0.285 and 0.941. However, the modification indices suggested a wide range of modifications.
Finally, we supplemented our accepted five-factor models (Models 1 and 4) from the CFA with an ESEM where all SDQ items were allowed to load on five factors. The model fit for the ESEM was good for all indices [CFI = 0.991, TLI = 0.986, RMSEA = 0.021 (0.015–0.026), and SRMR = 0.038] and similar to the model fit for the five-factors models. Cross-loadings were mainly observed for indicators within the Conduct problem and Prosocial behavior factors, which is also evident in the CFA, where the discriminant validity between these factors was low. All factor loadings for the ESEM are shown in Supplementary Table 3. Furthermore, model fit indices for all CFAs and ESEMs are shown in Supplementary Table 2.”
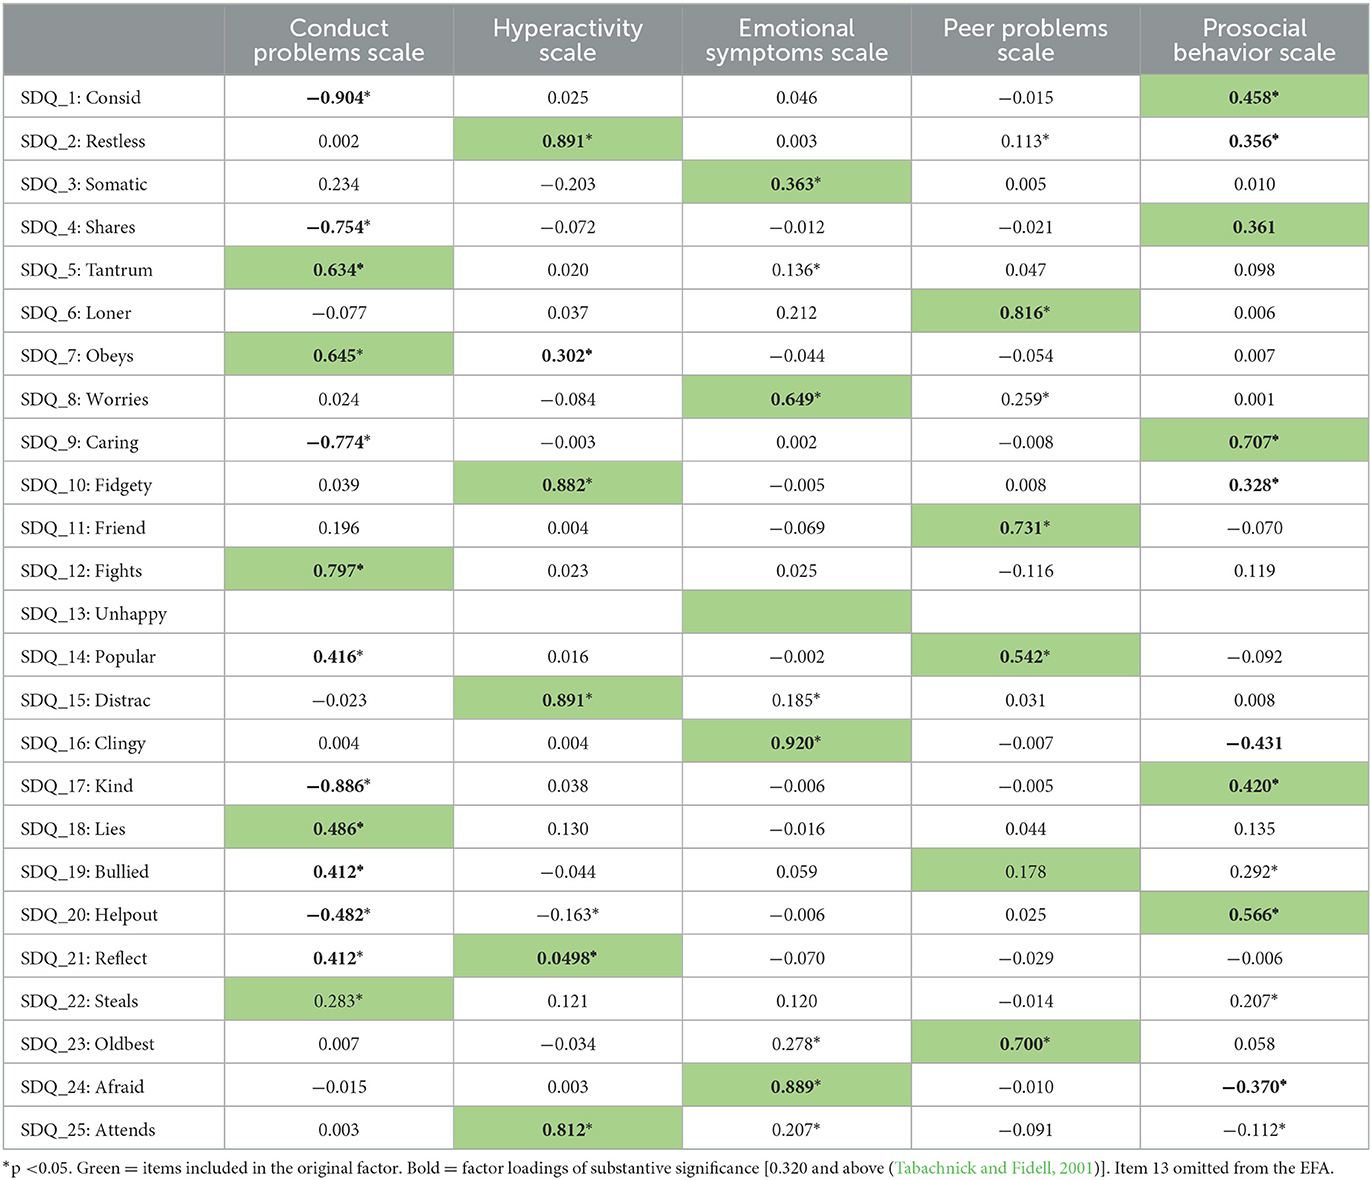
Supplementary Table 3. Exploratory Factor Analysis (EFA) of the SDQ.
A correction has been made to Results, “Measurement invariance.” The corrected paragraph is shown below.
“Since only the five-factor models (Models 1 and 4) were found to have good model fit, we only performed measurement invariance testing for these models. Both models showed scalar invariance both across sex (Table 3) and age (Table 4), showing that the structure of the SDQ did not differ between girls and boys and across the age range of 3–6 years. Age explained <2.0% of the variance in each of the original five factors (in model 1 and 4) and 9.9% of the method factor (e.g., in the five-factor model with method factor (model 4), the explained variances of age were 0.6, 0, 0.8, 0.7, 0.1, and 9.9% of the Emotional symptoms, Conduct problems, Hyperactivity, Peer problems, and Prosocial behavior factors and the method factor, respectively).”
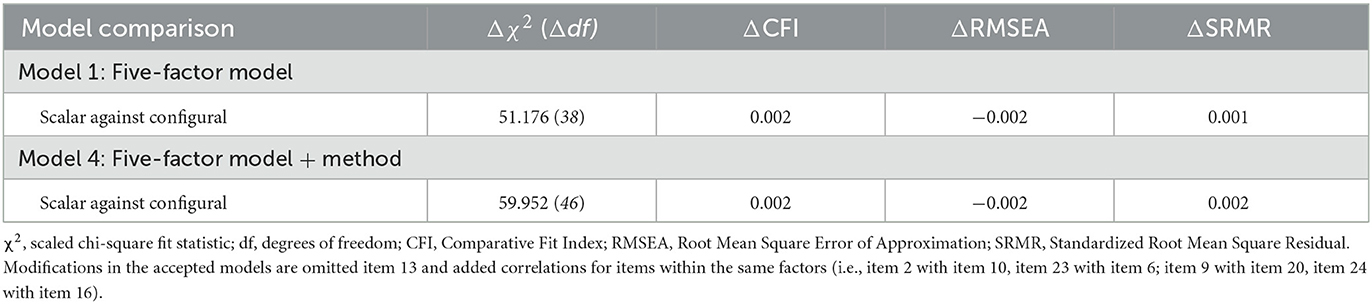
Table 3. Measurement invariance testing for the accepted models across sex.
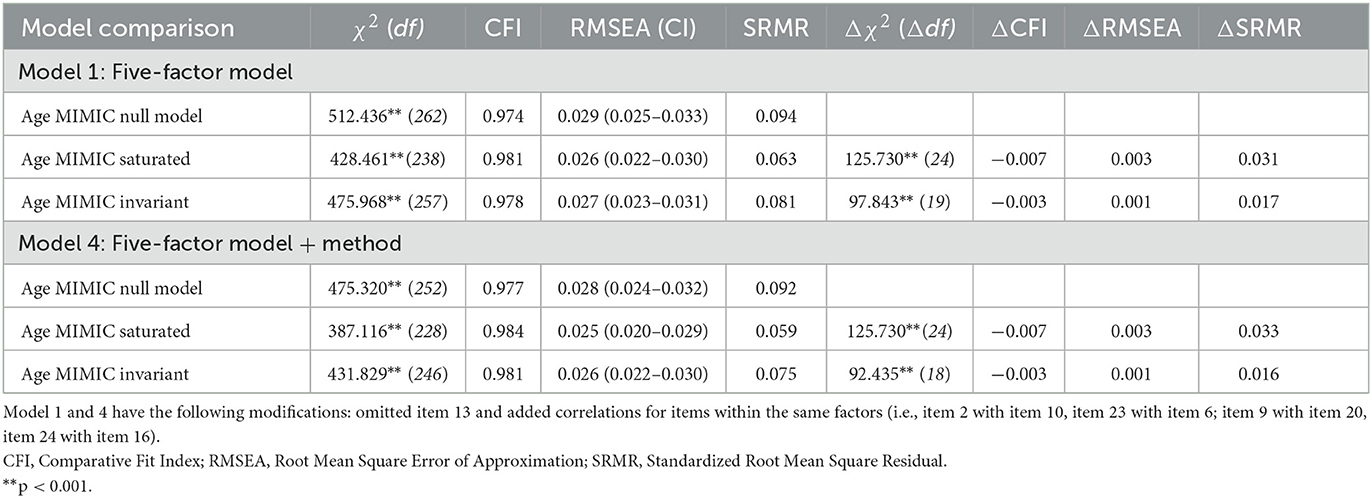
Table 4. Multiple-indicators multiple-causes (MIMIC) models for age in accepted models.
A correction has also been made to Discussion, Paragraphs 3–5. The corrected paragraphs are shown below.
“Research has suggested using broader subscales for SDQ in low-risk, epidemiological samples (Goodman et al., 2010). Goodman et al. (2010) found support for a second-order model where the second-order factor of internalizing is indicated by the first-order factors emotional symptoms and peer problems, and externalizing by conduct problems and hyperactivity, for different SDQ forms and raters in children aged 5–15 years. In their study, the correlations between the first-order factors within the internalizing and externalizing factors were between 0.66–0.71 and 0.71–0.81, respectively. Our second-order model including preschool children as rated by preschool teachers, showed very low convergent validity for the Internalizing factor, where the correlation between the Emotional symptoms and Peer problems was 0.39. Goodman et al. (2010) further examined whether the five first-order factors could be replaced by the three factors internalizing, externalizing, and prosocial behavior but found a poor fit. Neither the present study nor McAloney-Kocaman and McPherson (2017) found support for a three-factor structure in preschool samples. The present study observed a lack of significant variation among the children in the internalizing factor. Together, evidence on the second-order model and the three-factor model suggests that these broader subscales should not be used in preschool children.
The internal consistency for the factors within the five-factor model were high in the present study with all coefficient Omegas above 0.80 (range 0.81–0.94). These findings are similar to those by Ezpeleta et al. (2013) reporting Omegas 0.91 for the total score and from 0.75 to 0.93 for the five domains of SDQ (version 3–4 years) in their sample of 3-year-old preschoolers. Other studies have mainly provided internal consistency coefficients such as Cronbach's alpha, which are lower than Omega. In the systematic review by Kersten et al. (2016), Cronbach's alpha for the teacher-report form of SDQ from 26 studies was on average 0.82 for the total score and ranged between 0.49 and 0.69 for the factors.
Although the present study supported the original five-factor structure, the inclusion of a method factor for the positively worded items provided a superior fit to the data. This finding is consistent with the finding by McAloney-Kocaman and McPherson (2017) using parent-reported SDQ in Scottish children, which to our knowledge is the only previous study examining this structural model in a sample of preschoolers. In both studies, inclusion of a method factor resulted in lower factor loadings on the original factors for all positive worded items. The significant factor loadings on the method factor, which for some items were high (ranges in the present study 0.15–0.56 and in the Scottish study 0.32–0.51) might indicate that the positive worded items reflect method variance that needs to be accounted for in a separate positive construal method factor. Several previous studies have highlighted the noise associated with the positively worded items, but they all appear to agree that this noise is tolerable to gain acceptance for the use of the questionnaire in general healthy populations (Van Roy et al., 2008; McAloney-Kocaman and McPherson, 2017). In other words, although some of the positively worded items are less relevant for their factors, they should better be included to gain acceptability from the respondents.”
In the published article, there were also errors in Tables 2–4, and Figures 7, 8, Supplementary Tables 1–3 and Supplementary Figures 1, 2, in relation to the issues outlined above. The corrected tables and figures are shown below.
The authors apologize for these errors and state that they do not change the scientific conclusions of the article in any way. The original article and Supplementary material have been updated.
All claims expressed in this article are solely those of the authors and do not necessarily represent those of their affiliated organizations, or those of the publisher, the editors and the reviewers. Any product that may be evaluated in this article, or claim that may be made by its manufacturer, is not guaranteed or endorsed by the publisher.
Ezpeleta, L., Granero, R., de la Osa, N., Penelo, E., and Domenech, J. M. (2013). Psychometric properties of the strengths and difficulties questionnaire (3-4) in 3-year-old preschoolers. Compr. Psychiatry 54, 282–291. doi: 10.1016/j.comppsych.2012.07.009
Goodman, A., Lamping, D. L., and Ploubidis, G. B. (2010). When to use broader internalising and externalising subscales instead of the hypothesised five subscales on the strengths and difficulties questionnaire (SDQ): Data from British parents, teachers and children. J. Abnorm. Child Psychol. 38, 1179–1191. doi: 10.1007/s10802-010-9434-x
Goodman, R. (1997). The strengths and difficulties questionnaire: A research note. J. Child Psychol. Psychiatry 38, 581–586.
Kersten, P., Czuba, K., McPherson, K., Dudley, M., Elder, H., Tauroa, R., et al. (2016). A systematic review of evidence for the psychometric properties of the strengths and difficulties questionnaire. Int. J. Behav. Dev. 40, 64–75. doi: 10.1177/0165025415570647
McAloney-Kocaman, K., and McPherson, K. (2017). Factor structure and reliability of the parent-informant strengths and difficulties questionnaire in a Scottish preschool sample. Early Educ. Dev. 28, 368–376. doi: 10.1080/10409289.2017.1228367
Tabachnick, B. G., and Fidell, L. S. (2001). Using multivariate statistics, 4th Edn. Boston: Allyn and Bacon.
Keywords: mental health, preschool children, confirmatory factor analysis, psychometrics, SDQ
Citation: Aadland KN, Lervåg A, Ommundsen Y and Aadland E (2023) Corrigendum: Structural validity of the Norwegian version of the Strengths and Difficulties Questionnaire in children aged 3–6 years. Front. Psychol. 14:1178961. doi: 10.3389/fpsyg.2023.1178961
Received: 03 March 2023; Accepted: 10 April 2023;
Published: 15 May 2023.
Edited and reviewed by: Antonio Zuffiano, Sapienza University of Rome, Italy
Copyright © 2023 Aadland, Lervåg, Ommundsen and Aadland. This is an open-access article distributed under the terms of the Creative Commons Attribution License (CC BY). The use, distribution or reproduction in other forums is permitted, provided the original author(s) and the copyright owner(s) are credited and that the original publication in this journal is cited, in accordance with accepted academic practice. No use, distribution or reproduction is permitted which does not comply with these terms.
*Correspondence: Katrine Nyvoll Aadland, a2F0cmluZWFAaHZsLm5v
Disclaimer: All claims expressed in this article are solely those of the authors and do not necessarily represent those of their affiliated organizations, or those of the publisher, the editors and the reviewers. Any product that may be evaluated in this article or claim that may be made by its manufacturer is not guaranteed or endorsed by the publisher.
Research integrity at Frontiers
Learn more about the work of our research integrity team to safeguard the quality of each article we publish.