 Antonio Malvaso1,2,3
 Weixi Kang4*
- 1Neuroimaging Research Unit, Division of Neuroscience, IRCCS San Raffaele Scientific Institute, Milan, Italy
- 2Neurology Unit, IRCCS San Raffaele Scientific Institute, Milan, Italy
- 3School of Medicine and Surgery, Vita-Salute San Raffaele University, Milan, Italy
- 4Computational, Cognitive and Clinical Neuroimaging Laboratory, Division of Brain Sciences, Imperial College London, London, United Kingdom
A substantial amount of research has been conducted using a variety of methodological approaches to determine what influences life satisfaction. The bottom-up theory considers overall life satisfaction as a function of various areas of life satisfaction, whereas the top-down theory considers the areas of life satisfaction as a function of dispositional factors such as personality. We examined these models in a large-scale United Kingdom survey. Consistent with other studies, we found that both the bottom-up and top-down models of life satisfaction are supported in the United Kingdom by demonstrating that demographics, areas of life satsifaction, and personality traits can explain a significant portion of variances in overall areas of life satisfaction. We propose that future studies in life satisfaction research should consider the integrated account of life satisfaction rather than a unitary bottom-up or top-down perspective.
Introduction
The term “life satisfaction” relates to how much a person likes their life (Diener et al., 1998). During the last few decades, many studies investigated that can predict life satisfaction. Life satisfaction is a cognitive and global assessment of one’s overall quality of life. In particular, there are numerous variables that influence life satisfaction, including sociodemographic factors like health, job, household, family, age, gender, psychological characteristics, lifestyle, leisure activity involvement, and leisure enjoyment (Rojas, 2006; Agyar, 2013; Magee et al., 2013; Moksnes and Espnes, 2013; Loewe et al., 2014; Newman et al., 2014; Kuykendall et al., 2015).
Two theories in life satisfaction research have been discussed intensely: the bottom-up and top-down theory (Diener, 1984; Headey et al., 1993; Erdogan et al., 2012; Loewe et al., 2014). The bottom-up theory looks at overall satisfaction as a function of several aspects of life satisfaction (Erdogan et al., 2012). Individuals’ responses to questions on their life satisfaction, according to the bottom-up perspective, are a complex function of satisfaction with many life domains. Life satisfaction is not a straightforward average of domain satisfaction as people assess each domain differently. While some people consider leisure to be the most essential aspect of their lives, others prioritize job or health (Diener et al., 2003; Newman et al., 2014). Satisfaction with domains that are consistent with one’s values has been demonstrated to be more essential for one’s overall satisfaction (Oishi et al., 1999). Those who place a high value on success and those who place a high value on relationships, for example, will place a different emphasis on job and family satisfaction in their life satisfaction assessments. However, when the influences of personality and nonwork satisfaction are taken into account, job satisfaction does not predict life satisfaction (e.g., Rode, 2004). Furthermore, discontent in one domain frequently leads to a reevaluation of that domain’s relevance (Wu et al., 2009). For someone suffering from health issues, this could include a greater emphasis on family contentment.
The top-down theory views overall life satisfaction or specific areas of life satisfaction as a result of personality and other stable characteristics (Diener, 1984; Loewe et al., 2014). In this sense, life satisfaction is determined by personality disposition (which manifests in relatively stable cognitive and affective qualities, resulting in an individual displaying stable behavior—for a summary, see Montag and Panksepp, 2017). Steel et al. (2008) conducted a meta-analysis of 249 studies and found that the Big Five explained 18% of total variances in life satisfaction. Neuroticism is the most related (β = −0.30) and the rest less related (Extraversion, β = 0.17; Conscientiousness, β = 0.07; Openness, β = −0.04; Agreeableness, β = 0.03). A meta-analysis of 137 studies conducted by DeNeve and Cooper (1998) found that characteristics dealing with emotional expression (such as emotional stability) and traits relating to how life events are understood (such as defensiveness) were the strongest correlations of life satisfaction and overall life satisfaction. Another meta-analysis done by Heller et al. (2004) showed that employment and marital satisfaction mediated the effects of personality on life satisfaction. In other words, top-down factors may influence life satisfaction through shaping views of life domains.
According to Erdogan et al. (2012), top-down effects (e.g., personality) might influence the perception of many aspects of life satisfaction, hence affecting overall life satisfaction. They also advised that personality be used as a distal predictor rather than a control variable in models of life satisfaction (Erdogan et al., 2012). However, in models of life satisfaction, characteristics such as age, gender, and education should be adjusted for (Diener, 1984; Gutiérrez et al., 2005). Several research suggested that these variables may influence the relationship between personality and/or specific life satisfaction characteristics and overall satisfaction, although findings are not always consistent (Diener, 1984; Magee et al., 2013; Moksnes and Espnes, 2013; Ulloa et al., 2013). Furthermore, there has been research into the relationship between personality and overall life satisfaction, the results have been mixed (Costa and McCrae, 1980; DeNeve and Cooper, 1998; Schimmack et al., 2004; Asthana, 2011; Baudin et al., 2011; Gale et al., 2013; Hosseinkhanzadeh and Taher, 2013; Kjell et al., 2013). Personality psychologists generally believe that five major dimensions may appropriately organize a large range of possible personality characteristics. Extraversion, Agreeableness, Conscientiousness, Neuroticism, and Openness are the five “super traits” that comprise the Big Five (John and Srivastava, 1999; Rammstedt and John, 2007; Asthana, 2011). Neuroticism and Extraversion are often the strongest predictors of life satisfaction in research investigating the link between personality traits and life satisfaction (Diener and Lucas, 1999; Lachmann et al., 2017). Lachmann et al. (2017) used demographic variables, personality variables, and areas of life satisfaction variables to build a stepwise multiple regression model to predict overall life satisfaction. They discovered that demographic and personality variables could only explain 0.1%–1.8% of the variance in overall life satisfaction (Lachmann et al., 2017). However, when personality variables and various areas of life satisfaction variables were entered in a hierarchical regression model in separate blocks, the explained variance (R2) of all personality variables did increase to a maximum of R2 = 0.098.
Additionally, compensation, spillover, and segmentation effects are mechanisms that help explain the complex link between areas of life satisfaction and overall life satisfaction (Rojas, 2006). A compensation effect proposes a negative relationship between areas of life satisfaction and/or overall life satisfaction, whereas a spillover effect suggests a positive relationship (Erdogan et al., 2012). The phrase segmentation is used when modifications in one area have no effect on other areas and/or total life satisfaction (Erdogan et al., 2012). Rojas (2006) discovered more details on the nature of the relationships between different aspects of life satisfaction and overall life satisfaction. In this case, dispositional elements would determine how satisfied a person is, providing an inference on their level of contentment based on their personality structure. For example, Extraversion or Neuroticism could provide researchers with insight about how satisfied a person should be (Diener, 1984; DeNeve and Cooper, 1998; Heller et al., 2004). In fact, although there are mostly positive relationships between Extraversion and life satisfaction, the link between Neuroticism and life satisfaction is almost always negative (Diener, 1984). Several meta-analyses have also confirmed these kinds of connections (DeNeve and Cooper, 1998; Heller et al., 2004; Steel et al., 2008).
Taken together, these findings show that neither the bottom-up nor a top-down theory can adequately explain life satisfaction on their own. Instead, an integrated view that incorporates both models might be the most effective. Despite the fact that both theories are sometimes represented as opposing models (Loewe et al., 2014), there have been various attempts to combine the bottom-up and top-down theories in a single integrated model (Feist et al., 1995; Heller et al., 2004; Newman et al., 2014; Busseri, 2015; Lachmann et al., 2017). In particular, they found that both personality and areas of life satisfaction explained some portion of total variances in overall life satisfaction.
Overall satisfaction can be defined in general terms to some extent, but it must be understood in the context of each culture. Furthermore, Tov and Diener (2009) demonstrated that while there are pancultural experiences of general satisfaction that can be compared across cultures, there are also culture-specific patterns that distinguish cultures in their satisfaction experiences. Moreover, some research studies have investigated cross-cultural differences in life satisfaction (Diener and Suh, 2000; Park et al., 2004; Diener and Diener, 2009). In particular, various cultures interpreted life satisfaction differently: for example, individuals living in an individualistic society are more concerned with their personal aims, interests, and feelings than with the well-being of a community (e.g., friends or family). On the other hand, harmonious connections with other people are valued more than personal aims in more collectivistic civilizations. In collectivistic societies, family satisfaction may be rated higher than in individualistic cultures (Park et al., 2004). Furthermore, disparities in life satisfaction levels between nations have been discovered Loewe et al. (2014). People living in individualistic cultures reported higher levels of life satisfaction than those in collectivistic cultures. As suggested by Loewe et al. (2014), this could be explained by the fact that in individualistic cultures, the personal, goal-oriented perspective contributes to more self-referred attribution of failure and success, perhaps leading to better overall life satisfaction when compared to persons in collectivistic cultures. However, few studies have used such a large sample from the United Kingdom to investigate the top-down and bottom-up theories. Hence, we investigated personality and areas of life satisfaction in the United Kingdom.
The aim of our study is to investigate if bottom-up or top-down theories, or an integrated account of life satisfaction are supported in the United Kingdom. If bottom-up theories are supported, then we would expect that demographics and different areas of satisfaction can significantly predict overall satisfaction. On the other hand, if dimensions of personality are significant predictors of overall satisfaction, then the top-down theories would be valid. We would expect to see both personality and areas of life satisfaction explain some portion of the overall life satisfaction variances if an integrated account of life satisfaction is supported.
Materials and methods
Data
We used data from the British Household Panel Study (BHPS; University of Essex, 2018), which has been collecting data on representative samples of individual households in the United Kingdom since 1991. Wave 15 data are collected from September 2005 to May 2006. Personality traits including Neuroticism (α = 0.68), Openness (α = 0.66), Agreeableness (α = 0.54), Conscientiousness (α = 0.53), Extraversion (α = 0.59) were measured using the 15-item version of the Big Five Inventory with a Likert scale ranging from 1 (“disagree strongly”) to 5 (“agree strongly”). Participants responded to questions that asked about their overall satisfaction and satisfaction with health, income of household, house/flat, spouse/partner, job, social life, amount of leisure time, and use of leisure time with a Liker scale ranging from 1 (“Not satisfied at all”) to 7 (“Completely satisfied”). According to Lucas and Donnelan (2007), the reliability of this single-item measurement of overall life satisfaction is at least 0.67. Participants also completed questionnaires asking them about their demographics including: age, sex, marital status, highest educational qualification, political party supported, and employment status. We excluded participants who were younger than 16 or who are older than 99 and who had missing fields in variables that we are interested in. Hence, 5,928 data points survived from the original 15,617 participants in the study. Descriptive statistics for these variables is found in Table 1.
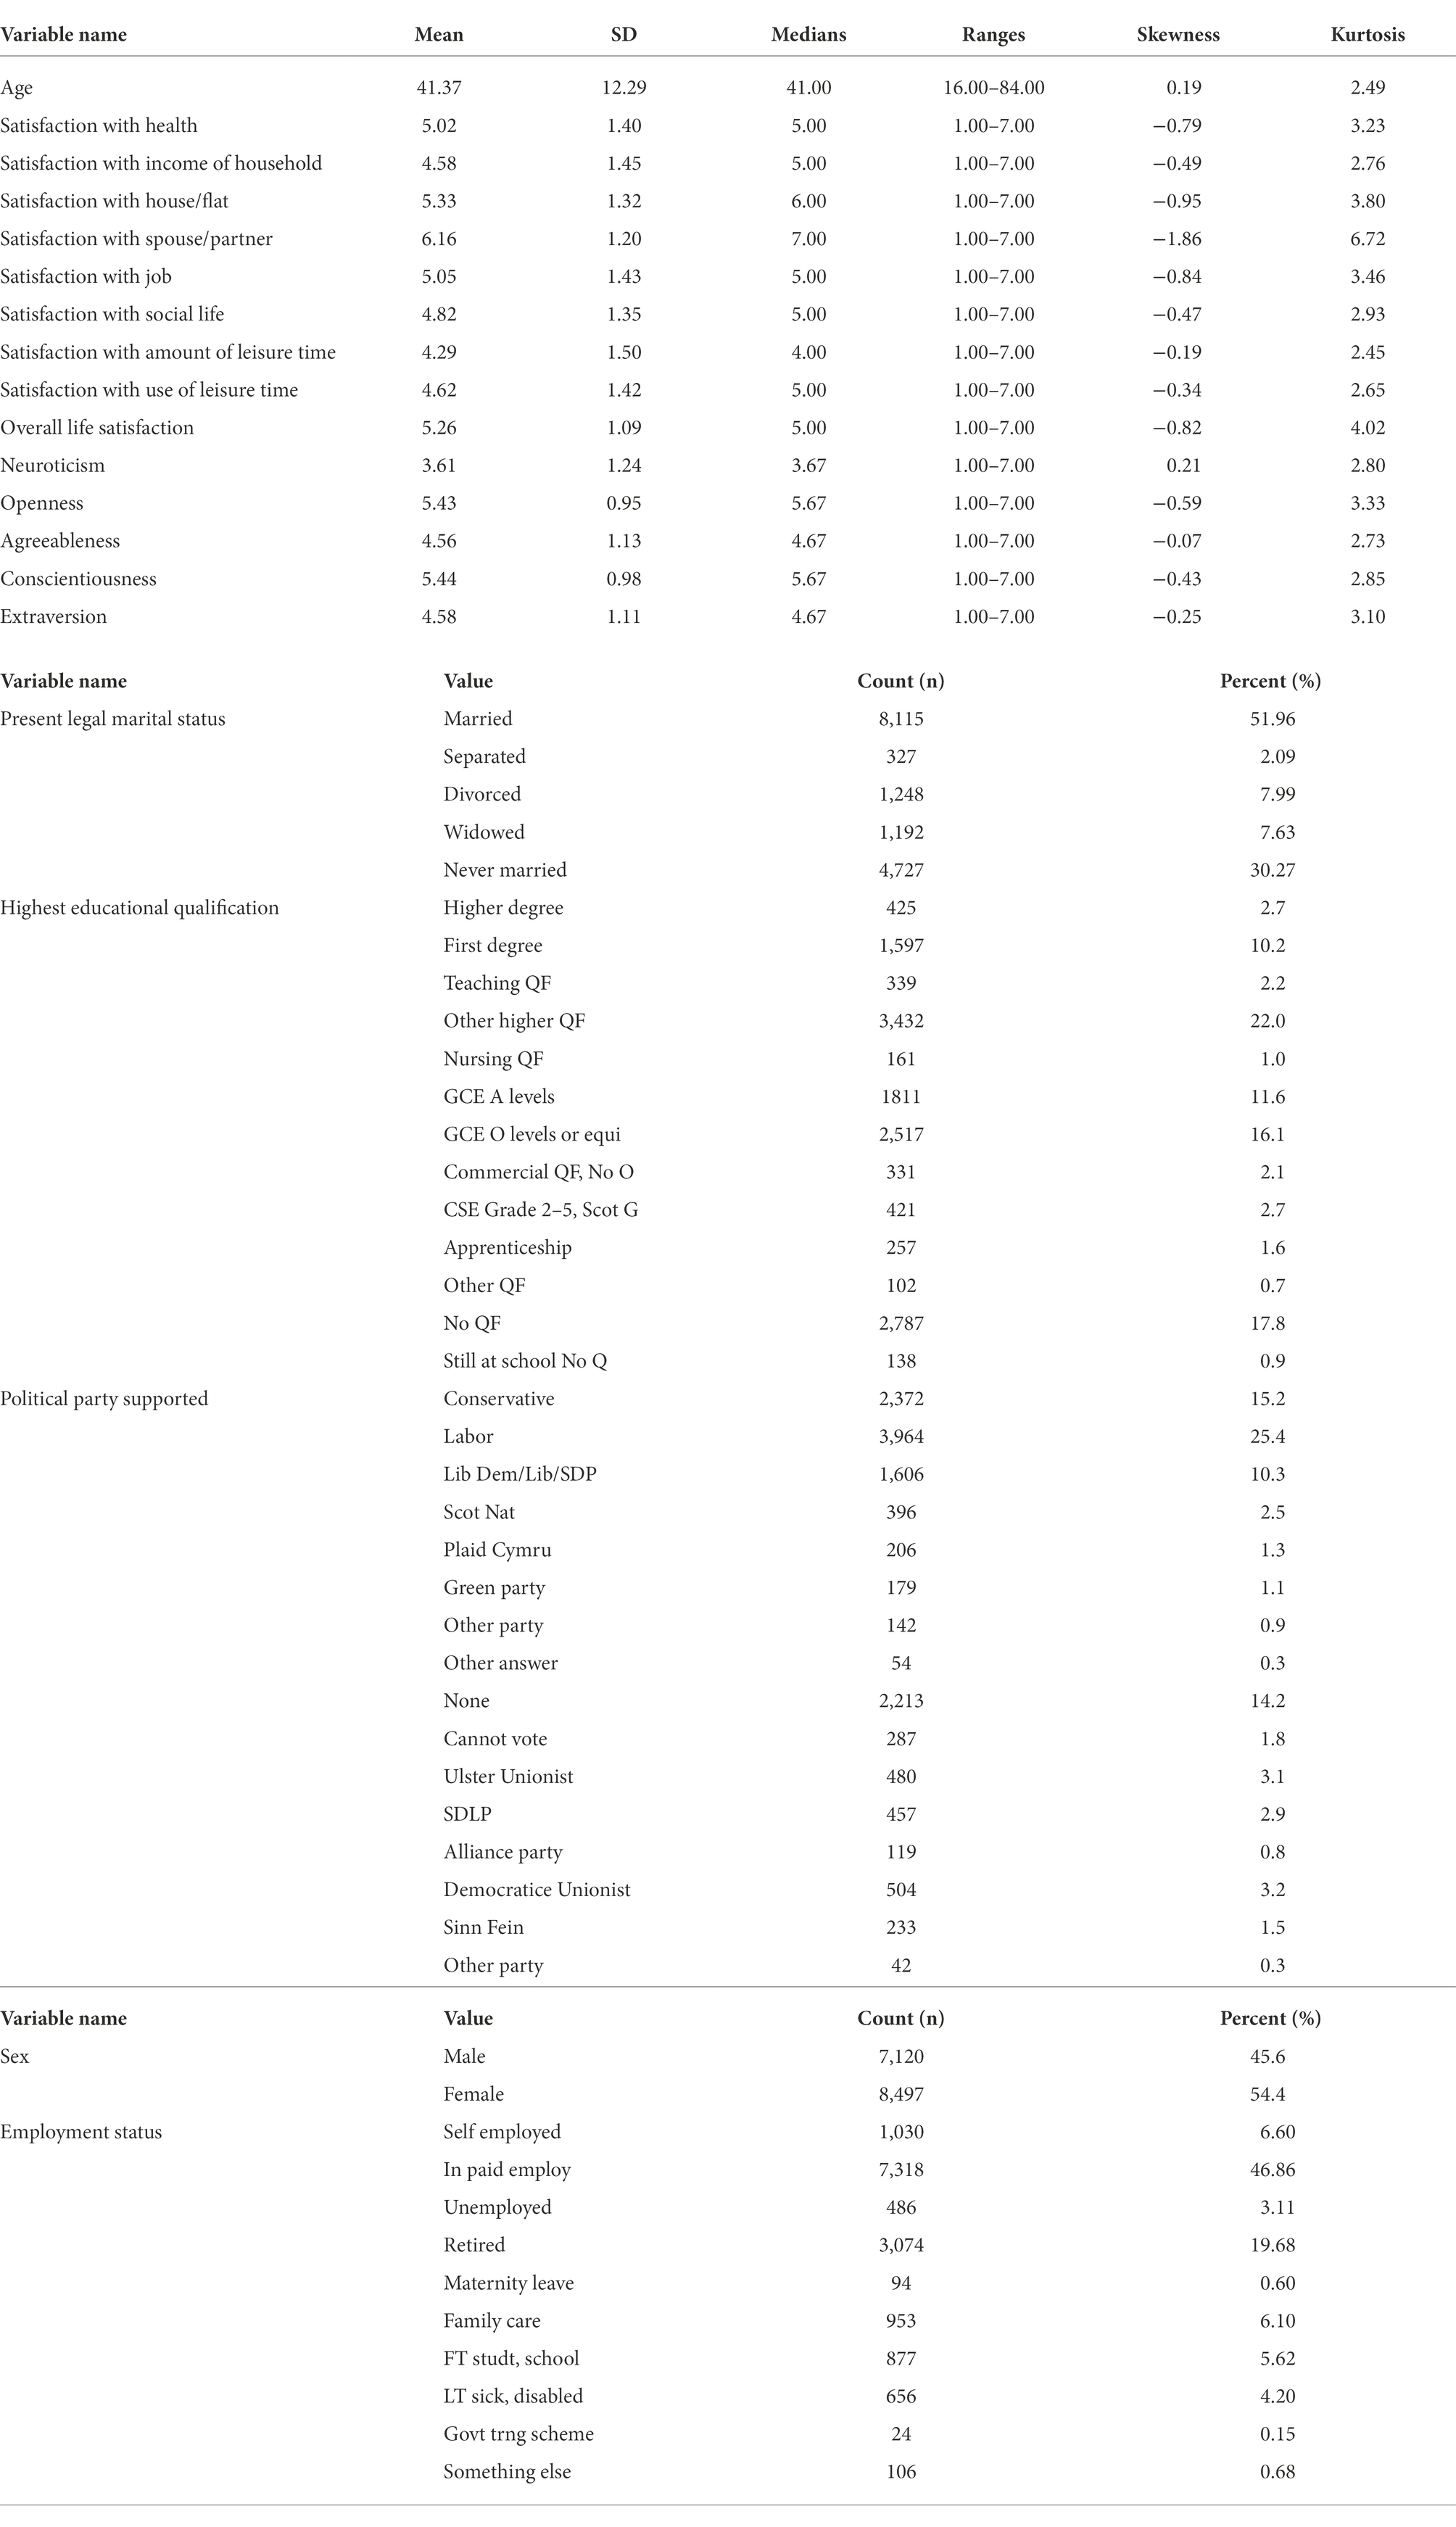
Table 1. Descriptive statistics for continuous and categorical variables.
Analysis
A factorial ANOVA was used by taking age, sex, marital status, highest educational qualification, political party supported, and employment status as independent variables and overall satisfaction as the dependent variable. The residuals remained after factoring out age, sex, present legal marital status, highest educational qualification, political party supported, and employment status were kept for further analysis. To test the bottom-up theory, a multiple linear regression was used by taking areas of satisfaction including health, income of household, house/flat, spouse/partner, job, social life, amount of leisure time, and use of leisure time as predictors and the overall satisfaction after factoring out demographics as the predicted variable. To test the top-down hypothesis, we first reversed scores of item optrt5a1 (is sometimes rude to others), optrt5c2 (tends to be lazy), optrt5e3 (is reserved) and optrt5n3 (is relaxed, handles stress well) as these questions were asked in the opposite direction of the corresponding trait. Then we added the sub-items up to get a summary score of each trait. Next, another multiple linear regression was used by taking personality traits including Neuroticism, Openness, Agreeableness, Conscientiousness and Extraversion as predictors and the overall satisfaction as the predicted variable, after factoring out demographics. Finally, we entered demographics, areas of life satisfaction, and personality into a single generalized linear model with life satisfaction as the predicted variable.
Results
Demographics and various overall life satisfaction
We found a significant main effect of sex (F(1,5,905) = 6.25, p < 0.05) and present legal marital status (F(1,5,905) = 3.69, p = 0.05). However, the main effect of the age, highest educational qualification, political party supported, and employment status were not significant on the overall life satisfaction (Table 2).
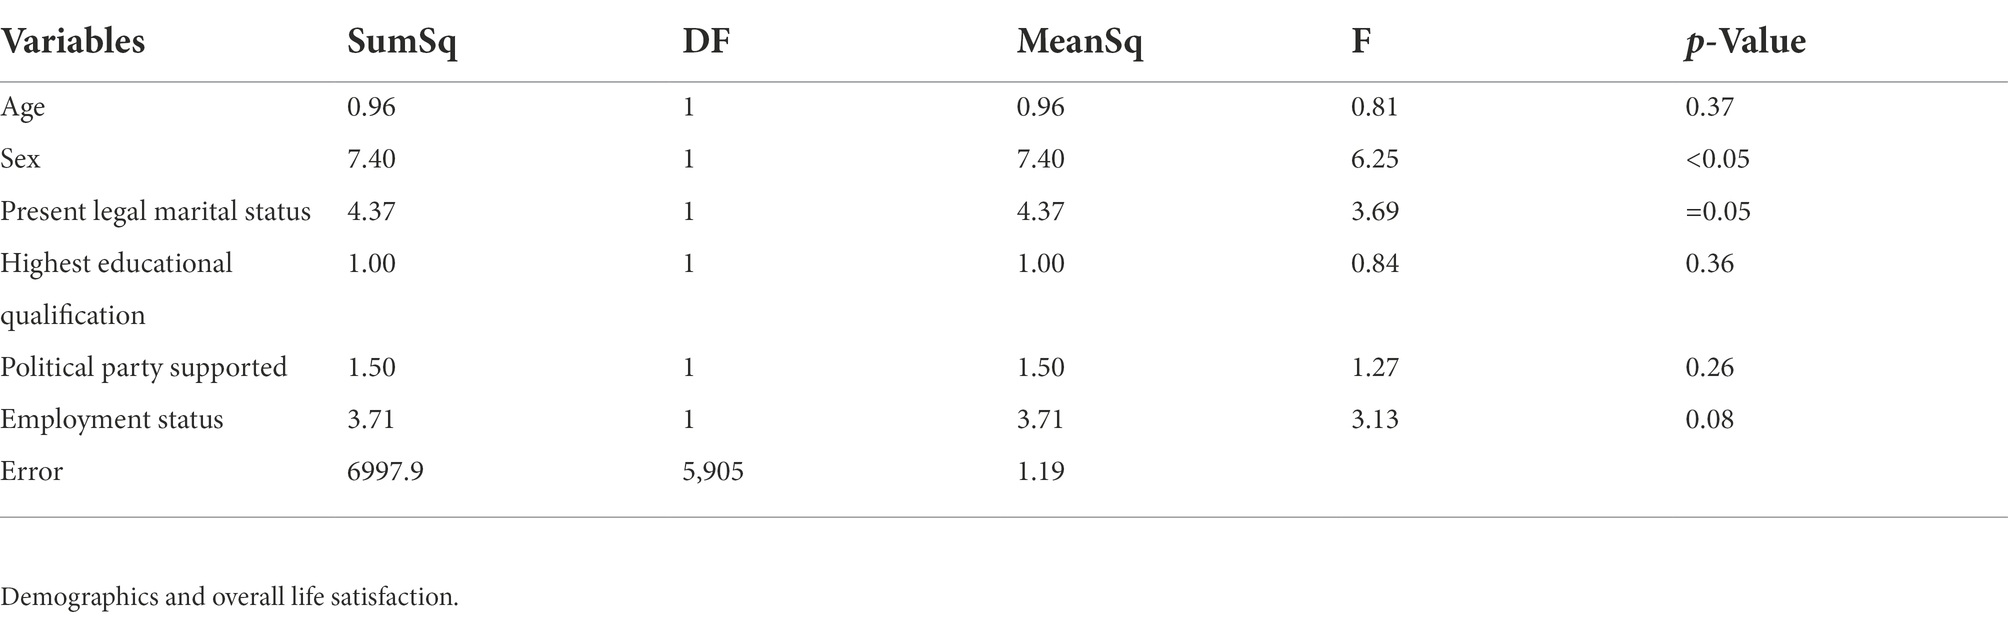
Table 2. The ANOVA results with the sum of squares, degrees of freedom, mean square, F-stat values, and values of p for demographics.
Areas of satisfaction and overall satisfaction residuals after factoring out demographics
The independent variables explained 51.4% (R2 = 0.514) of the overall satisfaction score. The variable with the highest impact on the overall satisfaction score was satisfaction with spouse/partner (β = 0.18; t = 22.17, p < 0.001, 95% C.I. [0.17, 0.20]), followed by satisfaction with social life (β = 0.13; t = 13.30, p < 0.001, 95% C.I. [0.11, 0.15]), satisfaction with use of leisure time (β = 0.12; t = 12.60, p < 0.001, 95% C.I. [0.10, 0.14]), satisfaction with health (β = 0.11; t = 14.93, p < 0.001, 95% C.I. [0.09, 0.12]), satisfaction with job (β = 0.10; t = 14.45, p < 0.001, 95% C.I. [0.09, 0.12]), satisfaction with income of household (β = 0.07; t = 9.19, p < 0.001, 95% C.I. [0.05, 0.08]), satisfaction with house/flat (β = 0.06; t = 7.24, p < 0.001, 95% C.I. [0.04, 0.07]), and satisfaction with amount of leisure time (β = 0.04; t = 4.55, p < 0.001, 95% C.I. [0.02, 0.05]; Table 3).
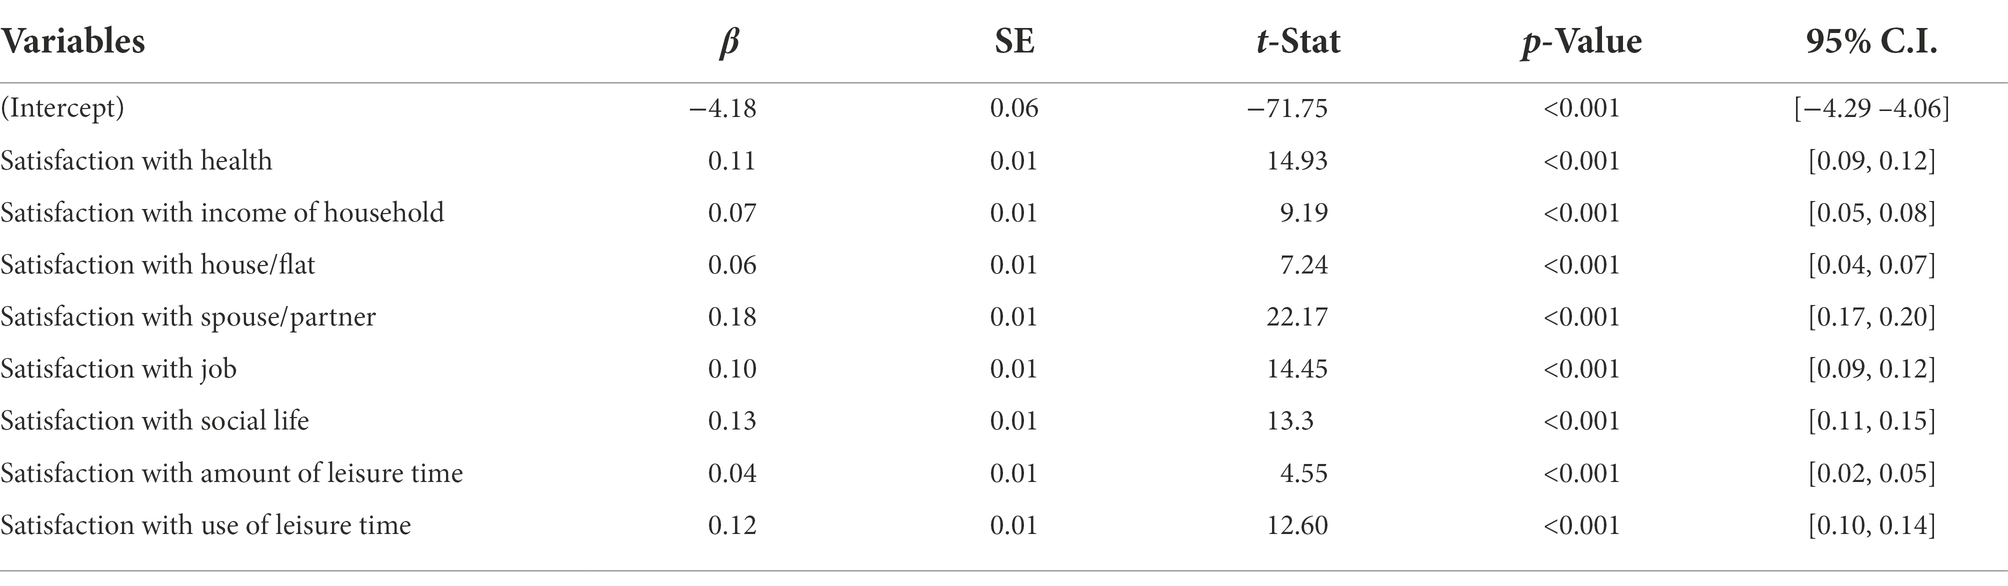
Table 3. Multiple regression analysis results for areas of life satisfaction and overall satisfaction after factoring out demographics.
Personality and overall satisfaction residuals after factoring out demographics
The independent variables explained 14.8% (R2 = 0.148) variances of the overall satisfaction score. The variable with the highest impact on the overall satisfaction score was Neuroticism (β = − 0.19; t = −19.32, p < 0.001, 95% C.I. [−0.21, −0.17]), followed by Conscientiousness (β = 0.14; t = 10.65, p < 0.001, 95% C.I. [0.12, 0.17]), Openness (β = 0.15; t = 10.56, p < 0.001, 95% C.I. [0.12, 0.17]), Agreeableness (β = 0.06; t = 4.92, p < 0.001, 95% C.I. [0.03, 0.08]), and (β = 0.04; t = 3.30, p < 0.001, 95% C.I. [0.02, 0.06]; Table 4).
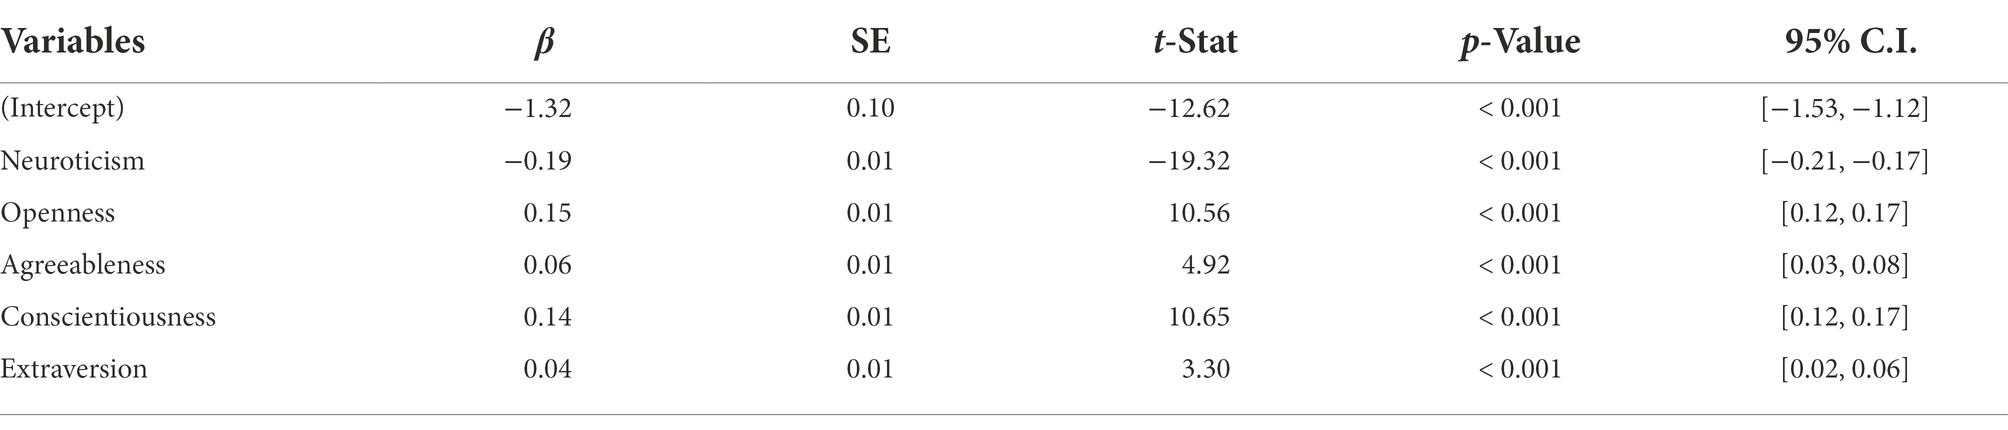
Table 4. Multiple regression analysis results for personality traits and overall satisfaction after factoring out demographics.
An integrated account of life satisfaction with demographics, areas of life satisfaction, and personality as predictors
Demographics, areas of life satisfaction, and personality traits explained 53% (R2 = 0.53) variances of total life satisfaction (Table 5). The variable with the highest impact on the overall satisfaction score was satisfaction with spouse/partner (β = 0.19; t = 21.39, p < 0.001, 95% C.I. [0.18, 0.21]), followed by satisfaction with social life (β = 0.13; t = 12.17, p < 0.001, 95% C.I. [0.11, 0.15]), satisfaction with use of leisure time (β = 0.13; t = 12.06, p < 0.001, 95% C.I. [0.10, 0.15]), satisfaction with job (β = 0.11; t = 13.32, p < 0.001, 95% C.I. [0.09, 0.12]), satisfaction with health (β = 0.10; t = 12.30, p < 0.001, 95% C.I. [0.08, 0.11]), satisfaction with income of household (β = 0.07; t = 9.16, p < 0.001, 95% C.I. [0.06, 0.09]), satisfaction with house/flat (β = 0.06; t = 7.14, p < 0.001, 95% C.I. [0.04, 0.08]), satisfaction with amount of leisure time (β = 0.04; t = 4.88, p < 0.001, and 95% C.I. [0.03, 0.06]). Regarding personality traits in this integrative mode, the variable with the highest impact on the overall satisfaction score was Neuroticism (β = −0.08; t = −9.39, p < 0.001, 95% C.I. [−0.10, −0.07]), followed by Openness (β = 0.04; t = 3.47, p < 0.001, 95% C.I. [0.02, 0.07]) and Conscientiousness (β = 0.03; t = 12.17, p < 0.001, 95% C.I. [0.01, 0.06]). However, Agreeableness (β = 0.00; t = 0.43, p = 0.66, 95% C.I. [−0.01, 0.02]) and Extraversion (β = 0.01; t = 0.75, p = 0.45, 95% C.I. [−0.01, 0.03]) were not significant.
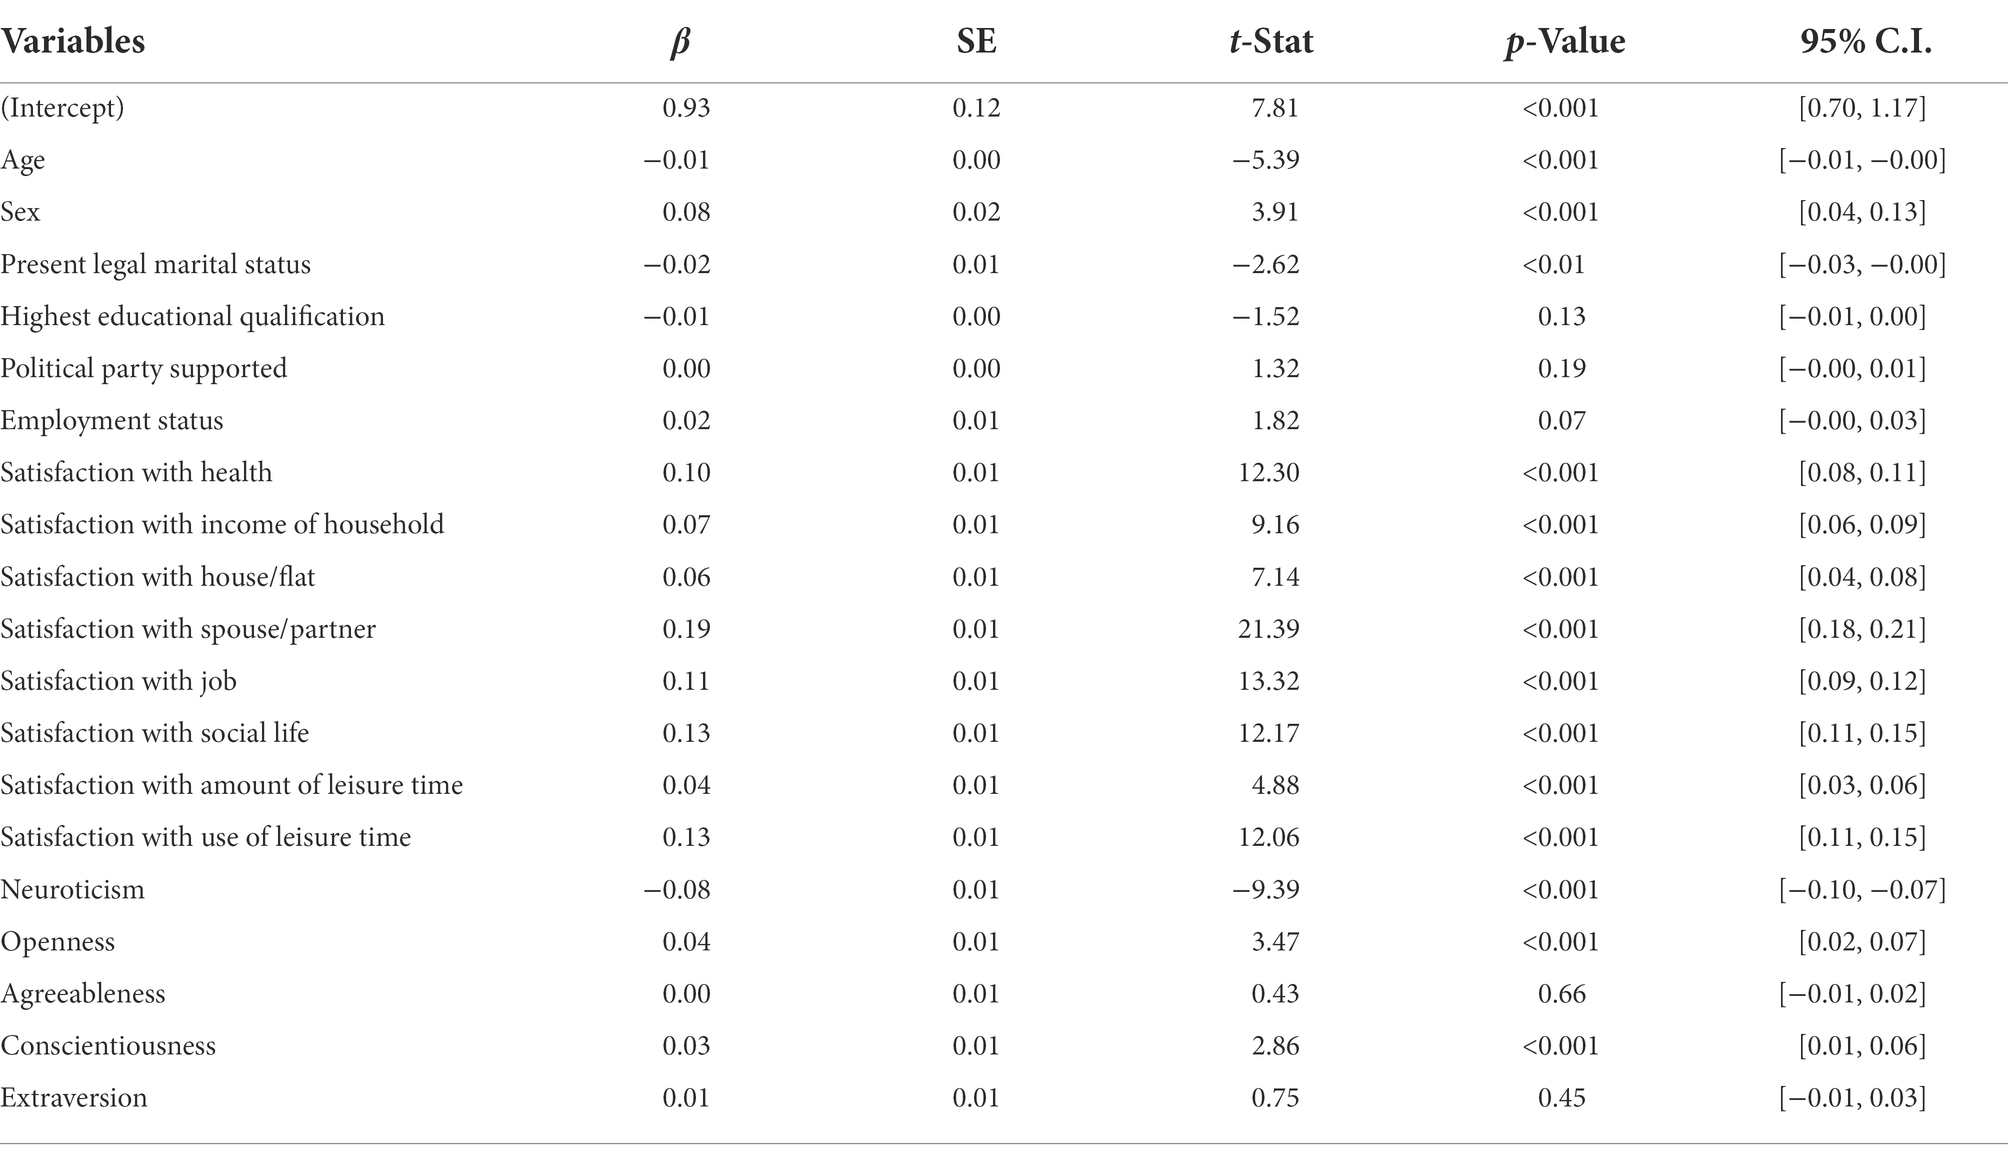
Table 5. Multiple regression analysis results with overall satisfaction as the predicted variable and demographics, areas of life satisfaction and personality traits as predictors.
Correlations between areas of life satisfaction, personality, and overall life satisfaction
Satisfaction with income of household (r = 0.42, p < 0.001, 95% C.I. [0.40, 0.45]), health (r = 0.37, p < 0.001, 95% C.I. [0.34, 0.39]), spouse/partner (r = 0.24, p < 0.001, 95% C.I. [0.22, 0.27]), job (r = 0.33, p < 0.001, 95% C.I. [0.30, 0.35]), house/flat (r = 0.30, p < 0.001, 95% C.I. [0.27, 0.33]), amount of leisure time (r = 0.66, p < 0.001, 95% C.I. [0.64, 0.68]), social life (r = 0.59, p < 0.001, 95% C.I. [0.57, 0.61]) and use of leisure time (r = 0.53, p < 0.001, 95% C.I. [0.51, 0.55]) were significantly correlated with the overall satisfaction score. A significant positive correlation was observed between Conscientiousness (r = 0.19, p < 0.001, 95% C.I. [0.16, 0.22]), Agreeableness (r = 0.16, p < 0.001, 95% C.I. [0.13, 0.18]), Extraversion (r = 0.08, p < 0.001, 95% C.I. [0.05, 0.11]), Openness (r = 0.16, p < 0.001, 95% C.I. [0.13, 0.18]) and overall satisfaction, whereas Neuroticism (r = −0.06, p < 0.05, 95% C.I. [−0.09, −0.04]) had a significant negative correlation with overall satisfaction. The lowest correlation was found between the Neuroticism and overall life satisfaction (r = −0.06, p < 0.05, 95% C.I. [−0.09, −0.04]). All correlations can be found in Table 6.
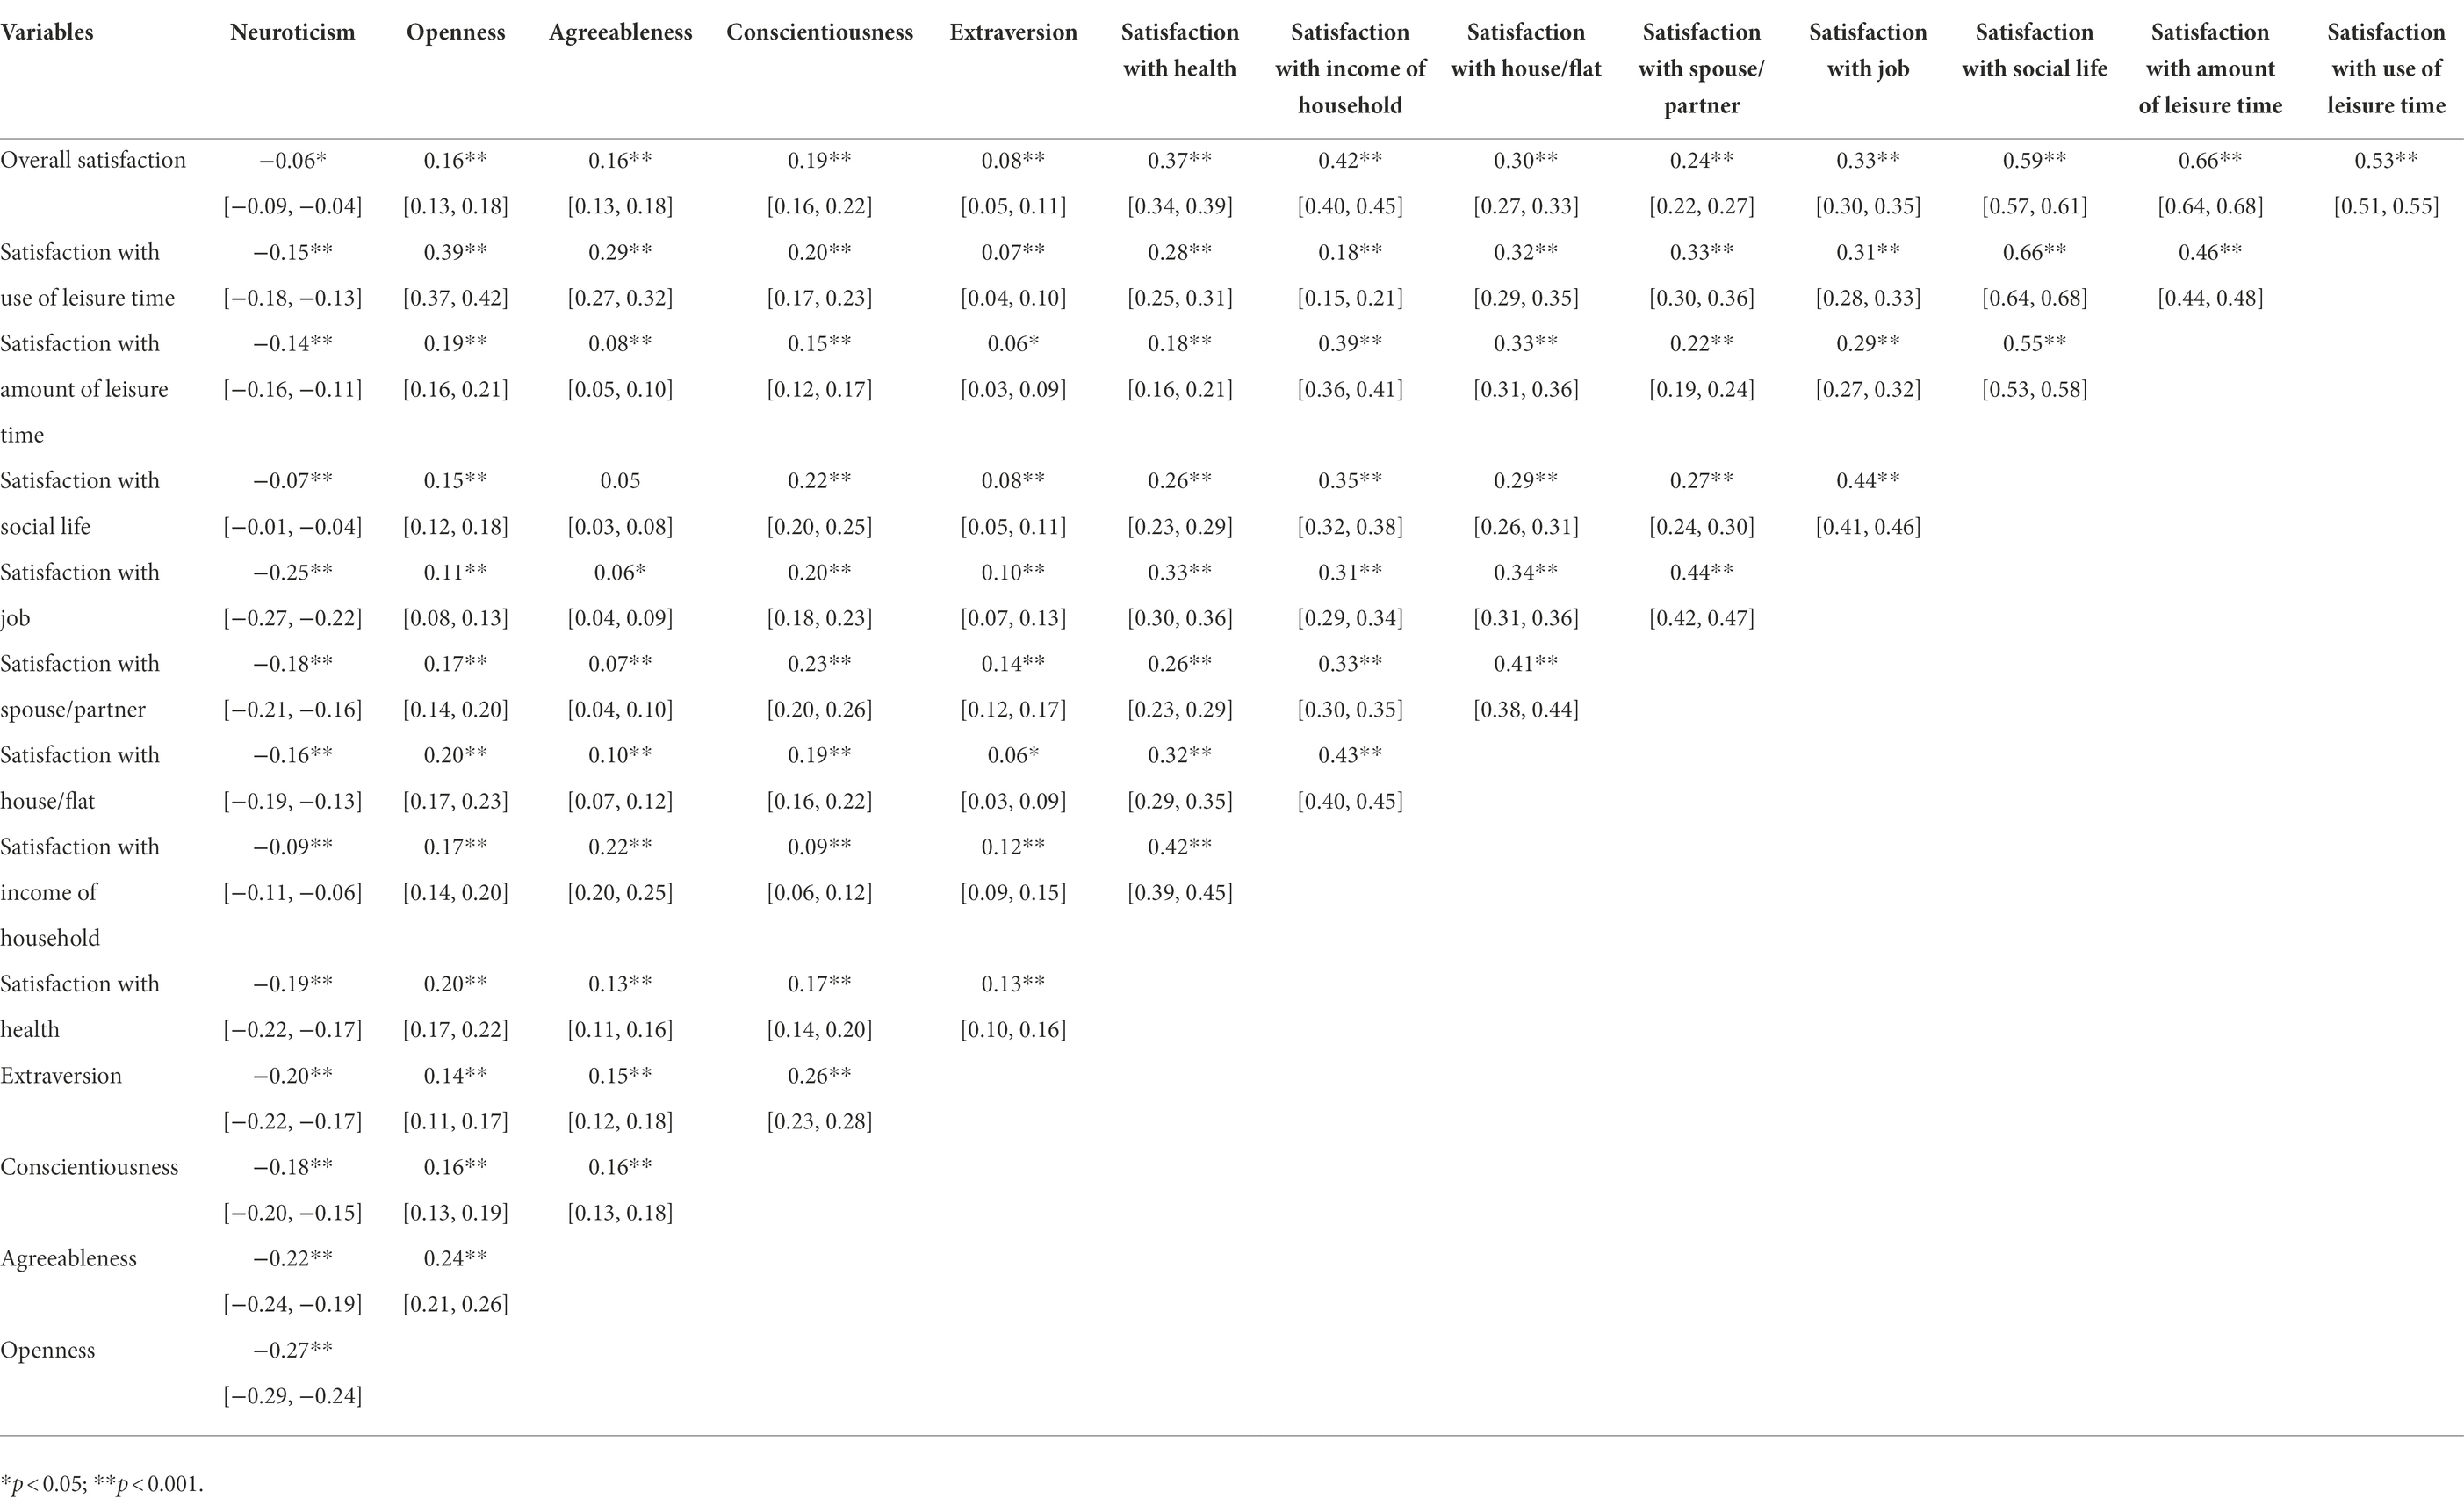
Table 6. Correlation between Neuroticism, Openness, Agreeableness, Conscientiousness, Extraversion, satisfaction with health, satisfaction with income of household, satisfaction with house/flat, satisfaction with spouse/partner, satisfaction with job, satisfaction with social life, satisfaction with amount of leisure time, satisfaction with use of leisure time, and overall satisfaction.
Discussion
The goal of this study was to further research on the relationship between life satisfaction and theories that may affect life satisfaction (bottom-up and top-down) in a large United Kingdom cohort. We found a significant main effect of sex and present legal marital status on overall satisfaction. However, the main effect of the age, highest educational qualification, political party supported, and employment status were not significant on the overall life satisfaction.
Another finding in the present study relates to the association between life satisfaction variables and overall life satisfaction. Our current findings demonstrated that areas of life satisfaction are related to overall life satisfaction (bottom-up theory). Specifically, we found that 51.4% (R2 = 0.514) of the variances of overall life satisfaction could be explained by life satisfaction variables. In particular, we found that satisfaction with spouse/partner (β = 0.18) had the greatest impact on overall satisfaction, followed by satisfaction with social life (β = 0.13), satisfaction with use of leisure time (β = 0.12), satisfaction with health (β = 0.11) and satisfaction with job (β = 0.10). Furthermore, satisfaction with income of household (β = 0.07), satisfaction with house/flat (β = 0.06) and satisfaction with amount of leisure time (β = 0.04) contributes to overall satisfaction. In addition, we found that satisfaction with income of household, health, spouse/partner, job, house/flat, amount of leisure time, social life and use of leisure time were significantly correlated with the overall satisfaction score.
Our current findings demonstrated that personality is related to overall life satisfaction, which supports the top-down theory. The personality traits in the regression model explained 14.8% (R2 = 0.148) of the total life satisfaction variances. Neuroticism (β = −0.19), followed by Openness (β = 0.15), Conscientiousness (β = 0.14), Agreeableness (β = 0.06) and Extraversion (β = 0.04) contributed to the overall satisfaction score. Moreover, consistent with previous findings in the literature (Diener, 1984; DeNeve and Cooper, 1998; Heller et al., 2004), we showed a significant positive correlation between Agreeableness, Extraversion, Conscientiousness, Openness and overall satisfaction, whereas Neuroticism had a significant negative correlation with overall satisfaction. The lowest correlation was found between the Neuroticism and overall life satisfaction.
Lachmann et al. (2017) provided an explanation regarding the much less variances explained by personality in overall life satisfaction compared to the amount that the areas of life satisfaction could explain. Diener and Diener (2009) and then Diener et al. (2010) emphasized the necessity of investigating not only the direct link between personality and overall life satisfaction, but also interactional and indirect effects (such as the presence or absence of various life circumstances). Additionally, several authors found that individual characteristics have moderating or mediating effects on the relationship between personality and total life satisfaction. For example, Gutiérrez et al. (2005) emphasized the need of taking demographic factors into account. Magee et al. (2013) examined the impact of cultural background on personality and life satisfaction. As a result, it appears that the link between personality and total life happiness is a complicated network containing both direct and indirect paths. If our findings are proven to be consistent with the current literature, future researchers may be motivated to adopt this approach to assess life satisfaction on a wide scale more frequently in life satisfaction research. Moreover, a number of other factors may play a role in the relationship between personality and overall life satisfaction: for example, health situation, level of physical fitness and the presence of diseases. If all of these elements have a role in determining total life happiness, a single factor is likely to contribute only a small portion of the overall score. As a result, the more predictors are used to define a criterion, the more difficult it should be to obtain reliable findings.
Furthermore, we added a model with residuals after factoring out demographics as the predicted variable and areas of life satisfaction, personality traits and demographic variables as predictors. In particular, in this integrative approach the independent variables explained 53.0% (R2 = 0.530) of the overall satisfaction score. Surprisingly, we found that Agreeableness (β = 0.00) and Extraversion (β = 0.01) were not significant predictors of the overall life satisfaction in this model. It is certainly possible that certain areas of life satisfaction might moderate the relationship between personality and overall life satisfaction.
The current study has some limitations. First, because we utilized a cross-sectional design, we cannot draw inferences regarding the causality of the relationship between the factors included. Second, data were collected within self-reported measures, which is a tangible risk of biases (Wold et al., 2013). Self-reported measures could be poor indicators of areas of life satisfaction (Rosenman et al., 2011). They may be considered favorable indicators in individualistic societies, where a personal, goal-oriented viewpoint contributes to greater self-referred attribution of failure and success, resulting in higher overall life satisfaction as compared to those in collectivistic cultures (Park et al., 2004; Loewe et al., 2014). However, self-report may still differentiate between different groups of people with regard to broad levels of areas of life satisfaction and personality traits. Third, data is quite old. Therefore, it is possible that the time and the habits present at the time of the collection of the data have influenced the nature of the self-reported measures. Mover, dispositional factors other than personality characteristics are also deemed important for overall life satisfaction. For example, situational elements such as critical life experiences or other environmental effects, have been demonstrated to be relevant in determining one’s degree of life satisfaction. In particular, a recent meta-analysis found that life experiences had an impact on cognitive well-being (Luhmann et al., 2012).
Besides the limitations mentioned above, our findings support an integrative approach to a life satisfaction model (Busseri, 2015; Kuykendall et al., 2015), in which both life satisfaction and personality traits contribute to the overall life satisfaction score. Personality explained 14.8% (R2 = 0.148) of variances of overall life satisfaction after taking demographic intro account, although larger than the previous study (R2 = 0.098; Lachmann et al., 2017), it was still substantially lower than the greater 51.4% (R2 = 0.514) of all life satisfaction variables. Our integrated model with demographic, personality, and areas of life satisfaction as predictors explained 53.0% (R2 = 0.530) of overall life satisfaction. These findings show that neither a bottom-up nor a top-down perspective alone can adequately explain life satisfaction, as various earlier studies have claimed (Heller et al., 2004; Luhmann et al., 2012; Lachmann et al., 2017). Rather, an integrated account of life satisfaction should be favored.
In conclusion, we found that demographics, personality, and areas of life satisfaction could explain a significant portion of variances in overall life satisfaction. Thus, rather than a unitary bottom-up or top-down model of satisfaction, we propose that an integrated account of life satisfaction should be supported. Future research needs to examine the underlying mechanisms between these associations and also establish causal relationships if possible.
Data availability statement
Publicly available datasets were analyzed in this study. This data can be found at: https://www.iser.essex.ac.uk/bhps.
Ethics statement
The studies involving human participants were reviewed and approved by the University of Essex. Written informed consent to participate in this study was provided by the participants’ legal guardian/next of kin.
Author contributions
AM: writing—original draft and writing—review and editing. WK: conceptualization, data curation, formal analysis, investigation, methodology, project administration, resources, software, supervision, writing—original draft, and writing—review and editing. All authors contributed to the article and approved the submitted version.
Funding
This work is supported by the Imperial Open Access Fund.
Conflict of interest
The authors declare that the research was conducted in the absence of any commercial or financial relationships that could be construed as a potential conflict of interest.
Publisher’s note
All claims expressed in this article are solely those of the authors and do not necessarily represent those of their affiliated organizations, or those of the publisher, the editors and the reviewers. Any product that may be evaluated in this article, or claim that may be made by its manufacturer, is not guaranteed or endorsed by the publisher.
References
Agyar, E. (2013). Life satisfaction, perceived freedom in leisure and self-esteem: The case of physical education and sport students. Procedia-Soc. Behav. Sci. 93, 2186–2193. doi: 10.1016/j.sbspro.2013.10.185
Asthana, H. (2011). Relationship of Big Five personality factors to subjective well-being of adolescents. Indian J. Soc. Sci. Res. 8, 18–28.
Baudin, N., Aluja, A., Rolland, J., and Blanch, A. (2011). The role of personality in satisfaction with life and sport. Psicol. Conduct. 19:333.
Busseri, M. A. (2015). Toward a resolution of the tripartite structure of subjective well-being. J. Pers. 83, 413–428. doi: 10.1111/jopy.12116
Costa, P. T., and McCrae, R. R. (1980). Influence of extraversion and neuroticism on subjective well-being: happy and unhappy people. J. Pers. Soc. Psychol. 38, 668–678. doi: 10.1037/0022-3514.38.4.668
DeNeve, K. M., and Cooper, H. (1998). The happy personality: A meta-analysis of 137 personality traits and subjective well-being. Psychol. Bull. 124, 197–229. doi: 10.1037/0033-2909.124.2.197
Diener, E. (1984). Subjective well-being. Psychol. Bull. 95, 542–575. doi: 10.1037/0033-2909.95.3.542
Diener, E., and Diener, M. (2009). “Cross-cultural correlates of life satisfaction and self-esteem,” in Culture and Well-being. (Dordrecht: Springer), 71–91.
Diener, E., Kahneman, D., and Helliwell, J. (2010). International Differences In Well-Being. Oxford University Press.
Diener, E., and Lucas, R. E. (1999). “Personality and subjective wellbeing,” in Well-being: The Foundations of Hedonic Psychology. eds. D. Kahneman, E. Diener, and N. Schwarz (New York: Russell Sage), 213–229.
Diener, E., Oishi, S., and Lucas, R. E. (2003). Personality, culture, and subjective well-being: emotional and cognitive evaluations of life. Annu. Rev. Psychol. 54, 403–425. doi: 10.1146/annurev.psych.54.101601.145056
Diener, E., Sapyta, J. J., and Suh, E. (1998). Subjective well-being is essential to well-being. Psychol. Inq. 9, 33–37. doi: 10.1207/s15327965pli0901_3
Diener, E., and Suh, E. M. (2000). “Measuring subjective well-being to compare the quality of life of cultures” in Culture and Subjective Well-being (Cambridge: The MIT Press), 3–12.
Erdogan, B., Bauer, T. N., Truxillo, D. M., and Mansfield, L. R. (2012). Whistle while you work a review of the life satisfaction literature. J. Manag. 38, 1038–1083. doi: 10.1177/0149206311429379
Feist, G. J., Bodner, T. E., Jacobs, J. F., Miles, M., and Tan, V. (1995). Integrating top-down and bottom-up structural models of subjective well-being: A longitudinal investigation. J. Pers. Soc. Psychol. 68, 138–150. doi: 10.1037/0022-3514.68.1.138
Gale, C. R., Booth, T., Mõttus, R., Kuh, D., and Deary, I. J. (2013). Neuroticism and extraversion in youth predict mental wellbeing and life satisfaction 40 years later. J. Res. Pers. 47, 687–697. doi: 10.1016/j.jrp.2013.06.005
Gutiérrez, J. L. G., Jiménez, B. M., Hernández, E. G., and Pcn, C. (2005). Personality and subjective well-being: Big Five correlates and demographic variables. Personal. Individ. Differ. 38, 1561–1569. doi: 10.1016/j.paid.2004.09.015
Headey, B., Kelley, J., and Wearing, A. (1993). Dimensions of mental health: life satisfaction, positive affect, anxiety and depression. Soc. Indic. Res. 29, 63–82. doi: 10.1007/BF01136197
Heller, D., Watson, D., and Ilies, R. (2004). The role of person versus situation in life satisfaction: A critical examination. Psychol. Bull. 130, 574–600. doi: 10.1037/0033-2909.130.4.574
Hosseinkhanzadeh, A. A., and Taher, M. (2013). The relationship between personality traits with life satisfaction. Sociol. Mind 3, 99–105. doi: 10.4236/sm.2013.31015
John, O. P., and Srivastava, S. (1999). The Big-Five trait taxonomy: History, measurement, and theoretical perspectives.
Kjell, O. N., Nima, A. A., Sikström, S., Archer, T., and Garcia, D. (2013). Iranian and Swedish adolescents: differences in personality traits and well-being. PeerJ 1:e197. doi: 10.7717/peerj.197
Kuykendall, L., Tay, L., and Ng, V. (2015). Leisure engagement and subjective well-being: A meta-analysis. Psychol. Bull. 141, 364–403. doi: 10.1037/a0038508
Lachmann, B., Sariyska, R., Kannen, C., Błaszkiewicz, K., Trendafilov, B., Andone, I., et al. (2017). Contributing to overall life satisfaction: personality traits versus life satisfaction variables revisited-is replication impossible? Behav. Sci. 8:1. doi: 10.3390/bs8010001
Loewe, N., Bagherzadeh, M., Araya-Castillo, L., Thieme, C., and Batista-Foguet, J. M. (2014). Life domain satisfactions as predictors of overall life satisfaction among workers: evidence from Chile. Soc. Indic. Res. 118, 71–86. doi: 10.1007/s11205-013-0408-6
Lucas, R. E., and Donnellan, M. B. (2007). How stable is happiness? Using the STARTS model to estimate the stability of life satisfaction. J. Res. Pers. 41, 1091–1098.
Luhmann, M., Hofmann, W., Eid, M., and Lucas, R. E. (2012). Subjective well-being and adaptation to life events: A meta-analysis. J. Pers. Soc. Psychol. 102, 592–615. doi: 10.1037/a0025948
Magee, C. A., Miller, L. M., and Heaven, P. C. (2013). Personality trait change and life satisfaction in adults: The roles of age and hedonic balance. Personal. Individ. Differ. 55, 694–698. doi: 10.1016/j.paid.2013.05.022
Moksnes, U. K., and Espnes, G. A. (2013). Self-esteem and life satisfaction in adolescents—gender and age as potential moderators. Qual. Life Res. 22, 2921–2928. doi: 10.1007/s11136-013-0427-4
Montag, U. K., and Panksepp, G. A. (2017). Primary emotional systems and personality: an evolutionary perspective. Front. Psychol. 8:464.
Newman, D. B., Tay, L., and Diener, E. (2014). Leisure and subjective well-being: A model of psychological mechanisms as mediating factors. J. Happiness Stud. 15, 555–578. doi: 10.1007/s10902-013-9435-x
Oishi, S., Diener, E., Suh, E., and Lucas, R. E. (1999). Value as a moderator in subjective well-being. J. Pers. 67, 157–184. doi: 10.1111/1467-6494.00051
Park, N., Huebner, E. S., Laughlin, J. E., Valois, R. F., and Gilman, R. (2004). “A cross-cultural comparison of the dimensions of child and adolescent life satisfaction reports,” in Quality-of-life research on children and adolescents (Dordrecht: Springer), 61–79.
Rammstedt, B., and John, O. P. (2007). Measuring personality in one minute or less: A 10-item short version of the Big Five Inventory in English and German. J. Res. Pers. 41, 203–212. doi: 10.1016/j.jrp.2006.02.001
Rode, J. C. (2004). Job satisfaction and life satisfaction revisited: A longitudinal test of an integrated model. Hum. Relat. 57, 1205–1230. doi: 10.1177/0018726704047143
Rojas, M. (2006). Life satisfaction and satisfaction in domains of life: is it a simple relationship? J. Happiness Stud. 7, 467–497. doi: 10.1007/s10902-006-9009-2
Rosenman, R., Tennekoon, V., and Hill, L. G. (2011). Measuring bias in self-reported data. Int. J. Behav. Healthc. Res. 2, 320–332. doi: 10.1504/IJBHR.2011.043414
Schimmack, U., Oishi, S., Furr, R. M., and Funder, D. C. (2004). Personality and life satisfaction: A facet-level analysis. Pers. Soc. Psychol. Bull. 30, 1062–1075. doi: 10.1177/0146167204264292
Steel, P., Schmidt, J., and Shultz, J. (2008). Refining the relationship between personality and subjective well-being. Psychol. Bull. 134, 138–161. doi: 10.1037/0033-2909.134.1.138
Tov, W., and Diener, E. (2009). “Culture and subjective well-being,” in Culture and well-being. Social Indicators Research Series. ed. E. Diener, Vol. 38 (Dordrecht: Springer).
Ulloa, B. F. L., Møller, V., and Sousa-Poza, A. (2013). How does subjective well-being evolve with age? A literature review. J. Popul. Ageing 6, 227–246. doi: 10.1007/s12062-013-9085-0
Wold, B., Duda, J. L., Balaguer, I., Smith, O. R. F., Ommundsen, Y., Hall, H. K., et al. (2013). Comparing self-reported leisure-time physical activity, subjective health, and life satisfaction among youth soccer players and adolescents in a reference sample. Int. J. Sport Exerc. Psychol. 11, 328–340. doi: 10.1080/1612197X.2013.830433
Keywords: personality, Big Five, life satisfaction, job satisfaction, health satisfaction
Citation: Malvaso A and Kang W (2022) The relationship between areas of life satisfaction, personality, and overall life satisfaction: An integrated account. Front. Psychol. 13:894610. doi: 10.3389/fpsyg.2022.894610
Edited by:
Atsushi Oshio, Waseda University, JapanReviewed by:
Petar Čolović, University of Novi Sad, SerbiaZulmi Ramdani, State Islamic University Sunan Gunung Djati, Indonesia
Copyright © 2022 Malvaso and Kang. This is an open-access article distributed under the terms of the Creative Commons Attribution License (CC BY). The use, distribution or reproduction in other forums is permitted, provided the original author(s) and the copyright owner(s) are credited and that the original publication in this journal is cited, in accordance with accepted academic practice. No use, distribution or reproduction is permitted which does not comply with these terms.
*Correspondence: Weixi Kang, d2VpeGkyMGthbmdAZ21haWwuY29t