 Jasper Beernaerts
 Bernard De Baets2
 Matthieu Lenoir
 Nico Van de Weghe
94% of researchers rate our articles as excellent or good
Learn more about the work of our research integrity team to safeguard the quality of each article we publish.
Find out more
ORIGINAL RESEARCH article
Front. Psychol. , 08 July 2022
Sec. Movement Science
Volume 13 - 2022 | https://doi.org/10.3389/fpsyg.2022.863216
In this paper, we explore the use of the Static Qualitative Trajectory Calculus (QTCS), a qualitative spatiotemporal method based on the QTC, for the analysis of team formations in football. While methods for team formation analysis in sports are predominantly quantitative in nature, QTCS enables the comparison of team formations by describing the relative positions between players in a qualitative manner, which is more related to the way players position themselves on the field. QTCS has the potential to allow to monitor to what extent a football team plays according to a coach’s predetermined formation. When applied to multiple matches of one team, the method can contribute to the definition of the playing style of a team. We present an experiment aimed at identifying the team formation played by Belgian national football team during the 2018 FIFA World Cup held in France.
In this paper, we explore the use of the Static Qualitative Trajectory Calculus (QTCS), a recently introduced method for describing spatial formations, for team formation analysis in football (Beernaerts et al., 2018). Team formation analysis in football might be used to increase team performance with the aim of scoring more (and conceding less) goals and therefore winning more matches.
This introductory section includes a concise overview of established methods for analyzing team formations in football. Subsequently, we briefly present the QTCs method as well as the experimental setup in section Materials and Methods. This experiment, which serves as the main part of this paper, aims at identifying the team formations played by the Belgian national football team during two matches of the 2018 FIFA World Cup. In section Results, the results of the experiment are presented. Section Discussion consists of a more thorough discussion and validation of the results, illustrating the use of the method for analyzing team performance in football.
This section presents an overview of the established methods used to study the spatial formation of football teams, which is referred to as “team formation analysis” in the remainder of this paper. In football, teams are reported to play in specific spatial configurations, called team formations (Kaminka et al., 2003; Kuhlmann et al., 2005). A team formation can be defined as “A specific structure defining the distribution of players based on their positions within the field of play” (Ayanegui-Santiago, 2009). While several methods for analyzing team formations have been described in various team sports (e.g., American football: Atmosukarto et al., 2013; basketball: Lucey et al., 2014; and volleyball: Jäger and Schöllhorn, 2012), this analysis can be regarded as particularly challenging in football because of the fluent and dynamic character of the game (Atmosukarto et al., 2013).
For a coach, it is important to correctly estimate the strengths and weaknesses of his or her own team. In this way, he/she can choose the most suitable team formation for a game (Carling, 2011). The selected team formation will thereby be dependent on the expected formation of the adversary team as well as the characteristics of the theoretical formation and the players that are fit to play. Aquino et al. (2019), for example, studied the effects of the applied team formation on metrics such as ball possession. Low et al. (2021) studied the impact of team formation on defensive passing behavior and collective team movements. Moreover, the manipulation of the players’ positions on the field has been described as one of the key elements of how team tactics can be applied during football matches (Rein and Memmert, 2016). The analysis of team formations in football can be performed in various ways, but often starts with a visual exploration of the data, followed by the actual detection of the formations (Stein et al., 2016, 2018). Müller-Budack et al. (2019) thereby emphasize the importance of visualizing individual situations to understand the application of team formations in football, which further illustrates the complexity of this task. Some other methods make use of various Key Performance Indicators (KPIs) to determine and analyze team formations in football (Memmert et al., 2017). These KPIs are calculated based on the positions of the players on the field. For example, Sampaio and Macãs (2012) suggested the team centroid, team entropy, a team stretch index and the surface area of the team as KPIs for team formation analysis. Going further on this, Frencken et al. (2012) added the inter-team distance, i.e., the distance between the centroids of both teams, as a key performance indicator to observe goals or shots on target during a football match.
Bialkowski et al. (2014) introduced a method for the automated detection of the type of team formation performed in a match, based on the average positions of the players on the field. They argue that, because the players are swapping positions during the game, team formation needs to be analyzed using a dynamic instead of a static ordering of players. Using data from an entire Premier League season, Lucey et al. (2013) and Bialkowski et al. (2014) found no significant difference between formations of different teams, but could detect that English Premier League teams used more offensive team formations during home games. Narizuka and Yamazaki (2019) proposed a clustering technique to compare team formations in football based on the positions of the players summarized in so-called heatmaps.
Various new methods use principles of (artificial) neural networks (McCulloch and Pitts, 1943) for sports analytics in football. Visser et al. (2001) used artificial neural networks to recognize the team formation of the opponent team by using a set of predefined reference team formations. Expanding on this, Ayanegui-Santiago (2009) suggested the inclusion of multiple relations between players for the recognition of team formations in football. For this purpose, players were divided into three groups (defenders, midfielders, and attackers) based on their role in the game and their averaged positions. Next, notions from graph theory were applied to study the team formation, thereby only including links between nodes of adjacent groups.
While most methods use quantitative metrics, Perin et al. (2013) argue that quantitative analysis alone might not be sufficient to understand the team formation of a game or an entire season. Perin et al. thereby focus on the qualitative fragmentation of a football match to obtain meaningful temporal fragments (e.g., similar defending or attacking situations) that can then be compared. Unfortunately, qualitative team formation analysis in football is at present mostly performed by human experts and is therefore rather labor-intensive (Bialkowski et al., 2014). Moreover, few studies have analyzed team formations on real size football fields, or on real football matches. Gonçalves et al. (2017); however, demonstrated that there are important differences between team tactics (and thus team formations) of matches played on a football field with a reduced size and games played on a full field, suggesting that research should be conducted on official football matches. As in other sports disciplines, mixed methods—which combine both quantitative and qualitative principles—have been gaining importance in sports analytics for football in recent years (Anguera et al., 2017). There are, however, only a limited number of mixed methods that are specifically aimed at analyzing and defining team formation in football (Frencken et al., 2012; Sampaio and Macãs, 2012; Aquino et al., 2019). These methods primarily combine quantitative performance metrics (e.g., ball possession, running speeds or number of shots, and goals) with qualitative observations of the performed team formations in order to evaluate the effectiveness of the played team formation(s). In the remainder of the paper, however, we propose a method that primarily aims at detecting the performed team formation rather than evaluating its effectiveness or impact on quantitative performance metrics.
In this section, we briefly discuss the proposed methodology for the analysis of sports team formation in football. The theoretical basis was previously introduced by Beernaerts et al. (2018), but was never applied on real football data with the aim of obtaining knowledge on team formation behavior, necessitating a validation of the results with findings of football experts. More importantly, this section therefore focuses on the experimental setup.
QTC is a qualitative calculus for describing spatiotemporal relations between two or more Moving Point Objects (MPOs; Van de Weghe and De Maeyer, 2005). While QTC typically describes movement between multiple objects, it was extended to a new variant named the QTCS by Beernaerts et al. (2018). While multiple variants of the dynamic QTC exist, the QTCS method presented in this paper makes use of the principles of the most basic dynamic variant QTCB (Van de Weghe and De Maeyer, 2005). QTCS describes the static formation of Point Objects (POs) in a qualitative manner and can be used to describe the spatial formation of players in football, which is shown for a basic example in Figure 1. Its use for analyzing team formations of (parts of) football teams was demonstrated by Beernaerts et al. (2018) by means of some basic examples.
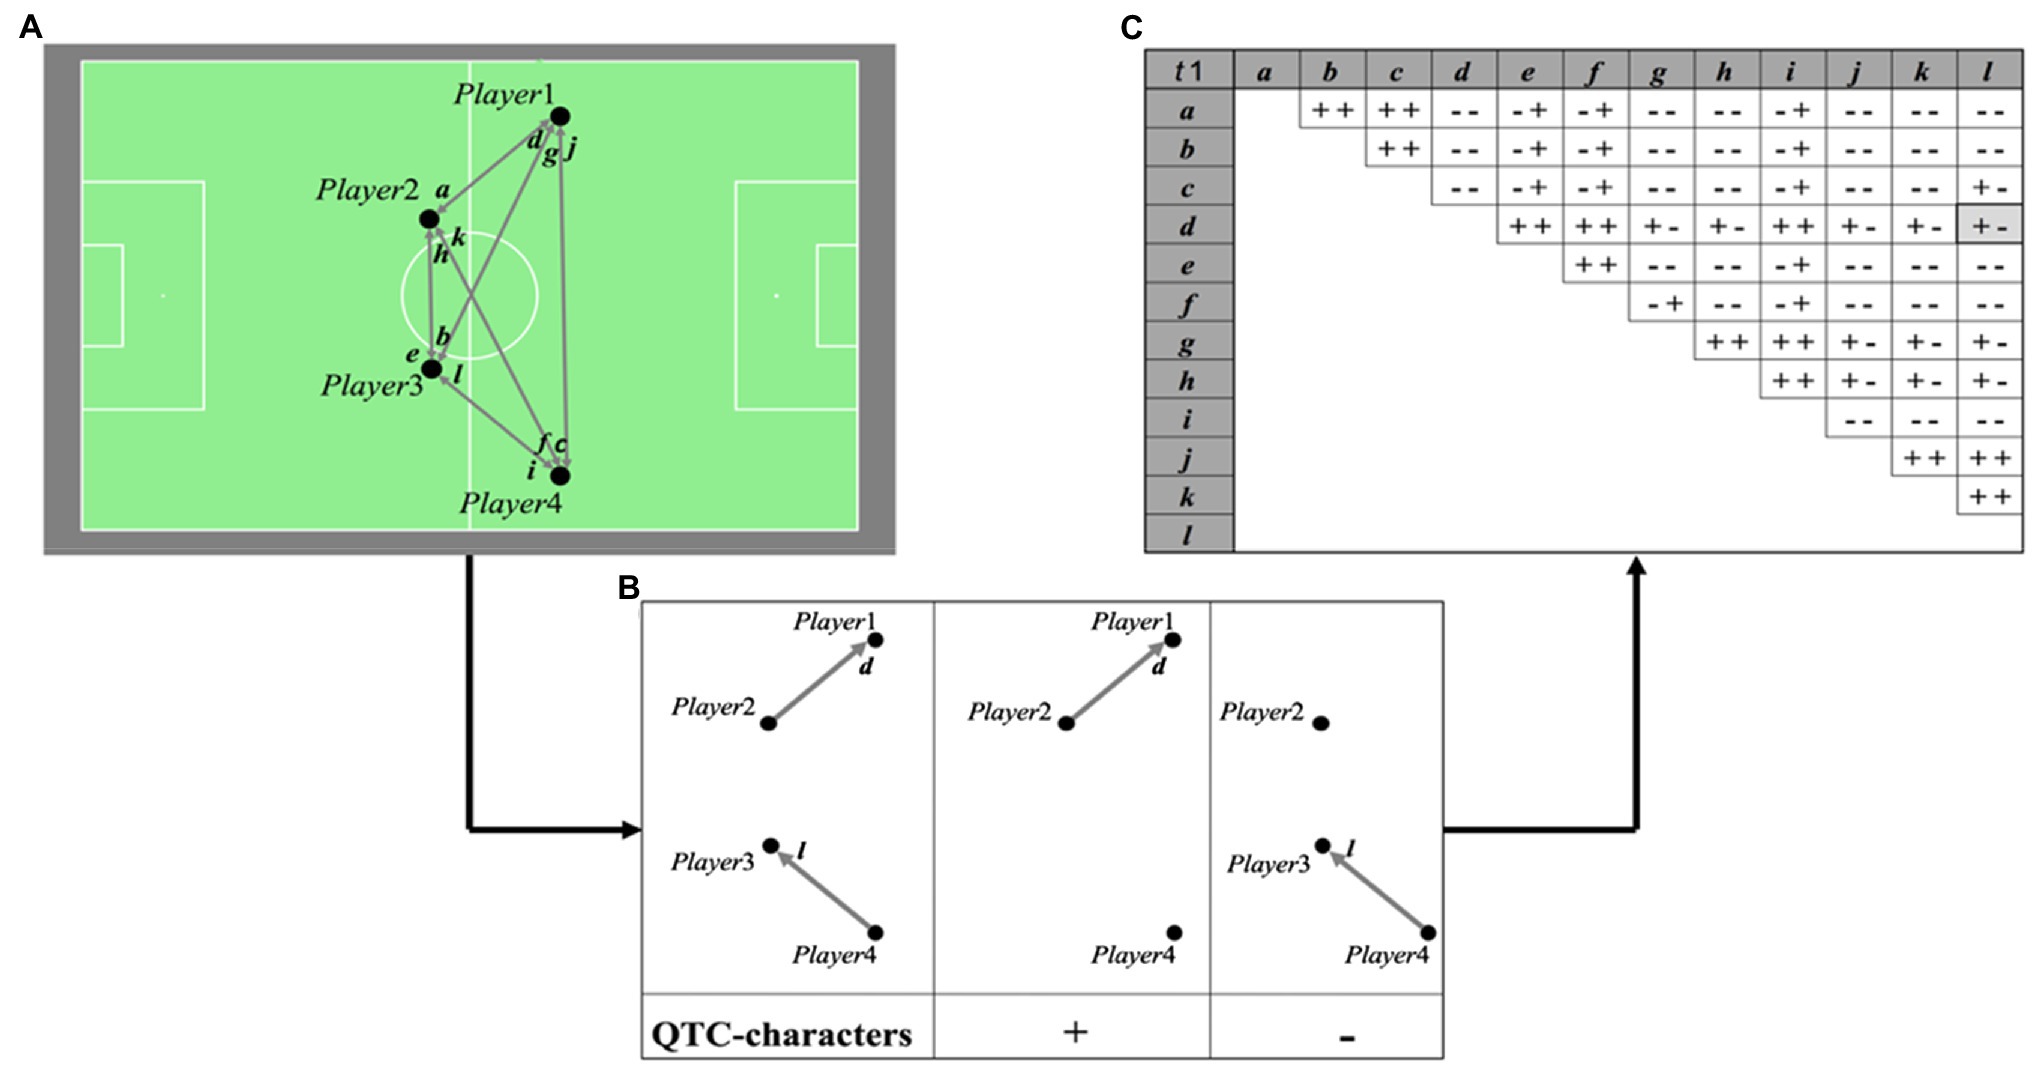
Figure 1. A formation of four players (POs) on a football field at t1 and the vectors between them (A). The construction of the Qualitative Trajectory Calculus (QTCs)-relations between two vectors d and l, consisting of the QTCS-relation of vector d with respect to the starting point of vector l and of the QTCS-relation of vector l with respect to the starting point of vector d. If the vector moves away from the starting point of the other vector, the QTCS-relation is denoted by “+,” if the movement is toward the marker, the QTCS-relation is denoted by “−.” If the movement is neither away nor toward the marker (thus perpendicular to the connecting line between the two starting points), the QTCS-relation is denoted by “0” (B). The QTCS-matrix describing the full formation of the four players, including all relations between all the vectors (C; Reproduced from Beernaerts et al., 2018, with permission from icSPORTS).
By constructing a QTCS-matrix for each team formation of interest (i.e., timestamp), QTCS can be used to describe the team formation at different moments during a match, by calculating the distance between the QTCS-representation at each moment and the QTCS-representation of a series of reference team formations, thereby assigning the reference team formation with the lowest distance (the highest similarity) as a label for the team formation of that respective timestamp. The distance between two QTCS-matrices can be calculated by summing up the pairwise distances between the corresponding elements (QTCS-relations), thereby using the conceptual distance between QTC-relations (Van de Weghe and De Maeyer, 2005). By dividing the total distance by the maximal possible distance (depending on the matrix dimensions), the relative distance is calculated. For ease of understanding, the relative distance is recalculated to a similarity value between 0 and 1. One could argue that QTCS, a method that originated from the geographical research domain, can therefore be considered a mixed method for analyzing team formations in football, as it combines qualitative spatial reasoning with a quantitative distance calculation.
The experiment aims at defining the team formation of the Belgian national football team during two football matches (Belgium—Japan and Brazil—Belgium). Most studies are limited to the analysis of the impact of different team formations (labeled manually by football experts) on different football metrics. In this experiment, however, we aim at investigating the use of QTCS as a method for the (automated) detection (thus labeling) of team formations. The data was extracted from the official FIFA match reports (FIFA, 2018), which are publicly available and consist of a theoretical team formation (filed by the coach before the start of the game) and a series of actual positions of the players averaged over every 15, 45, and 90 min of both matches, visualized in Figure 2. Unfortunately, no generally accepted dataset of reference football team formations has been reported in literature (Football Bible, 2014; Wilson, 2014). Such a dataset is required for labeling the theoretical and actual performed team formations. Moreover, every coach or football analyst has his/her own interpretation of each team formation, based on personal experiences or expectations of specific player roles for that formation (Wilson, 2014). For these reasons, the reference team formation dataset was derived from the popular football simulation game FIFA 2016, as it includes a top-down view of 25 standard team formations (Figure 3), which are well-known by millions of people and are documented rigorously (FifaUTeam, 2016).
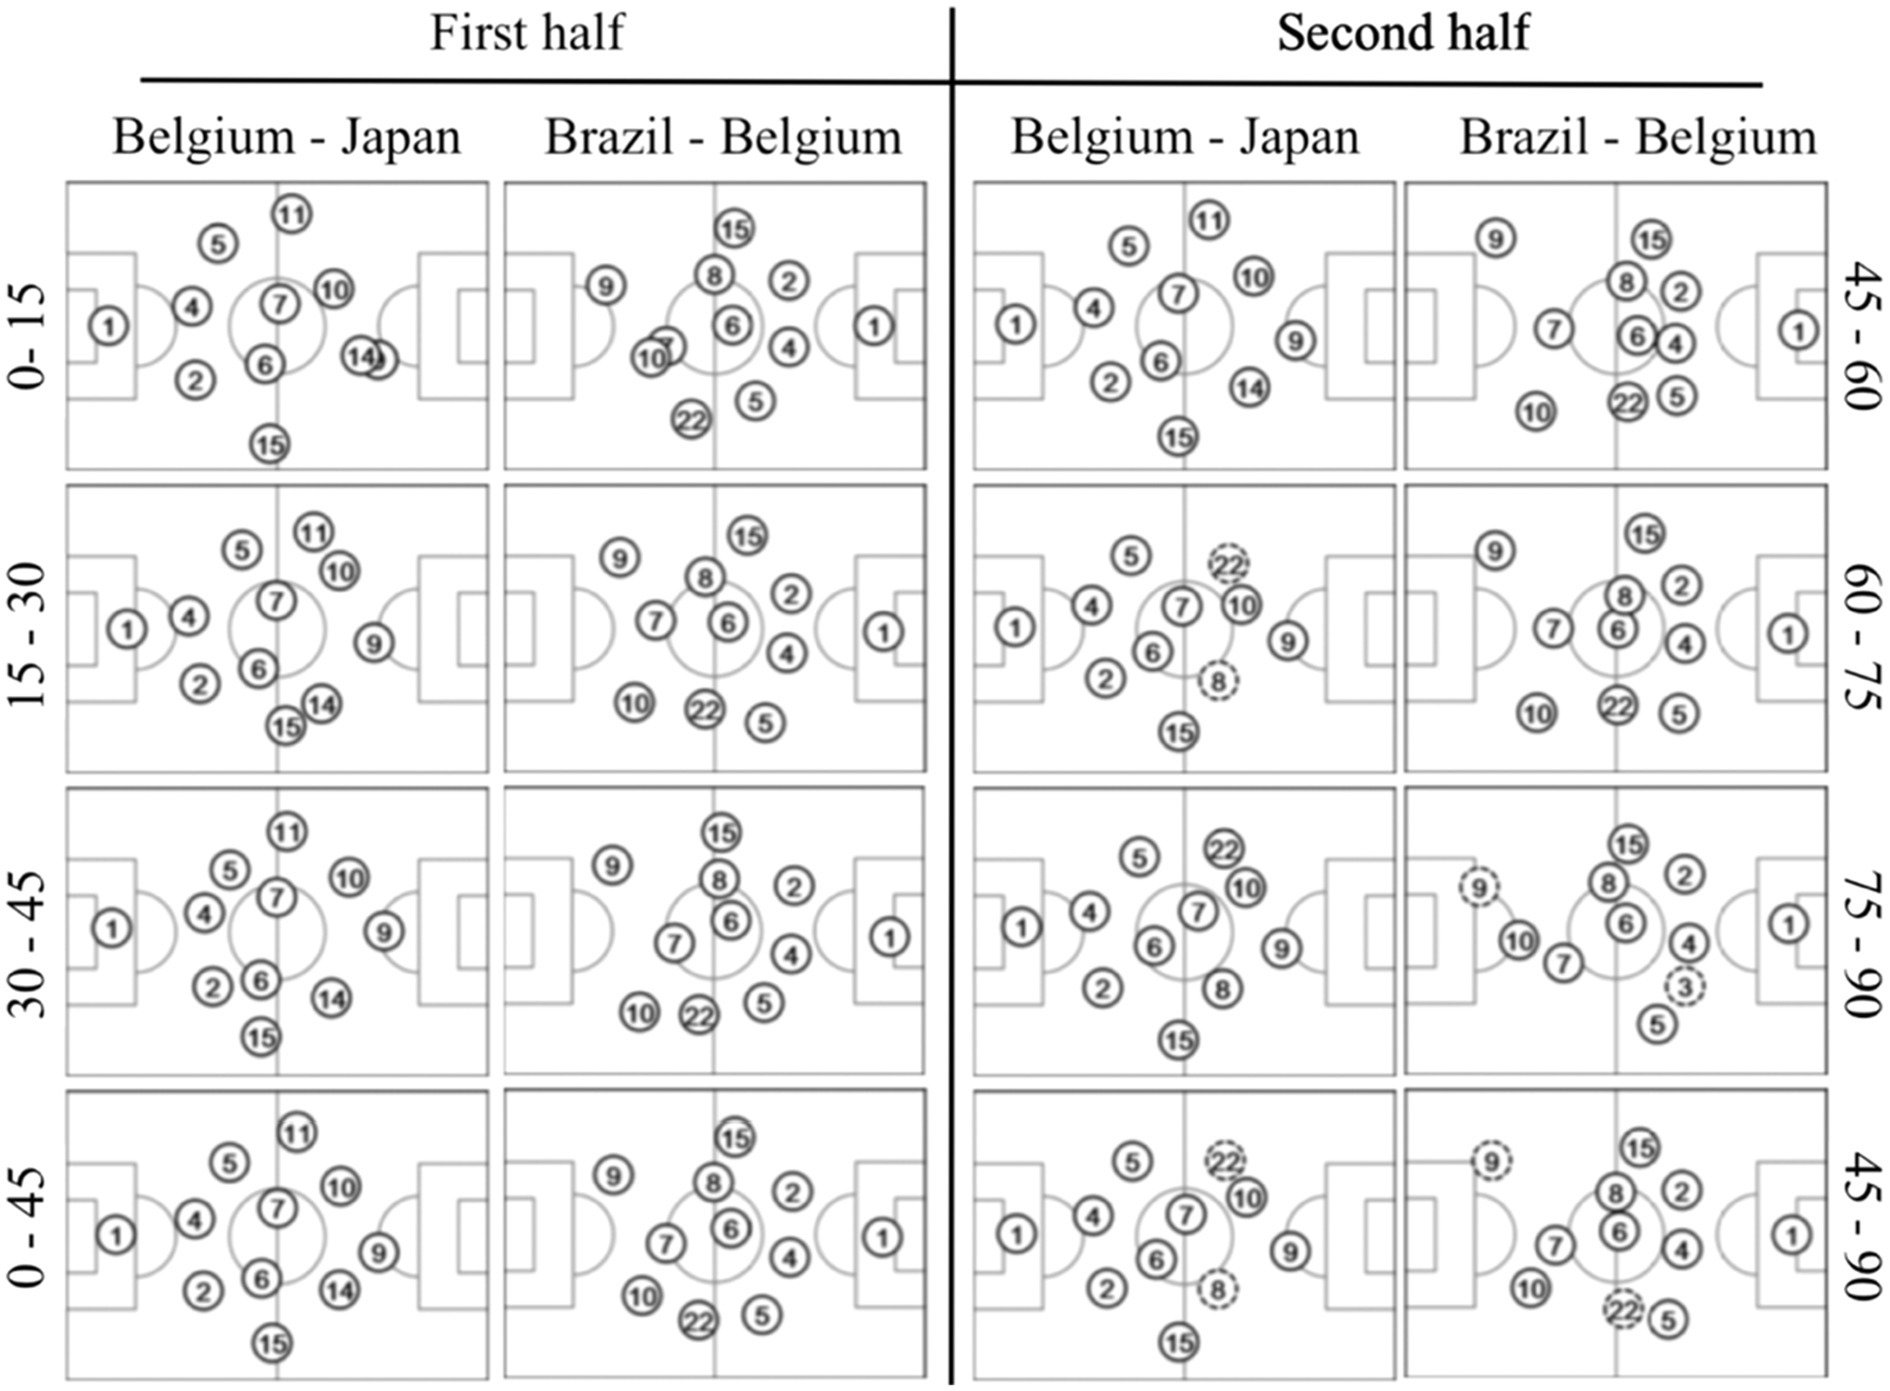
Figure 2. Actual performed team formations of the Belgian national football team.
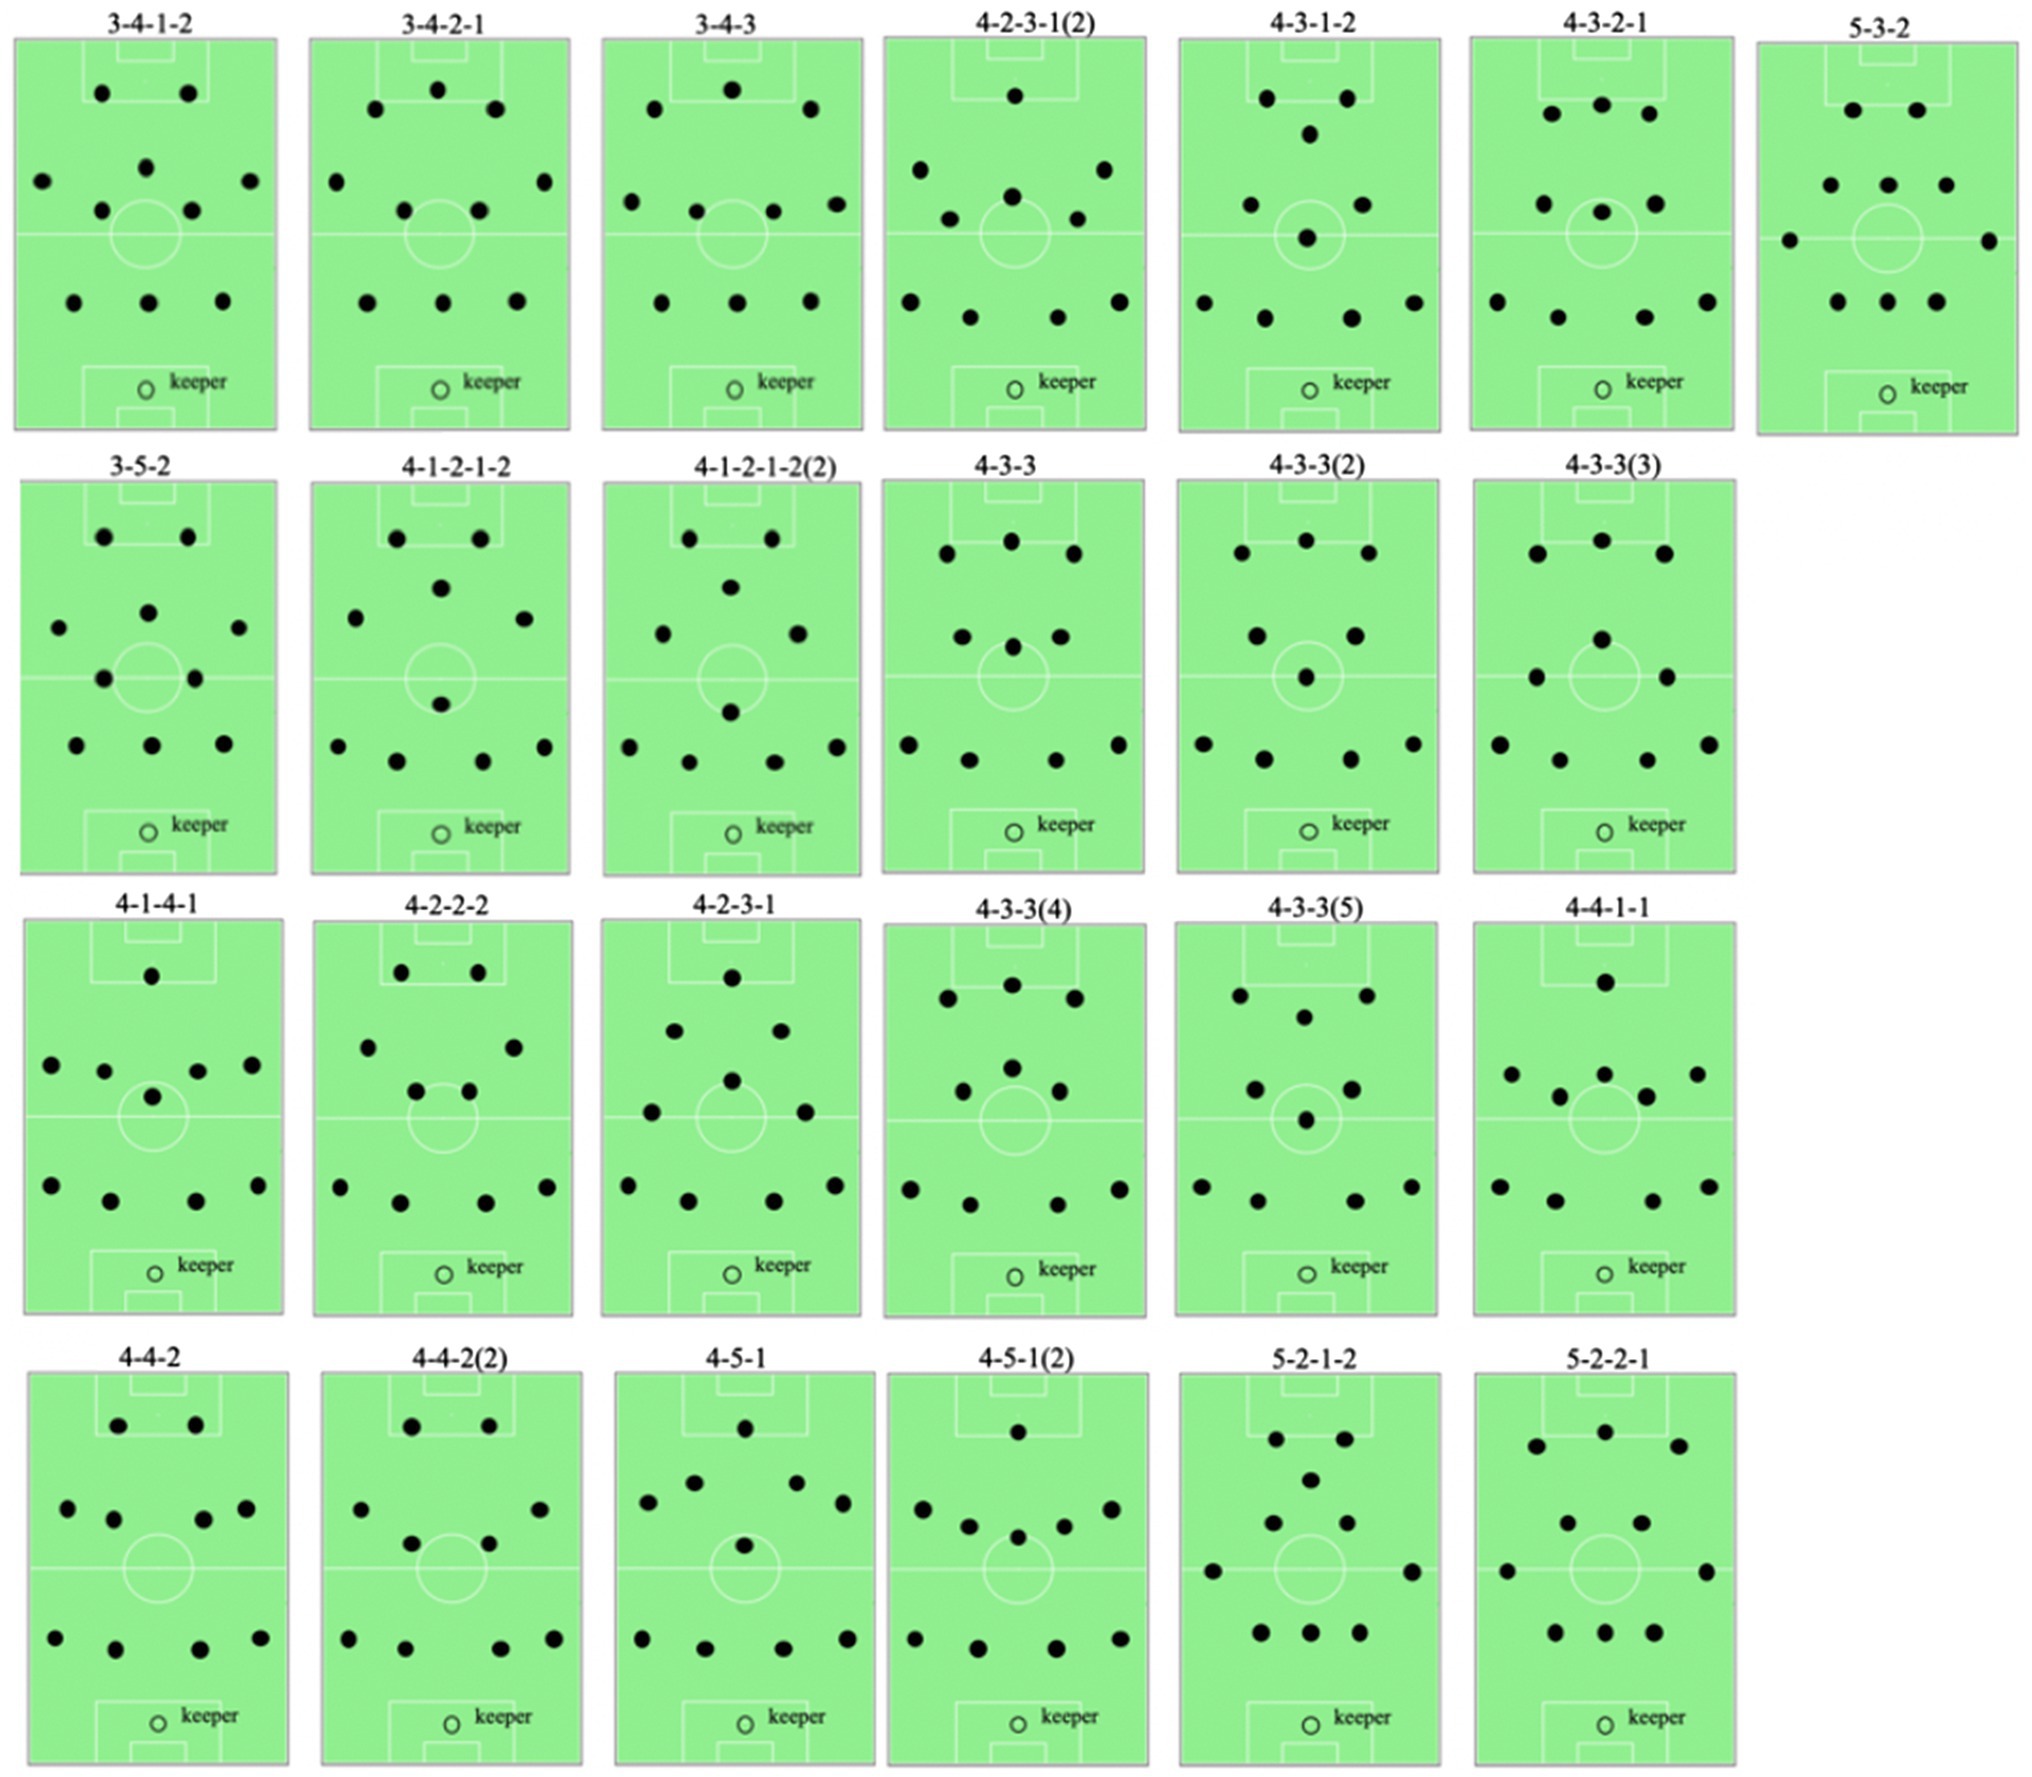
Figure 3. The 25 reference team formations used for the experiment. The data used in this figure were taken from FifaUTeam (2016).
All 11 players are included in the analysis, where the keeper can be seen as a static point, fixating the rotation of the team formation (Beernaerts et al., 2018). Indeed, the goalkeeper will always be positioned in front of his own goal, thus with an almost identical orientation with respect to the rest of the players of his team. As players tend to switch roles and positions during the game (Bialkowski et al., 2014), it is necessary to include permutations of the QTCS-matrices when calculating the distance between the team formation at a certain moment and the different reference team formations. Calculating all permutations, however, requires 39.916.800 iterations of the distance calculation. To reduce the complexity of the experiment, four players were chosen as “fixed” based upon common sense, thereby reducing the number of players to permute to 7 and the number of permutations to 5,040. Indeed, assuming that a football team always plays with one goalkeeper and at least three defenders, these players can be omitted. This corresponds with the reference team formations dataset, which does not contain a team formation without goalkeeper or with less than 3 defenders. Furthermore, defensive players are characterized by a high level of positional rigidity (Gonçalves et al., 2014), meaning that position switches are not likely to occur.
Figure 4 displays the results of the experiment for the matches Belgium-Japan and Brazil-Belgium. For each of the actual performed team formations included in the official FIFA match reports (nine per match), the most similar reference team formation is shown (column “label”) along with the similarity (1—distance) with that reference team formation (column “similarity with label”). While the theoretical team formation is a 3-4-3 formation for both matches, this formation is never detected as an actual performed team formation. Instead, small variants of this team formation are reported to have occurred. In the match against Japan, for example, the highly similar 3-4-2-1 formation was played by the team for all the considered time intervals. In fact, the 3-4-2-1 formation can be seen as a variant of the more general 4-3-3 formation, the only difference being that the two flank midfielders play a bit higher (i.e., more toward the opponent’s goal) and the two flank attackers play a bit closer to the middle attacker (see Figure 3). In the match against Brazil, the team most commonly played according to a 3-4-1-2 formation, another variant of the 4-3-3 formation. In this formation, the flank midfielders play a bit higher and the flank attackers play a bit closer to the center of the field, while the middle attacker plays significantly lower. In fact, the latter is the only important difference between the 3-4-1-2 and the 3-4-2-1 formations, which are both similar to the 3-4-3 formation. More remarkably, there are two time intervals (minutes 15–30 and 75–90) during the match against Brazil for which reference team formations with four defenders are detected as most similar (shown in yellow in Figure 4).
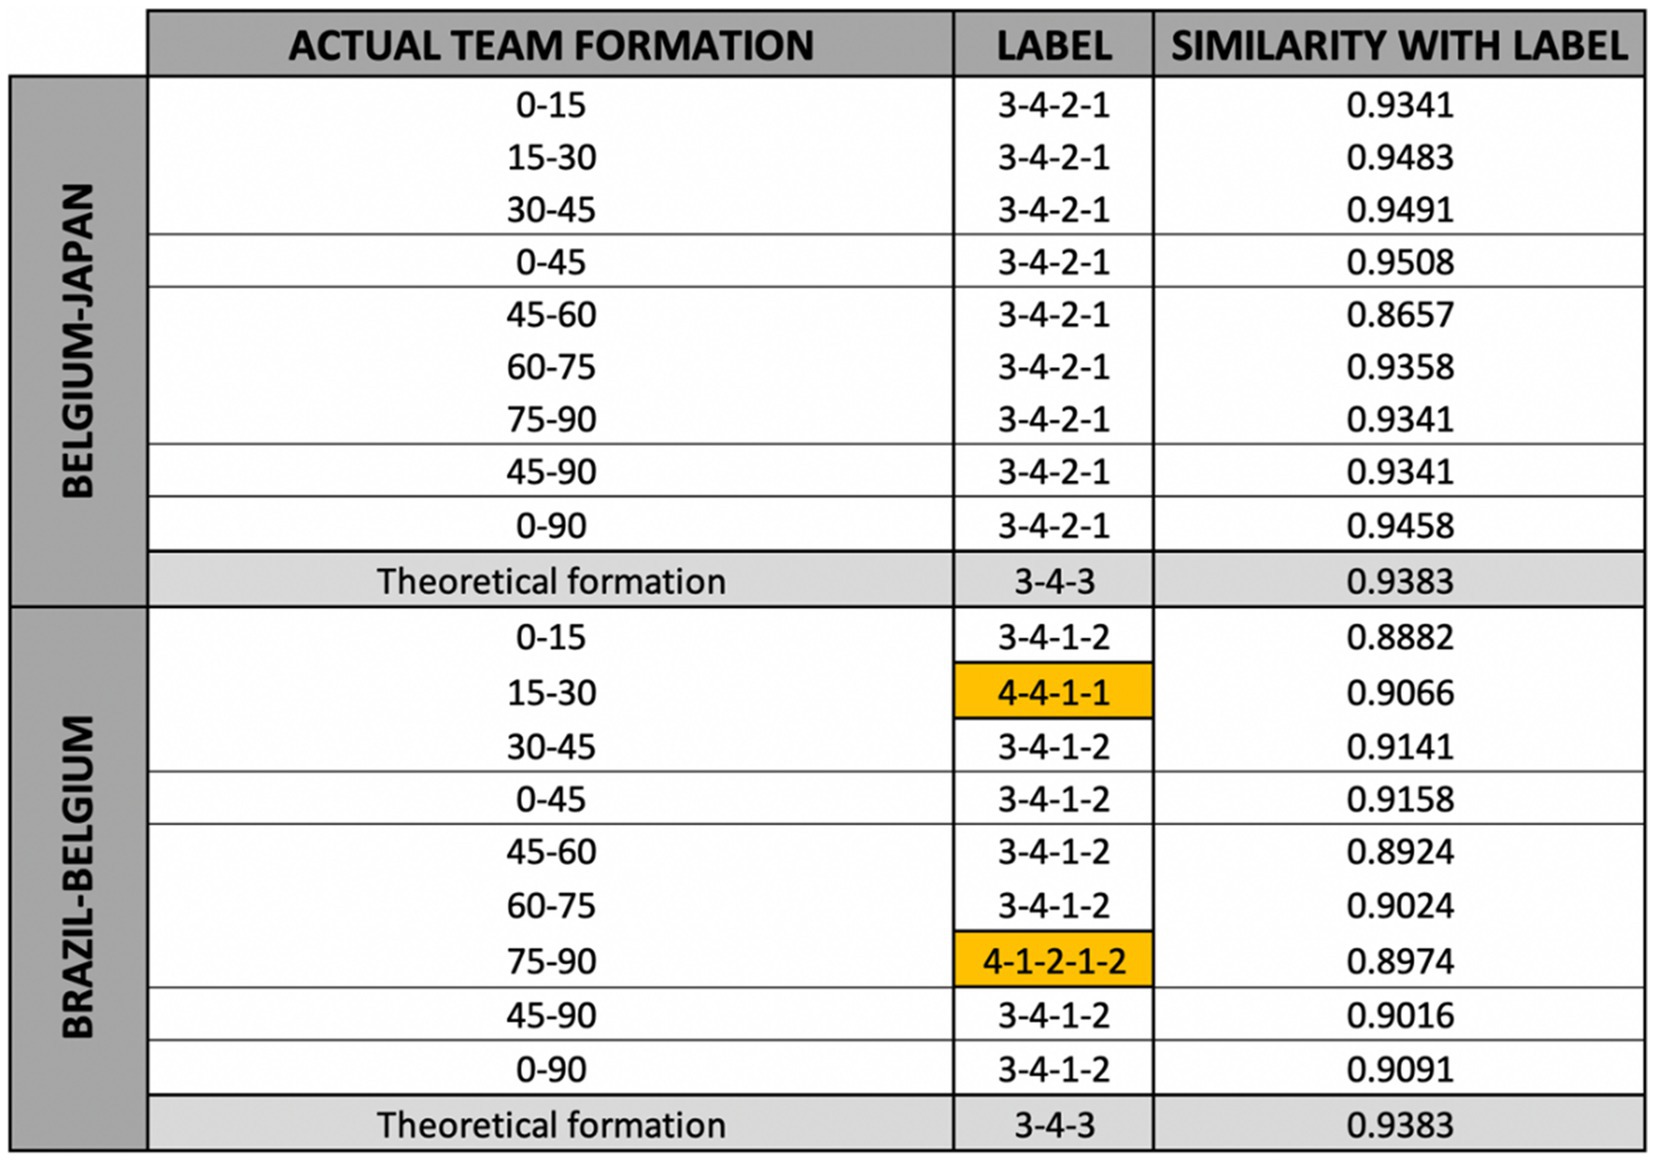
Figure 4. Results of the experiment showing the reference team formation with the highest similarity for each of the actual performed team formations of the Belgian national football team during two matches of the 2018 FIFA World Cup.
Although the use of QTCS for the analysis of team formations in football has been reported (Beernaerts et al., 2018), it is important to validate the results of this specific experiment. This section therefore focuses on the validation of the experimental results, as a more detailed methodological discussion of QTCS with respect to other established methods for team formation analysis can be found in Beernaerts et al. (2018). To get a good understanding of the different reference team formations, they are compared using QTCS. For this purpose, the distances between the QTCS representations of each pair of the 25 reference team formations are calculated and stored in a distance matrix, using the method presented in section Static Qualitative Trajectory Calculus. The resulting distance matrix is used as input for the hierarchical clustering (UPGMA; Sokal and Michener, 1958) presented in Figure 5.
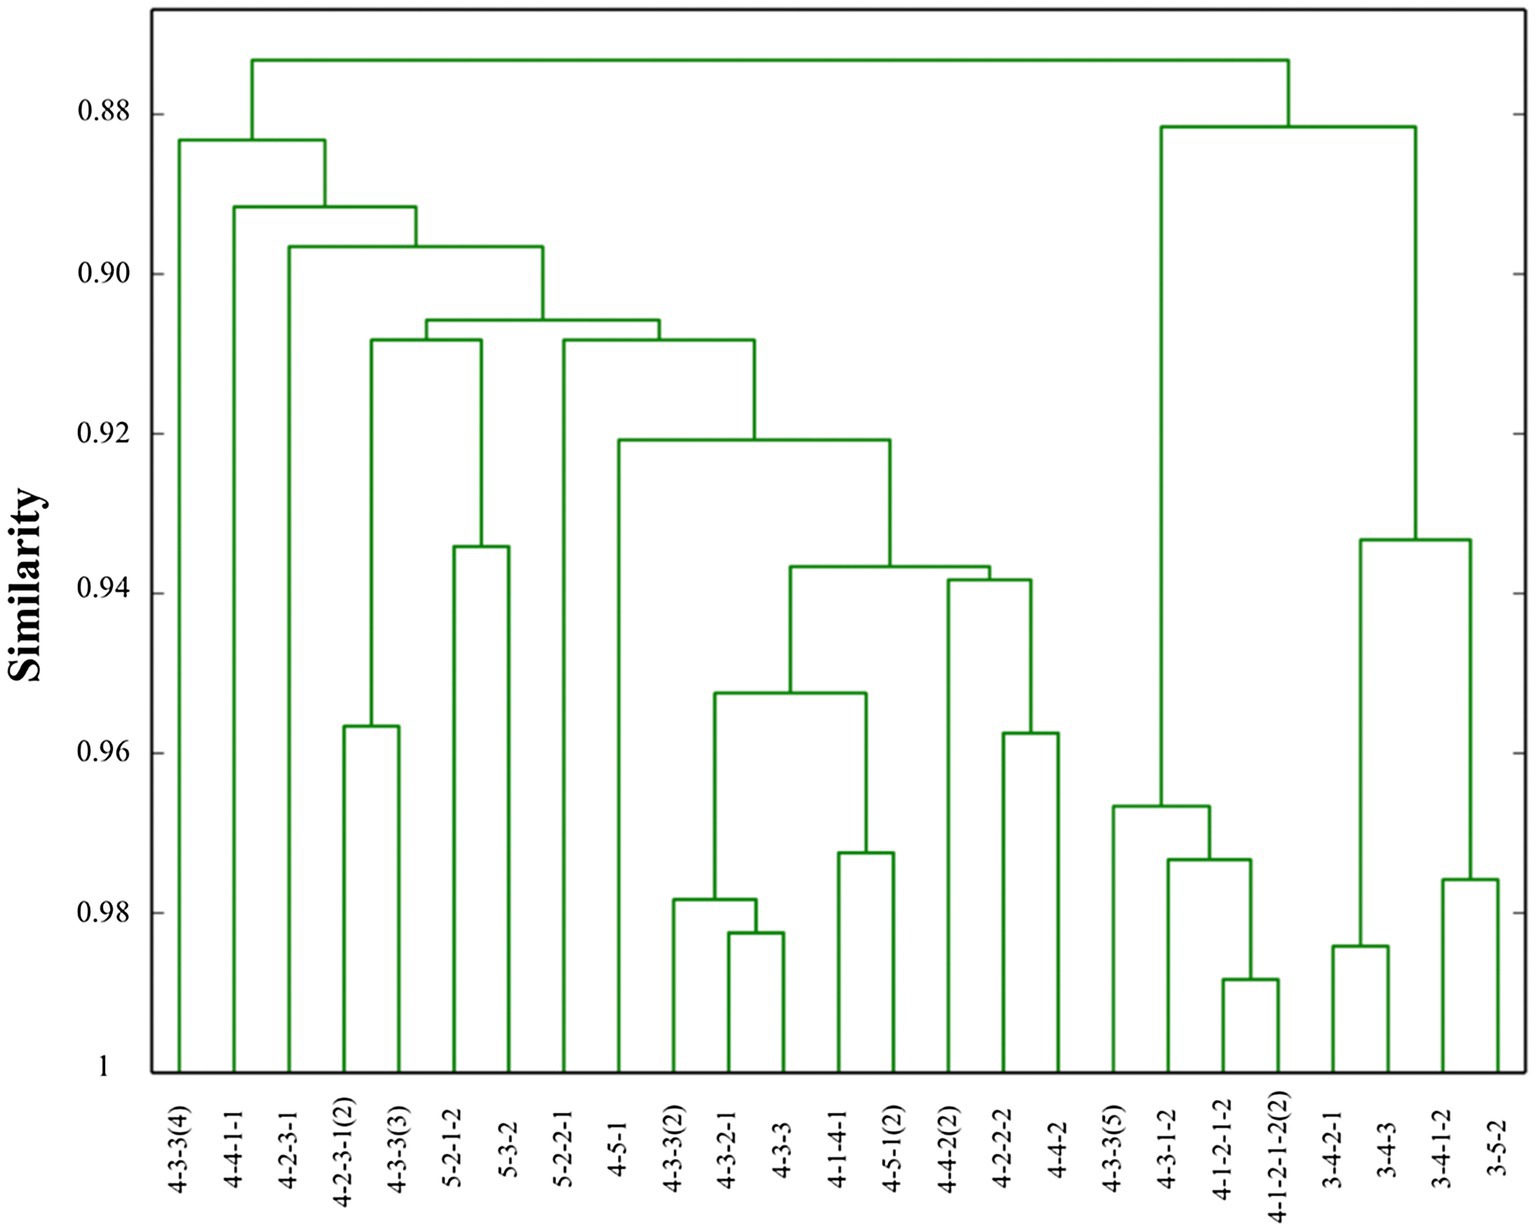
Figure 5. Hierarchical clustering (UPGMA) of the 25 reference team formations.
As Feuerhake (2016) argues, the validation of team formation analysis in football is a challenging task, mainly because of the lack of a good ground truth. As a first step of validation, it can be noted that the coach filed a 3-4-3 formation for both matches, which is very similar to the 3–4-3 variants that were detected for the whole match against Japan (3-4-2-1) and for the most part of the match against Brazil (3-4-1-2). Subsequently, match reports published by (objective) football experts in popular media can be used for further validation. In general, these reports mention that the Belgian national team played according to a 3-4-3 formation during the 2018 FIFA World Cup:
“Belgium, during qualifying for this tournament and at the World Cup itself, have played almost exclusively in an adventurous 3-4-3 formation that packs the pitch with attackers and seeks to dominate the ball.”—Hailsey (2018)
“And unlike the great, gritty 1980s’ Devils, this vintage plays gorgeous football…because Martinez has fielded all his creators, in a 3-4-3 formation.”—Financial Times (Kuper, 2018)
For the match against Japan, several popular sports media reported a 3-4-2-1 formation of the Belgian national football team (ESPN, 2018; Transfermarkt., 2018), similar to the results of the experiment (see Figure 4). Other media, however, reported that the Belgian national football team played according to the more general 3-4-3 formation during the match against Japan:
“Belgium started in a 3-4-3 and many senior players returned to the starting line-up from their game against England. Japan lined up in a 4-2-3-1.”—Business Standard (2018)
However, this match report includes a visual overview of what they refer to as the 3-4-3 formation (Business Standard, 2018). From this visual overview, it can be seen that this team formation much more resembles the 3-4-2-1 reference team formation than the 3-4-3 reference team formation that is used in this use case (see Figure 3). Indeed, from the visual overview it can be seen that the flank midfielders play higher and the flank attackers closer to each other than in the 3-4-3 reference team formation. For this reason, it can be assumed that in their tactical analysis, the analysts do not distinguish between the different variants of the 3-4-3 formation shown in Figure 3. Their report can therefore be seen as a positive validation of the results shown in Figure 4, especially considering the large number of reference team formations.
For the match against Brazil, various popular sports media reported that the Belgian national football team alternated between a defense with three defenders (in ball possession) and four defenders (when defending), in correspondence with the results of the experiment. Indeed, during the match against Brazil the team formation of the Belgian national football team differed quite a lot from the team formations of their previous matches:
“On one hand, Belgium coach Roberto Martinez stunned Brazil by using an entirely unexpected system, deploying key players in new roles and shifting smoothly between a three-man defence and a back four.”—Independent Newspaper (Cox, 2018)
“Head coach Roberto Martinez brought Marouane Fellaini and Nacer Chadli into Belgium’s starting line-up, with Dries Mertens and Yannick Carrasco dropping to the bench. They continued with their defensive back three when in possession, but often converted to a back four when defending.”—The Coaches Voice (2018)
Other reports go beyond describing the changing number of defenders and describe the adjustments made to the team formation, thus including all the players:
“As can be seen above, this structure occurred when De Bruyne dropped deep to create a 4-3-1-2 deep block in order to fashion a 4v3 against Neymar, Coutinho, and Marcelo.”—Outside of The Boot (Arvind, 2018)
Unfortunately, the 4-3-1-2 formation mentioned by Arvind (2018) is not included in the results shown in Figure 4. The 4-1-2-1-2 formation which is detected as label for the time interval between the 75th and the 90th minute, however, is very similar to the reported 4-3-1-2 formation (see Figure 5). Looking at the time interval between the 15th and the 30th minute, the 4-4-1-1 formation label cannot be explained by using the hierarchical clustering tree. Indeed, the 4-4-1-1 formation seems to have rather large distances with the expected formations (i.e., the 4-3-1-2 formation). Remarkably, the similarity with the label is rather low for this time interval (15th—30th minute) when compared to the other labels of this match and especially with the labels of the match against Japan. This means that the team did not play strictly according to one of the reference team formations. The importance of the label for this time interval should therefore not be overestimated. The strict definition of the time interval can be one of the reasons for this, as during a rather long period of 15 min a team can play according to multiple actual performed team formations that better match with one of the reference team formations. During these longer time intervals, however, the players’ coordinates are averaged, meaning that these labels with higher similarities might not be detected.
This experiment illustrates the use of QTCS for team formation analysis in football. One of the main benefits of this qualitative method is the fact that it maps the topology of the team formation. This allows to better deal with scale differences or small changes (or errors) in the positional data of the players, as discussed in Beernaerts et al. (2018).
Whereas the experiment presented in this paper illustrates the use of QTCS for team formation analysis in football by including an in-depth evaluation of its result for two football matches, the inclusion of more matches is required to use QTCS as a method for systematic observation in football (Anguera et al., 2019). This would eventually make it possible to define the playing style of a football team based on QTCS. Besides the application of the method to a larger number of football games, future work might also include, among others, the assessment of real-time applications of the QTCS method in football. A first example of this could be the evaluation of the performed team formation(s) during the first half of the match. This might allow coaches to give feedback to the players during the halftime break, in an attempt to optimize team performance during the second half of the match. Indeed, as the calculations for the experiment of this paper were performed on a dual-core (2.1 Ghz) laptop with 4 Gigabyte of RAM memory and with a run-time of less than an hour, computers or servers with higher computational power could allow for such applications in the future. Additional measures, such as the calculation and the storage of QTCS representations of the reference team formations prior to the match, could further reduce complexity and speed up calculations.
The experiment described in this paper demonstrates the capabilities of the QTCS for analyzing team formations in real football. More specifically, the experiment was aimed at defining the team formations played by the Belgian national football team during two matches at the 2018 FIFA World Cup. From match reports published in popular media, it is apparent that QTCS can be used for the (automated) detection of the team formation adopted during different phases of the game.
The raw data supporting the conclusions of this article will be made available by the authors, without undue reservation.
All authors listed have made a substantial, direct, and intellectual contribution to the work and approved it for publication.
This research was funded by the Research Foundation Flanders, grant number 11ZN118N.
The authors declare that the research was conducted in the absence of any commercial or financial relationships that could be construed as a potential conflict of interest.
All claims expressed in this article are solely those of the authors and do not necessarily represent those of their affiliated organizations, or those of the publisher, the editors and the reviewers. Any product that may be evaluated in this article, or claim that may be made by its manufacturer, is not guaranteed or endorsed by the publisher.
Anguera, M. T., Blanco-villasenor, A., Jonsson, G. K., Losada, J. L., and Portell, M. (2019). Editorial: systematic observation: engaging researchers in the study of daily life as it is lived. Front. Psychol. 10, 1–3. doi: 10.3389/fpsyg.2019.00864
Anguera, M. T., Camerino, O., Castaner, M., Sanchez-Algarra, P., and Onwuegbuzie, A. J. (2017). The specificity of observational studies in physical activity and sports sciences: moving forward in mixed methods research and proposals for achieving quantitative and qualitative symmetry. Front. Psychol. 8:2196. doi: 10.3389/fpsyg.2017.02196
Aquino, R., Machado, J. C., Clemente, F. M., Praca, G. M., Goncalves, L. G. C., Melli-Neto, B., et al. (2019). Comparisons of ball possession, match running performance, player prominence and team network properties according to match outcome and playing formation during the 2018 FIFA World Cup. Int. J. Perform. Anal. Sport 19, 1026–1037. doi: 10.1080/24748668.2019.1689753
Arvind, O. (2018). Tactical analysis: Brazil 1-2 Belgium/Belgium nick a fortunate win through decisive counter attacks. Available at: http://outsideoftheboot.com/2018/07/08/tactical-analysis-brazil-1-2-belgium-belgium-nick-a-fortunate-win-through-decisive-counter-attacks (Accessed 19 April 2019).
Atmosukarto, I., Ghanem, B., Ahuja, S., Muthuswamy, K., and Ahuja, N. (2013). “Automatic recognition of offensive team formation in American Football plays.” in 2013 IEEE Conference on Computer Vision and Pattern Recognition. June 23, 2013; p. 991–998.
Ayanegui-Santiago, H. (2009). Recognizing team formations in multiagent systems: applications in robotic soccer. (eds.) N. T. Nguyen, R. Kowalczyk and S. M. Chen. Computational Collective Intelligence. Semantic Web, Social Networks and Multiagent Systems. Lect. Notes Comput. Sci. 5796, 163–173. doi: 10.1007/978-3-642-04441-0_14
Beernaerts, J., De Baets, B., Lenoir, M., De Mey, K., and Van de Weghe, N. (2018). “Analysing Team Formations in Football with the Static Qualitative Trajectory Calculus.” in Proceedings of the 6th International Congress on Sport Sciences Research and Technology Support. (eds). P. Pezarat-Correia, J. P. Vilas-Boas, O. Rivera and J. Cabri (Seville, Spain: Scitepress), 15–22.
Bialkowski, A., Lucey, P., Carr, P., Yue, Y., and Matthews, I. (2014). “Win at Home and Draw Away”: Automatic Formation Analysis Highlighting the Differences in Home and Away Team Behaviors.
Business Standard (2018). In a great footballing spectacle, Belgium win match, Japan hearts. FT 3-2. Available at: https://www.business-standard.com/article/sports/fifa-world-cup-2018-belgium-vs-japan-live-score-updates-hazard-lukaku-kagawa-play-round-of-16-watch-free-live-streaming-fixtures-schedule-of-world-cup-in-russia-118070200689_1.html (Accessed April 25, 2019).
Carling, C. (2011). Influence of opposition team formation on physical and skill-related performance in a professional soccer team. Eur. J. Sport Sci. 11, 155–164. doi: 10.1080/17461391.2010.499972
Cox, M. (2018). World cup 2018: Belgium out-tactic Brazil to reach semi-finals as Roberto Martinez channels his channels his Everton days. Available at: https://www.independent.co.uk/sport/football/world-cup/world-cup-2018-belgium-vs-brazil-tactics-roberto-martin-everton-romelu-lukaku-eden-hazard-a8436056.html (Accessed April 19, 2019).
ESPN (2018). Chadli late show sees Belgium past Japan. Available at: http://www.espn.com/soccer/match?gameId=498149 (Accessed April 23, 2019).
Feuerhake, U. (2016, 208). Recognition of repetitive movement patterns-the case of football analysis. Int. J. Geogr. Inf. 5. doi: 10.3390/ijgi5110208
FIFA (2018). 2018 FIFA WORLD CUP RUSSIA. Available at: https://www.fifa.com/worldcup/matches/ (Accessed December 14, 2018).
FifaUTeam (2016). FIFA 16 ultimate team formations guide. Available at: https://www.fifauteam.com/fifa-16-ultimate-team-formations/ (Accessed April 12, 2018).
Football Bible (2014). Old football formations. Available at: https://www.football-bible.com/soccer-info/old-football-formations.html (Accessed March 14, 2019).
Frencken, W., de Poel, H., Visscher, C., and Lemmink, K. (2012). Variability of inter-team distances associated with match events in elite standard-soccer. J. Sports Sci. 30, 1207–1213. doi: 10.1080/02640414.2012.703783
Gonçalves, B., Esteves, P., Folgado, H., Ric, A., Torrents, C., and Sampaio, J. (2017). Effects of pitch area-restrictions on tactical behaviour, physical, and psychological performances in soccer large-sided games. J. Strength Cond. Res. 31, 2398–2408. doi: 10.1519/JSC.0000000000001700
Gonçalves, B., Figueira, B. E., Maçãs, V., and Sampaio, J. (2014). Effect of player position on movement behaviour, physical and physiological performances during an 11-a-side football game. J. Sports Sci. 32, 191–199. doi: 10.1080/02640414.2013.816761
Hailsey, B. (2018). Belgium and Brazil just put on the best show of the World Cup. Available at: https://deadspin.com/belgium-and-brazil-just-put-on-the-best-show-of-the-wor-1827406328 (Accessed April 23, 2019).
Jäger, M. J., and Schöllhorn, W. I. (2012). Identifying individuality and variability in team tactics by means of statistical shape analysis and multilayer perceptrons. Hum. Mov. Sci. 31, 303–317. doi: 10.1016/j.humov.2010.09.005
Kaminka, G. A., Fidanboylu, M., Chang, A., and Veloso, M. M. (2003). Learning the sequential coordinated behavior of teams from observations. In G. A. Kaminka, P. U. Lima, and R. Rojas (Eds.). RoboCup 2002: Robotic Soccer World Cup VI. Lecture Notes in Computer Science, 111–125. (Berlin, Heidelberg: Springer).
Kuhlmann, G., Stone, P., and Lallinger, J. (2005). “The UT Austin villa 2003 champion simulator coach: A machine learning approach,” in RoboCup 2004: Robot Soccer World Cup VIII. Lecture Notes in Computer Science, 3276. eds. D. Nardi, M. Riedmiller, C. Sammut, and J. Santos-Victor (Berlin, Heidelberg: Springer), 636–644.
Kuper, S. (2018). Adaptable Red Devils give Belgium best shot at winning the World Cup. Available at: https://www.ft.com/content/70abbff8-7d37-11e8-bc55-50daf11b720d (Accessed April 25, 2019).
Low, B., Rein, R., Schwab, S., and Memmert, D. (2021). Defending in 4-4-2 or 5-3-2 formation? small differences in footballers’ collective tactival behaviours. J. Sports Sci. 40, 351–363. doi: 10.1080/02640414.2021.1993655
Lucey, P., Bialkowski, A., Carr, P., Morgan, S., Matthews, I., and Sheikh, Y. (2013). “Representing and discovering adversarial team behaviors using player roles.” in 2013 IEEE Conference on Computer Vision and Pattern Recognition. June 23, 2013; p. 2706–2713.
Lucey, P., Bialkowski, A., Carr, P., Yue, Y., and Matthews, I. (2014). “How to get an open shot”: Analyzing team movement in basketball using tracking data. Disney Research.
McCulloch, W. S., and Pitts, W. (1943). A logical calculus of ideas immanent in nervous activity. Bull. Math. Biophys. 5, 115–133. doi: 10.1007/BF02478259
Memmert, D., Lemmink, K. A. P. M., and Sampaio, J. (2017). Current approaches to tactical performance analysis in soccer. Sports Med. 47, 1–10. doi: 10.1007/s40279-016-0562-5
Müller-Budack, E., Theiner, J., Rein, R., and Ewerth, R. (2019). “Does 4-4-2 exist?”—: An analytics approach to understand and classify football team formations in single match situations. Proceedings of the 2nd International Workshop on Multimedia Content Analysis in Sports. p. 25–33.
Narizuka, T., and Yamazaki, Y. (2019). Clustering algorithm for formations in football games. Sci. Rep. 9:13172. doi: 10.1038/s41598-019-48623-1
Perin, C., Vuillemot, R., and Fekete, J. D. (2013). SoccerStories: a kick-off for visual soccer analysis. IEEE Trans. Vis. Comput. Graph. 19, 2506–2515. doi: 10.1109/TVCG.2013.192
Rein, R., and Memmert, D. (2016). Big data and tactical analysis in elite soccer: future challenges and opportunities for sports science. Springerplus 5:1410. doi: 10.1186/s40064-016-3108-2
Sampaio, J., and Macãs, V. (2012). Measuring tactical behaviour in football. Int. J. Sports Med. 33, 395–401. doi: 10.1055/s-0031-1301320
Sokal, R., and Michener, C. (1958). A statistical method for evaluating systematic relationships. Univ. Kans. Sci. Bull. 38, 1409–1438.
Stein, M., Janetzko, H., Breitkreutz, T., Seebacher, D., Schreck, T., Grossniklaus, M., et al. (2016). Director’s cut: analysis and annotation of soccer matches. IEEE Comput. Graph. Appl. 36, 50–60. doi: 10.1109/MCG.2016.102
Stein, M., Janetzko, H., Lamprecht, A., Breitkreutz, T., Zimmermann, P., Goldlücke, B., et al. (2018). Bring it to the pitch: combining video and movement data to enhance team sport analysis. IEEE Trans. Vis. Comput. Graph. 24, 13–22. doi: 10.1109/TVCG.2017.2745181
The Coaches Voice (2018). Tactical analysis: Brazil 1 Belgium 2. Available at: https://www.coachesvoice.com/tactics-brazil-belgium-hazard-debruyne-fellaini-lukaku-neymar/ (Accessed 23 April 2018).
Transfermarkt. (2018). World Cup 2018: Belgium-Japan: Lineups. Available at: http://www.espn.com/soccer/match?gameId=498149 (Accessed April 23, 2019).
Van de Weghe, N., and De Maeyer, P. (2005). Conceptual neighbourhood diagrams for representing moving objects. Lect. Notes Comput. Sci. 3770, 228–238. doi: 10.1007/11568346_25
Visser, U., Drücker, C., Hübner, S., Schmidt, E., and Weland, H. G. (2001). “Recognizing formations in opponent teams,” in RoboCup 2000: Robot Soccer World Cup IV. Lecture Notes in Computer Science. eds. P. Stone, T. Balch, and G. Kraetzschmar (Berlin, Heidelberg: Springer).
Keywords: football, team formation analysis, team behavior, QTC, World Cup
Citation: Beernaerts J, De Baets B, Lenoir M and Van de Weghe N (2022) Qualitative Team Formation Analysis in Football: A Case Study of the 2018 FIFA World Cup. Front. Psychol. 13:863216. doi: 10.3389/fpsyg.2022.863216
Edited by:
Joel Correa Da Rosa, Icahn School of Medicine at Mount Sinai, United StatesReviewed by:
M. Teresa Anguera, University of Barcelona, SpainCopyright © 2022 Beernaerts, De Baets, Lenoir and Van de Weghe. This is an open-access article distributed under the terms of the Creative Commons Attribution License (CC BY). The use, distribution or reproduction in other forums is permitted, provided the original author(s) and the copyright owner(s) are credited and that the original publication in this journal is cited, in accordance with accepted academic practice. No use, distribution or reproduction is permitted which does not comply with these terms.
*Correspondence: Jasper Beernaerts, amFzcGVyLmJlZXJuYWVydHNAVUdlbnQuYmU=
Disclaimer: All claims expressed in this article are solely those of the authors and do not necessarily represent those of their affiliated organizations, or those of the publisher, the editors and the reviewers. Any product that may be evaluated in this article or claim that may be made by its manufacturer is not guaranteed or endorsed by the publisher.
Research integrity at Frontiers
Learn more about the work of our research integrity team to safeguard the quality of each article we publish.