 Jari Metsämuuronen
- Finnish National Education Evaluation Centre (FINEEC), Helsinki, Finland
Underestimation of reliability is discussed from the viewpoint of deflation in estimates of reliability caused by artificial systematic technical or mechanical error in the estimates of correlation (MEC). Most traditional estimators of reliability embed product–moment correlation coefficient (PMC) in the form of item–score correlation (Rit) or principal component or factor loading (λi). PMC is known to be severely affected by several sources of deflation such as the difficulty level of the item and discrepancy of the scales of the variables of interest and, hence, the estimates by Rit and λi are always deflated in the settings related to estimating reliability. As a short-cut to deflation-corrected estimators of reliability, this article suggests a procedure where Rit and λi in the estimators of reliability are replaced by alternative estimators of correlation that are less deflated. These estimators are called deflation-corrected estimators of reliability (DCER). Several families of DCERs are proposed and their behavior is studied by using polychoric correlation coefficient, Goodman–Kruskal gamma, and Somers delta as examples of MEC-corrected coefficients of correlation.
Introduction: Attenuation and Deflation in the Estimates of Reliability
Reliability of test score (REL) is used in several ways of which quantifying the amount of random error in a score variable generated by a compilation of multiple test items may be the most concrete one in the measurement modeling settings. The formula of the average standard error of the measurement is derived strictly from the basic definition of reliability , where , , and refer to the variances of the observed score variable (X) and the unobserved true score (T) and error (E) related to the classic relation of X = T + E (Gulliksen, 1950). Reliability is also used in assessing the (overall) quality of the measurement, in correcting the attenuation of the estimates of regression or path models, in correcting the attenuation in correlations in validity studies and meta-analyses, and for providing confidence intervals around these estimates (see, e.g., Gulliksen, 1950; Schmidt and Hunter, 2015; Revelle and Condon, 2018; Aquirre-Urreta et al., 2019). In all cases, the interest related to the accuracy of the estimates of reliability is understandable.
A less discussed challenge in the estimates by the traditional estimators of reliability is that their estimates may be radically deflated caused by artificial systematic errors during the estimation or attenuated as a natural consequence of random errors in the measurement (see the discussion of the terms in, e.g., Chan, 2008; Lavrakas, 2008; Gadermann et al., 2012; Revelle and Condon, 2018); deflation and its correction are the foci in this article. Empirical examples discussed later show that, in certain types of datasets, typically with very easy and very difficult tests and tests with incremental difficulty level including both easy and difficult items, the estimates of reliability may be deflated by 0.40–0.60 units of reliability (see, e.g., Zumbo et al., 2007; Gadermann et al., 2012; Metsämuuronen and Ukkola, 2019; see section “Practical Consequences of Mechanical Error in the Estimates of Correlation in Reliability”).
Guttman (1945) was the first to show the technical or mechanical underestimation in the estimators of reliability. He showed that all estimators in his family of estimators λ1 to λ6 underestimate the true population reliability. This result generalizes to such known estimators of reliability as Brown–Spearman prophecy formula (ρbs; Brown, 1910; Spearman, 1910), Flanagan–Rulon prophecy formula (ρFR; Rulon, 1939), coefficient alpha (ρα) generalized from Kuder and Richardson (1937) formula KR20 (ρKR20) by Jackson and Ferguson (1941) and later named by Cronbach (1951), and estimators called the greatest lower bound (ρGLB; e.g., Jackson and Agunwamba, 1977; Woodhouse and Jackson, 1977) because these are all special cases of λ1−λ6. Hence, using these estimators, the true (population) reliability is always underestimated. Later, Novick and Lewis (1967) pointed out that the underestimation related to the measurement modeling holds if the true values (taus) are not essentially identical and the error components related to the test items do not correlate (see the discussion also in Raykov, 2012; Raykov and Marcoulides, 2017).
Since Guttman (1945), the underestimation in ρα has been handled in numerous studies and it has been connected to, among others, a simplified assumption of the classical test theory including unidimensionality, violations in tau–equivalence and latent normality, and uncorrelated errors (see discussion in, e.g., Green and Yang, 2009, 2015; Trizano-Hermosilla and Alvarado, 2016). Some scholars have been ready even to reject ρα for all (see, e.g., Yang and Green, 2011; Dunn et al., 2013; Trizano-Hermosilla and Alvarado, 2016; McNeish, 2017) but the discussion is still going on. In many practical testing settings, even though better options are available, ρα may still be used as one of the lower bound estimators of reliability because the basic assumptions of alpha such as unidimensionality and uncorrelated errors are usually met (e.g., Metsämuuronen, 2017; Raykov and Marcoulides, 2017).
On the top of attenuation related to the measurement modeling, the estimates of reliability are also deflated—sometimes radically as discussed above. The root cause for the deflation is that the estimates by product-moment correlation coefficient (PMC; Pearson, 1896) embedded in the traditional estimators of reliability in the form of item–score correlation (Rit) or principal- or factor loading (λi) may be seriously deflated approximating 100% with items with extreme difficulty level and large sample size (see Metsämuuronen, 2020b,2021b). Deflation in PMC is caused by a phenomenon called here artificial systematic technical or mechanical error in the estimates of correlation (MEC). This phenomenon and its consequences are discussed in section “Mechanical Error in the Estimates of Correlation in PMC and some consequences.”
Replacing PMC in the estimators of reliability by a less-MEC-defected coefficient of correlation called later MEC-corrected estimators of correlation leads us to new kinds of estimators of reliability named here deflation-corrected estimators of reliability (DCER). DCERs can be divided into two types. One, focused on this article, are MEC-corrected estimators of reliability where PMC is replaced by a totally different estimator of correlation that is less prone to deflation than PMC. The other types of DCERs not discussed in this article could be called attenuation-corrected estimators of reliability; in these, PMC is replaced by relevant attenuation-corrected estimators of correlation. Some options for the latter are proposed by Metsämuuronen (2021c); attenuation corrected PMC and eta. The idea of DCER have been discussed (although not by this name) also, for instance, by Zumbo et al. (2007) and Gadermann et al. (2012) related to their ordinal alpha and ordinal theta; ordinal alpha and theta uses the matrix of inter-item RPCs instead of PMCs in the calculations and those are special cases of DCERs.
The crucial role of item–total correlation in the deflation of reliability has been discussed during the years (e.g., Metsämuuronen, 2009, 2016, 2017)1 and some options of corrected estimators of reliability have been initially suggested, however, without further studies of their behavior (see, e.g., Metsämuuronen and Ukkola, 2019; Metsämuuronen, 2020a,b, 2021b). According to simulations (see, e.g., Metsämuuronen, 2020b,2021b,2021d), some good alternatives for PMC are polychoric correlation coefficient (RPC; Pearson, 1900, 1913), Goodman–Kruskal gamma (G; Goodman and Kruskal, 1954), Somers delta (D; Somers, 1962), dimension-corrected G and D (G2 and D2; Metsämuuronen, 2020a,2021b) and bi- and polyreg correlation (see Livingston and Dorans, 2004; Moses, 2017). Notably, first, some estimators of item–score correlation may be found equally good alternatives or even better than RPC, G, or D. Second, although it seems that nonparametric coefficients of correlation based on order of the cases would be the best options for PMC, this is not categorically true. Of nonparametric options, Kendall’s tau-a (Kendall, 1938) and tau-b (Kendall, 1948), as examples, tend to underestimate true correlation even more than PMC (see Kendall, 1949; Metsämuuronen, 2021d; see Figure 1).
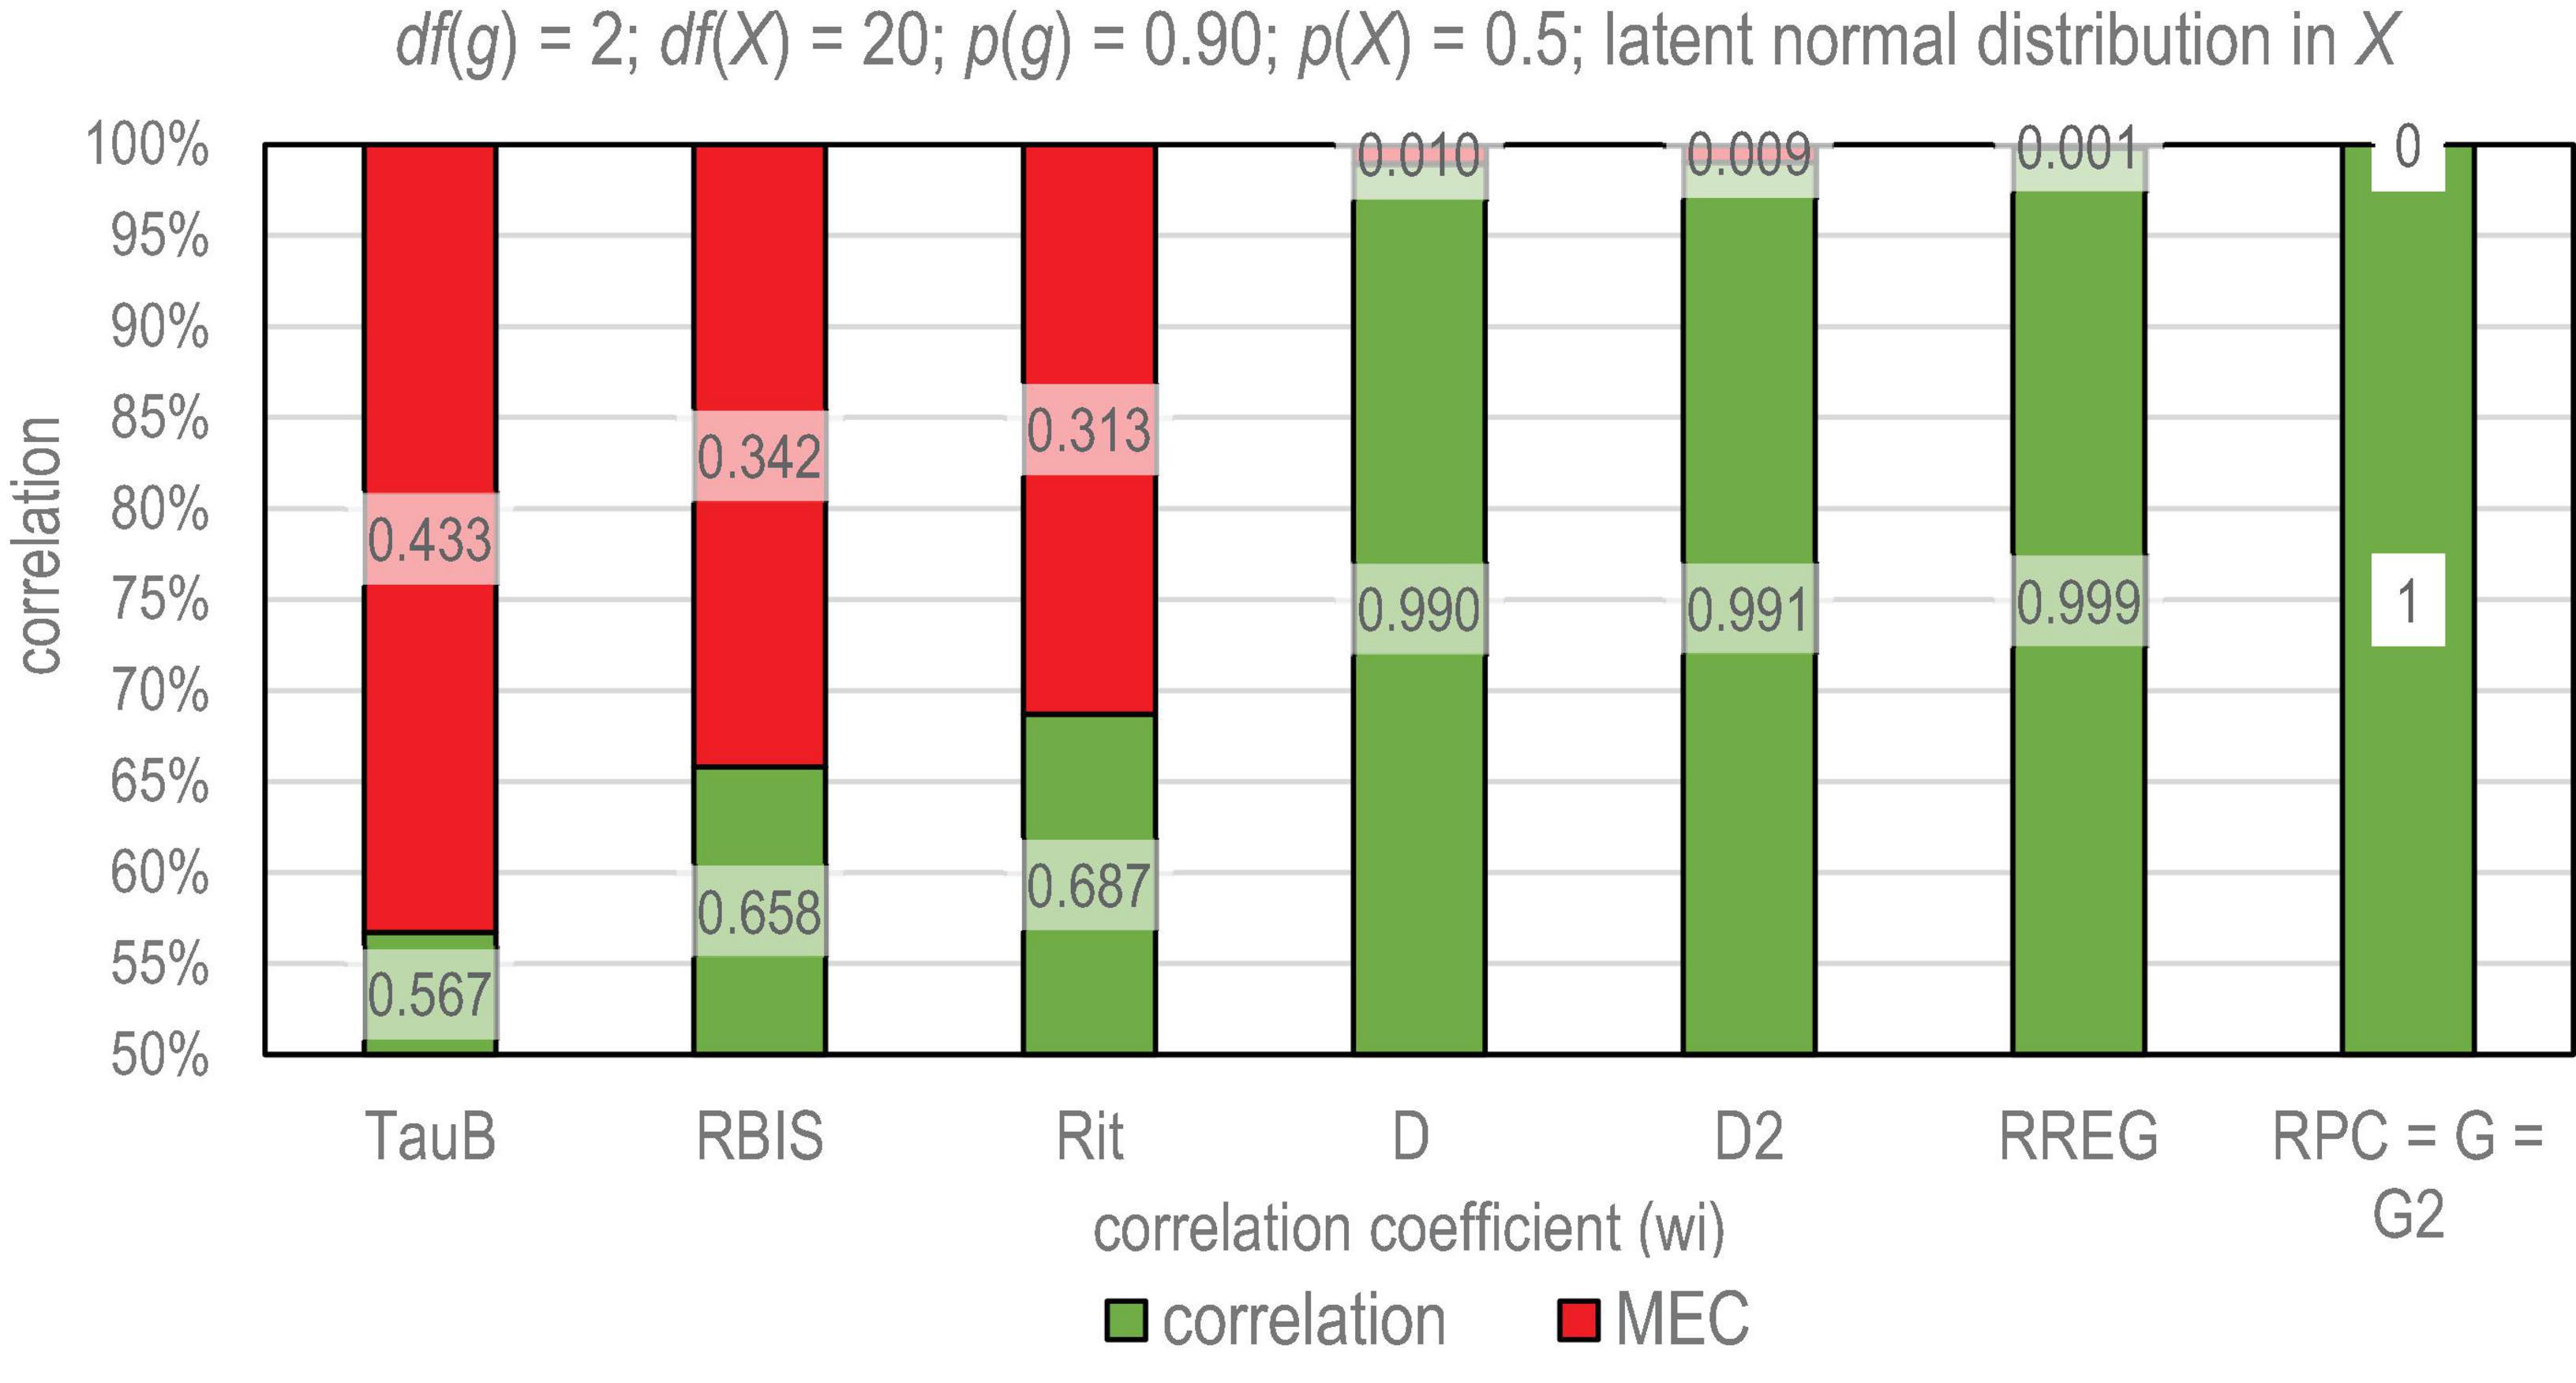
Figure 1. Magnitude of deflation in different estimators. TauB, Kendall tau-b; Rit, PMC; RBIS, biserial correlation; D, Somers delta (X dependent); D2, dimension-corrected D; RREG, r-polyreg correlation; RPC, polychoric correlation; G, Goodman-Kruskal gamma; G2, dimension-corrected G.
This article discusses the mechanisms of how the deflation related to coefficients of correlation causes deflation in the estimates of reliability and proposes several concrete options to solve the problem. Numerical examples are given of their behavior. It is asked, what is the effect of changing an estimator with a high quantity of deflation with an estimator with remarkably less deflation in the estimates of reliability? Section “Mechanical Error in the Estimates of Correlation in Product–Moment Correlation Coefficient and Some Consequences” discusses PMC as the root cause of the deflation in reliability, section “Deflation-Corrected Estimators of Reliability” discusses the conceptual base of the DCERs, and sections “Materials and Methods” and “Results” give numerical examples of how the deflation in the estimates of reliability is reduced when using DCERs instead of the traditional estimators.
Mechanical Error in the Estimates of Correlation in Product–Moment Correlation Coefficient and Some Consequences
In measurement modeling settings, MEC refers to a characteristic of estimators of correlation to underestimate the true correlation between the test items (gi) and the latent trait θ manifested as a score variable (X) caused by artificial technical or mechanical reasons. In what follows, section “Product–Moment Correlation Coefficient, Mechanical Error in the Estimates of Correlation, and Deflation” discusses the overall effect of MEC in PMC, section “Sources of Mechanical Error in the Estimates of Correlation Affecting Deflation in Product–Moment Correlation Coefficient” discusses sources of MEC affecting deflation, section “Product–Moment Correlation Coefficient and the Estimators of Reliability” discusses how PMC is embedded in the estimators of reliability, and section “Practical Consequences of Mechanical Error in the Estimates of Correlation in Reliability” discusses what the effect of deflation in PMC in the estimates of reliability in the empirical dataset may be.
Product–Moment Correlation Coefficient, Mechanical Error in the Estimates of Correlation, and Deflation
The phenomenon of attenuation in the estimates by PMC is well-known. Pearson (1903) and Spearman (1904) may be the first scholars discussing the mechanical errors in estimators of correlation, while Brown (1910) and Spearman (1910) may be the first to connect this to reliability. All of them tried to find a solution to the known challenge in the estimates of correlation known today as restriction of range (see the literature in Sackett and Yang, 2000; Sackett et al., 2007;, Meade 2010). It is known that when only a portion of the range of values of the variable is actualized in a sample it leads to inaccuracy in the estimates of PMC, that is, the values are attenuated. Schmidt and Hunter (1999), specifically, discusses the need of utilizing the knowledge from attenuation correction when estimating measurement error.
Even if there was no obvious restriction of range obtained due to a reduced variance in the score variable within the sample, PMC underestimates the true correlation always if the scales of the variables are not equal (see algebraic reasons in, e.g., Metsämuuronen, 2017). This kind of deflation in PMC caused by mechanical reasons is easy to illustrate by two identical continuous variables with an obvious perfect correlation, ρXX = 1. If we dichotomize one to be a binary variable (item g) and polytomize the other to include several ordinal or interval-scaled bins (score X), PCM between these variables cannot reach the obvious true (perfect latent) correlation. Instead, the value depends, among others, on the cut-off where the ordered continuous variable is dichotomized to 0s and 1s, that is, of the item difficulty. If the cut-off is extreme, PMC approximates 0 irrespective of the fact that the true correlation between the variables was perfect (see simulation e.g., in Metsämuuronen, 2021b). Even at the highest, PMC cannot reach the perfect ρXX = 1; if there are no ties in the score, the highest value approximates 0.866.2 Then, because of deflation, the loss of information in PMC may vary 13–100% depending on the item difficulty and the sample size. This loss of information is illustrated in Figure 1.
To give a practical illustration of the magnitude of error caused by deflation of correlation by different estimators, let us consider the situation described above: two identical variables with (obvious) perfect correlation ρXX = 1. Let there be 1000 cases and a normal distribution in the original variables. One of the variables becomes an item g by categorizing it into three categories (0, 1, and 2; df(g) = 2) and the other is polytomized into 21 categories (score X, df(X) = 20). The cut points are arbitrary from the illustration viewpoint; let the average difficulty level of the item be p(g) = 0.90 (or, p(g) = 0.10) that is, we have a very easy (or difficult) item, and the test score be of a medium difficulty level, p(X) = 0.50. Figure 1 illustrates the differences between some known estimators of correlation; the estimators are discussed later with literature.
Knowing that the latent correlation is perfect, the magnitude of the correlation strictly indicates the amount of deflation. We note that, of the estimators in the example, tau-b, biserial correlation (Pearson, 1909), and PMC (Rit) cannot reach the (obvious) perfect correlation between the two versions of the same variable and, more, the magnitude of deflation is remarkable (0.43, 0.34, and 0.31 units of correlation, respectively). Of the estimators, D, D2, and RREG give far better approximations of the latent correlation even if there still is some error in the estimates (0.010, 0.009, and 0.001 units of correlation, respectively). In contrast, RPC, G, and G2 reach the perfect latent correlation, that is, there is no deflation in the estimates when it comes to difficulty level of the items. Notably though, there may be other factors causing deflation or underestimation of association. Some of these factors are discussed in what follows (see also Metsämuuronen, 2021d).
Sources of Mechanical Error in the Estimates of Correlation Affecting Deflation in Product–Moment Correlation Coefficient
By modifying the above example of two identical variables with relevant traditional coefficients of correlations such as RPC, G, and D, Metsämuuronen (2021b) concluded that PMC is affected (at least) by six sources of MEC: (1) Discrepancy in scales of the variables in general: PMC cannot reach the true (perfect) correlation between the item and the score when the dimensions of the variables differ from each other; (2) Item difficulty and item variance: the more extreme the item difficulty, the less variance, and the more underestimation in PMC. The loss of information approximates 100% with extremely easy and difficult items; (3) The number of categories in the item: the fewer the categories, the more underestimation in PMC; (4) The number of categories in the score: the fewer the categories, the lesser predictable the underestimation is; (5) The number of tied cases in the score: more there are tied cases in the score, lesser predictable the underestimation is. This is related to the sample size and the number of categories in the score (point 4); (6) The distribution of the latent variable: PMC underestimates the true correlation more if the latent variable is normal or skewed than in the cases of even distribution. These sources of the MEC are not the only possible ones although they are characteristics to PMC (see Metsämuuronen, 2021b).
Although rigorous studies have been done on these elements (e.g., Martin, 1973, 1978; Olsson, 1980; Anselmi et al., 2019; Metsämuuronen, 2021b) these tend to be fragmentary; systematic studies of the several elements of MEC would enrich our knowledge of the phenomenon. Notably, in all the six conditions above related to the attenuation in PMC, such benchmarking coefficients as RPC and G appeared to be MEC-free in the simulation (see Metsämuuronen, 2021b); the estimates reach the perfect correlation either strictly (G = 1) or asymptotically (RPC≈ 1) irrespective of the condition. D appeared to be less affected by MEC than PMC but not to the extent as RPC and G (see also Figure 1). The reason for the latter is that while RPC and G are not affected by the tied cases, D is, specifically, with short tests (see the differences of D and G also in Metsämuuronen, 2021a).
Product–Moment Correlation Coefficient and the Estimators of Reliability
PMC is deep-rooted to the practices within the test theory and measurement modeling settings. From the reliability viewpoint, on the one hand, PMC is strictly visible in such classic estimators as ρBS, ρFR, ρKR21, ρα, ρGLB, and λ1−λ6 discussed above. Common to these estimators is that the variance of the test score () inherited from the basic definition of reliability is visible in the formula3 and , on its behalf, can be expressed by using the item–score correlation (Rit = ρiX = PMC): (Lord et al., 1968) where k refers to number of items in the compilation and σito the standard deviations of partitions or items. Then, as an example, coefficient alpha can be expressed as (Lord et al., 1968):
On the other hand, PMC is embedded in the estimators based on factor- and principal component analysis because the factor- and principal component loadings (λi) are, essentially, correlations between an item and the score variable (e.g., Cramer and Howitt, 2004; Yang, 2010). This concerns such estimators of reliability as coefficient theta (ρTH; Armor, 1973; see also Lord, 1958; Kaiser and Caffrey, 1965), known also as Armor’s theta:
where λi are principal component loadings of the (first or only) principal component, coefficient omega (ρω; Heise and Bohrnstedt, 1970; McDonald, 1970), known also as McDonald’s omega total:
and coefficient rho, known also as maximal reliability (ρMAX) or Raykov’s rho (Raykov, 1997a,2004) based on the conceptualization suggested by Li et al. (1996) and Li (1997):
(e.g., Cheng et al., 2012) where λi are factor loadings.
From the traditional measurement modeling viewpoint (see, e.g., McDonald, 1999; Revelle and Condon, 2018) the forms in Eqs. (1) to (4) implicitly assume that ρiXand λi are deflation-free. However, on the one hand, ρiX is known to be severely deflated (see above). On the other hand, if we use the operationalization familiar in principal component analysis (PCA), exploratory factor analysis (EFA), and structural equation modeling (SEM) where λi is a principal component- or factor loading, assumption of deflation-free estimates is too optimistic assumption because λi is, essentially, a correlation between item and the factor (or principal component) score variable (Yang, 2010). That is, λi is (essentially) ρiX being deflated as discussed above.
Practical Consequences of Mechanical Error in the Estimates of Correlation in Reliability
The effect of MEC in deflation in the estimates of reliability may be remarkable. Two empirical examples are given. The first example comes from Gadermann et al. (2012) who report a dataset where, by using ordinal alpha (αORD; Zumbo et al., 2007), another kind of DCER based on replacing the inter-item matrix of PMCs by a matrix of RPCs, the estimate by ρα was deflated from 0.85 (αORD) to 0.46 (ρα), that is, 0.39 units of reliability which equals 46% (=0.85–0.46)/0.85).
Another example comes from a national level testing program of learning outcomes (n = 7,770; Metsämuuronen and Ukkola, 2019) where the preconditions of understanding the instruction language were assessed with a very easy 8-item, 11-point test. It was expected that only students with second language background in the instruction language would make mistakes in the test; of all test takers, 72% gave the full marks. The magnitude of the estimate of reliability by the traditional coefficient alpha was found to be ρα = 0.25 and by rho ρMAX = 0.48. By using a DCER based on Somers D where ρiXis replaced by D(i|X) = DiX in the formula of alpha (see later Eq. 23), the magnitude of deflation-corrected alpha was ρα_DiX = 0.86. Then, the magnitude of the estimate by ρα was deflated around 0.60 units of reliability (71%) and the estimate by ρMAX around 0.38 units of reliability (44%). The obvious reason for the remarkably higher estimate by ρα_DiX is that, in the case of binary items with extreme difficulty level, PMC as well as the factor loadings are severely attenuated while, in the binary case, D is less deflated. In both examples, the deflation in the estimates by the traditional estimators is remarkable. The latter example will be re-analyzed in section “Practical Example of Calculating Deflation-Corrected Estimators of Correlations Discussed in This Article” in details.
Deflation-Corrected Estimators of Reliability
Conceptual Base of the Deflation-Corrected Estimators of Reliability
Suggesting a radically new way of estimating reliability urges in-depth discussion of theoretical foundations of the new approach. However, here, the new concepts are built based on the traditional measurement models (see, e.g., McDonald, 1999; Cheng et al., 2012) which are, however, rethought and reconceptualized to also include the elements of deflation. Some further alternatives to consider for rethinking reliability are discussed in section “Options for Correcting the Deflation in Estimators of Reliability.” The effect of deflation is discussed here theoretically only to the extent that makes the notation in deflation-corrected estimators of reliability understandable.
Let wi be a general weight factor that links the observed values (xi) of an item gi with the latent variable θ manifested as a score variable:
generalized from the traditional one-latent variable model (e.g., McDonald, 1999; Cheng et al., 2012). It is relevant to assume that the weight factor wi is a coefficient of correlation (−1≤wi≤ + 1) such as Rit, RPC, G, or D, or principal component- or factor loadings (λi). Also, the latent variable θ may be manifested as varying types of relevantly formed compilation of items such as a raw score (θX), factor score variable (θFA), principal component score variable (θPC), a theta score formed by the item response theory (IRT) or Rasch modeling (θIRT), or a possible non-linear compilation of the items (θNonL).
Eq. (5) generalizes to the compilation of items as
where k is the number of items in the compilation. Eq. (6) corresponds with the classic relation of the observed score (X), true score (T), and error (E) in the classical measurement model, that is, X = T + E discussed above. To visualize the differences between different models, this general (congeneric, one-latent variable) model without considering the elements of deflation is as in Figure 2A.
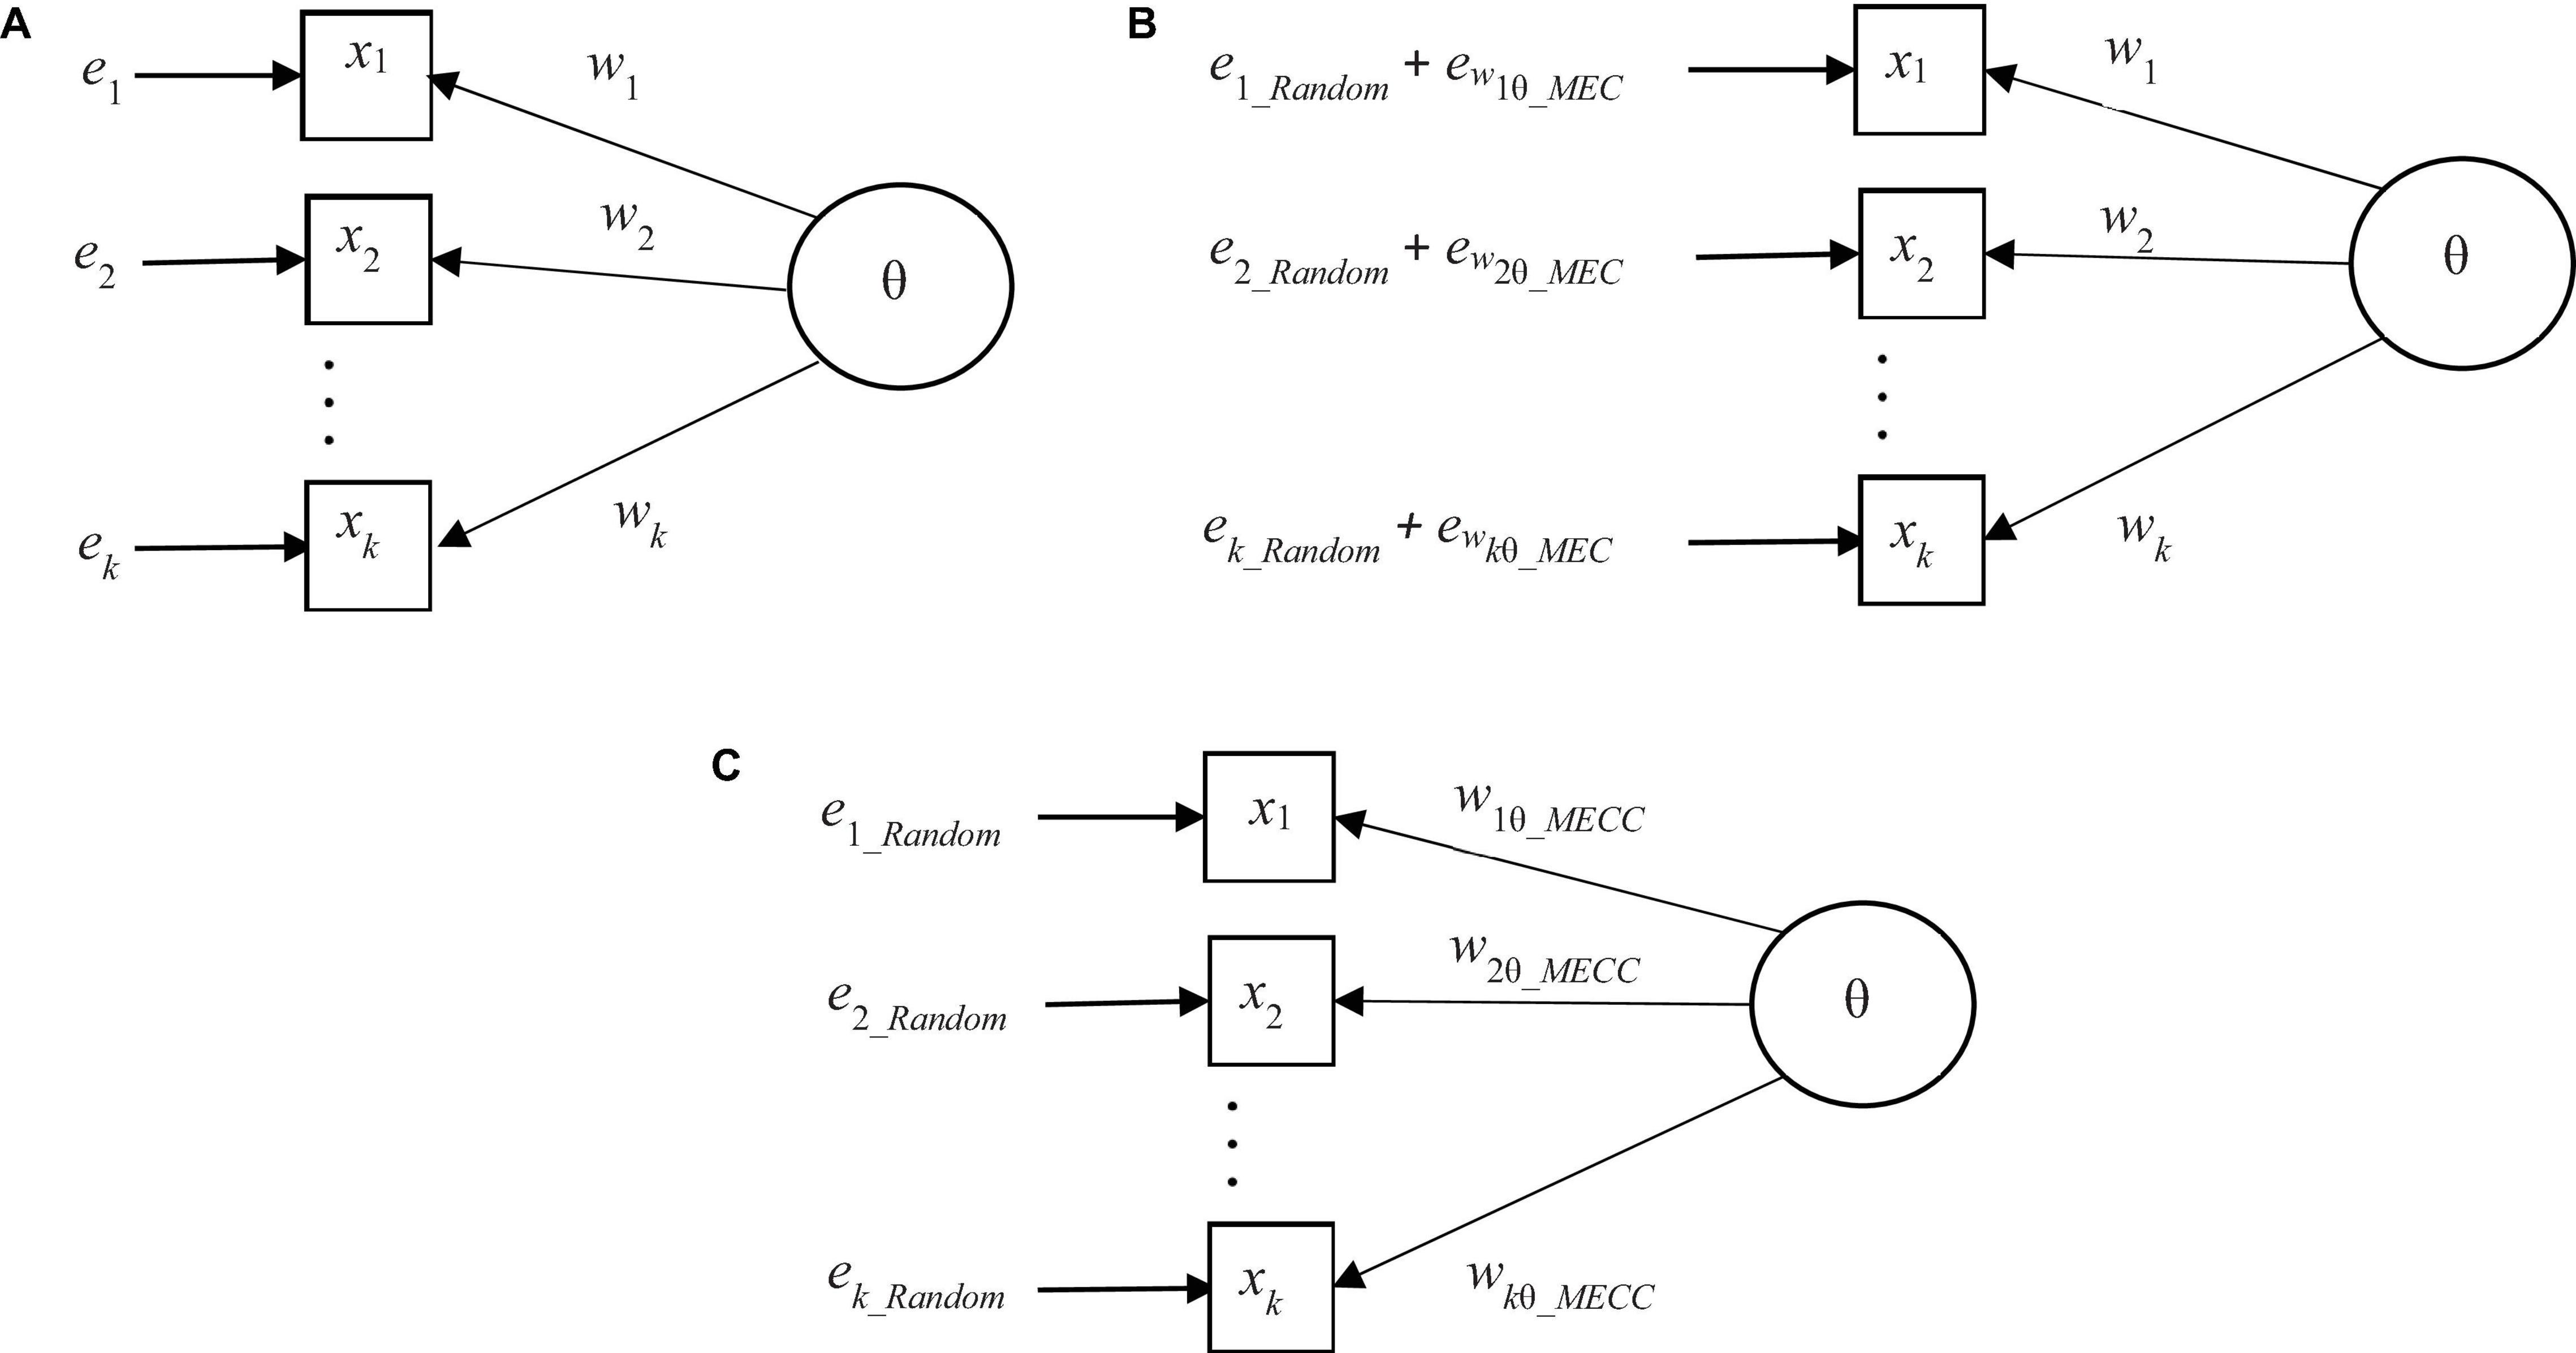
Figure 2. (A) A general one-factor measurement model without elements of related to deflation. (B) A general one-factor measurement model with elements of error related to deflation. (C) Deflation-corrected one-latent variable measurement model.
From the correlation viewpoint, knowing that all generally used estimators of correlation give identical estimates of the correlation for original variables and for the standardized versions of the variables, without loss of generality, we can assume that gi and θ are standardized, xi,θ∼N(0,1). Then, parallel to the traditional model (see e.g., Cheng et al., 2012), the error variance of the test score can be estimated as
Eq. (7) can be strictly used in estimating the reliability of the score variable (REL = ). If we use principal component loadings as the weight factor and principal component score as a manifestation of θ, the conceptualization of error variance in Eq. (7) is used strictly in ρTH (Eq. 2) and, when using factor loadings and factor score variable, it leads to such estimators as ρω and ρMAX (Eqs. 3 and 4).
The traditional estimators of reliability assume that Rit and factor/principal component loadings are deflation-free. This is a too optimistic assumption as discussed and illustrated above (see Figure 1). If the observed value of wi embeds deflation, as it typically does when using the traditional estimators of correlation and loadings, the magnitude of the observed correlation or loading by a deflated or MEC-defected (MECD) weight factor (wi_ MECD) is, obviously, lower than MEC-free (MECF) weight factor (wi_MECF), that is,
or
where the exact magnitude of the error element related to deflation in estimation (ewi_ MEC) is largely unknown although it is positive (ewi_ MEC > 0), and it depends on the characteristics of the item and the weight factor as discussed above. While knowing that a certain part of the measurement error is strictly technical or mechanical in nature, but its magnitude could be reduced, it makes sense to reconceptualize the classic relation of X = T + E into a form
where the element EMEC related to deflation is something we can deal with. Notably, this kind of “systematic error” is not a kind we usually consider as “systematic” such as a typo in the test item or some technical problem in processes (see Gulliksen, 1950; Krippendorff, 1970). The latter type of error is usually considered harmless from the reliability viewpoint and its effect is added to the random part of the error. Consequently, we can reconceptualize the measurement model in Eq. (5) as
where the notation ewiθ _ MECrefers to the fact that the magnitude of the deflation depends on the characteristics of the weighting factor w, item i, and the score variable θ. This model using a weight factor including radical deflation such as Rit or λi may be illustrated as in Figure 2B. Notably, the magnitude of the total error (ei_Random + ewiθ_MEC) is, factually, equal to the one seen in the model in Figure 2A. However, now the two components are just visual.
While knowing that some estimators of correlation are less deflated than some others, it makes sense to select such coefficient as the weighting factor where the quantity of technical or mechanical error would be as low as possible. However, it may be difficult to find an estimator of correlation without deflation, that is, that would be totally deflation- or MEC-free. In what follows, the concept of deflation-corrected and, specifically, MEC-corrected estimator (MECC) is used to refer such estimators where the deflation is known to be radically smaller than in PMC. If selecting wisely the weight factor, the magnitude of error component related to deflation may be near zero, that is, ewiθ_MEC≈0. If we use options of wi that would lead us to the condition of ewiθ_MEC≈0, because of Eq. (10), this will lead us to a model where the measurement error would be as near the MEC-free condition as possible, that is,
This measurement model where MEC-corrected weight factors such as RPC, G, or D are used, could be illustrated as in Figure 2C.
As with Eq. (7), knowing that all generally used estimators of correlation give identical estimate of the correlation for original variables (gi and θ) and for the standardized versions of the variables, we can assume that gi and θ are standardized, xi,θ∼N(0,1). Then, assuming that item-wise random errors do not depend on the true scores, the item-wise MEC-corrected error variance () is
that is, where . Then, after the deflation-correction, the Eq. (9) could be written as
and Eq. (10) as
Consequently, the deflation-corrected error variance of the test score can be written as
where the form corresponds to the traditional error variance
used in the traditional estimators of omega and rho in Eqs. (3) and (4) (see, e.g., Cheng et al., 2012). In the deflation-corrected estimators or reliability, instead of using factor- or principal component loadings we use deflation-corrected estimators of correlation.
Theoretical Deflation-Corrected Estimators of Reliability
By being open for different manifestations of wi and θ, some options for the base of the deflation-corrected estimators of reliability are theoretical deflation-corrected alpha based on Eq. (1):
theoretical deflation-corrected theta based on Eq. (2):
theoretical deflation-corrected omega based on Eq. (3):
and theoretical deflation-corrected rho based on Eq. (4):
where wiθ refers to the general model where the manifestations of θ may vary as well as the linking coefficient w and, obviously, the estimate varies item-wise. Obviously, using the estimators (17) to (20) outside of their original context of raw scores or principal component- and factor analysis is debatable. Here, a stand-point is taken that the forms could be used as stand-alone estimators even without their original contexts. This is consistent with a more general measurement model discussed above. Alternatively, the estimators (18) to (20) may be taken as an output of renewed procedures in the principal component- and factor analysis where wi is a less deflated estimator of correlation than the traditional principal component- and factor loading.
Examples of Practical Deflation-Corrected Estimators of Reliability
By combining the theoretical estimators in Eqs. (17) to (20) and different operationalizations of wi, we get varying families of deflation-corrected estimator of reliability. Let us assume that we do not fix the manifestation of θ, and we use such MEC-corrected weight factors as RPC, G and D directed so that “item given score” or D = D(i|X) usually labeled as “score dependent” in the common software packages (of the correct direction of D, see Metsämuuronen, 2020b). This leads us to such practical family of deflation-corrected estimators of reliability as deflation-corrected alpha based on Eq. (17) as
and
Because of using totally different type of estimator than PMC, these could be called special types of DCERs, namely, MEC-corrected estimators of reliability. If using some relevant attenuation-corrected estimator of correlation (see some options in Metsämuuronen, 2021c), a family of attenuation-corrected alpha would be obtained.
The notation in names ρα_RPCiθ, ρα_Giθ, and ρα_Diθ refers to the facts that the base of the estimator is alpha (α), the weight factor is manifested as RPC, G, or D representing different types of correlations between item and the score variable, and the manifestation of the score variable (θ) could be a raw score (θX) or factor score variable (θFA), as examples. Some of these kinds of estimators are discussed by Metsämuuronen and Ukkola (2019) and Metsämuuronen (2020b,2021a,2021b). Another type of solution is discussed by Zumbo et al. (2007) and Gadermann et al. (2012) by replacing the matrix of PMCs by a matrix of RPCs in forming the factor loadings; this leads to a coefficient called ordinal alpha discussed above.
More effective estimators than above are expected if coefficient theta (Eq. 18) is used as a base for the estimators and
RPC, G, and D as wi.4 We get a family of deflation-corrected theta based on Eq. (18):
and
or a family of deflation-corrected omega based on Eq. (19):
and
or a family of deflation-corrected rho based on Eq. (20):
and
These families could be called also MEC-corrected theta, omega, and rho. Notably, Zumbo et al. (2007) and Gadermann et al. (2012) also discuss the use of Armor’s theta as a basis for ordinal theta by replacing the matrix of PMCs by a matrix of RPCs in the estimation.
Many good or even better alternative could be found for RPC, G, and D considering that using RPC may lead us to challenges in interpreting the reliability as reflecting unobservable variables (see critique in Chalmers, 2017) and G tend to underestimate correlation when there are more than four categories in the item and D with three categories or more (see Metsämuuronen, 2021b). For the polytomous case, instead of G and D, the dimension-corrected G and D are suggested (Metsämuuronen, 2021b).
The characteristics of the estimators above are not discussed in-depth here; simulations would be beneficial in this matter. However, in the hypothetic extreme datasets with deterministic item discrimination in all items leading to RPCi = RPCj ≈ Gi = Gj = Di = Dj = 1,5 DCERs based on theta and omega would lead to perfect reliability: ρTH_RPCiθ≈ρTH_Giθ = ρTH_Diθ = k/(k−1)(1−1/k)≡1 and ρω_RPCiθ≈ρω_Giθ = ρω_Diθ = (k)2/((k)2 + 0)≡1. In the case, estimators (21) to (23) based on alpha can reach the value ρα_RPCiθ≈ρα_Giθ = ρα_Diθ = 1 only when all item variances are equal (σi = σi = σ), that is, for instance, when the items are standardized. In the case, k/(k−1)(1−kσ2/(k(σ×1))2) = k/(k−1)×(1−1/k)≡1. Otherwise, the maximum value is . Notably, in the deterministic case, estimators based on rho (Eqs. 30 to 32) could not be used because this would require division by zero which is not defined. Aquirre-Urreta et al. (2019) also noted that rho may produce overestimates of the true reliability with finite samples familiar in real-world testing settings. A practical reason for this is that the formula is sensitive to very high values of loadings. In small sample sizes familiar in the real-world datasets, the possibility to obtain deterministic or near-deterministic situation in one or several items increases. In deterministic patterns, ρMAX cannot be estimated at all and in the near-deterministic patterns the factor loading may be artificially high leading to obvious overestimation in reliability. In what follows in a numerical example, the outcomes based on the DCERs in Eqs. (21) to (23), (30) and (31) are illustrated and the traditional estimators (1) to (4) are used as benchmarks.
Materials and Methods
Dataset Used in the Numerical Example
As a simple numerical example, the dataset consisting of a set of 30 multiple choice questions forming 30 binary items and n = 49 randomly selected test-takers from a national level datasets of mathematics test (N = 4,023; FINEEC, 2018) representing small-scale tests with finite samples is used in illustrating the difference between the traditional estimators and deflation-corrected estimators of reliability. The dataset with estimates of different score variables and weight factors are in Supplementary Appendix 1.6
Measurement Model
The general measurement model discussed in section “Conceptual Base of the Deflation-Corrected Estimators of Reliability” is applied. By using the general one-factor model and by varying w and the operationalization of θ, examples of traditional and deflation-corrected estimates of reliability of the score are given by modifying mainly the form of rho (Eq. 20) with some benchmarking estimates by the form of alpha (Eq. 17).
Operationalizations of the Latent Variable and the Linking Factor
In the empirical section, five operationalizations for θ are used: an unweighted raw score (θX), a principal component score variable (θPC), a factor score variable by maximum likelihood estimation (θFA), a theta score by one-parameter IRT model or Rasch model (θIRT), and a nonlinear weighted score by a simple weighting factor 1/pi () where the test-takers are weighted by the proportion of correct answers pi; the more demanding item, the higher the weight.
Seven options as the weighting factor between θ and gi are used. First, traditional estimators used in the traditional estimators of reliability: Rit with θX, principal component loading with θPC, and ML-estimate of the factor loading with θFA; second, alternative coefficients RPC, G, and D for deflation-corrected estimators of reliability; and, third, the traditional PMC (later, R or Riθ) as a benchmarking coefficient for the DCERs when not using the traditional alpha. The statistics for and calculations of the estimates are collected in Supplementary Appendix 1.
Combining the operationalizations above, we get estimators of reliability related to five different scores and seven linking factors; only selected combinations are used (see condensed in Table 1).
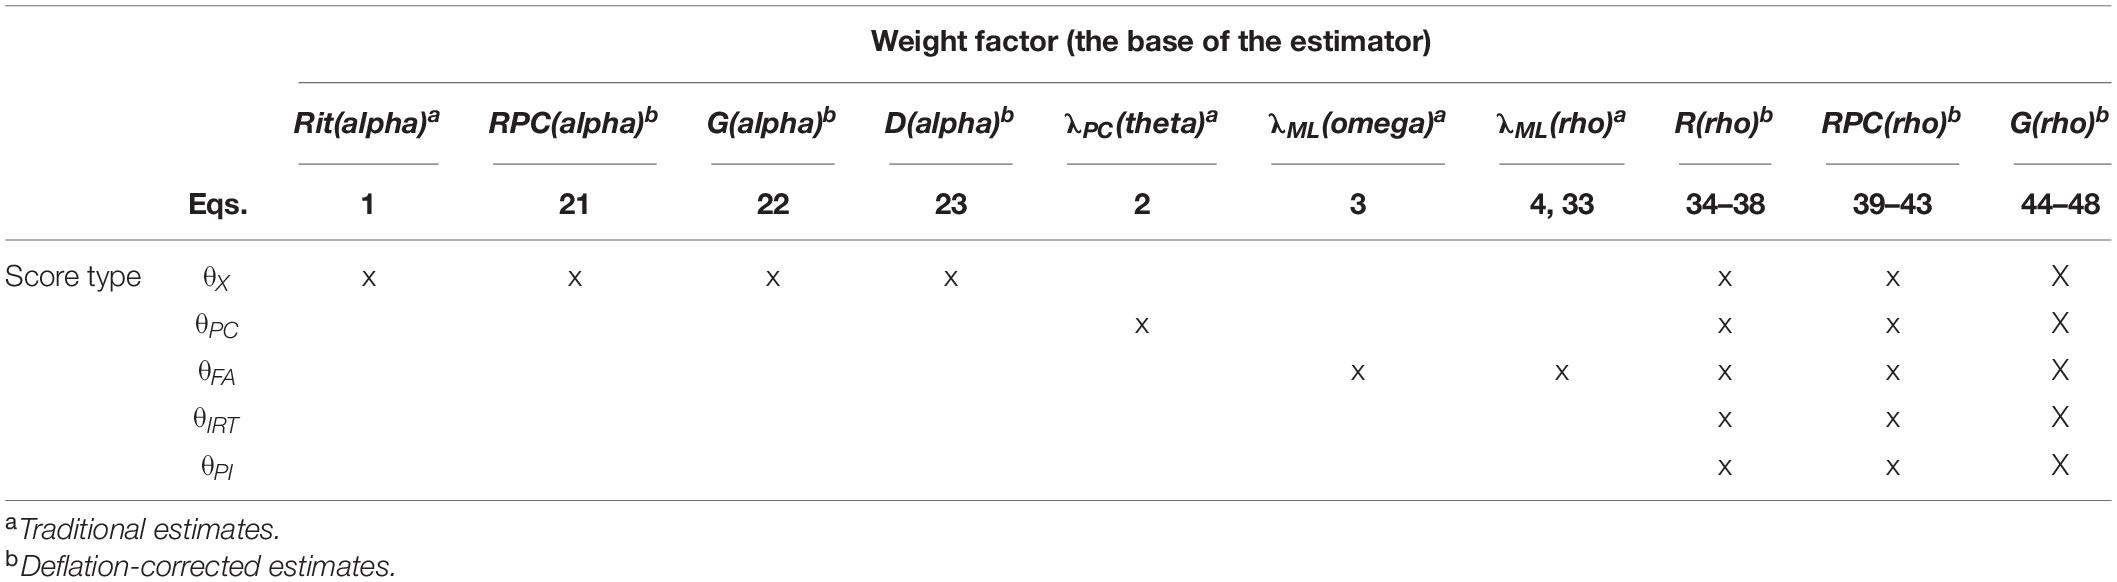
Table 1. Estimators of reliability covered in the empirical section.
First, traditional estimators (alpha, theta, omega, and rho; Eqs. 1–4) of which rho is re-notated here to match with the other estimators:
where the notation ρMAX_ λiθFArefers to facts that coefficient rho is the base of the coefficient (MAX), the manifestation of the score variable is the factor score variable (), and the manifestation of the weight factor is the ML-estimate of the factor loading (wi = λ_i =λ_iθFA).
Second, five estimators based on the form of rho and item–score correlation (ρiθ = Riθ) as the linking factor:
where the score is θX and wi = RiθX, (34)
where the score is θPC and wi = RiθPC,
where the score is θFA and wi = RiθFA,
where the score is θIRT and wi = RiθIRT, and
where the score is θPI and wi = RiθPI.
Third, the parallel estimators using RPC = RPCiθ as the linking factor:
where the score is θX and wi = RPCiθX,
where the score is θPC and wi = RPCiθPC,
where the score is θFA and wi = RPCiθFA,
where the score is θIRT and wi = RPCiθIRT, and
where the score is θPI and wi = RPCiθPI.
Fourth, the parallel estimators using G = Giθ as the linking factor:
where the score is and wi = GiθX,
where the score is θPC and wi = GiθPC,
where the score is θFA and wi = GiθFA,
where the score is θIRT and wi = GiθIRT,
and
where the score is θPI and wi = GiθPI.
Additionally, DCERs based on coefficient alpha (Eqs. 21–23) are used as benchmarks to the traditional estimators (see Table 1). Of the calculation of the estimates, see Supplementary Appendix 1.
Results
Eight outcomes of the comparison are worth highlighting. First, of the estimators based on the form of rho (Eqs. 33 to 48), the ones using RPC and G as the linking factor give notably higher estimates (0.961–0.968) in comparison to those using PMC (0.894–0.909) and traditional factor- or principal component loadings (ρMAX = 0.894, ρω = 0.864, ρTH = 0.879) or alpha (ρα = 0.862) (Table 2). This is caused by the better behavior of RPC and G in relation to deflation with the items with extreme difficulty levels in comparison to PMC (see Figure 3). The estimates of reliability based on RPC and G tend to be more deflation-free than those based on traditional principal component- and factor loadings or PMC, that is, eRit_MEC, eλi_MEC > > eRPCiθ_MEC≈ eGiθ_MEC. The possible overestimation by DCERs is discussed later.

Table 2. Comparison of the estimates of reliability.
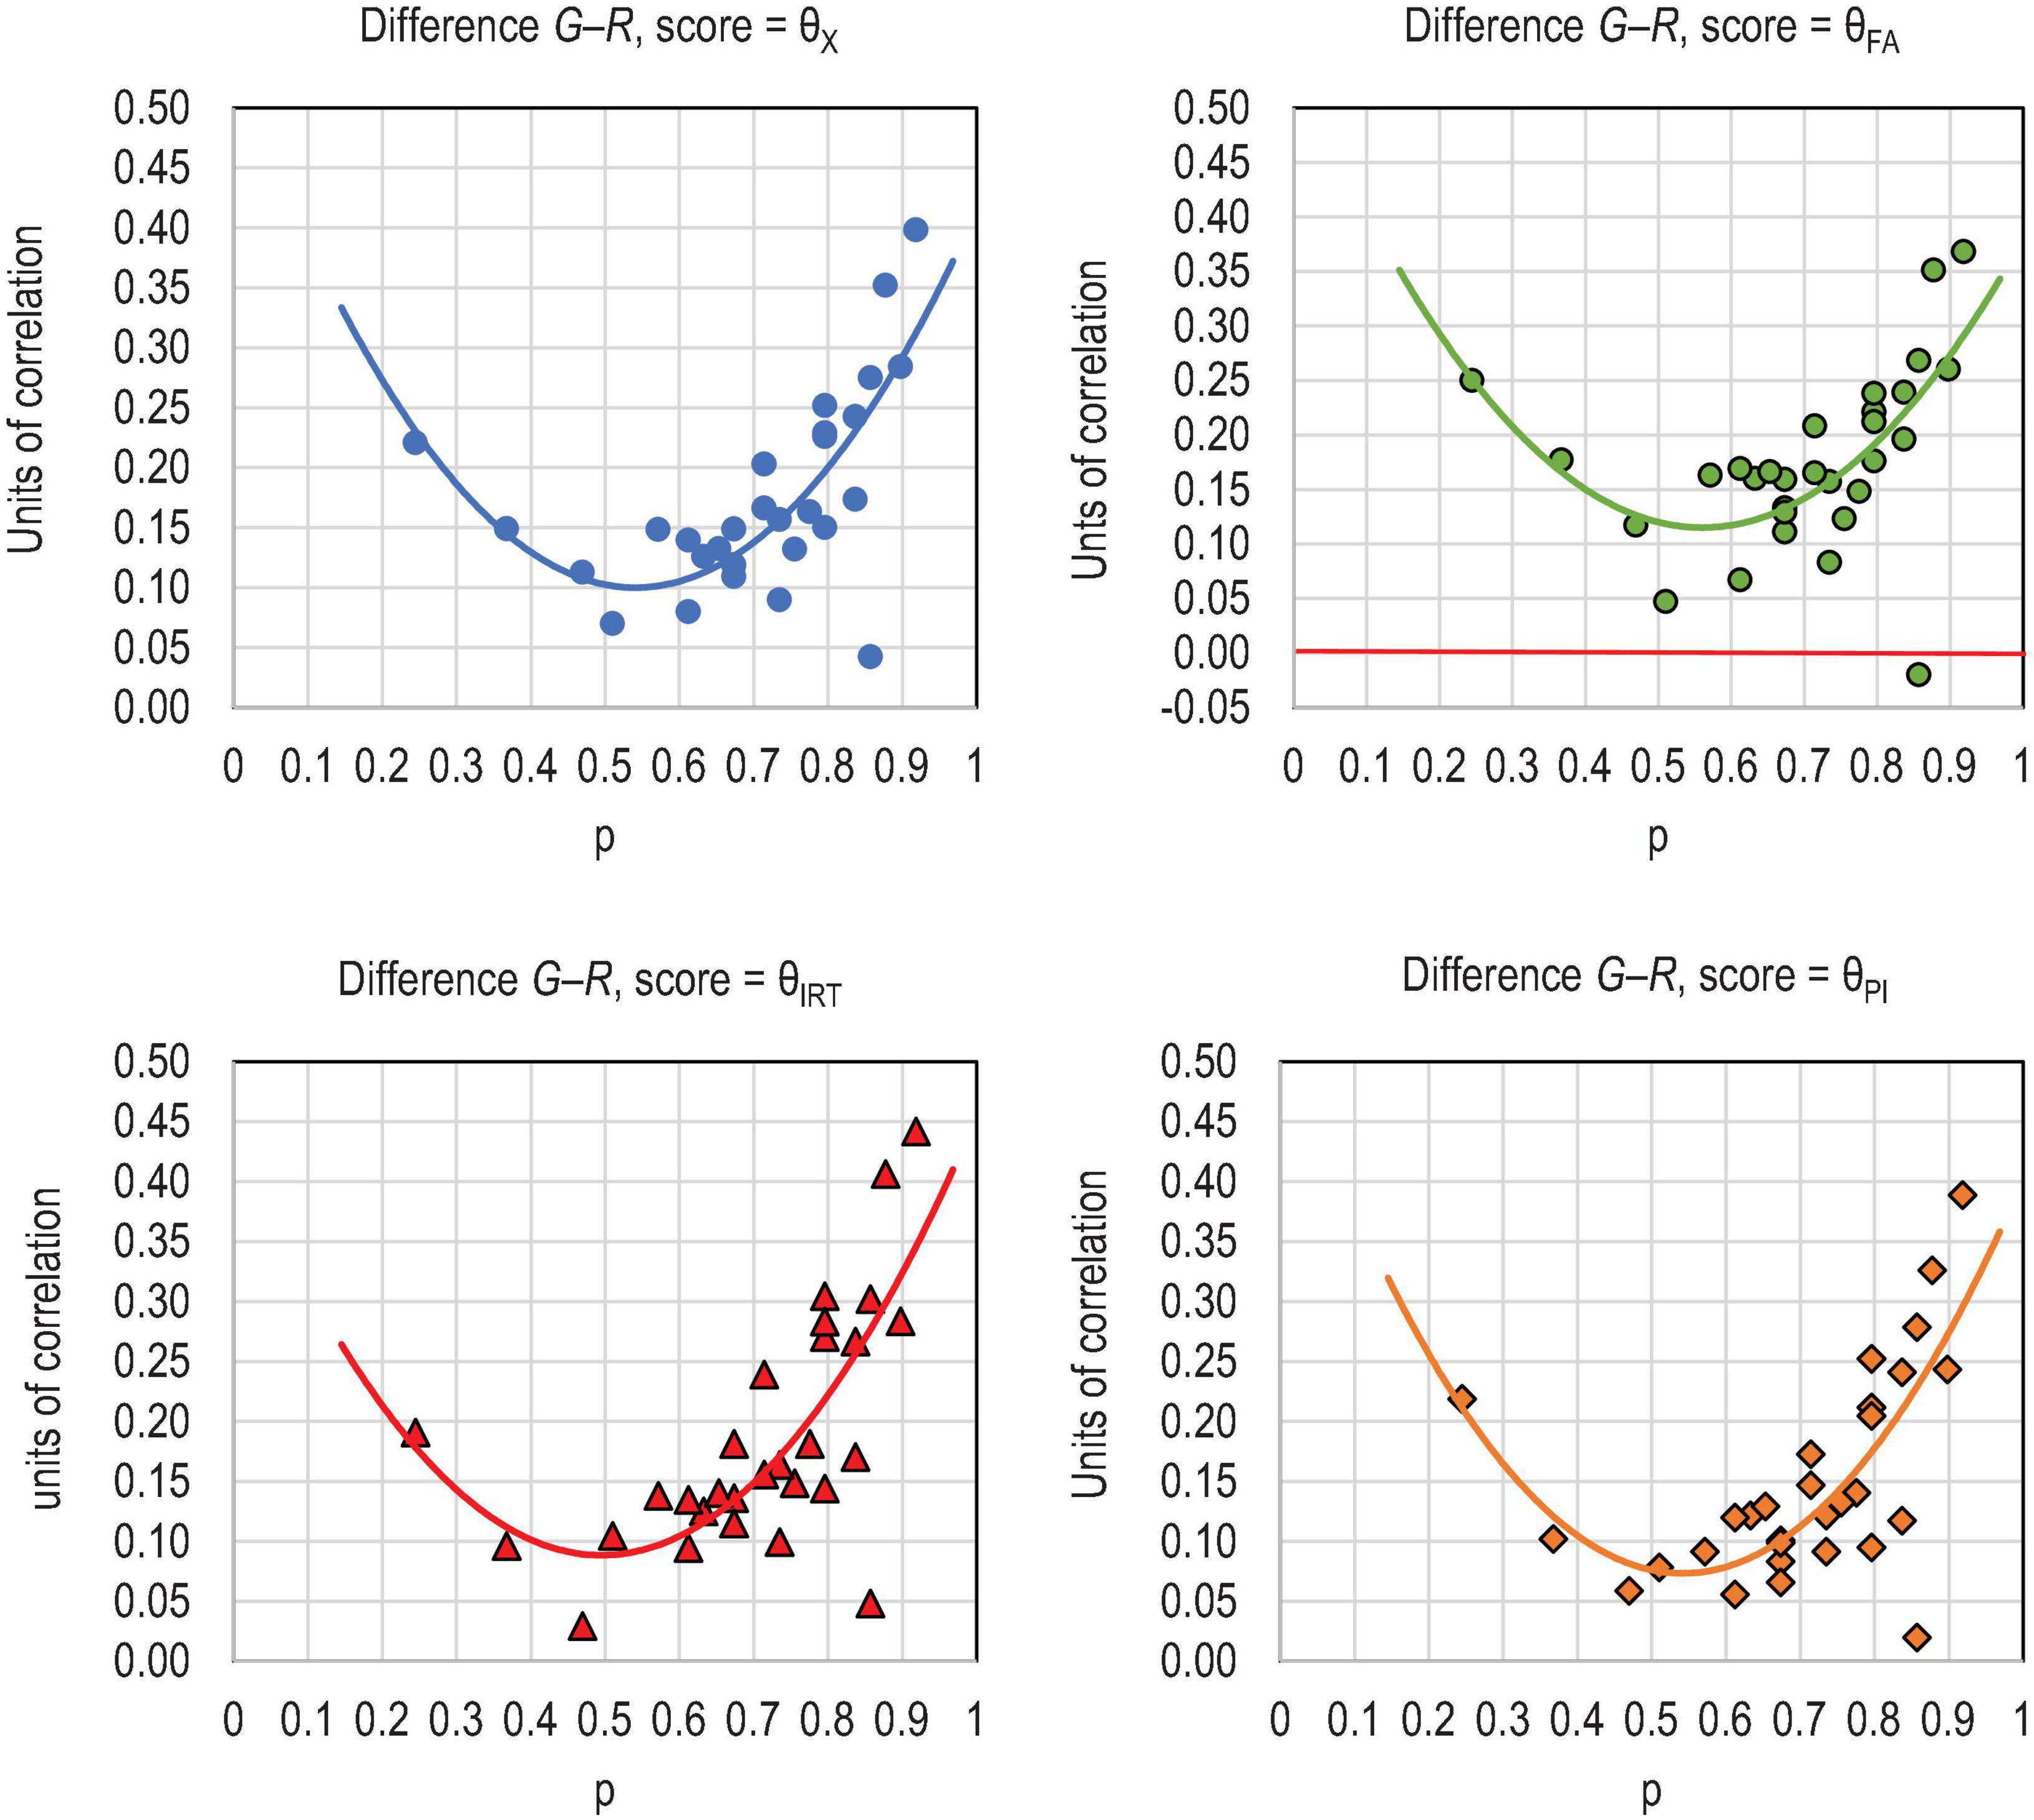
Figure 3. Difference between the estimates of item–score correlation by G and PMC (R).
Second, in comparison to the estimates by Eqs. (34) to (38) related to PMC (0.894–0.909) and the traditional ρMAX (0.894), the estimates by Eqs. (39) to (48) related to RPC and G tend to be close to each other (0.961–0.969) even though they indicate different aspects of the correlation. While RPC estimates the inferred correlation of the (unobservable) latent variables, G estimates the probability that the test takers are in the same order both in an item and a score. The same magnitude of the estimates may be interpreted to indicate that the estimators reflect the same deflation-free reliability of the test score.
Third, the magnitudes of the estimates by the traditional coefficients rho by Eq. (4)(ρMAX_λiθFA = ρMAX = 0.894), theta by Eq. (2) (ρTH = 0.879), and omega by Eq. (3) (ρω = 0.864) are higher than by the traditional coefficient alpha by Eq. (1) (ρα = 0.862). This is expected because only in the theoretical case that all the factor loadings or item–score correlations are equal, the magnitude of the estimates by ρα would reach those by the other estimates. However, it seems that ρMAX does not produce the “maximal” reliability per se for the given test. In the dataset at hand, even the traditional PMC between an item and the factor score variable would lead to a somewhat higher estimate (ρMAX_RiθFA = 0.909) than using the factor loadings nothing to say of the deflation-corrected estimates (ρMAX_RPCiθFA = 0.969 and ρMAX_GiθFA = 0.968). Hence, the thinking that “maximal reliability (in the form seen in Eq. 4) is the highest possible reliability that a test can achieve” (Cheng et al., 2012, p. 53 as an example), seems not be true in the absolute sense. Notably though, when using PMC and RPC as the linking factor, the score formed by the factor modeling, traditionally taken as the “optimal linear combination” of the items (see, Li, 1997), tends to have the highest reliability in comparison to the other types of score variables although the difference is not notable.
Fourth, coefficient alpha is known to underestimate the true reliability. By using the DCERs based on alpha, that is, Eqs. (21) to (23), the estimates are notably higher (, , and ), and these are not far from the estimates by the DCERs based on rho with the raw score ρMAX_RPCiθX = 0.963 by Eq. (39) and ρMAX_GiθX = 0.968 by Eq. (44). This seems to indicate that the reliability of the raw score may be closer than what we have thought to the ones manifested as the optimal linear combination of the items.
Fifth, obviously, the outcomes of forming the score differ radically from each other. On the one hand, the scores formed by PCA, EFA, and IRT modeling follow the standardized normal distribution while the raw score and the non-linearly weighted score differ from this logic. On the other hand, the score variables by PCA (θPC), EFA (θFA), and non-linear summing (θPI) do not include tied cases in the dataset; each test takers got their own category in θPC, θFA and θPI while the scores by IRT (θIRT) and the raw score (θX) have identical number of tied cases; in the one-parameter model used in the analysis, θIRT is a logistic transformation of θX. Consequently, the DCERs for the raw score (Eqs. 39 and 44) and for the IRT score (Eqs. 42 and 47) are identical (ρMAX_RPCiθX = ρMAX_RPCiθIRT = 0.963 and ρMAX_GiθX = ρMAX_GiθIRT = 0.968) because the order of the test takers remains the same in the logistic transformation. Regardless of the differences in the structure of the score variables, the estimators based on G as a linking factor produce estimates that are largely at the same magnitude of reliability with the scores by raw score, EFA, and IRT by Eqs. (44), (46), and (47): ρMAX_GiθX≈ρMAX_GiθFA≈ρMAX_GiθIRT≈0.968 and the differences are not wide either when using RPC (0.963–0.969). Notably, when using RPC and G as the linking factor, the score formed by EFA with no tied cases cannot discriminate the test-takers remarkably more accurately than the score with tied cases (θIRT or θX). This reflects the non-obvious fact that reliability of the score variable, in a sense of discriminating the test takers from each other, is not strictly connected with the number of tied values in the score variable nor the type of scale.
Sixth, the obvious reason for the higher magnitude of the estimates by DCERs using RPC and G in comparison to PMC is caused by the better behavior of RPC and G with items with extreme difficulty levels. With these kinds of items, specifically, PMC is highly deflated while RPC and G are not at all affected by item difficulty (see simulation in Metsämuuronen, 2021b). The difference between the estimates of correlation by PMC and G is illustrated in Figure 3; the graphs would be essentially identical with PMC and RPC because the difference between the estimates by RPC and G are subtle in binary case (see Metsämuuronen, 2020b,2021b).
Seventh, Green and Yang (2009) approximate that, by using ρα, the true reliability may be underestimated up to 11% although, in real-life testing settings, the underestimation may be nominal (Raykov, 1997b). Assuming that RPC does not overestimate correlation, when knowing the magnitude of the estimate by the traditional coefficient alpha related to the raw score by Eq. (1) (ρα = 0.862) and the deflation-corrected estimate by RPC related to the factor score variable by Eq. (33) (ρMAX_RPCiθFA = 0.969) in the given dataset, the magnitude of the deflation in the traditional estimate by ρα appears to be 0.1068 units of reliability, that is, 11.0% (=(0.969–0.862)/0.969) in comparison to the one by deflation-corrected rho. By using the same logic, the traditional maximal reliability ρMAX = 0.894 is deflated by 7.7%. These seem decent magnitudes considering that, in the empirical cases, the deflation may be 70 or 44% as discussed in section “Practical Consequences of Mechanical Error in the Estimates of Correlation in Reliability.” The reason for the decent deflation is that the dataset used in the example is neither extremely easy nor extremely difficult. An obvious confounding factor is that the score variables differ between coefficients alpha and rho. If the score variable would be harmonized as being the raw score and the weighting factor would be harmonized to RPC, we can assess the pure effect of the estimator itself. The magnitude of the deflation-corrected alpha (Eq. 21) is ρα_RPCiX = 0.937 and the magnitude of the deflation-corrected rho (Eq. 39) is ρMAX_RPCiX = 0.963. Then, the deflation would be reduced from 11 to 2.6% (=(0.963–0.937)/0.963). This (around) 3% seems to refer strictly to a more effective estimation of reliability by using the form of estimator based on maximal reliability than by the formula used in the traditional coefficient alpha. Obviously, more studies are needed to confirm the results.
Finally, eighth, by comparing the estimates of different weighting factors wi, it is possible to evaluate roughly what the magnitude of the deflation (ewiθ _ MEC) in different estimators of correlation in the dataset is. Assuming that the estimates by RPC do not overestimate the correlation between the items and the score, the difference between the estimates based on RPC and PMC gives a hint of the magnitude of the deflation in PMC. On average in the given dataset, the deflation in PMC with different types of score variable is units of correlation with raw score (ranging 0.0279–0.3268 depending on the item), (–0.0064–0.3121) with the factor score, (0.0315–0.3702) with the theta score by IRT modeling, and (0.0061–0.3433) with the non-linearly weighted score. The systematic negative bias of this size has a notable effect in deflation in the estimate of reliability.
Conclusion and Limitations
An obvious conclusion of the theoretical and empirical parts of the study is that the magnitude of the deflation of reliability depends not only on the unidimensionality, violations in the measurement model and latent normality, estimator of reliability, and uncorrelated errors as traditionally suggested with coefficient alpha but also on the estimators of correlation used as the linking factor between the latent trait θ and the test items gi. Some linking factors like PMC are more prone to deflation than some other estimators like RPC, G and D as examples and, hence, the estimates by PMC are more deflated than those by RPC, G and D. Because PMC is embedded in the traditional estimators of reliability, the deflation in correlation is inherited to the estimates of reliability. Systematic studies comparing different estimators of correlation and reliability could be beneficial to understand the phenomenon better.
Options for Correcting the Deflation in Estimators of Reliability
The root challenge related to deflation in the traditional estimators of reliability seems to be the classical definition of reliability based on variances (, , and ) leading to use PMC in the practical solutions of estimating reliability. If we would start to create a theory concerning reliability by knowing all the deficiencies of PMC we know today, we may be trying to avoid PMC and, consequently, the variances in the process. To rectify this root challenge, it may be beneficial to rethink the definition of reliability from this perspective. Alternative bases to consider for rethinking reliability may be related to, among other, “sufficiency of information” by Smith (2005), or several options within IRT modeling such as “person separation” by Andrich and Douglas (1977), Andrich (1982), and Wright and Masters (1982), or “information function” discussed by, e.g., McDonald (1999), Cheng et al. (2012), and Milanzi et al. (2015). One alternative for defining reliability is discussed briefly here based on Metsämuuronen (2020b) related to the definition of “ultimately discriminating test score.”
Metsämuuronen (2020b) proposes an operational definition of the ultimate item discrimination as a condition where the score can predict response pattern of the test-takers in a single item in a deterministic manner. This could be generalized as a theoretical condition for ultimate reliability as being a condition where the score can predict the order (or item response pattern) of the test takers in a deterministic manner in all items. This operational definition alone is not very practical when it comes to estimation of the reliability because the deterministic patterns cannot be estimated by using maximum likelihood method, for example. However, this could be a starting point to develop estimators where different types of estimators of item discrimination as well as a-parameter in IRT-modeling could be a visible part of the estimator as in Eqs. (21) to (32). Theoretical and empirical work in this area would be beneficial.
While waiting for development of a sound basis for a new way of thinking, defining, and estimating reliability, practical options lead to a kind of new paradigm in the settings related to measurement modeling: the extended families of deflation-corrected estimators of reliability. One set of family, attenuation-corrected estimators of reliability, not discussed in this article, would be obtained if attenuation-corrected estimators of PMC were used instead of PMC in the estimators. Another set of family, MEC-corrected estimators of reliability focused in this article, is obtained if PMC is replaced by a totally different estimator of correlation that would not be deflated at all or where the magnitude of deflation is remarkably smaller than that in PMC. Several new estimators of deflation-corrected estimators were proposed based on using RPC, G and D as examples instead of PMC in some known estimators of reliability.
In the empirical part, it was demonstrated that if RPC, G, or D would be used instead of PMC in some known estimators of reliability, the deflation in reliability would be corrected to a notable extent. Further simulations with different types of datasets, different item types, different weighting factors, and different base of the estimators (e.g., alpha, theta, omega, or rho) would be beneficial in this regard. The estimates by deflation-corrected estimators are not, factually, “real” reliabilities as such. However, they are closer to the deflation-free reliability than the traditional estimates. Empirical examples show that, in specific forms of datasets as in very easy or very difficult tests, the estimates by traditional estimators such as coefficient alpha and rho may be deflated 40–70% because of technical reasons. The DCERs discussed in this article are strong with these kinds of datasets and could be used as a benchmark to the traditional estimators.
Practical Example of Calculating Deflation-Corrected Estimators of Correlations Discussed in This Article
To give a practical example of the DCERs discussed in this article, let us re-analyze the reliability of the extremely easy dataset (n = 7,770) by Metsämuuronen and Ukkola (2019) discussed in section “Practical consequences of Mechanical Error in the Estimates of Correlation in reliability.” The advance of DCERs may be notable in these kinds of datasets where the item difficulties are extreme leading to an ultimately non-normal score (see Table 3). Because of ultimately easy items with mainly binary scales combined with a non-normal score variable, the non-parametric coefficients of correlation may be better options than PMC.
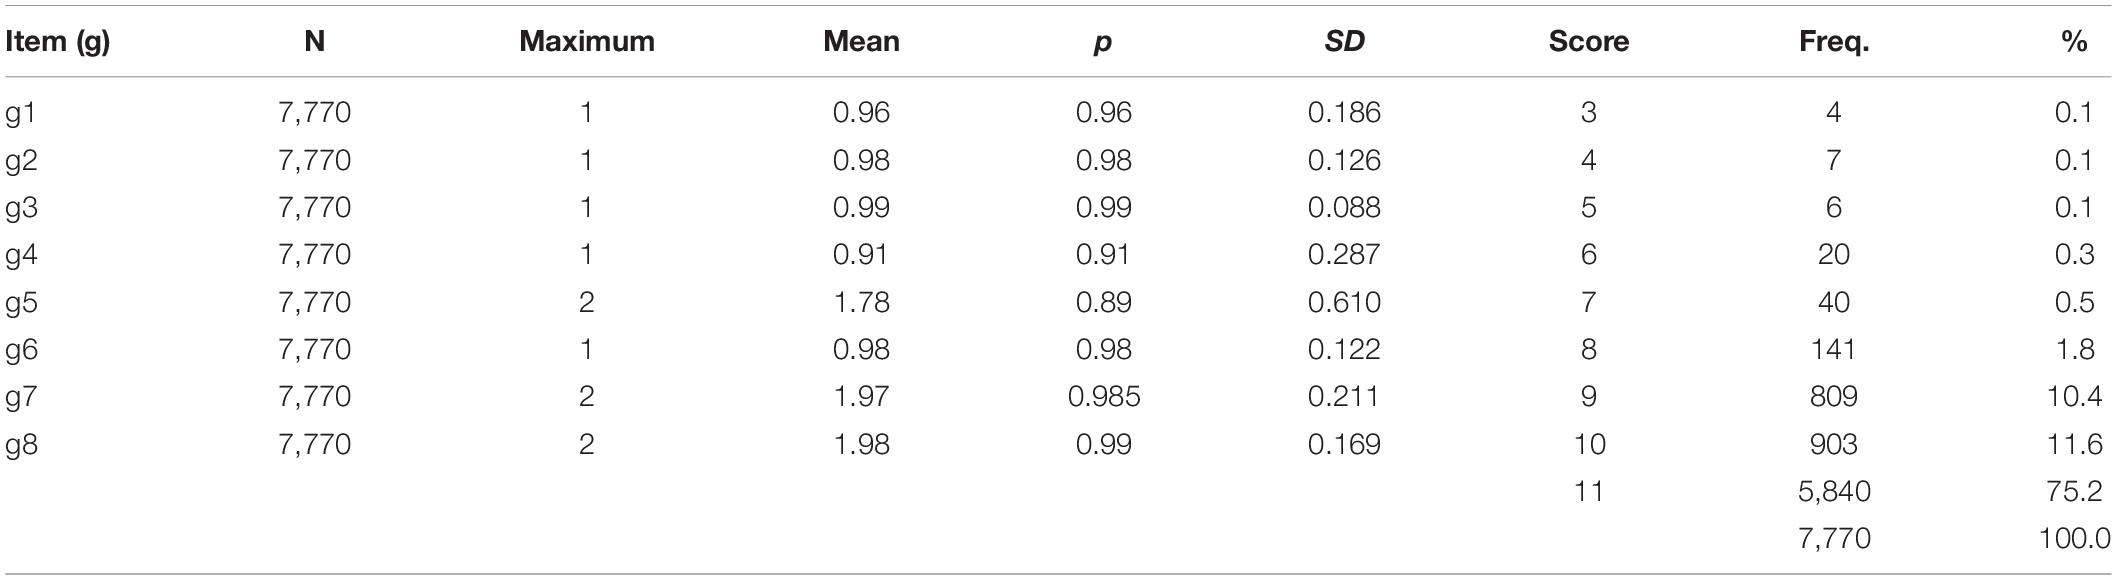
Table 3. Descriptive statistics of the dataset from Metsämuuronen and Ukkola (2019).
Deflation-Corrected Alpha
The traditional coefficient alpha uses raw score (θX) as the manifestation of the latent ability and item–score correlation (RgX) as the weighting element in the calculation. Estimates by alternative coefficients of item–score association are collected in Table 4; their calculation is described in Supplementary Appendix 1. Notably, first, the magnitudes of the estimates by Rit (0.38 on average) are remarkably lower than those by RPC (0.72), G (0.88), and D (0.83). This is caused by its poor behavior with items of extreme difficulty level. Second, the magnitude of the estimates by RPC is somewhat lower than those by G and D. This is not a general characteristic of these coefficients. With binary items, the estimates by G and RPC tend to be very close each other (see, e.g., Metsämuuronen, 2021b), and when the number of categories in the item increases up to four or higher, the probability that two variables are in the same order indicated by G (and D) tend to be lower than covariation between the two variables indicated by PMC and RPC and, hence, the estimates would signal that the true correlation is underestimated (see Metsämuuronen, 2021b). Third, that the magnitude of the estimates by D are lower than those by G is expected because the estimates by D are more conservative in comparison with G (e.g., Metsämuuronen, 2021a,b).

Table 4. Item–score correlations and related statistics needed in estimating reliability.
Because of Eq. (1), the traditional coefficient alpha gives the estimate: . The deflation-corrected alpha using RPC as the weighting element (Eq. 21) leads to an estimate , gamma (Eq. 22) to , and delta (Eq. 23) to . The estimate by the traditional coefficient alpha is radically deflated, 72%, when comparing it to the DCER using G as the weighting element ((0.885−0.245)/0.885 = 0.723) and 69% if using RPC. We also note that the magnitude of the estimates of reliability follows strictly the general tendency of the magnitudes of the coefficients of correlation: In comparison with the estimate byρα_GiX the estimate by ρα_DiX is conservative.
Deflation-Corrected Theta
The traditional coefficient theta uses principal component score (θPC) as the manifestation of the latent ability and principal component loadings (λi) as the weighting element in the calculation. Loadings and corresponding statistics related to alternative estimators are collected in Table 5. Notably, because there appeared to be no tied pairs between the principal component score and items, the estimates by G and D are identical.
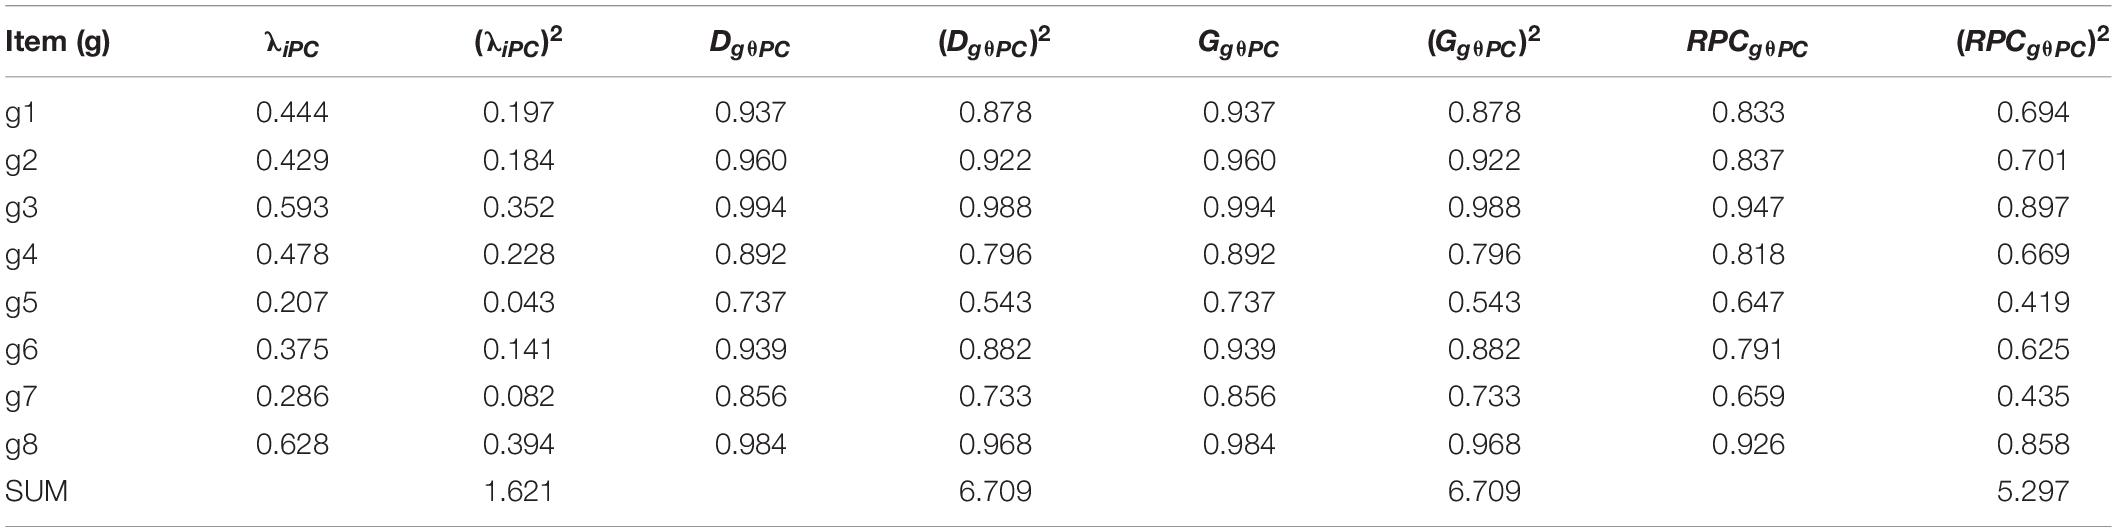
Table 5. Principal component loadings and related alternative statistics for estimating reliability.
The traditional coefficient theta can be calculated by Eq. (2): . The deflation-corrected theta using RPC as the weight factor and the principal component score (θPC) as the manifestation of the latent ability (Eq. 24) leads us to an estimate , gamma (Eq. 25) leads to , and delta (Eq. 26) to . If the estimates based on G or D are used as a reference value, the traditional coefficient theta is deflated by 54%, and, if RPC is used, 52%. If the raw score (θX) would be used as a manifestation of the latent ability instead of θPC, based on the estimates of correlation in Table 4, the magnitudes of the latter estimates would be , , and .
Deflation-Corrected Omega and Rho
The traditional coefficients omega and rho use maximum likelihood estimates of factor score (θML) as the manifestation of the latent ability and factor loadings (λi) as the weighting element in the calculation. Loadings and corresponding statistics related to alternative estimators are collected in Tables 6A,B. As with principal component analysis, because there are no tied pairs between the factor score and items, the estimates by G and D are identical.
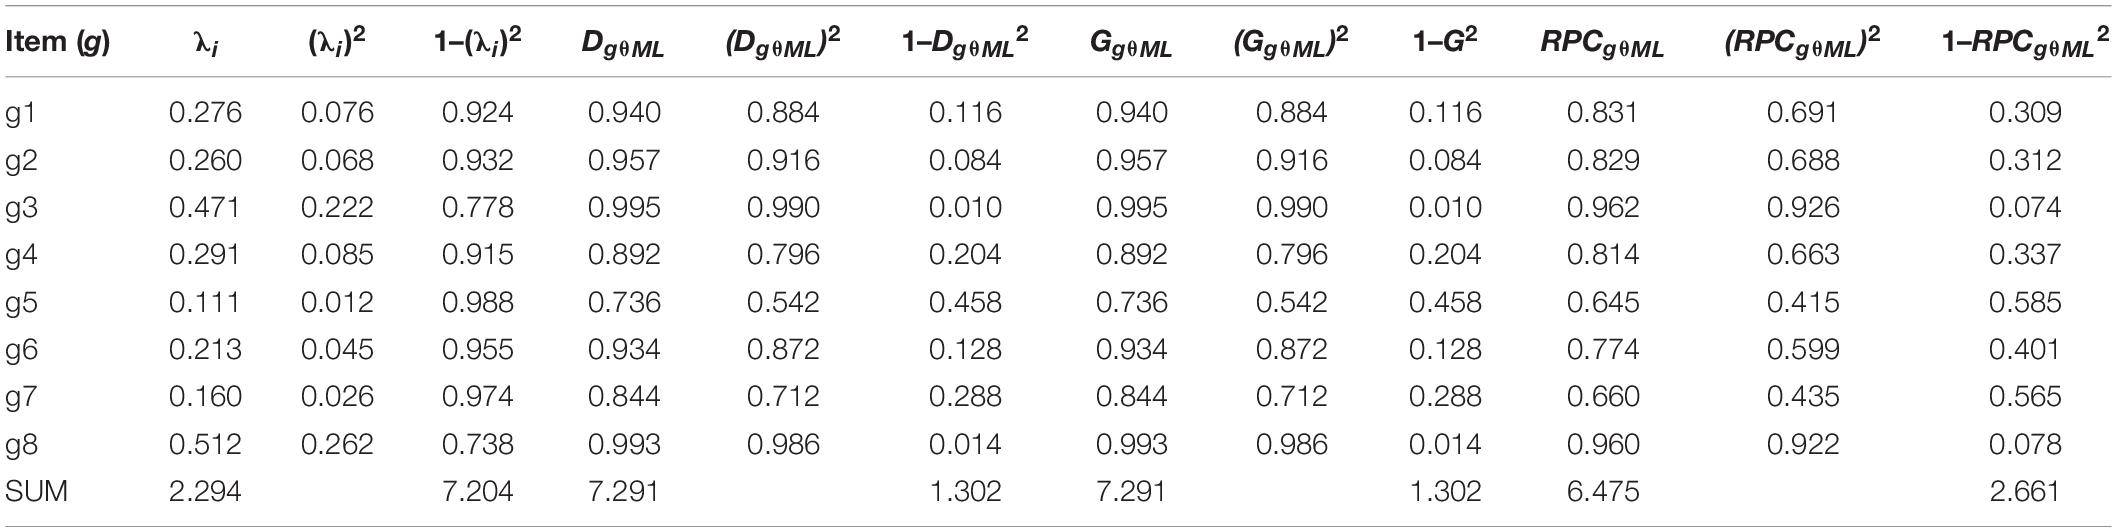
Table 6A. Factor loadings and related alternative statistics for estimating omega.
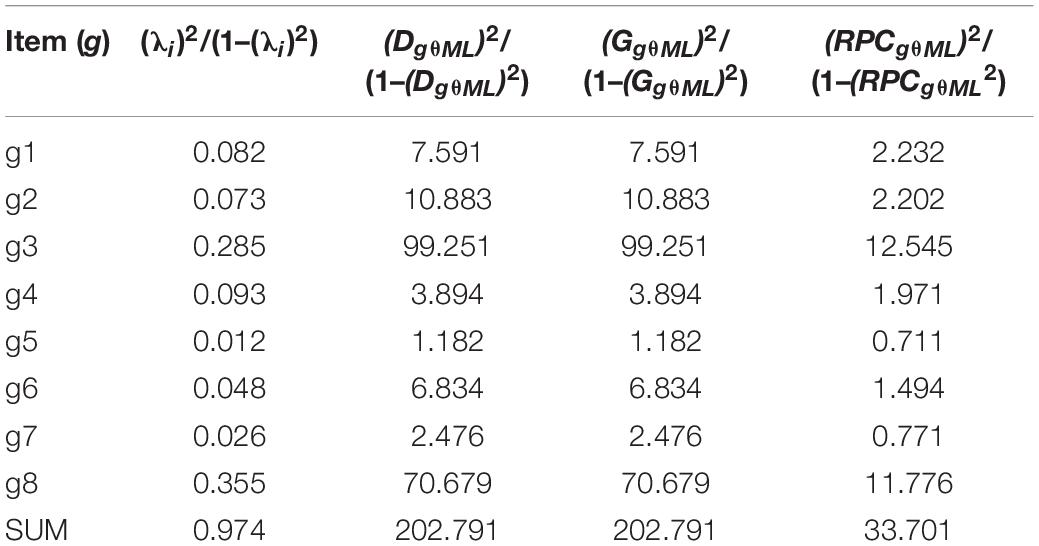
Table 6B. Statistics for calculating rho based on Table 6A.
By Eq. (3), the traditional coefficient omega total is calculated as follows: and rho by Eq. (4): . The deflation-corrected omega using RPC as the weight factor (Eq. 27) and the factor score (θML) as the manifestation of the latent ability leads us to an estimate and the corresponding deflation-corrected rho (Eq. 30) is . Similarly, deflation-corrected omega using gamma (Eq. 28) leads to and the corresponding deflation-corrected rho (Eq. 31) is . Deflation-corrected omega using delta (Eqs. 29) leads to identical estimates in comparison with the estimates by gamma: and the corresponding deflation-corrected rho (Eq. 32) is .
The magnitude of the estimates based on the form of maximal reliability and G and D as the weighting factor (0.995), feel intuitively overestimates. This is reasoned by the fact that the formula of maximal reliability is sensitive for high values of loadings. With very high values of loading—as here G = D = 0.995 for item g3 referring to a fact that after the test takers are ordered by the factor score variable, 99.5% of the test takers are in the same order in both item and score—the statistic may give an artificially high value leading to artificially high estimate of reliability. However, if the estimates based on G or D are used as a reference value, the traditional coefficient omega and rho are deflated by 57 and 50%, and, if RPC is used, 55 and 49%, respectively. If the raw score (X) would be used as a manifestation of the latent ability instead of θML, the magnitudes of the DCERs based on omega would be , , and and DCERs based on rho , , and .
The estimates of reliability above are summarized in Table 7. Different interpretations of the varying estimators are discussed in the next section. Anyhow, just by comparing the overall level of magnitudes of the traditional estimates and the estimates by different DCERs we may conclude that all the DCERs seem to refer to a reliability which is notably higher than the ones indicated by the traditional estimators. If one uses the raw scores, instead of ρα = 0.245, the true reliability seems to be around 0.914 (on average), varying between 0.790 and 0.979 depending on which form is used as the base and which deflation-corrected estimator of correlation is used as the weighting element. Knowing the interpretation of RPC, G and D, the high magnitude of reliability by DCERs refer to the fact that the score is highly capable of ordering the test takers in a logical order by their latent ability. Of the estimators, the ones based on coefficient alpha are the most conservative and the ones based on rho the most liberal. In this case, the estimators of correlation based on probability (G and D) tend to lead somewhat higher estimates than the one based on covariance (RPC). This is not a general characteristic though.

Table 7. Summary of estimates of reliability.
Different Interpretation of Different Estimators of Reliability
The article did not tackle the issue of differences between the estimators of correlation. Notably, PMC, RPC, and G (as well as D) discussed in the article indicate different aspects of the correlation: PMC estimates the observed correlation between two variables, and this is radically deflated in the measurement modeling settings. RPC estimates the inferred correlation of two unobservable continuous variables by their ordinal manifestations. G and D estimate the probability that the test takers are in the same order both in an item and a score. The outcome of different estimators of reliability may, then, indicate different viewpoints of reliability.
Chalmers (2017) is skeptical of the usefulness of coefficients using RPC in practical settings because RPC refers to correlation between unobservable and unreachable variables and, therefore, the outcome may be useless in the factual interpretation of the observed score. He proposes that using RPC leads to infer something about theoretical reliability. However, some estimators of reliability such as ordinal alpha and theta by Zumbo et al. (2007; see also Gadermann et al., 2012), factually, use RPC in the estimation. Comparing the estimators related to RPC in Eqs. (21), (24), and (27) and (39) to (43) with ordinal alpha or ordinal theta based on the matrix of inter-item RPCs instead of matrix of PMCs may be worth studying.
Estimators based on G and D refer to observed variables and, therefore, the outcome may be more useful than those by RPC in the factual analysis of the observed score. Knowing the interpretation of G and D in the measurement settings (see Metsämuuronen, 2021a,b), estimators (22) and (23), (25) and (26), (31) and (32), and (44) to (48) reflect the average proportion of logically ordered test takers in all items as a whole. In this, the estimators based on D are more conservative than the ones based on G.
A relevant question is, how different is the interpretation of the estimates by G (or D) in comparison to those by PMC or RPC? Knowing that G estimates the probability that the test takers are in the same order in the item and in the score, the ultimate magnitude of reliability by the estimators based on G would indicate that all items discriminate the higher-performing test takers from the lower-performing test takers in a deterministic manner after the test takers are ordered by the score. The same interpretation would be obtained when using RPC except that RPC can reach the value RPC = 1 only approximatively. From this viewpoint, the deflation-corrected estimators in Eqs. (24) to (32) related to RPC, G, and D seems to refer strictly to the discrimination power of the score. This makes sense from the standard error of measurement viewpoint. Notably, under the condition of deterministic item discrimination, the estimators using PMC cannot reach the perfect reliability because the estimates by PMC cannot detect the deterministic correlation unless the number of categories is equal in the variables. More studies and theoretical work in the interpretation of the estimators would enrich us.
Some typological characteristics of different estimators of the estimators described in the article are summarized in Table 8. Notably, again, RPC, G, and D are not the only options for DCERs; further studies related to such estimators as r-bireg- and r-polyreg correlations, G2, D2, as well as attenuation-corrected Rit and eta, as examples, would be beneficial (see footnote 6).
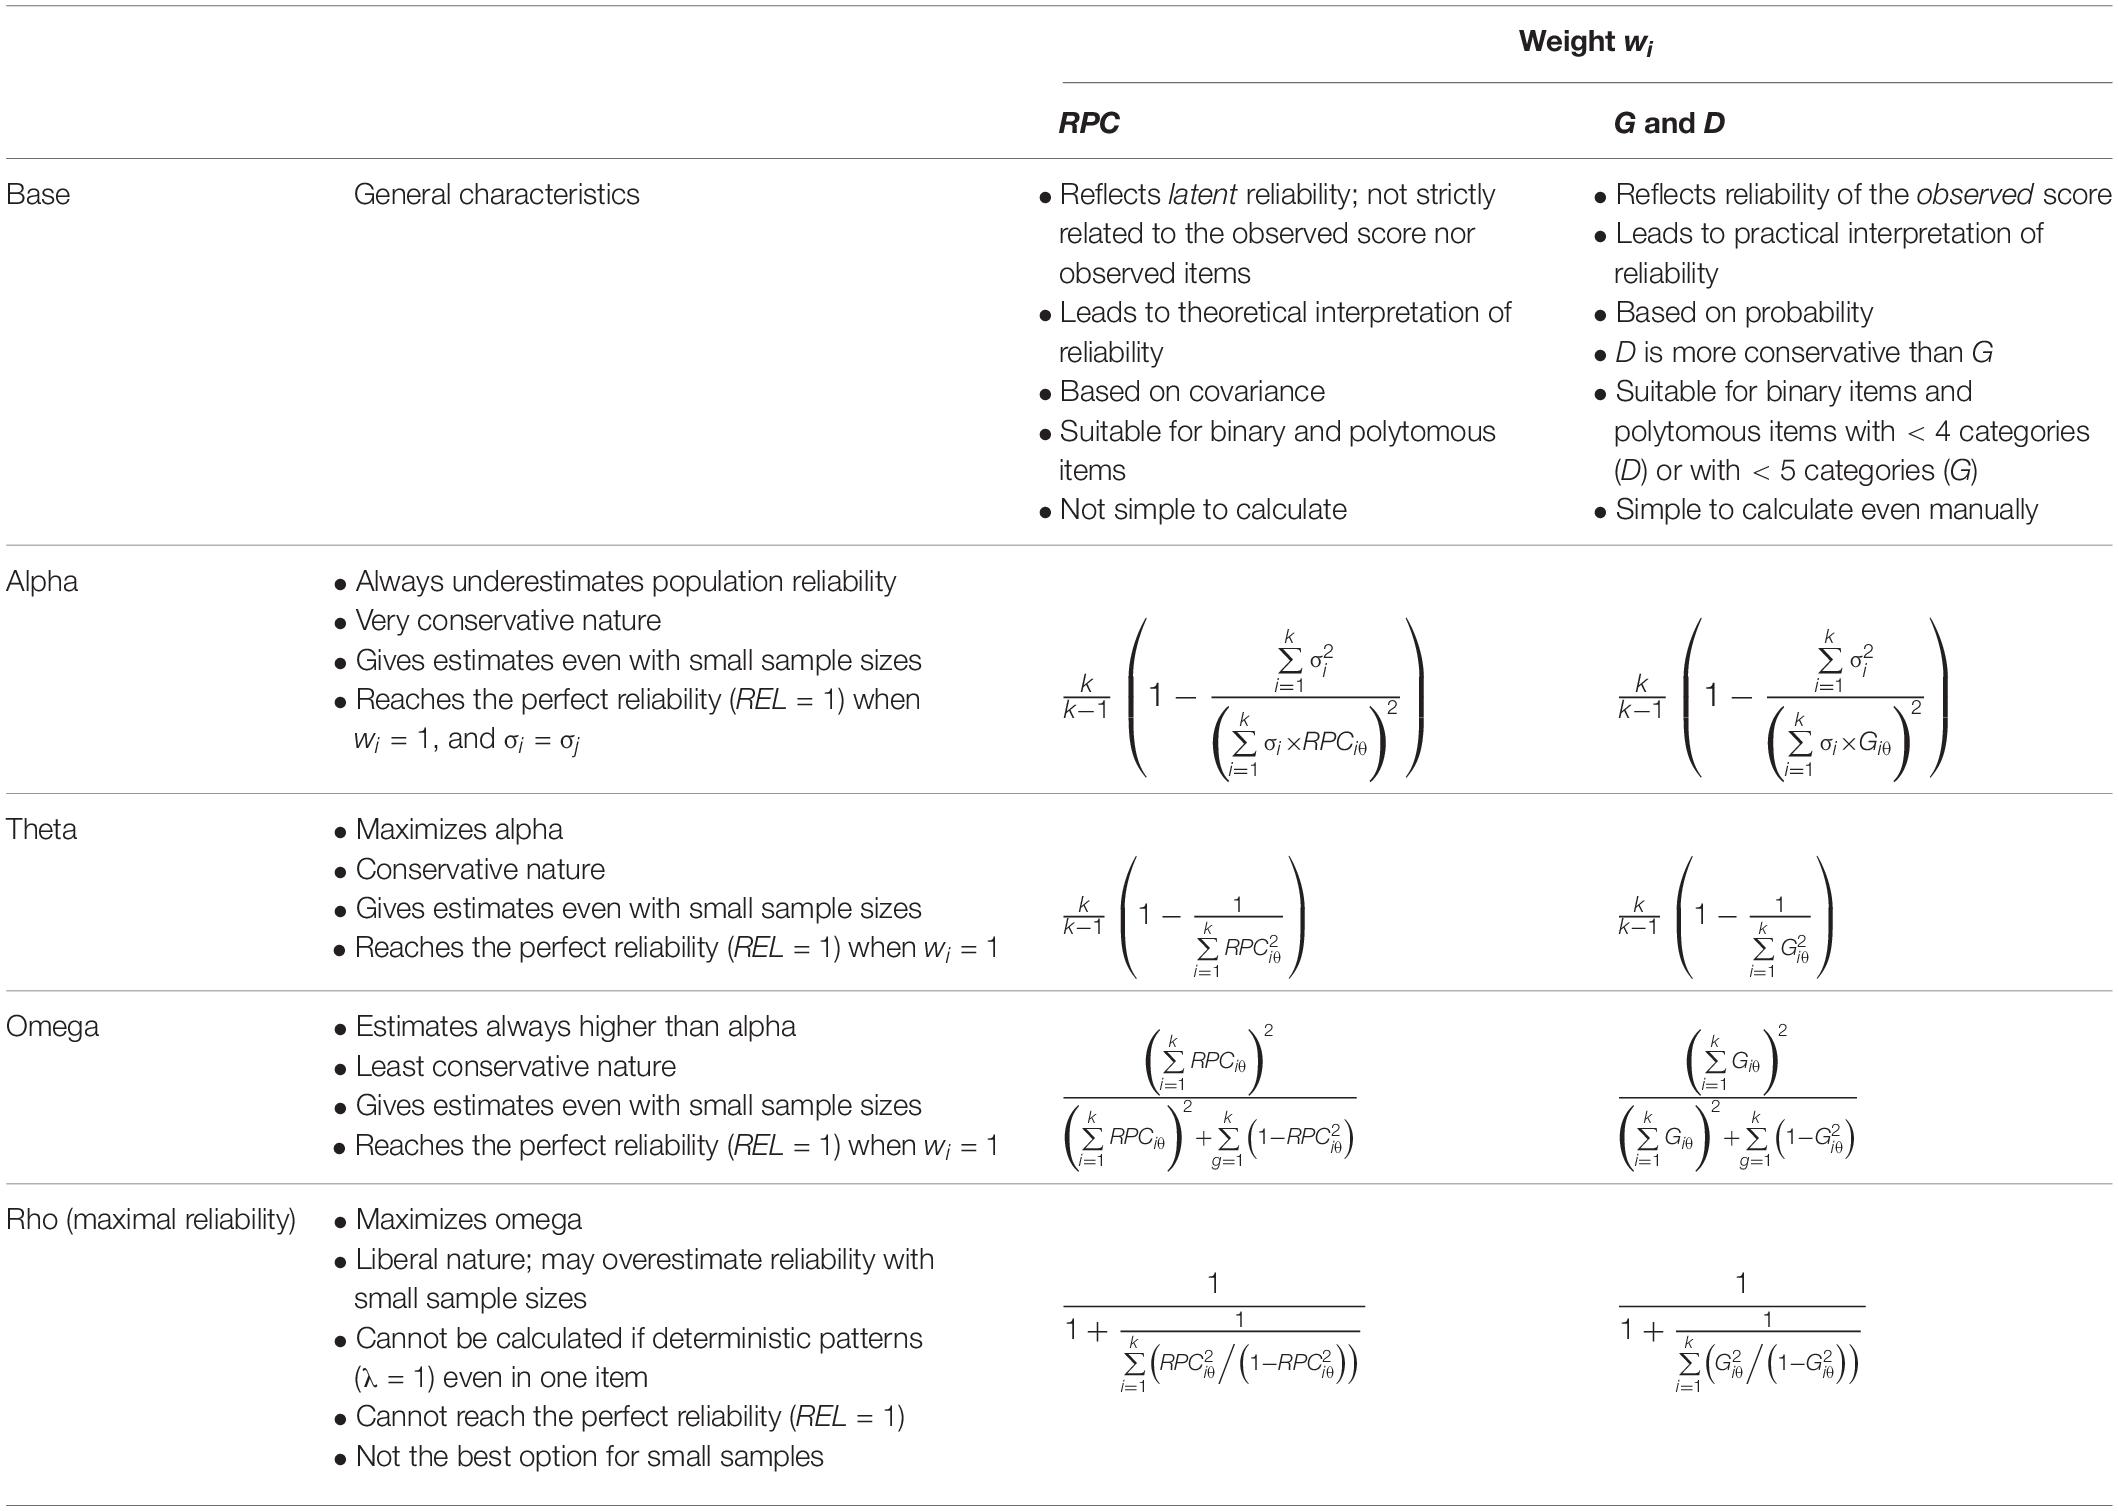
Table 8. General typological characteristics of selected options of DCERs.
Known Limitations of the Treatment
The empirical section offers, obviously, just examples of what kind of effect would be obtained if an estimator with smaller quantity of deflation is used as the linking factor between the latent variables and the item. Wider comparisons of different estimators would benefit us to select most suitable estimators of correlation as the linking factors for different variables, estimators of reliability and different type of datasets. Systematic simulations also in this area would enrich us.
The DCERs in the article were given just as examples—their characteristics were not studied in-depth. Specifically, the estimators based on omega and rho are, by far, theoretical options in the settings related to factor analysis and structural equation modeling because they may require new procedures where the outcome of factor loadings would be (essentially) RPC or G instead of (essentially) PMC. Notably, the current procedures of using RPC in EFA and SEM may start by using RPC in forming the correlation matrix, but the outcome of the loadings seems to be still, essentially, PMC. Also, Chalmers (2017) critique against the use of RPC in estimating reliability is worth noting. More studies in this regard would benefit us.
The study did not tackle the question of possible overestimation of reliability when using deflation-corrected estimators of reliability. Assuming that RPC does not overestimate the true correlation, it may be relevant to conclude that a deflation-corrected estimator based on RPC such as Eqs. (21), (24), (27), and (30) would not overestimate reliability. What would be the mechanism for overestimation? It may be possible that the estimators based on rho overestimate the reliability in the real-world settings; this would be a reasonable consequence of the results by Aquirre-Urreta et al. (2019) that rho may overestimate the true reliability with finite samples familiar in real-world testing settings with small or smallish number of test takers. From this viewpoint, the estimators based on alpha, theta and omega seem to give more conservative estimates. Theoretical and empirical studies in the area would be beneficial.
Finally, in several places in the article a loose wording concerning the deflation in the estimates of reliability was described as “remarkable” or “notable.” Based on the behavior of PMC, it is expected that the effect of changing PMC with better behaving estimators of correlation in the estimators of reliability is “remarkable” or maybe even “dramatical” when the test is very easy or very demanding to the target group or with tests with incremental difficulty levels as are usual in the educational testing settings; PMC is severely deflated in these cases. Also, with the tests of incremental difficulty level where part of the test items may be very easy and part may be very demanding as is usual in the achievement testing, we may expect remarkable difference between the traditional estimators and deflation-corrected ones. However, when all items are of medium difficulty level, the effect may not be as notable. Wider empirical studies and simulations would enrich us in this regard.
Data Availability Statement
The datasets presented in this study can be found in online repositories. The names of the repository/repositories and accession number(s) can be found in the article/Supplementary Material.
Ethics Statement
Ethical review and approval was not required for the study on human participants in accordance with the local legislation and institutional requirements. Written informed consent from the participants’ legal guardian/next of kin was not required to participate in this study in accordance with the national legislation and the institutional requirements.
Author Contributions
JM contributed alone in the article.
Funding
No specific funding was given nor applied for this study. However, it was prepared partly by the kind support of the employer.
Conflict of Interest
The author declares that the research was conducted in the absence of any commercial or financial relationships that could be construed as a potential conflict of interest.
Publisher’s Note
All claims expressed in this article are solely those of the authors and do not necessarily represent those of their affiliated organizations, or those of the publisher, the editors and the reviewers. Any product that may be evaluated in this article, or claim that may be made by its manufacturer, is not guaranteed or endorsed by the publisher.
Supplementary Material
The Supplementary Material for this article can be found online at: https://www.frontiersin.org/articles/10.3389/fpsyg.2021.748672/full#supplementary-material
Footnotes
- ^ The basic contents of the derivation of underestimation of PMC in the measurement modeling settings, later elaborated in Metsämuuronen (2016), were initially published in Metsämuuronen (2009); in Finnish.
- ^ The value depends on, to some extent, the number of bins in the variable with wider scale. For example, with 10, 20, 30, 200, and 1,000 bins, the maximum value is 0.8704, 0.8671, 0.8665, 0.8660, and 0.8660, respectively. This is easy to confirm by forming these sets of variables.
- ^ We recall that, although the traditional formula of ρBS is usually expressed by using PMC between two parallel tests, it can be expressed also by using in the form familiar from ρFR (see Lord et al., 1968).
- ^ The effectiveness is expected because, in their original context, ρTH maximizes ρα (Greene and Carmines, 1980), the magnitude of the estimates by ρMAXis higher than those by ρω (Cheng et al., 2012), and all three give higher value than alpha if the item–score correlations or loadings are not equal (e.g., Cheng et al., 2012).
- ^ Notably, RPC cannot reach the perfect 1. With enhanced procedures of the estimation by adding a very small number like 10–50 to each element of logarithm and when the embedded PMC ≈ 1 such as 0.99999999, RPC ≈ 1.
- ^ The dataset used in this article is a simple one intending to lead the reader to the concepts and relevant estimators by offering all necessary calculations in Supplementary Appendix 1. A dataset comprising a more in-depth comparison of different estimators is also available at http://dx.doi.org/10.13140/RG.2.2.27971.94241. This wider dataset is a simulation including 1,440 estimates of reliability drawn from the same real-life dataset as used in Supplementary Appendix 1, however, so that the sample size is varied (n = 25, 50, 100, 200) as well as the number of categories and difficulty levels in the items and the score, and more options for the weight element are compared: traditional weights, RPC, G, D, RREG, G2, D2, RAC, and EAC. Unlike the dataset used in this article, the score variables in the larger dataset do not include θIRT and θPI though.
References
Andrich, D. (1982). An index of person separation in latent trait theory, the traditional KR-20 INDEX, AND THE GUTTMAN SCALE RESPONSE PATTERn. Educ. Res. Perspect. 9, 95–104.
Andrich, D., and Douglas, G. A. (1977). “Reliability: distinctions between item consistency and subject separation with the simple logistic model,” in Paper Presented at the Annual Meeting of the American Educational Research Association (New York, NY)
Anselmi, P., Colledai, D., and Robusto, E. (2019). A comparison of classical and modern measures of internal consistency. Front. Psychol. 10:2714. doi: 10.3389/fpsyg.2019.02714
Aquirre-Urreta, M., Rönkkö, M., and McIntosh, C. N. (2019). A cautionary note on the finite sample behavior of maximal reliability. Psychol. Methods 24, 236–252. doi: 10.1037/met0000176
Armor, D. (1973). Theta reliability and factor scaling. Sociol. Methodol. 5, 17–50. doi: 10.2307/270831
Brown, W. (1910). Some experimental results in the correlation of mental abilities. Br. J. Psychol. 3, 296–322.
Chalmers, R. P. (2017). On misconceptions and the limited usefulness of ordinal alpha. Educ. Psychol. Measurement 78, 1056–1071. doi: 10.1177/0013164417727036
Chan, D. (2008). “So why ask me? are self-report data really that bad?,” in Statistical and Methodological Myths and Urban Legends, eds C. E. Lance and R. J. Vanderberg (Milton Park: Routledge), doi: 10.4324/9780203867266
Cheng, Y., Yuan, K.-H., and Liu, C. (2012). Comparison of reliability measures under factor analysis and item response theory. Educ. Psychol. Measurement 72, 52–67. doi: 10.1177/0013164411407315
Cramer, D., and Howitt, D. (2004). The Sage Dictionary of Statistics. A Practical Resource for Students. Thousand Oaks, CA: SAGE Publications Inc.
Cronbach, L. J. (1951). Coefficient and the internal structure of tests. Psychometrika 16, 297–334. doi: 10.1007/BF02310555
Dunn, T. J., Baguley, T., and Brunsden, V. (2013). From alpha to omega: a practical solution to the pervasive problem of internal consistency estimation. Br. J. Psychol. 105, 399–412. doi: 10.1111/bjop.12046
FINEEC (2018). National Assessment of Learning Outcomes in Mathematics at Grade 9 in 2002 (Unpublished dataset opened for the re-analysis 18.2.2018). Helsinki: Finnish National Education Evaluation Centre (FINEEC).
Gadermann, A. M., Guhn, M., and Zumbo, B. D. (2012). Estimating ordinal reliability for Likert-type and ordinal item response data: a conceptual, empirical, and practical guide. Pract. Assess. Res. Eval. 17, 1–13. doi: 10.7275/n560-j767
Goodman, L. A., and Kruskal, W. H. (1954). Measures of association for cross classifications. J. Am. Statist. Assoc. 49, 732–764. doi: 10.1080/01621459.1954.10501231
Green, S. B., and Yang, Y. (2009). Commentary on coefficient alpha: a cautionary tale. Psychometrika 74, 121–135. doi: 10.1007/s11336-008-9098-4
Green, S. B., and Yang, Y. (2015). Evaluation of dimensionality in the assessment of internal consistency reliability: coefficient alpha and omega coefficients. Educ. Measurement: Issues Practice 34, 14–20. doi: 10.1111/emip.12100
Greene, V. L., and Carmines, E. G. (1980). Assessing the reliability of linear composites. Sociol. Methodol. 11, 160–17. doi: 10.2307/270862
Guttman, L. (1945). A basis for analyzing test-retest reliability. Psychometrika 10, 255–282. doi: 10.1007/BF02288892
Heise, D., and Bohrnstedt, G. (1970). Validity, invalidity, and reliability. Sociol. Methodol. 2, 104–129. doi: 10.2307/270785
Jackson, P. H., and Agunwamba, C. C. (1977). Lower bounds for the reliability of the total score on a test composed of non-homogeneous items: I: algebraic lower bounds. Psychometrika 42, 567–578. doi: 10.1007/BF02295979
Jackson, R. W. B., and Ferguson, G. A. (1941). Studies on the Reliability of Tests. Toronto, ON: Department of Educational Research, University of Toronto.
Kaiser, H. F., and Caffrey, J. (1965). Alpha factor analysis. Psychometrika 30, 1–14. doi: 10.1007/BF02289743
Kendall, M. (1949). Rank and product–moment correlation. Biometrika 36, 177–193. doi: 10.2307/2332540
Krippendorff, K. (1970). Estimating the reliability, systematic error and random error of interval data. Educ. Psychol. Measurement 30, 61–70. doi: 10.1177/001316447003000105
Kuder, G. F., and Richardson, M. W. (1937). The theory of the estimation of test reliability. Psychometrika 2, 151–160. doi: 10.1007/BF02288391
Lavrakas, P. J. (2008). “Attenuation,” in Encyclopedia of Survey Methods, ed. P. J. Lavrakas (Thousand Oaks, CA: Sage Publications Inc.), doi: 10.4135/9781412963947.n24
Li, H. (1997). A unifying expression for the maximal reliability of a linear composite. Psychometrika 62, 245–249. doi: 10.1007/BF02295278
Li, H., Rosenthal, R., and Rubin, D. B. (1996). Reliability of measurement in psychology: from spearman-brown to maximal reliability. Psychol. Methods 1, 98–107. doi: 10.1037/1082-989X.1.1.98
Livingston, S. A., and Dorans, N. J. (2004). A Graphical Approach to Item Analysis. Research Report No. RR-04-10. Princeton, NJ: Educational Testing Service, doi: 10.1002/j.2333-8504.2004.tb01937.x
Lord, F. M. (1958). Some relations between Guttman’s principal component scale analysis and other psychometric theory. Psychometrika 23, 291–296. doi: 10.1002/j.2333-8504.1957.tb00073.x
Lord, F. M., Novick, M. R., and Birnbaum, A. (1968). Statistical Theories of Mental Test Scores. Boston, MA: Addison–Wesley Publishing Company.
Martin, W. S. (1973). The effects of scaling on the correlation coefficient: a test of validity. J. Market. Res. 10, 316–318. doi: 10.2307/3149702
Martin, W. S. (1978). Effects of scaling on the correlation coefficient: additional considerations. J. Market. Res. 15, 304–308. doi: 10.1177/002224377801500219
McDonald, R. P. (1970). Theoretical canonical foundations of principal factor analysis, canonical factor analysis, and alpha factor analysis. Br. J. Mathemat. Statist. Psychol. 23, 1–21. doi: 10.1111/j.2044-8317.1970.tb00432.x
McNeish, D. (2017). Thanks coefficient alpha, we’ll take it from here. Psychol. Methods 23, 412–433. doi: 10.1037/met0000144
Meade, A. W. (2010). “Restriction of range,” in Encyclopedia of Research Design, ed. N. J. Salkind (Thousand Oaks, CA: SAGE Publications, Inc.). doi: 10.4135/9781412961288.n309
Metsämuuronen, J. (2009). Methods Assisting the Assessment. [Metodit arvioinnin apuna] Series Assessment of Learning Outcomes (Oppimistulosten arviointi) 1/2009. Helsinki: Finnish National Board of Education.
Metsämuuronen, J. (2016). Item–total correlation as the cause for the underestimation of the alpha estimate for the reliability of the scale. GJRA - Global J. Res. Anal. 5, 471–477.
Metsämuuronen, J. (2017). Essentials of Research Methods in Human Sciences. Thousand Oaks, CA: SAGE Publications, Inc.
Metsämuuronen, J. (2020b). Somers’ D as an alternative for the item–test and item–rest correlation coefficients in the educational measurement settings. Int. J. Educ. Methodol. 6, 207–221. doi: 10.12973/ijem.6.1.207
Metsämuuronen, J. (2020a). Dimension-corrected Somers’ D for the item analysis settings. Int. J. Educ. Methodol. 6, 297–317. doi: 10.12973/ijem.6.2.297
Metsämuuronen, J. (2021b). Goodman–Kruskal gamma and dimension-corrected gamma in educational measurement settings. Int. J. Educ. Methodol. 7, 95–118. doi: 10.12973/ijem.7.1.95
Metsämuuronen, J. (2021c). Mechanical attenuation in eta squared and some related consequences. attenuation-corrected eta and eta squared, negative values of eta, and their relation to Pearson correlation. bioRixv [Prperint]. doi: 10.13140/RG.2.2.29569.58723
Metsämuuronen, J. (2021d). The effect of various simultaneous sources of mechanical error in the estimators of correlation causing deflation in reliability. seeking the best options of correlation for deflation-corrected reliability. bioRixv [Prperint]. doi: 10.13140/RG.2.2.36496.53767/1
Metsämuuronen, J. (2021a). Directional nature of Goodman-Kruskal gamma and some consequences. identity of Goodman-Kruskal gamma and Somers delta, and their connection to Jonckheere-Terpstra test statistic. Behaviormetrika 48, 283–307. doi: 10.1007/s41237-021-00138-8
Metsämuuronen, J., and Ukkola, A. (2019). Methodological Solutions of Zero Level Assessment (Alkumittauksen menetelmällisiä ratkaisuja). Publications 18:2019. Helsinki: Finnish National Education Evaluation Centre (FINEEC).
Milanzi, E., Molenberghs, G., Alonso, A., Verbeke, G., and De Boeck, P. (2015). Reliability measures in item response theory: manifest versus latent correlation functions. Br. J. Mathemat. Statist. Psychol. 68, 43–64. doi: 10.1111/bmsp.12033
Moses, T. (2017). “A review of developments and applications in item analysis,” in Advancing Human Assessment. The Methodological, Psychological and Policy Contributions of ETS. Educational Testing Service, eds R. Bennett and M. von Davier (Berlin: Springer Open), doi: 10.1007/978-3-319-58689-2_2
Novick, M. R., and Lewis, C. (1967). Coefficient alpha and the reliability of composite measurement. Psychometrika 32, 1–13. doi: 10.1007/BF02289400
Olsson, U. (1980). Measuring correlation in ordered two-way contingency tables. J. Market. Res. 17, 391–394. doi: 10.1177/002224378001700315
Pearson, K. (1896). VII. mathematical contributions to the theory of evolution. III. regression, heredity and panmixia. Philos. Trans. R. Soc. London 187, 253–318. doi: 10.1098/rsta.1896.0007
Pearson, K. (1900). I. Mathematical contributions to the theory of evolution. VII. on the correlation of characters not quantitatively measurable. Philos. Trans. R. Soc. Mathematical Phys. Eng. Sci. 195, 1–47. doi: 10.1098/rsta.1900.0022
Pearson, K. (1903). I. mathematical contributions to the theory of evolution. —XI. on the influence of natural selection on the variability and correlation of organs. Philos. Trans. R. Soc. Mathemat. Phys. Eng. Sci. 200, 1–66. doi: 10.1098/rsta.1903.0001
Pearson, K. (1909). On a new method of determining correlation between a measured character A, and a character B, of which only the percentage of cases wherein B exceeds (or falls short of) a given intensity is recorded for each grade of A. Biometrika 7, 96–105. doi: 10.1093/biomet/7.1-2.96
Pearson, K. (1913). On the measurement of the influence of “broad categories” on correlation. Biometrika 9, 116–139. doi: 10.1093/biomet/9.1-2.116
Raykov, T. (1997a). Estimation of composite reliability for congeneric measures. Appl. Psychol. Measurement 21, 173–184. doi: 10.1177/01466216970212006
Raykov, T. (1997b). Scale reliability, Cronbach’s coefficient alpha, and violations of essential tau–equivalence for fixed congeneric components. Multivariate Behav. Res. 32, 329–354. doi: 10.1207/s15327906mbr3204_2
Raykov, T. (2004). Estimation of maximal reliability: a note on a covariance structure modeling approach. Br. J. Mathemat. Statist. Psychol. 57, 21–27. doi: 10.1348/000711004849295
Raykov, T. (2012). “Scale development using structural equation modeling,” in Handbook of Structural Equation Modeling, ed. R. Hoyle (New York, NY: Guilford Press), 472–492.
Raykov, T., and Marcoulides, G. A. (2017). Thanks coefficient alpha, we still need you! Educ. Psychol. Measurement 79, 200–210. doi: 10.1177/0013164417725127
Revelle, W., and Condon, D. M. (2018). “Reliability,” in The Wiley Handbook of Psychometric Testing: a Multidisciplinary Reference on Survey, Scale and Test Development, eds P. Irwing, T. Booth, and D. J. Hughes (London: John Wily & Sons).
Rulon, P. J. (1939). A simplified procedure for determining the reliability of a test by split-halves. Harvard Educ. Rev. 9, 99–103.
Sackett, P. R., and Yang, H. (2000). Correction for range restriction: an expanded typology. J. Appl. Psychol. 85, 112–118. doi: 10.1037/0021-9010.85.1.112
Sackett, P. R., Lievens, F., Berry, C. M., and Landers, R. N. (2007). A cautionary note on the effect of range restriction on predictor intercorrelations. J. Appl. Psychol. 92, 538–544. doi: 10.1037/0021-9010.92.2.538
Schmidt, F. L., and Hunter, J. E. (1999). Theory testing and measurement error. Intelligence 27, 183–198.
Schmidt, F. L., and Hunter, J. E. (2015). Methods of Meta-Analysis: Correcting Error and Bias in Research Findings, 3rd Edn. Newbury Park, CA: SAGE Publications. doi: 10.4135/9781483398105
Smith, J. K. (2005). Reconsidering reliability in classroom assessment and grading. Educ. Measurement: Issues Practice 22, 26–33. doi: 10.1111/j.1745-3992.2003.tb00141.x
Somers, R. H. (1962). A new asymmetric measure of correlation for ordinal variables. Am. Sociol. Rev. 27, 799–811. doi: 10.2307/2090408
Spearman, C. (1904). The proof and measurement of correlation between two things. Am. J. Psychol. 15, 72–101. doi: 10.2307/1412159
Trizano-Hermosilla, I., and Alvarado, J. M. (2016). Best alternatives to Cronbach’s alpha reliability in realistic conditions: congeneric and asymmetrical measurements. Front. Psychol. 7:769. doi: 10.3389/fpsyg.2016.00769
Woodhouse, B., and Jackson, P. H. (1977). Lower bounds for the reliability of the total score on a test composed of non-homogeneous items: II: a search procedure to locate the greatest lower bound. Psychometrika 42, 579–591. doi: 10.1007/BF02295980
Wright, B. D., and Masters, G. N. (1982). Rating Scale Analysis: Rasch Measurement. San Diego, CA: Mesa Press.
Yang, H. (2010). “Factor loadings,” in Encyclopedia of Research Design, ed. N. J. Salkind (Thousand Oaks, CA: SAGE Publications), 480–483.
Yang, Y., and Green, S. B. (2011). Coefficient alpha: a reliability coefficient for the 21st century? J. Psychoeduc. Assess. 29, 377–392. doi: 10.1177/0734282911406668
Keywords: reliability, deflation in reliability, item-score correlation, deflation in correlation, coefficient alpha, coefficient theta, coefficient omega, maximal reliability
Citation: Metsämuuronen J (2022) Deflation-Corrected Estimators of Reliability. Front. Psychol. 12:748672. doi: 10.3389/fpsyg.2021.748672
Received: 28 July 2021; Accepted: 15 November 2021;
Published: 04 January 2022.
Edited by:
Begoña Espejo, University of Valencia, SpainReviewed by:
Ben Kelcey, University of Cincinnati, United StatesMarco Tommasi, University of Studies G. d’Annunzio Chieti and Pescara, Italy
Copyright © 2022 Metsämuuronen. This is an open-access article distributed under the terms of the Creative Commons Attribution License (CC BY). The use, distribution or reproduction in other forums is permitted, provided the original author(s) and the copyright owner(s) are credited and that the original publication in this journal is cited, in accordance with accepted academic practice. No use, distribution or reproduction is permitted which does not comply with these terms.
*Correspondence: Jari Metsämuuronen, amFyaS5tZXRzYW11dXJvbmVuQGdtYWlsLmNvbQ==