
95% of researchers rate our articles as excellent or good
Learn more about the work of our research integrity team to safeguard the quality of each article we publish.
Find out more
ORIGINAL RESEARCH article
Front. Psychol. , 30 August 2021
Sec. Cognitive Science
Volume 12 - 2021 | https://doi.org/10.3389/fpsyg.2021.717519
This article is part of the Research Topic Machine Learning Approaches in Addiction Research View all 8 articles
 Tingting Dong1†
 Qiuping Huang2,3†
 Shucai Huang4
 Jiang Xin1
 Qiaolan Jia1Yang Gao1
 Hongxian Shen2,3
 Yan Tang1*Hao Zhang1*
Methamphetamine (MA) can cause brain structural and functional impairment, but there are few studies on whether this difference will sustain on MA abstainers. The purpose of this study is to investigate the correlation of brain networks in MA abstainers. In this study, 47 people detoxified for at least 14 months and 44 normal people took a resting-state functional magnetic resonance imaging (RS-fMRI) scan. A dynamic (i.e., time-varying) functional connectivity (FC) is obtained by applying sliding windows in the time courses on the independent components (ICs). The windowed correlation data for each IC were then clustered by k-means. The number of subjects in each cluster was used as a new feature for individual identification. The results show that the classifier achieved satisfactory performance (82.3% accuracy, 77.7% specificity, and 85.7% sensitivity). We find that there are significant differences in the brain networks of MA abstainers and normal people in the time domain, but the spatial differences are not obvious. Most of the altered functional connections (time-varying) are identified to be located at dorsal default mode network. These results have shown that changes in the correlation of the time domain may play an important role in identifying MA abstainers. Therefore, our findings provide valuable insights in the identification of MA and elucidate the pathological mechanism of MA from a resting-state functional integration point of view.
Methamphetamine (MA) is synthesized on the basis of ephedrine, which has the effect of mental stimulation (Chen et al., 2021). MA is one of the most widely abused illegal substances in the world, but unfortunately, there are still very few studies on detoxification after a period of time (Huang et al., 2021; Li et al., 2021). Due to the high addiction, it is prohibited in many countries. The abuse and addiction of MA has become one of the difficult problems threatening world health (Manzanares et al., 2018; Nicolas et al., 2021), which not only harms the health of addicts, but also hinders the economic development.
Methamphetamine can cause brain structure and functional impairments, whether the impairment still exists after a recovery period is not yet known. To study this problem, we collected neuroimaging data from abstaining MA-independent individuals (for at least 14 months). A better understanding of functional connectivity in the brains of MA abstainers will help to explain abnormal behavioral syndromes and to perform objective diagnosis of MA abstainers. As an effective method to analyze brain pathological patterns, resting-state functional magnetic resonance imaging (RS-fMRI) can reflect the spontaneous brain activity in humans (Rashid et al., 2016; Salman et al., 2018; Stoehr et al., 2021). However, RS-fMRI generates high dimension data. The key challenge to analyze RS-fMRI data is how to extract effective features. In the past, most studies of MA mainly focused on region of interest (ROI), which usually required prior knowledge to choose brain region in the network (Taheri et al., 2016). However, mounting evidences indicate that neurodegenerative processes are associated with the alterations in functional connectivity across the whole brain (Tang et al., 2018). There are few studies on the abnormal functional connection patterns of MA abstainers in the whole brain. One work on this topic showed that compared with healthy controls, MAs showed low network function in the cerebellum and high intra-network function in the post-significant network, proving that there is indeed a change in the brain function network(Jiang et al., 2021).
To analyze the high dimensional RS-fMRI data, it is possible to use kernel principal component analysis to identify the attention-deficit hyperactivity disorder though the accurate rate was less than 80% possibly due to the noisy data (Salimi-Khorshidi et al., 2014; Abrol et al., 2019). Typical independent component analysis (ICA) is a data-driven method (Allen et al., 2014; Qiu et al., 2019), which can eliminate the artificial error and extract the largest spatial independent component (Glasser et al., 2018). It can be used to obtain the brain network while removing noise and separate different but overlapping activities (Zhang et al., 2019). When ICA is used to find hidden sources from a group of observation or measurement data, each source has the greatest independence. ICA is a combination of spatial components, and each component is related to time courses (TCs) (Calhoun et al., 2005; Xie et al., 2017).
Some more recent methods for RS-fMRI data classification use functional connection as the input feature (Rashid et al., 2016). Although some progress has been made, the dynamics of time courses are ignored. In diagnosing and distinguishing complex mental diseases such as schizophrenia and Alzheimer’s disease, the overlooked time information is likely to become a key point in disease analysis (Yan et al., 2019). Sliding window correlation is a popular method used by most dynamic FC studies to capture the dynamics in TCs (Keilholz et al., 2013; Thompson et al., 2013; Wilson et al., 2015; Shakil et al., 2016; Vakamudi et al., 2020). When drawing a window on TCs, the two edges of the window will move during the acquisition process. It can better capture the dynamic changes of brain activity, thus enhancing the understanding of normal cognition and changes caused by brain diseases (Abrol et al., 2017).
After the completion of sliding window correlation, clustering is usually used to find the number of states and time points in the scanning process (Damaraju et al., 2014; Shakil et al., 2014). In the past few decades, various clustering algorithms have been proposed. Among these algorithms, k-means is a popular choice because it is simple, efficient, and has moderate but stable performance on different problems (Himberg et al., 2004). Since each person has multiple sliding windows, here we take the number of windows for every person in each class as the new features for classification. The decision tree is used as the classifier (Douglas et al., 2011), where the subject searches along a single path from the root to the leaf, and the path depends on the characteristics of the sample (Hehn et al., 2019). The decision tree can handle uneven data without standardizing and quantifying the data, and the logic is simple and intuitive.
In this paper, we exploit ICA, sliding window correlation, k-means clustering and decision tree to perform the data analysis. The motivation is to reduce the dimensionality of high-dimensional brain data for subsequent analysis. We propose the feature filtering method with multiple classification criteria, and the experimental results have shown its effectiveness in rendering the differences between the normal people and MA abstainers in their brain networks.
All subjects were fully informed of the nature of the study and all gave their written consent regarding participation. This study was approved by the local ethical committee of the Second Xiangya Hospital of Central South University Institutional Review Board for clinical research.
In order to discriminate the MA abstainers from the normal people, we developed a data-driven classifier that incorporates five steps: preprocessing, sliding windows, k-means clustering and classification. Figure 1 shows the overall flowchart.
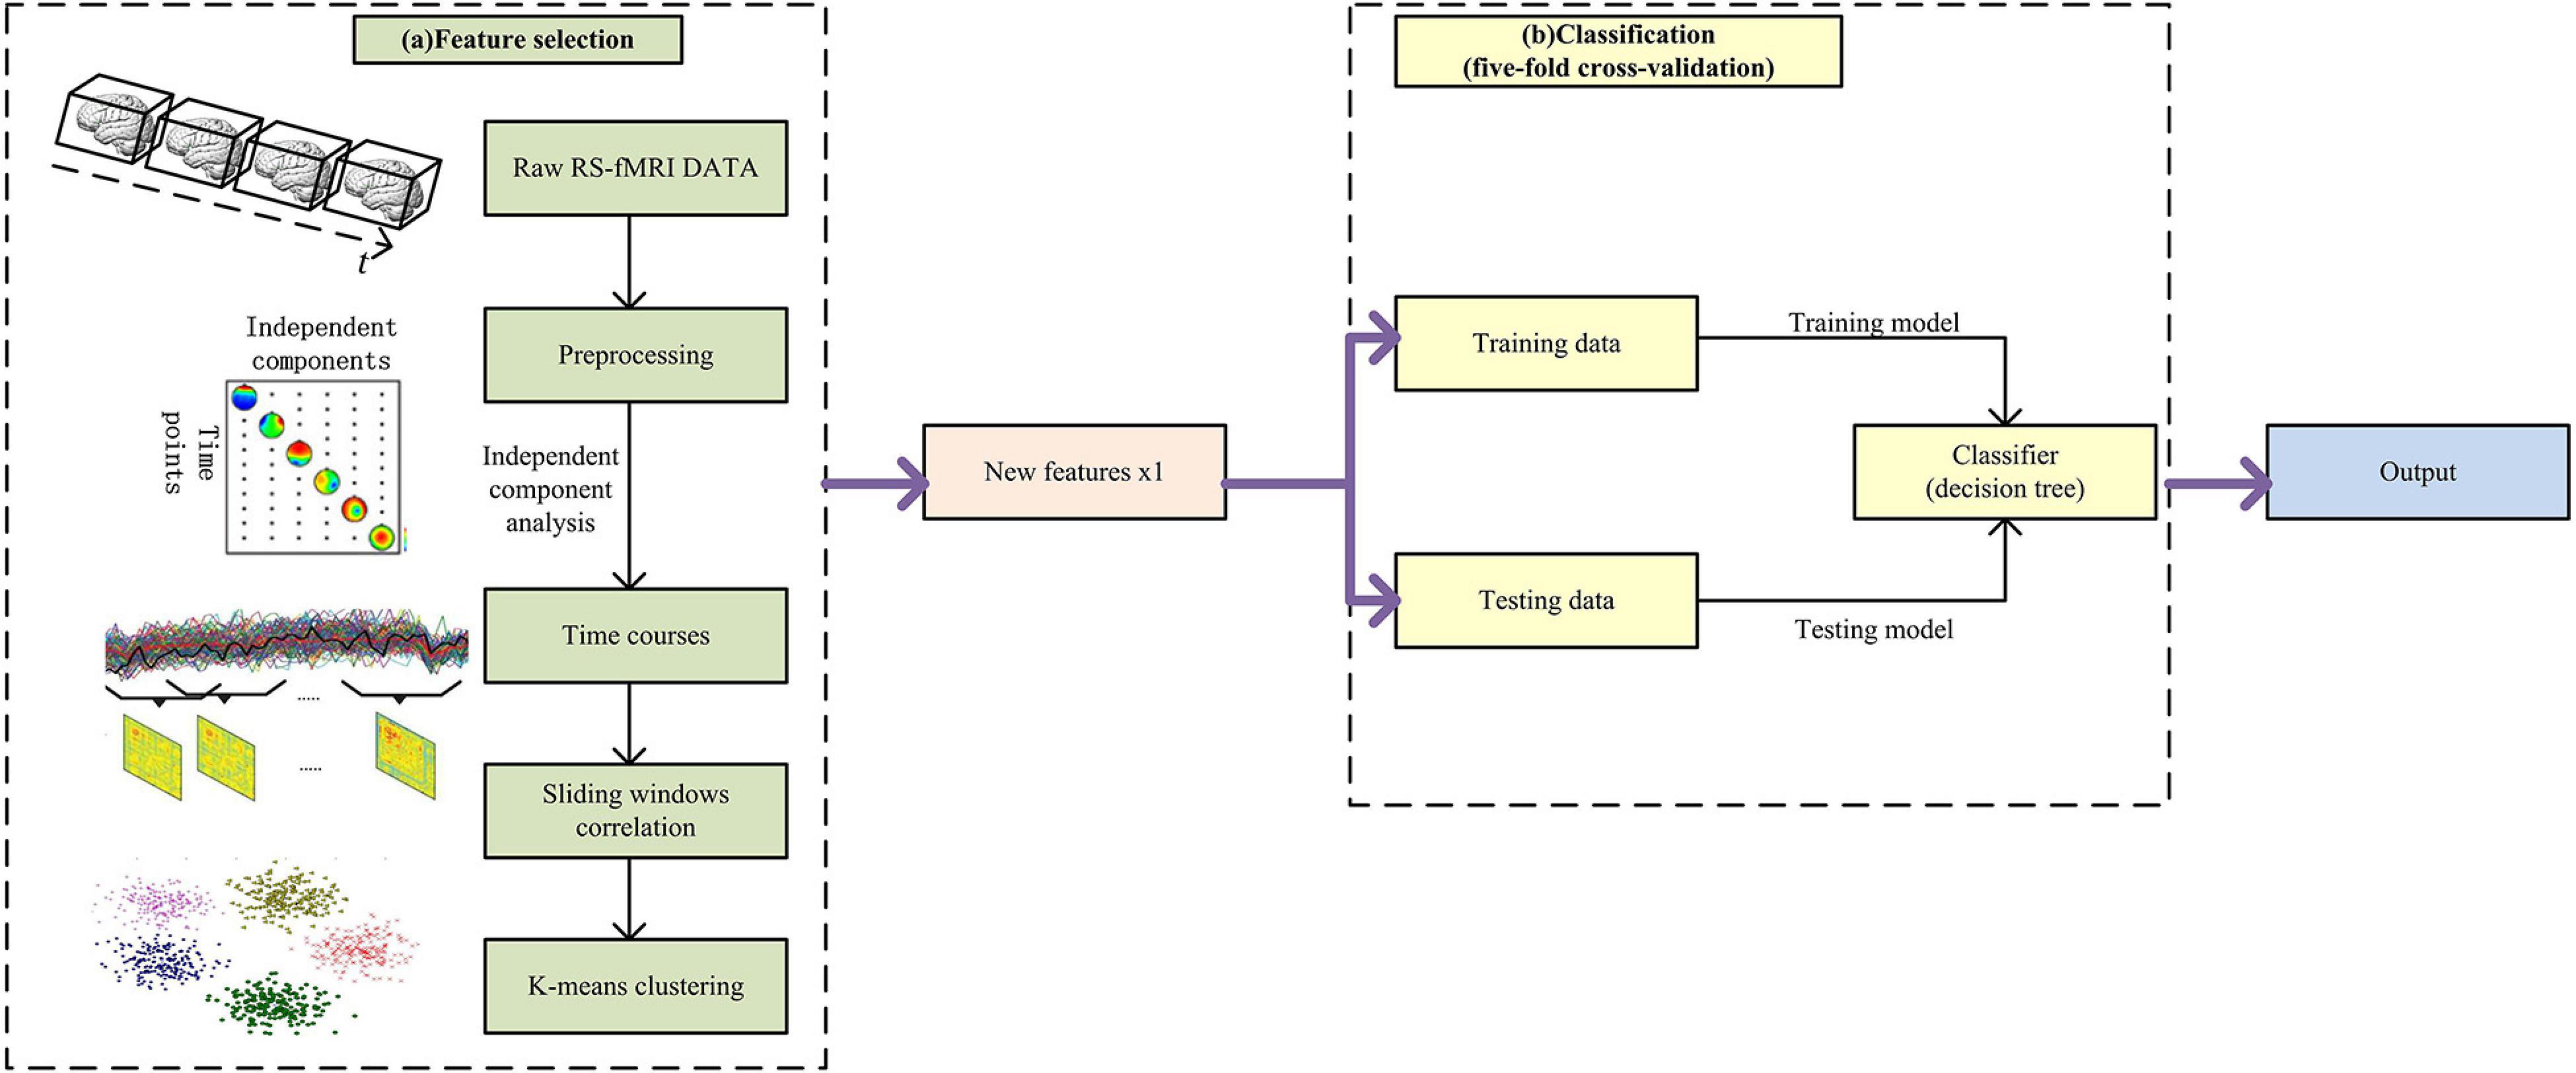
Figure 1. The framework of the proposed method.
We selected a data set containing 91 individuals (44 normal individuals, 47 MA abstainers), which was provided by the Second Xiangya Hospital of Central South University Medical Academy. The data collection was completed on the 3.0T MRI scanning system produced by Siemens. Everyone was required to wear sponge earplugs and noise-canceling headphones to lower noise, and elastic sponges were also used to fix the head to reduce head movement. When scanning in compartments, the even-numbered layer is scanned first, and then the odd-numbered layer. Each individual was collected 225 contiguous whole-brain resting-state functional images with the following parameters: number of slices = 36, TR = 2,000 ms, TE = 30 ms, FOV = 220 mm, flip angle = 80 degrees, slice thickness = 4 mm, image dimension = 64 × 64 × 36, and voxel size = 3.4 mm × 3.4 mm × 4 mm.
In the preprocessing, the SPM1 and DPASF (Yan et al., 2016) toolboxes were used. Due to the magnetic saturation, we removed the first ten volumes for each person. Then we proofread the scanning time point of each layer image, and the head motion correction was used to exclude subjects with excessive head movement. Next, we used the Echo-Planer Imaging (EPI) template of the Montreal Neurologic Institute (MNI) space to standardize the image registration to 3 mm × 3 mm × 3 mm (Brandman et al., 2021; Fan et al., 2021; Peng et al., 2021), and finally the Gaussian kernel with a half-height full-width value of 6 mm was used for spatial smoothing to reduce spatial noise (Maniar et al., 2021; van Buuren et al., 2021).
For quality control, participants with head movements greater than 2 mm or rotation parameters greater than 2 degrees were excluded. Forty one normal individuals and 40 MA abstainers were retained.
We used the GIFT toolkit2 to extract independent components from the pre-processed data. After estimating the optimal numbers of independent components using the MDL criterion (Li et al., 2007), we selected 50 independent components. The independent components estimated from the GIFT were processed by initializing parameters, group data reduction, calculating ICA, back reconstructing, calibrating components, and group stats. Then we used the resting state network (RSN) (Du and Fan, 2013; Du et al., 2017) template to generate the mask of 11 networks shown in Figure 2, including anterior salience network (ASN), auditory network (AN), dorsal default mode network (DDMN), higher visual network (HVN), language network (LN), posterior salience network (PSN), precuneus network (PN), right executive control network (RECN), sensorimotor network (SN), ventral default mode network (VDMN) and visuospatial network (VN). We calculated the correlation coefficients between the independent components and each mask, and allocated the independent components to the brain network with the highest correlation. The calculated correlation coefficients were placed in the attachments. Figure 2 shows the independent components in each brain network, and the area of each independent component is marked with a different color.
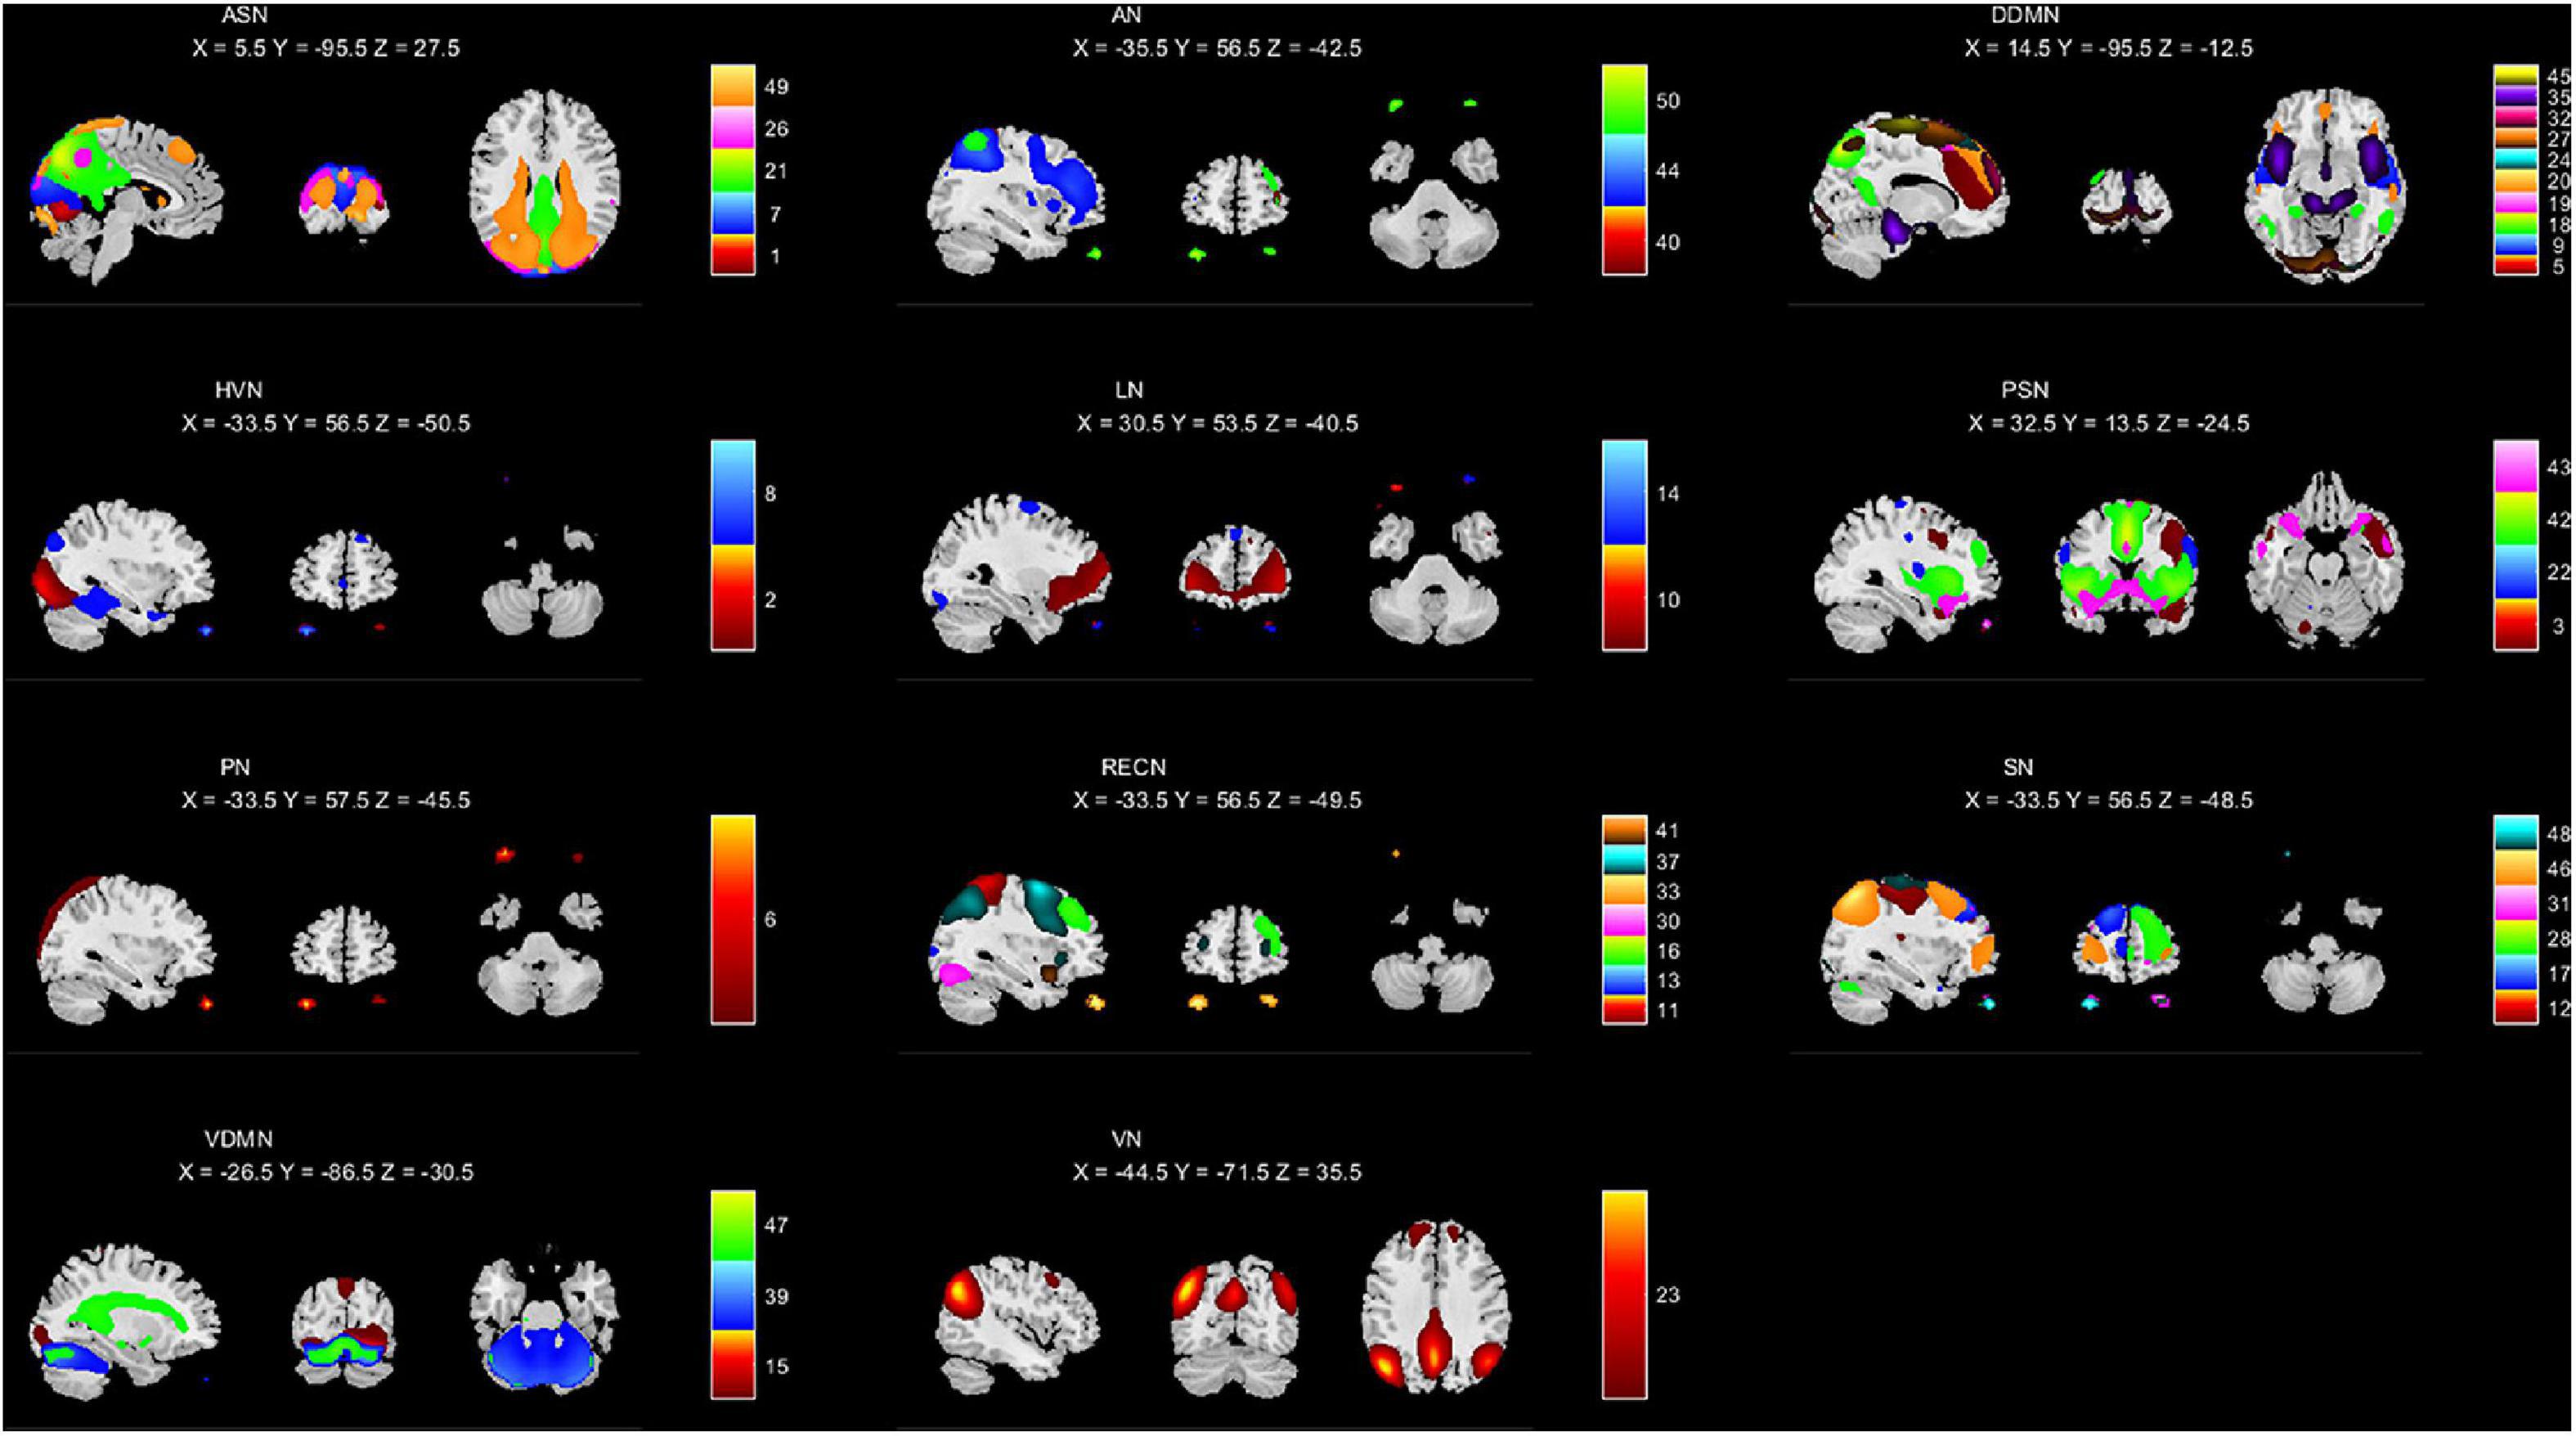
Figure 2. Intrinsic connectivity networks (a total of 44) arranged into groups: ASN, AN, DDMN, HVN, LN, PSN, PN, RECN, SN, VDMN, and VN. The associated number in each group indicates the number of ICNs included the group.
After going through the above steps, each participant has 44 time courses. Every time course has 215 time points. We used the sliding windows on the time axis. The window size between 30 and 60 s (15-30TR) leads to a relatively small impact on the dynamics, and can help correctly identify the cognitive states (Zalesky and Breakspear, 2015). Thus, the size of a sliding window was chosen as 25 TR with step size chosen as two. Here each participant is measured by (215−25)/2 = 95 sliding windows. For each sliding window, the correlations in pairs of time courses were calculated. Thus 44 × 44 symmetric matrices would be generated for each sliding window. Next, the upper triangular matrix of this symmetric matrix was extracted and converted it into a row vector. Then a 95 × 946 (946 = 44 × 43/2) dimensional sliding window feature matrix was produced for each participant, and each row represents the correlation of the independent components at that time point.
The feature matrices were calculated with the k-means clustering algorithm. The optimal number of clusters was determined to be 5 using the elbow criterion (Plis et al., 2018). We clustered the sliding window feature matrices of all participants by row. For everyone, we counted the number of windows gathered in each category, and these numbers were used as new features. After that, a new matrix of 1 × 5 dimensions was generated for each participant, which is the input to the decision tree for classification. Fivefold cross-validation was used and the metrics of the five times were averaged as the total results. The feature matrices of all participants were divided into five parts. Four parts were selected as the training set and the remaining part was used as the test set.
Different indicators are used to measure the method, including sensitivity, specificity, precision, accuracy, and F1 score. Sensitivity is the proportion of the true normal people who are correctly identified. Specificity is the proportion of true MA abstainers who are correctly identified. Accuracy is the percentage of people who are completely matched. Precision is the proportion of predicted normal people who are correctly identified. F1 score is the harmonic average of precision and sensitivity. The specific calculation methods are shown in below.
Here TP denotes the number of true positives (number of the normal people who are correctly identified) and TN is the number of true negatives (number of the MA abstainers who are correctly identified). FP denotes the number of false positives (number of the MA abstainers who are classified as the normal people), while FN is the number of false negatives (number of the normal people who were classified as the MA abstainers).
Various indicators of the model are calculated (accuracy: 82.3%, precision: 77.7%, specificity: 77.7%, sensitivity: 85.7, F1 score: 81.5%). The ROC curve is shown in Figure 3.
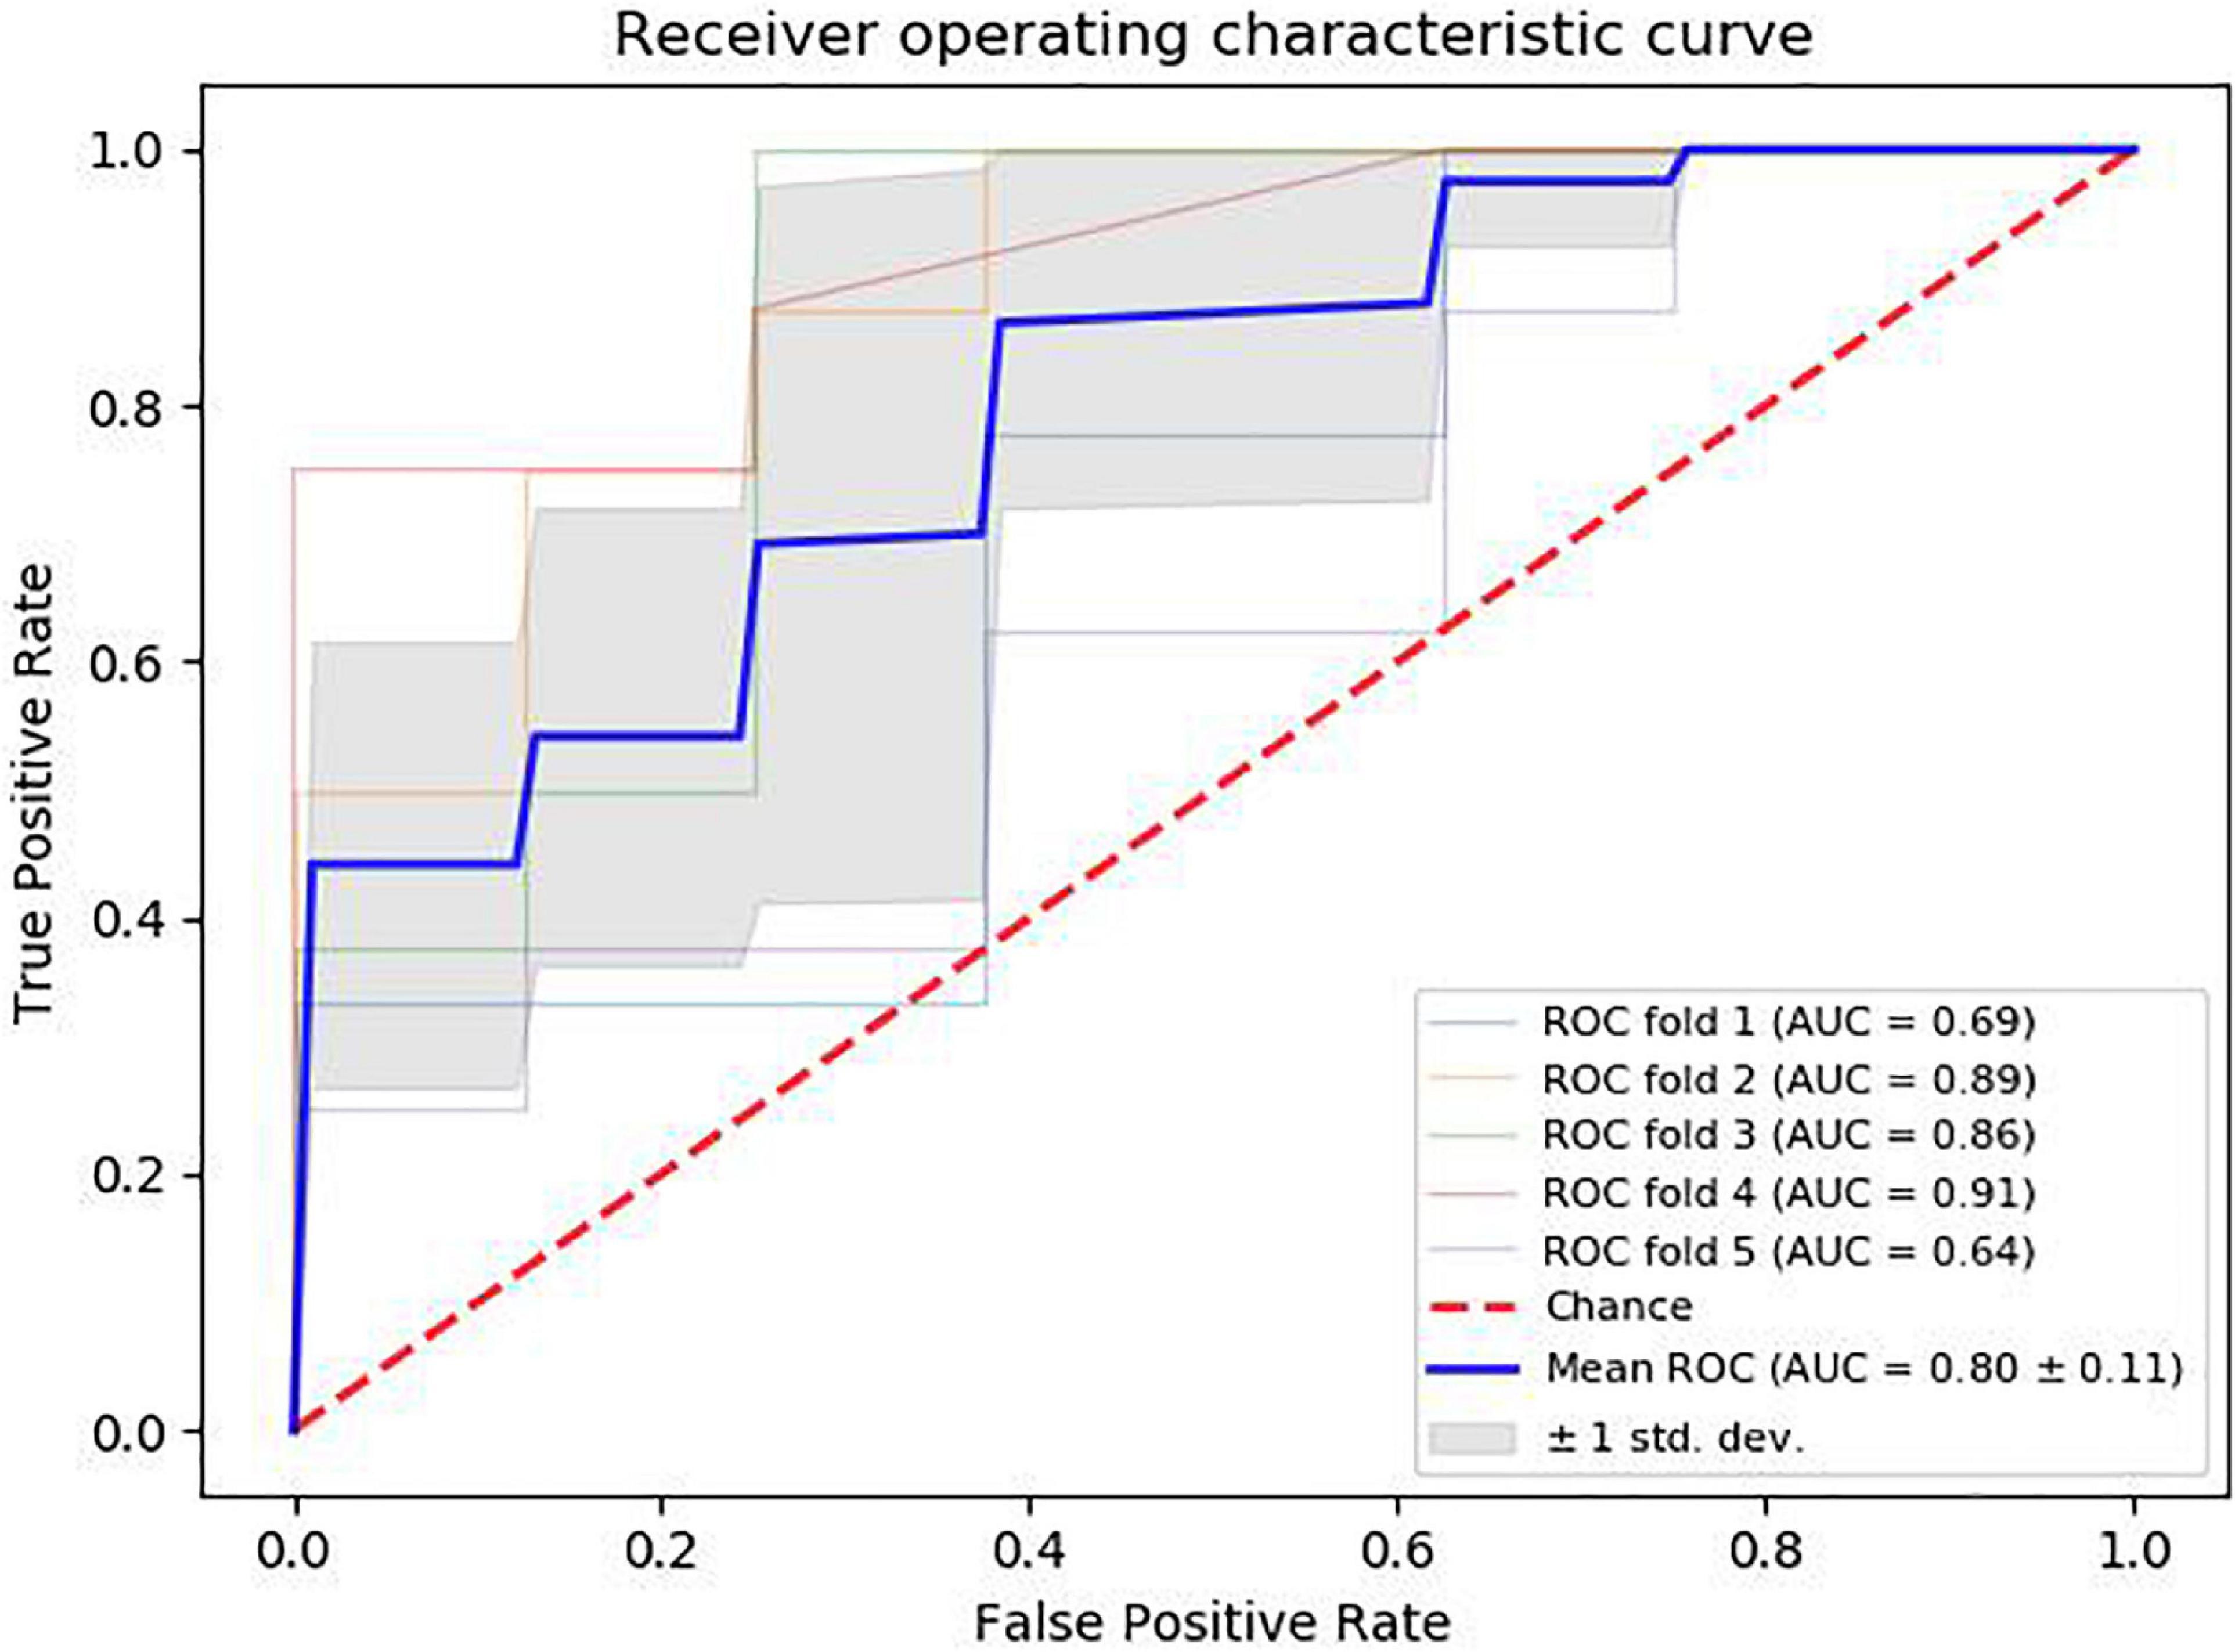
Figure 3. ROC curves and AUC values are shown in the picture.
In order to exclude the influence of head movement and age, we ensured that there is no significant difference between the parameters of MA abstainers and normal people during preprocessing. The head movement parameters of the remaining subjects are shown in Table 1. The p-value is obtained by the two-sample t-tests, and the data in the table is represented by the mean ± standard deviation.
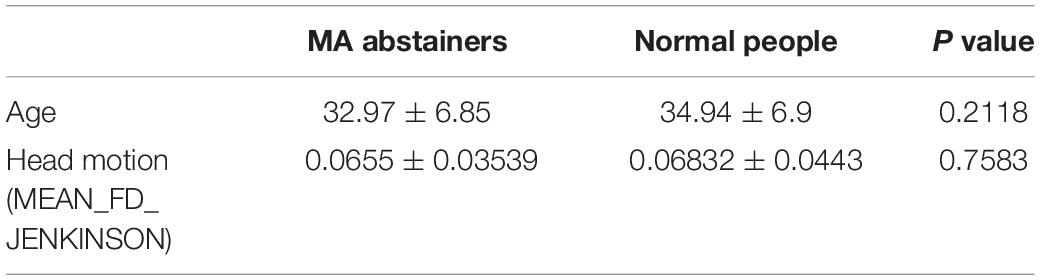
Table 1. Head movements and age information of the subjects.
We can see the feature distributions of various states in Figure 4. In the fifth state, there is a significant difference (p < 0.05) in the number of windows between normal people and MA abstainers. In the remaining states, there were no significant differences between normal people and MA abstainers.
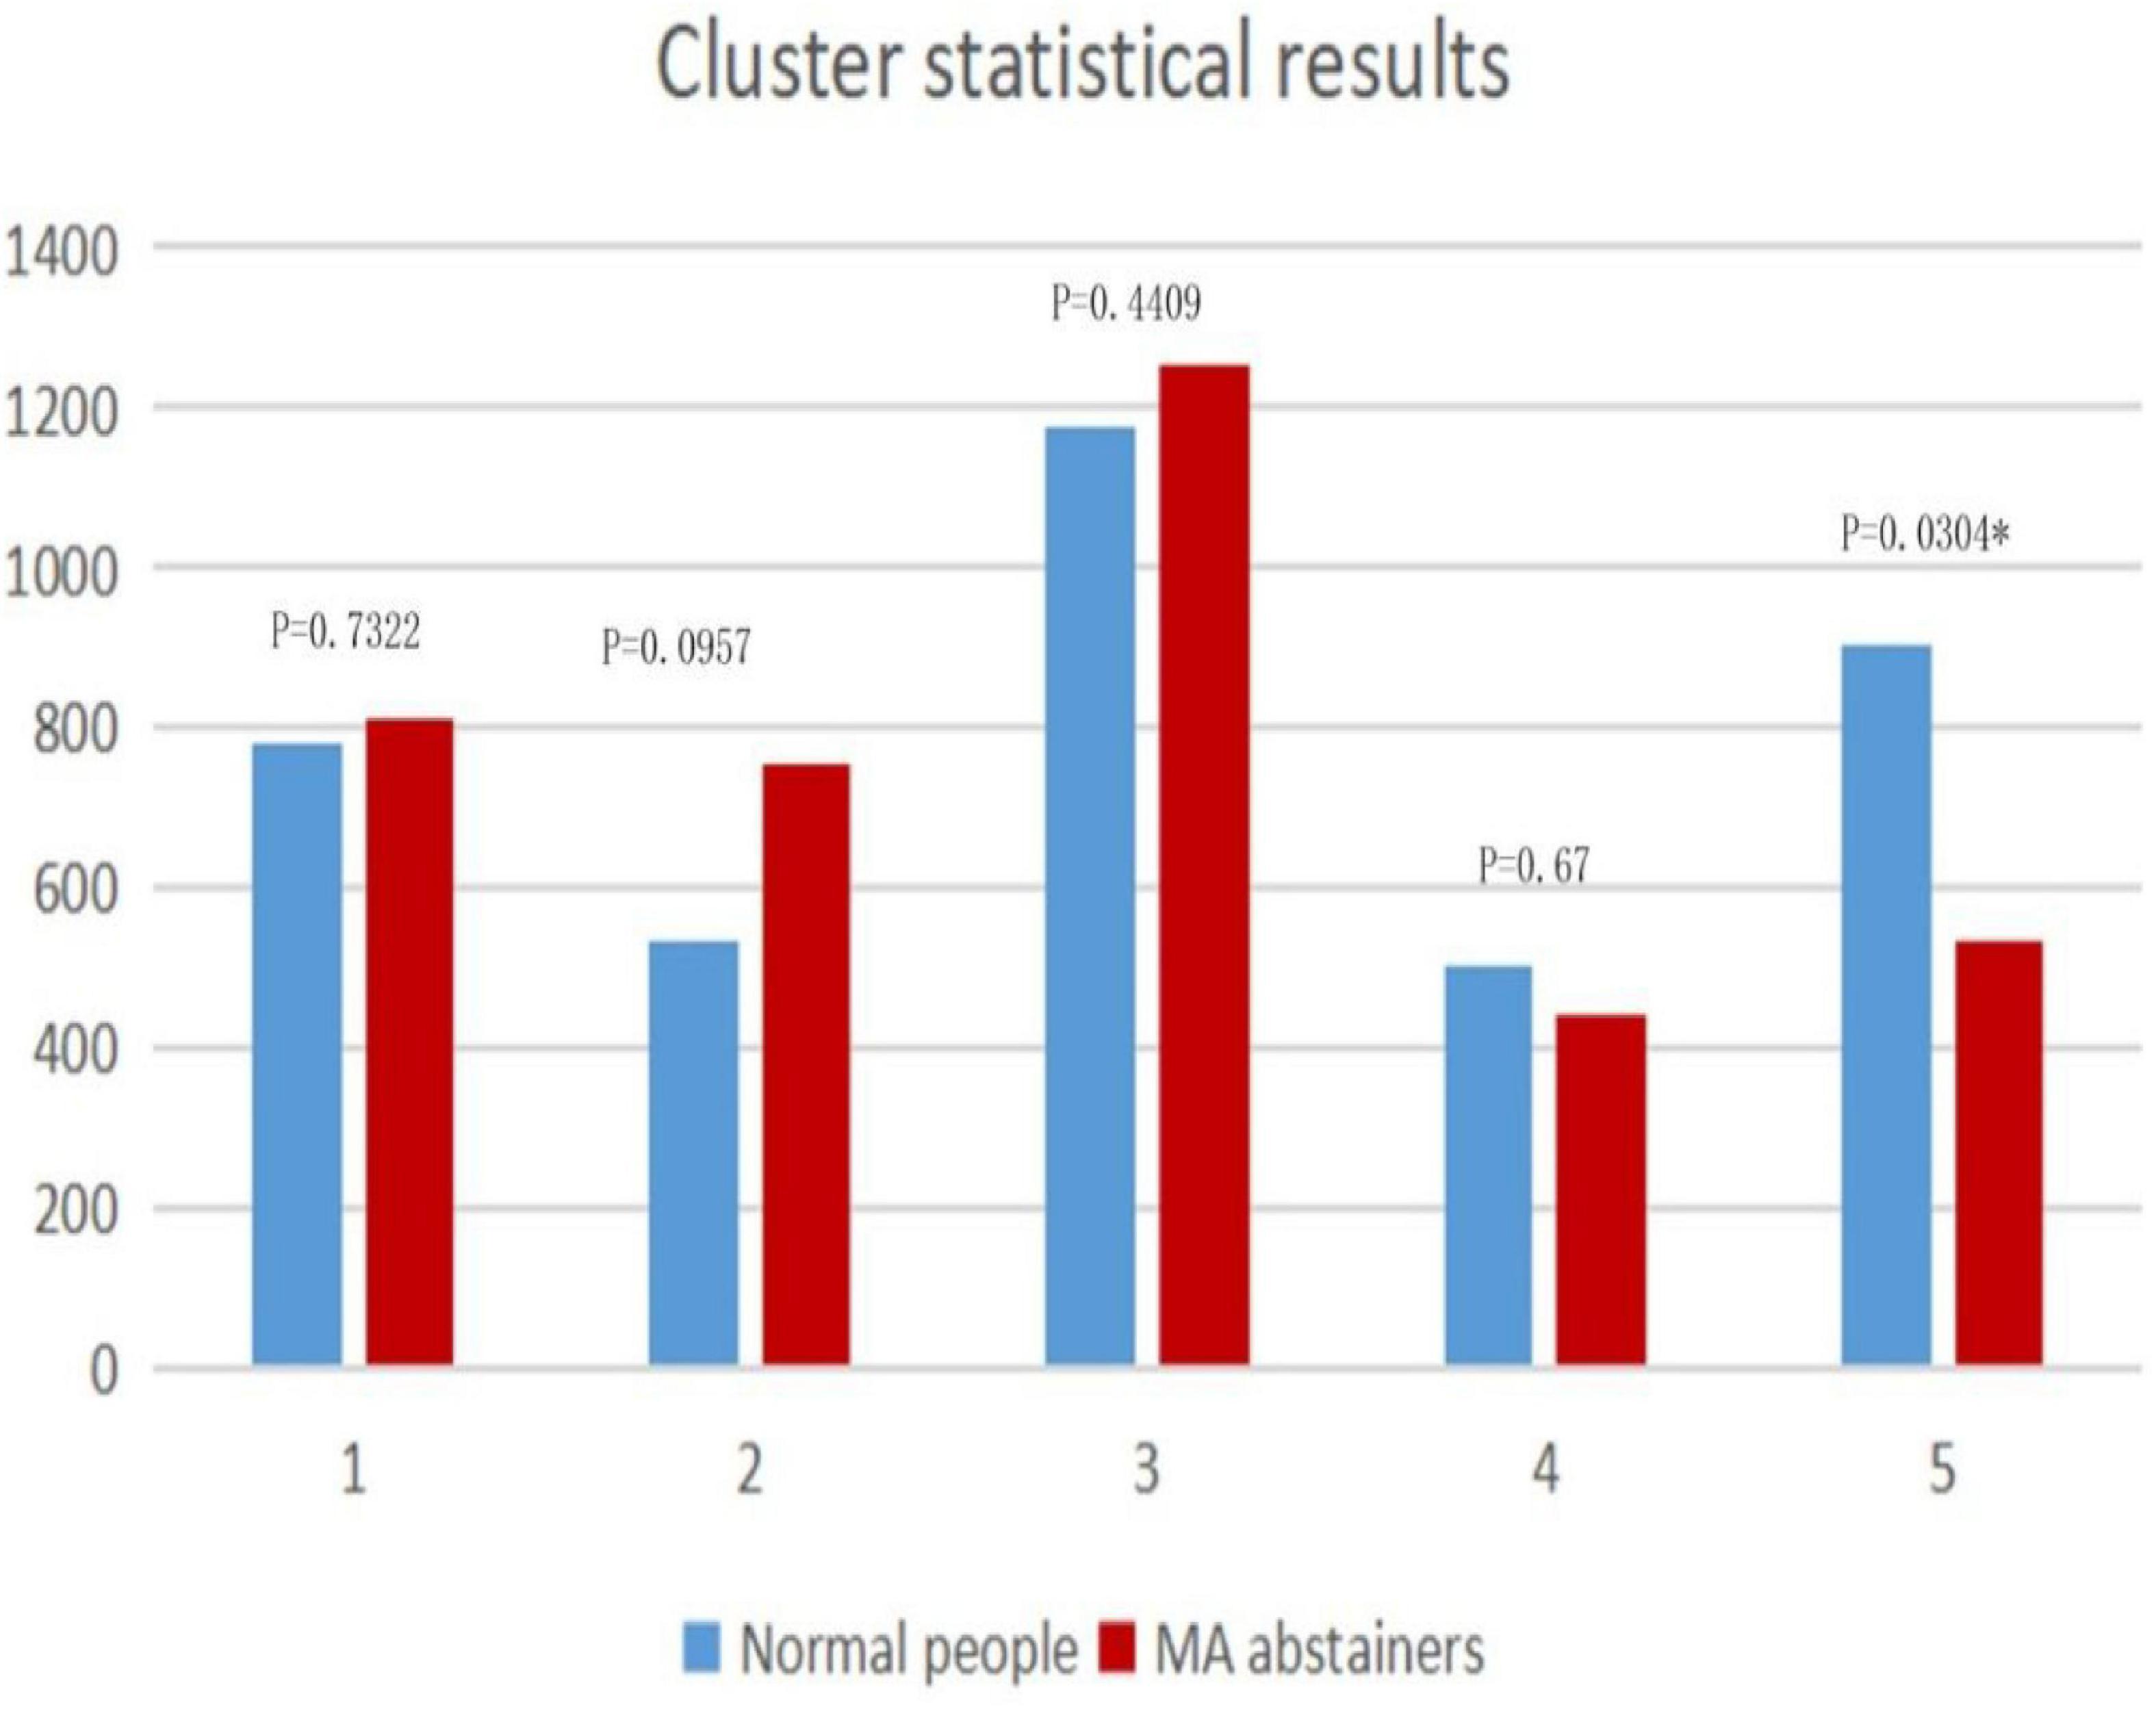
Figure 4. The figure shows the distributions in clusters. The horizontal axis represents the state of each cluster, and the vertical axis is the total number of windows in each category. The p-value of the two-sample t-test for each state is marked on the histogram.
The number of windows which is clustered to the fifth state in every sliding window is shown in Figure 5. The sliding windows that are higher than the mean of the difference are selected. The sliding windows of normal people and MA abstainers are selected for two-sample t-test and FDR multiple ratio correction, where the correlations with p value less than 1e-4 (Fayers, 2008) are selected for further analysis.
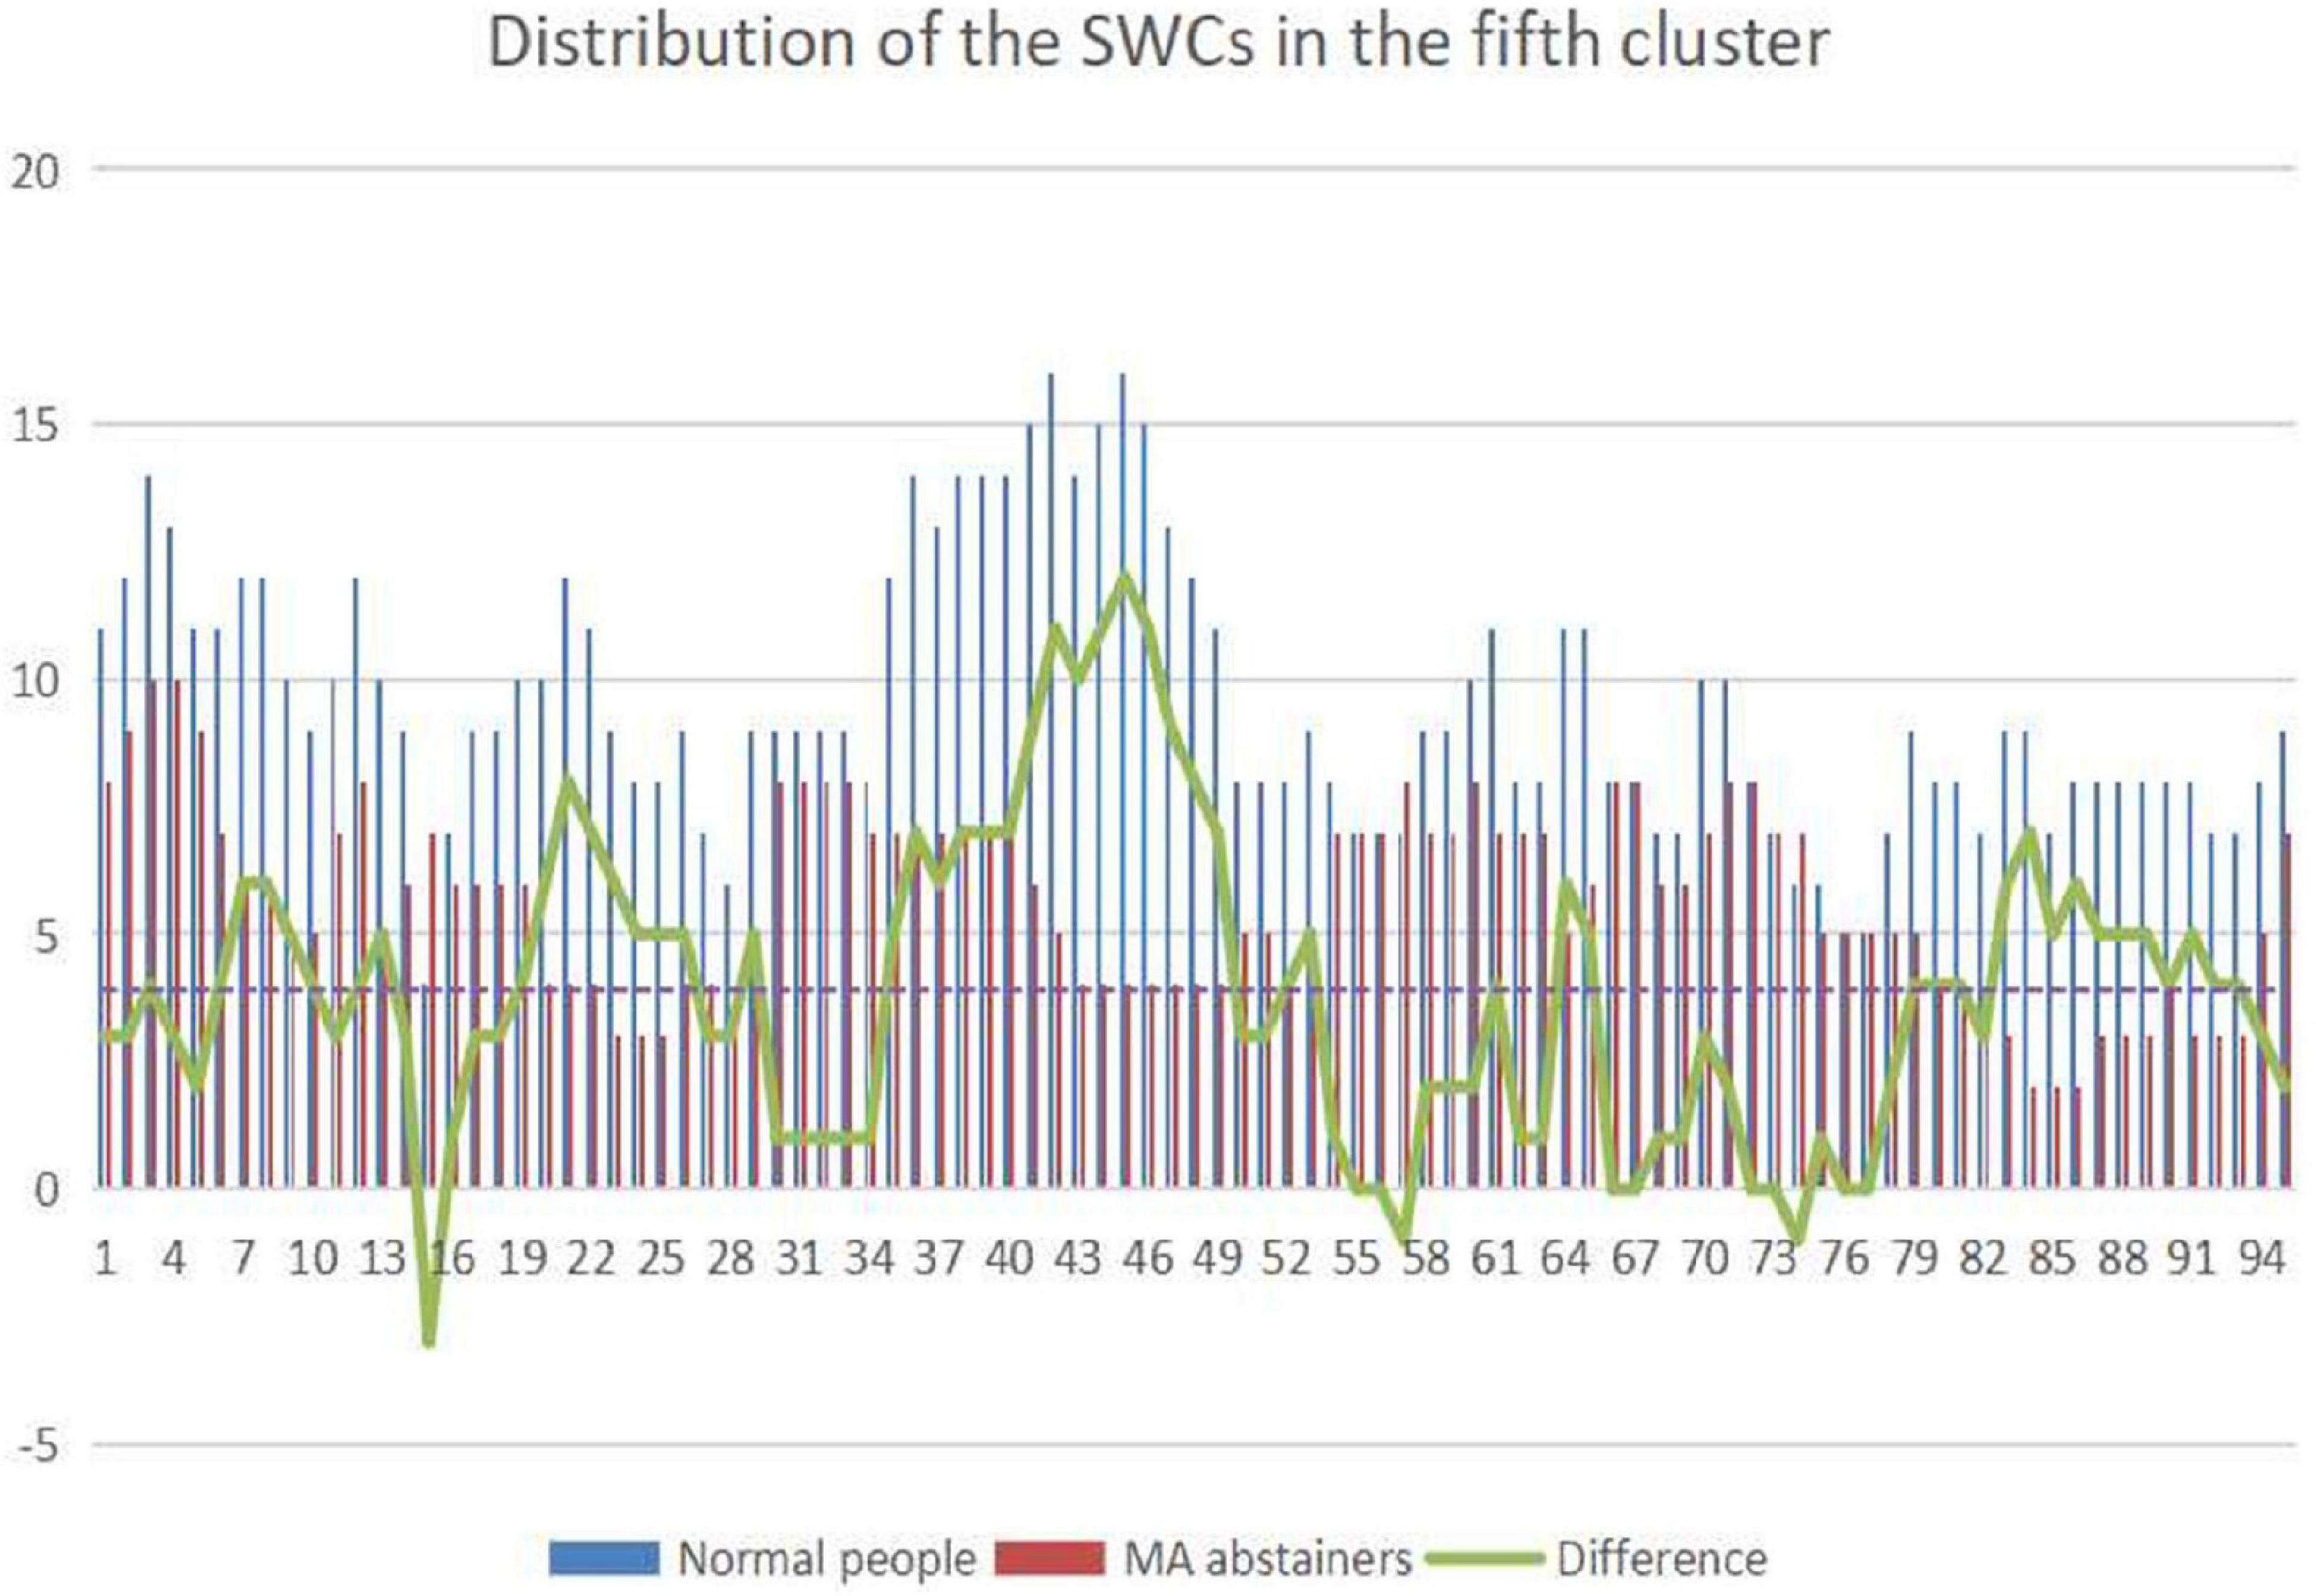
Figure 5. The picture shows the distribution of the sliding windows gathered in the fifth state of normal people and MA abstainers. The abscissa represents the label of the sliding windows, and the ordinate represents the number of sliding windows. The blue column represents the total number of normal people classified into a certain category, and the red one is MA abstainers. The green broken line indicates the difference in the total number of sliding windows.
Since the values in the sliding windows reflect the correlation between two independent components in the time courses, and each independent component belongs to a brain network. We draw a distribution map of the brain network of independent components in the Figure 6, and the largest proportion is DDMN.
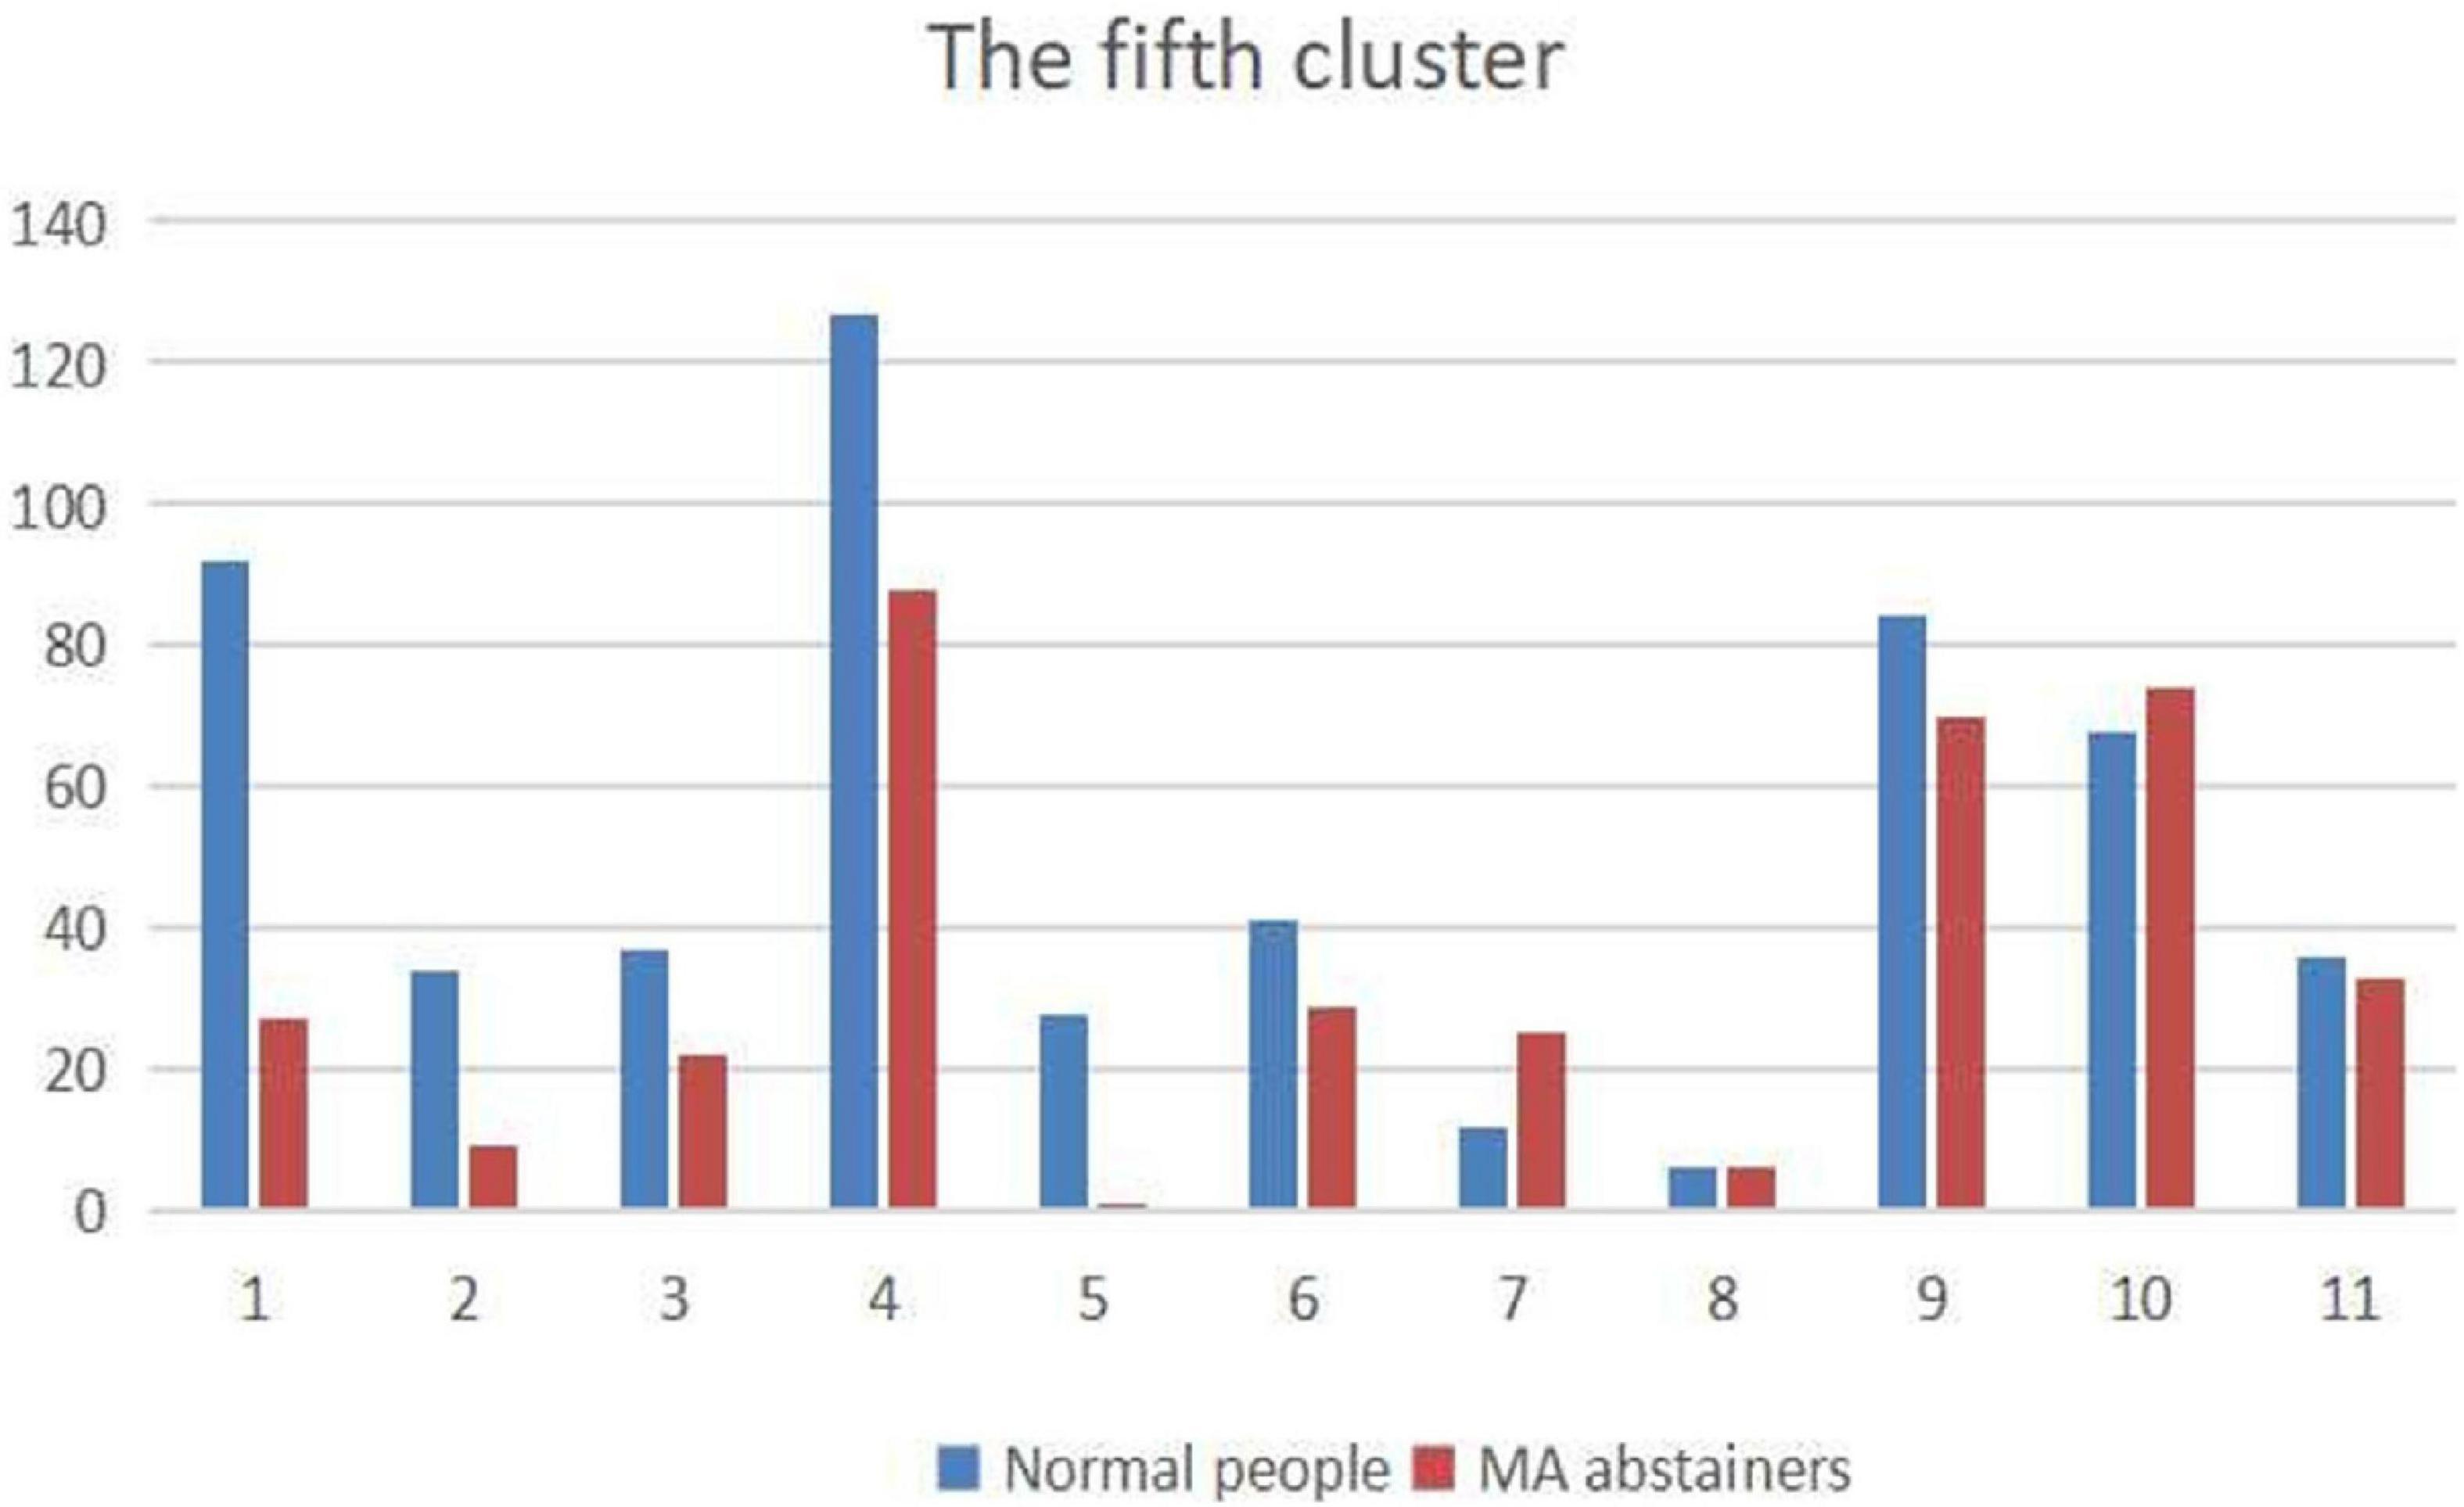
Figure 6. The figure shows the distribution of independent components belonging to the brain networks. The names of the brain networks labeled 1–11 are: ASN, HVN, PSN, DDMN, PN, VDMN, LN, VN, RECN, SN, and AN.
As shown in Figure 7, we use Pajek3 to draw the relationship among the independent components in the DDMN. In Figure 8, in addition to ASN and AN, the correlation of the normal people between DDMN and other brain is higher. That is to say, the connection between DDMN and ASN, DDMN, and AN in MA abstainers is more intimate, but this degree of intimacy is not highlighted in normal people. However, the correlation between DDMN and itself and LN is same between MA abstainers and normal people.
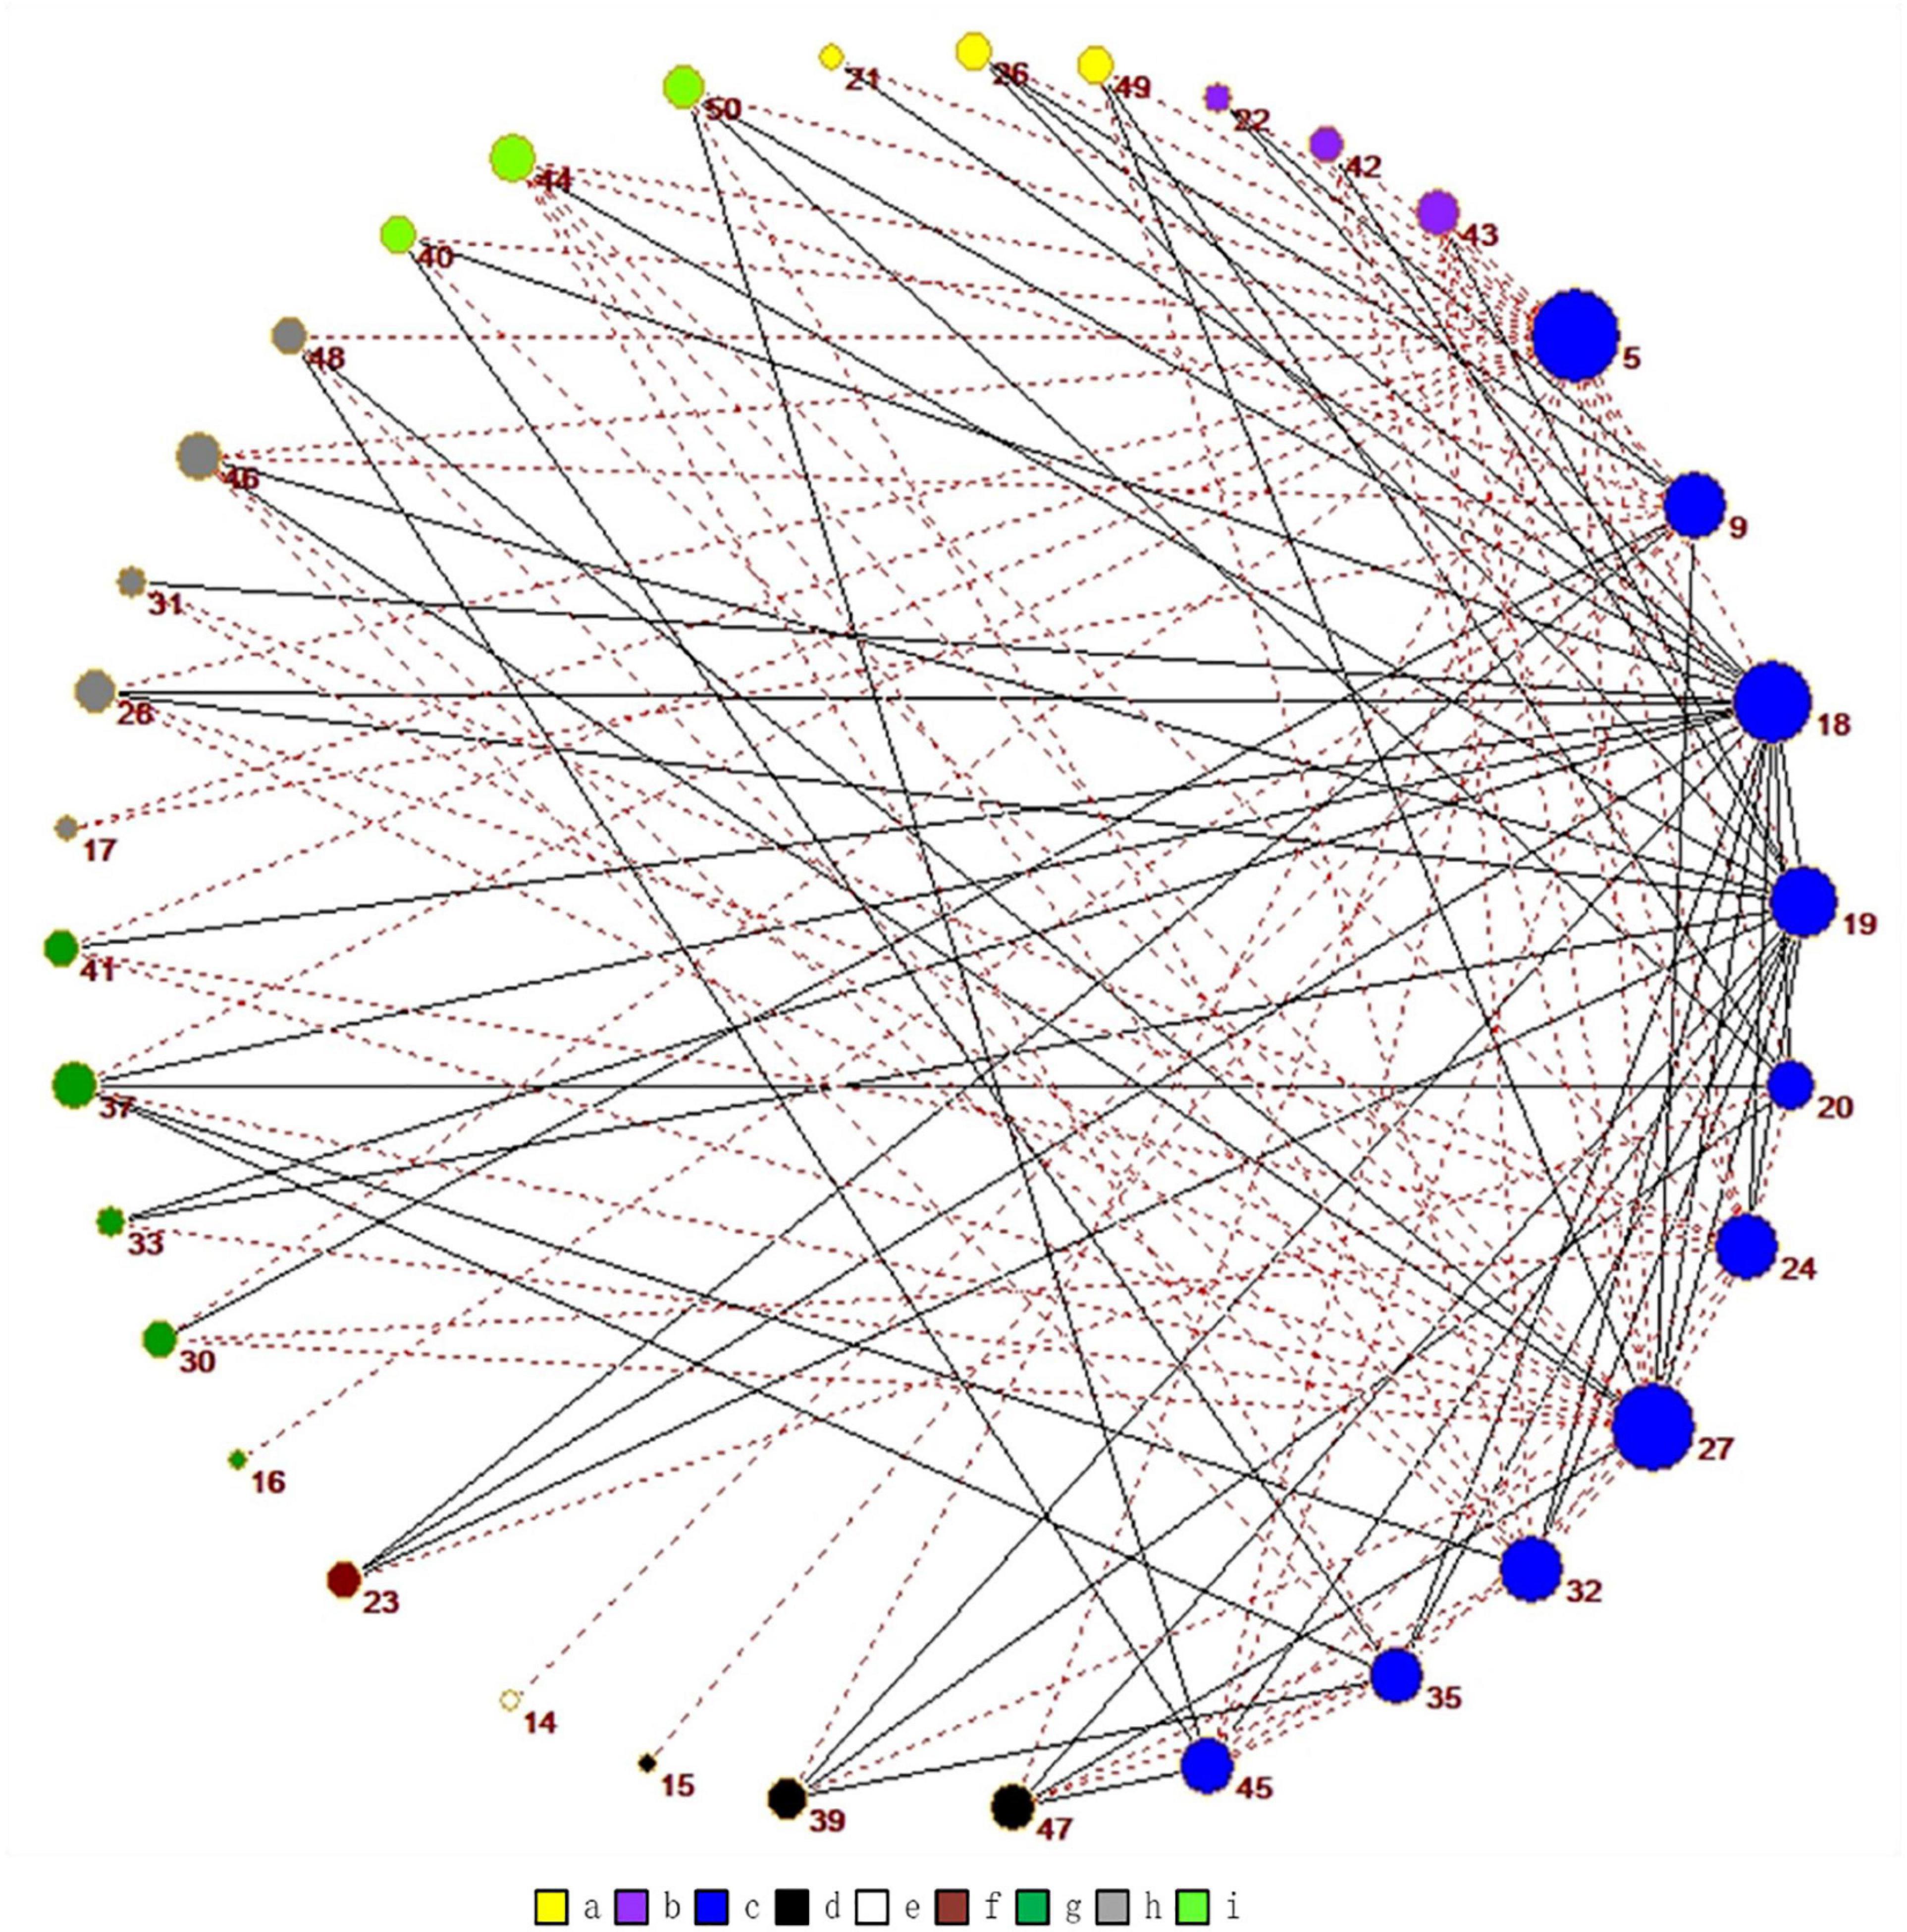
Figure 7. The graph shows all the correlations that are significantly different for normal people and MA abstainers in the DDMN. Among them, the red dotted line indicates the higher correlation of normal people while the gray one means the higher correlation of MA abstainers. The colors are related to different brain networks. The brain networks of a-i in the figure are ASN, PSN, DDMN, VDMN, LN, VN, RECN, SN, and AN.
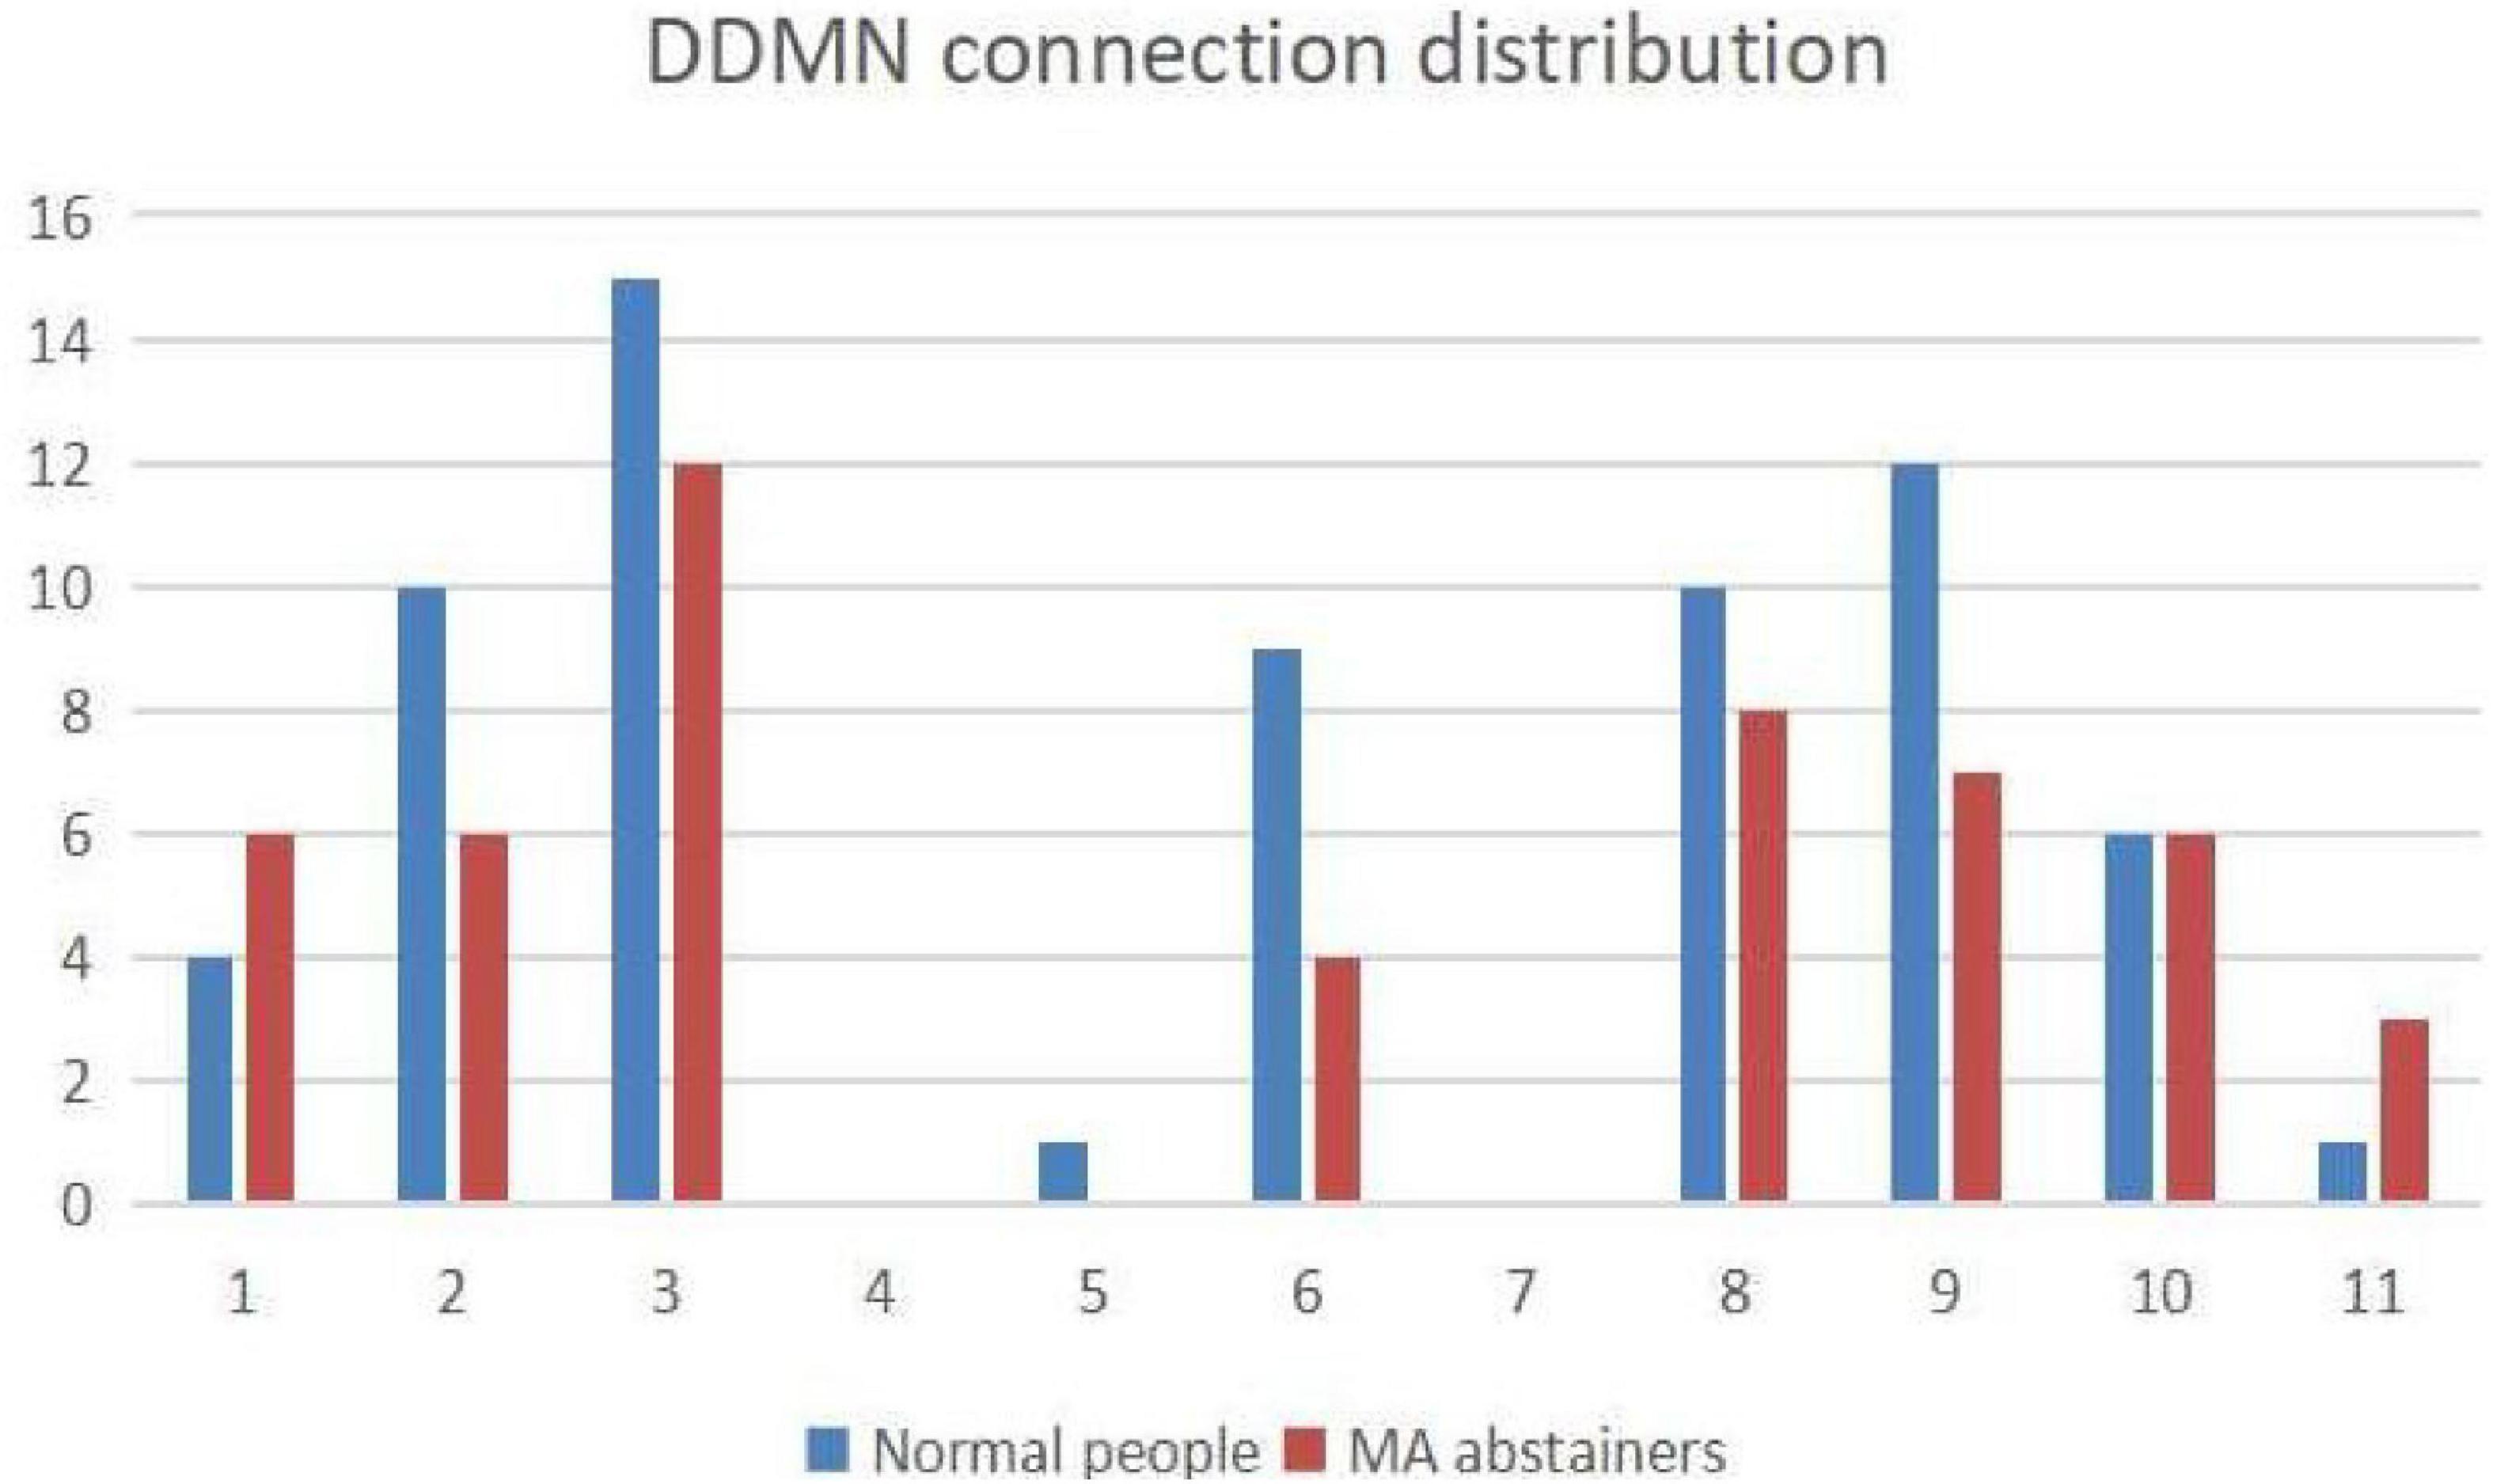
Figure 8. The figure shows the distribution of connection with each brain network in DDMN. The numbers 1–11 represent the corresponding brain networks: ASN, HVN, PSN, DDMN, PN, VDMN, LN, VN, RECN, SN and AN. The blue histogram indicates the number of normal people’s connections in this brain network, and the red histogram indicates the number of MA abstainers’ connections in this brain network.
In the time domain, the difference in DDMN between normal people and MA abstainers is the largest, and the results of the two-sample t-test in the spatial domain are listed in Table 2. The data shown in the table indicates that the difference in the time domain does not affect the spatial domain.
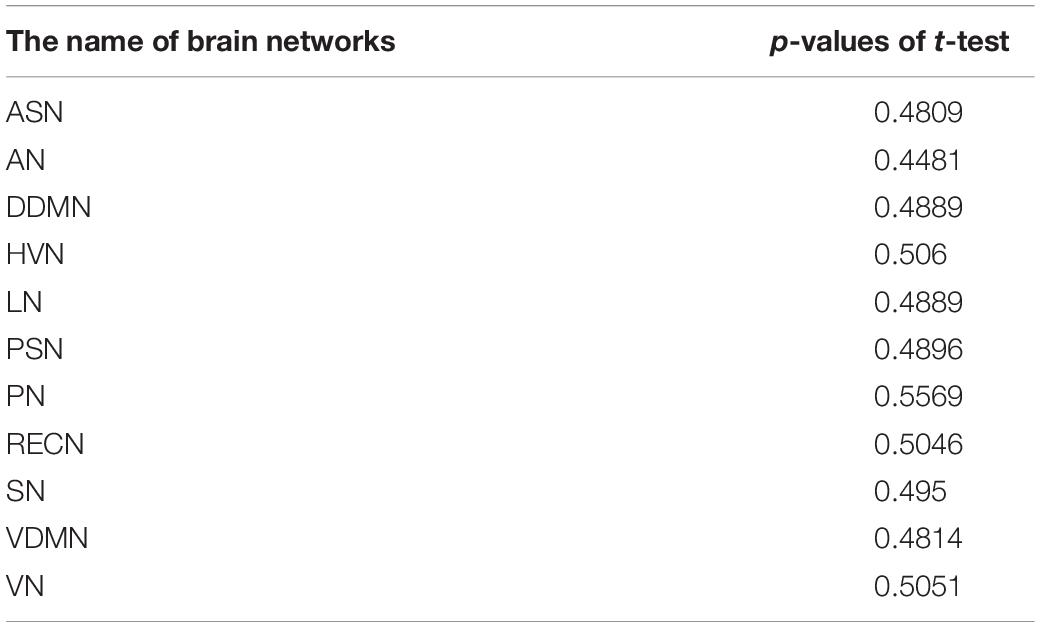
Table 2. The p-values of the components are shown in the table.
This study shows that MA abstainers can be distinguished from healthy controls by whole-brain RS-fMRI with high resolution. In addition, we find that the abnormal correlations on DDMN with other brain networks, indicating that MA may cause changes in the correlation of these brain networks in the time domain, but these differences are not synchronized in the space domain. The results of this study show that even after long-term withdrawal of MA, certain brain regions are exposed of drug related clues.
Previous research demonstrates that the abuse of MA has serious damage to various organs of the human body, including the brain. DDMN can be regarded as the background network of the brain (Yuan et al., 2021). The main feature is that its functional activity is higher in the resting state than in the motion state, which is related to memory and information processing. We found that DDMN plays the most important role in distinguishing normal people from MA abstainers, which is consistent with the results of many mental diseases. It shows abnormal functional connections in the MA abstainers, agreeing with the previous research results (Peng et al., 2021). This indicates that DDMN may be involved in the pathogenesis of mental diseases, and the results are related to the selected statistical methods, data analysis methods, sample size, selection of psychotropic drugs during treatment and other factors (Luo et al., 2019).
Emerging evidences suggested that DDMN plays a key role in processing consciousness, self-reflection, and episodic memory (Higgins et al., 2021). For people who are addicted to MA, they are weak in self-control and generally require external compulsory drugs to assist with withdrawal. These evidences coincide with our results that the brain network of MA abstainers after withdrawal for a period of time still has a big difference in DDMN. Long-term use of MA can lead to dysfunction of the brain network, and similar experiments have also found that the brain networks of MA abstainers have been damaged (Su et al., 2020). We also found that similar damage still exists after a period of treatment. Generally speaking, the correlation between DDMN and other brain networks is higher for normal people.
Dorsal default mode network plays the role of a central hub in prediction, which can reduce classification errors. In research on substance use disorders, it was found that DDMN is related to impaired self-awareness. This impairment manifests itself as the inability to convert internal or external stimuli to the individual into feedback to the self. The impairment of self-awareness also promotes uncontrolled drug use and also decreased sensitivity to the effects of drugs (Zhang et al., 2019). The ASN of MA abstainers is less correlated with other brain networks. After using MA, it will cause high-frequency auditory hallucinations (Liu et al., 2020).
After a period of detoxification, MA abstainers and normal people still have differences in some brain networks. The results of successful classification showed that the correlation between the independent components of MA abstainers and the control group was still significantly different in some brain networks. Drug addiction is a chronic and recurrent disease, which causes a huge global health burden. At present, drug addiction has not been effectively treated, which may be due to the difficulty in finding suitable targets to treat this complex disease, thus increasing the need for further identification of new therapeutic methods (Guo et al., 2017). Based on the features extracted from independent component analysis and sliding window correlation, this study determined the most relevant features for potential MA treatment and provided possible biomarkers to distinguish and predict the treatment response of MA-dependent patients. We hope in the future more large-sample studies could be conducted to help formulate effective drug treatment strategies and select surgical targets for MA treatment.
In this study, we successfully distinguished the MA abstainers from the normal control group, and determined the abnormally changed parts of brain networks through analyzing the RS-fMRI images of the whole brain. Our results prove the effectiveness the classification algorithm. Therefore, we believe that people who have been detoxified for a period of time still have differences in the time domain in DDMN.
The data analyzed in this study is subject to the following licenses/restrictions: This data set is provided by Xiangya Second Hospital. Requests to access these datasets should be directed to TD, ZG9uZ3Rpbmd0aW5nQGNzdS5lZHUuY24=.
The studies involving human participants were reviewed and approved by National Clinical Research Center for Mental Disorders, and Department of Psychiatry, The Second Xiangya Hospital of Central South University, Changsha, Hunan. The patients/participants provided their written informed consent to participate in this study. Written informed consent was obtained from the individual(s) for the publication of any potentially identifiable images or data included in this article.
TD wrote and experimented the manuscript. YT, QH, SH, JX, YG, QJ, HS, and HZ revised the manuscript and collected the data. All authors contributed to the article and approved the submitted version.
YT was supported by grant MIMS20-08 from the Research Fund of the Guangxi Key Lab of Multi-source Information Mining and Security. HS was supported by the National Natural Science Foundation of China (No. 81971249), National Research Program of China (No. 2016YFC0800908-Z02), and Natural Science Foundation of Hunan Province (No. 2020JJ4782).
The authors declare that the research was conducted in the absence of any commercial or financial relationships that could be construed as a potential conflict of interest.
All claims expressed in this article are solely those of the authors and do not necessarily represent those of their affiliated organizations, or those of the publisher, the editors and the reviewers. Any product that may be evaluated in this article, or claim that may be made by its manufacturer, is not guaranteed or endorsed by the publisher.
Abrol, A., Damaraju, E., Miller, R. L., Stephen, J. M., Claus, E. D., Mayer, A. R., et al. (2017). Replicability of time-varying connectivity patterns in large resting state fMRI samples. Neuroimage 163, 160–176. doi: 10.1016/j.neuroimage.2017.09.020
Abrol, A., Fu, Z., Du, Y., and Calhoun, V. D. (2019). “Multimodal data fusion of deep learning and dynamic functional connectivity features to predict Alzheimer’s disease progression,” in Proceedings of the 41st Annual International Conference of the IEEE Engineering in Medicine and Biology Society (EMBC), (Berlin: Institute of Electrical and Electronics Engineers).
Allen, E. A., Damaraju, E., Plis, S. M., Erhardt, E. B., Eichele, T., and Calhoun, V. D. (2014). Tracking whole-brain connectivity dynamics in the resting state. Cereb. Cortex 24, 663–676. doi: 10.1093/cercor/bhs352
Brandman, T., Malach, R., and Simony, E. (2021). The surprising role of the default mode network in naturalistic perception. Commun. Biol. 4:79.
Calhoun, V. D., Adali, T., Stevens, M. C., Kiehl, K. A., and Pekar, J. J. (2005). Semi-blind ICA of fMRI: a method for utilizing hypothesis-derived time courses in a spatial ICA analysis. Neuroimage 25, 527–538.
Chen, Y., Li, M., Ji, Q., Su, Z., Yang, Z., Xu, Y., et al. (2021). Clinical study of paliperidone palmitate long-acting injection combined with electroacupuncture in the treatment of methamphetamine addicts. Front. Pharmacol. 12:698740. doi: 10.3389/fphar.2021.698740
Damaraju, E., Allen, E. A., Belger, A., Ford, J. M., Mcewen, S., Mathalon, D. H., et al. (2014). Dynamic functional connectivity analysis reveals transient states of dysconnectivity in schizophrenia. Neuroimage Clin. 5, 298–308. doi: 10.1016/j.nicl.2014.07.003
Douglas, P. K., Harris, S., Yuille, A., and Cohen, M. S. (2011). Performance comparison of machine learning algorithms and number of independent components used in fMRI decoding of belief vs. disbelief. Neuroimage 56, 544–553. doi: 10.1016/j.neuroimage.2010.11.002
Du, Y., and Fan, Y. (2013). Group information guided ICA for fMRI data analysis. Neuroimage 69, 157–197. doi: 10.1016/j.neuroimage.2012.11.008
Du, Y., Pearlson, G. D., Lin, D., Sui, J., Chen, J., Salman, M., et al. (2017). Identifying dynamic functional connectivity biomarkers using GIG-ICA: application to schizophrenia, schizoaffective disorder, and psychotic bipolar disorder. Hum. Brain Mapp. 38, 2683–2708. doi: 10.1002/hbm.23553
Fan, F., Liao, X., Lei, T., Zhao, T., Xia, M., Men, W., et al. (2021). Development of the default-mode network during childhood and adolescence: a longitudinal resting-state fMRI study. Neuroimage 226:117581. doi: 10.1016/j.neuroimage.2020.117581
Fayers, P. M. (2008). The scales were highly correlated: P = 0.0001. Qual. Life Res. 17, 651–652. doi: 10.1007/s11136-008-9351-4
Glasser, M. F., Coalson, T. S., Bijsterbosch, J. D., Harrison, S. J., Harms, M. P., Anticevic, A., et al. (2018). Using temporal ICA to selectively remove global noise while preserving global signal in functional MRI data. Neuroimage 181, 692–717. doi: 10.1016/j.neuroimage.2018.04.076
Guo, H., Zhang, F., Chen, J., Xu, Y., and Xiang, J. (2017). Machine learning classification combining multiple features of a hyper-network of fMRI data in Alzheimer’s disease. Front. Neurosci. 11:615. doi: 10.3389/fnins.2017.00615
Hehn, T. M., Kooij, J. F. P., and Hamprecht, F. A. (2019). End-to-end learning of decision trees and forests. Int. J. Comp. Vis. 128, 997–1011. doi: 10.1007/s11263-019-01237-6
Higgins, C., Liu, Y., Vidaurre, D., Kurth-Nelson, Z., Dolan, R., Behrens, T., et al. (2021). Replay bursts in humans coincide with activation of the default mode and parietal alpha networks. Neuron 109:e887.
Himberg, J., Hyvarinen, A., and Esposito, F. (2004). Validating the independent components of neuroimaging time series via clustering and visualization. Neuroimage 22, 1214–1222. doi: 10.1016/j.neuroimage.2004.03.027
Huang, J., Zhang, R., Wang, S., Zhang, D., Leung, C. K., Yang, G., et al. (2021). Methamphetamine and HIV-tat protein synergistically induce oxidative stress and blood-brain barrier damage via transient receptor potential melastatin 2 channel. Front. Pharmacol. 12:619436. doi: 10.3389/fphar.2021.619436
Jiang, P., Sun, J., Zhou, X., Lu, L., Li, L., Huang, X., et al. (2021). Functional connectivity abnormalities underlying mood disturbances in male abstinent methamphetamine abusers. Hum. Brain Mapp. 42, 3366–3378. doi: 10.1002/hbm.25439
Keilholz, S. D., Magnuson, M. E., Pan, W. J., Willis, M., and Thompson, G. J. (2013). Dynamic properties of functional connectivity in the rodent. Brain Connect. 3, 31–40. doi: 10.1089/brain.2012.0115
Li, H., Chen, J. A., Ding, Q. Z., Lu, G. Y., Wu, N., Su, R. B., et al. (2021). Behavioral sensitization induced by methamphetamine causes differential alterations in gene expression and histone acetylation of the prefrontal cortex in rats. BMC Neurosci. 22:24. doi: 10.21203/rs.2.20165/v3
Li, Y. O., Adali, T., and Calhoun, V. D. (2007). Estimating the number of independent components for functional magnetic resonance imaging data. Hum. Brain Mapp. 28, 1251–1266. doi: 10.1002/hbm.20359
Liu, Y., Zhu, J., Li, Q., Wang, Y., Li, Y., Chen, J., et al. (2020). Differences in the amplitude of low-frequency fluctuation between methamphetamine and heroin use disorder individuals: a resting-state fMRI study. Brain Behav. 10:e01703.
Luo, N., Tian, L., Calhoun, V. D., Chen, J., Lin, D., Vergara, V. M., et al. (2019). Brain function, structure and genomic data are linked but show different sensitivity to duration of illness and disease stage in schizophrenia. Neuroimage Clin. 23:101887. doi: 10.1016/j.nicl.2019.101887
Maniar, Y. M., Peck, K. K., Jenabi, M., Gene, M., and Holodny, A. I. (2021). Functional MRI shows altered deactivation and a corresponding decrease in functional connectivity of the default mode network in patients with gliomas. AJNR Am. J. Neuroradiol. 42, 1505–1512. doi: 10.3174/ajnr.A7138
Manzanares, J., Cabanero, D., Puente, N., Garcia-Gutierrez, M. S., Grandes, P., and Maldonado, R. (2018). Role of the endocannabinoid system in drug addiction. Biochem. Pharmacol. 157, 108–121. doi: 10.1016/j.bcp.2018.09.013
Nicolas, C., Hofford, R. S., Dugast, E., Lardeux, V., Belujon, P., Solinas, M., et al. (2021). Prevention of relapse to methamphetamine self-administration by environmental enrichment: involvement of glucocorticoid receptors. Psychopharmacology. Mar 25. doi: 10.1007/s00213-021-05770-6
Peng, Y., Zhang, S., Zhou, Y., Song, Y., Yang, G., Hao, K., et al. (2021). Abnormal functional connectivity based on nodes of the default mode network in first-episode drug-naive early-onset schizophrenia. Psychiatry Res. 295:113578. doi: 10.1016/j.psychres.2020.113578
Plis, S. M., Amin, M. F., Chekroud, A., Hjelm, D., Damaraju, E., Lee, H. J., et al. (2018). Reading the (functional) writing on the (structural) wall: multimodal fusion of brain structure and function via a deep neural network based translation approach reveals novel impairments in schizophrenia. Neuroimage 181, 734–747. doi: 10.1016/j.neuroimage.2018.07.047
Qiu, Y., Lin, Q. H., Kuang, L. D., Gong, X. F., Cong, F., Wang, Y. P., et al. (2019). Spatial source phase: a new feature for identifying spatial differences based on complex-valued resting-state fMRI data. Hum. Brain Mapp. 40, 2662–2676. doi: 10.1002/hbm.24551
Rashid, B., Arbabshirani, M. R., Damaraju, E., Cetin, M. S., Miller, R., Pearlson, G. D., et al. (2016). Classification of schizophrenia and bipolar patients using static and dynamic resting-state fMRI brain connectivity. Neuroimage 134, 645–657. doi: 10.1016/j.neuroimage.2016.04.051
Salimi-Khorshidi, G., Douaud, G., Beckmann, C. F., Glasser, M. F., Griffanti, L., and Smith, S. M. (2014). Automatic denoising of functional MRI data: combining independent component analysis and hierarchical fusion of classifiers. Neuroimage 90, 449–468. doi: 10.1016/j.neuroimage.2013.11.046
Salman, M. S., Du, Y., Lin, D., Fu, Z., Damaraju, E., Sui, J., et al. (2018). Group ICA for identifying biomarkers in schizophrenia: ‘Adaptive’ networks via spatially constrained ICA show more sensitivity to group differences than spatio-temporal regression. NeuroImage Clin. 22:101747. doi: 10.1016/j.nicl.2019.101747
Shakil, S., Lee, C. H., and Keilholz, S. D. (2016). Evaluation of sliding window correlation performance for characterizing dynamic functional connectivity and brain states. Neuroimage 133, 111–128. doi: 10.1016/j.neuroimage.2016.02.074
Shakil, S., Magnuson, M. E., Keilholz, S. D., and Lee, C.-H. (2014). Cluster-based analysis for characterizing dynamic functional connectivity. Annu. Int. Conf. IEEE Eng. Med. Biol. Soc. 2014, 982–985.
Stoehr, C., Aston, J. A. D., and Kirch, C. (2021). Detecting changes in the covariance structure of functional time series with application to fMRI data. Econom. Stat. 18, 44–62. doi: 10.1016/j.ecosta.2020.04.004
Su, H., Liu, Y., Yin, D., Chen, T., Li, X., Zhong, N., et al. (2020). Neuroplastic changes in resting-state functional connectivity after rTMS intervention for methamphetamine craving. Neuropharmacology 175:108177. doi: 10.1016/j.neuropharm.2020.108177
Taheri, S., Xun, Z., See, R. E., Joseph, J. E., and Reichel, C. M. (2016). Cocaine and methamphetamine induce opposing changes in BOLD signal response in rats. Brain Res. 1642, 497–504. doi: 10.1016/j.brainres.2016.04.040
Tang, Y., Liu, B., Yang, Y., Wang, C. M., Meng, L., Tang, B. S., et al. (2018). Identifying mild-moderate Parkinson’s disease using whole-brain functional connectivity. Clin. Neurophysiol. 129, 2507–2516. doi: 10.1016/j.clinph.2018.09.006
Thompson, G. J., Magnuson, M. E., Merritt, M. D., Schwarb, H., Pan, W. J., Mckinley, A., et al. (2013). Short-time windows of correlation between large-scale functional brain networks predict vigilance intraindividually and interindividually. Hum. Brain Mapp. 34, 3280–3298. doi: 10.1002/hbm.22140
Vakamudi, K., Trapp, C., Talaat, K., Gao, K., Sa De La Rocque Guimaraes, B., and Posse, S. (2020). Real-time resting-state functional magnetic resonance imaging using averaged sliding windows with partial correlations and regression of confounding signals. Brain Connect. 10, 448–463. doi: 10.1089/brain.2020.0758
van Buuren, M., Lee, N. C., Vegting, I., Walsh, R. J., Sijtsma, H., Hollarek, M., et al. (2021). Intrinsic network interactions explain individual differences in mentalizing ability in adolescents. Neuropsychologia 151:107737. doi: 10.1016/j.neuropsychologia.2020.107737
Wilson, R. S., Mayhew, S. D., Rollings, D. T., Goldstone, A., Przezdzik, I., Arvanitis, T. N., et al. (2015). Influence of epoch length on measurement of dynamic functional connectivity in wakefulness and behavioural validation in sleep. Neuroimage 112, 169–179. doi: 10.1016/j.neuroimage.2015.02.061
Xie, J., Douglas, P. K., Wu, Y. N., Brody, A. L., and Anderson, A. E. (2017). Decoding the encoding of functional brain networks: an fMRI classification comparison of non-negative matrix factorization (NMF), independent component analysis (ICA), and sparse coding algorithms. J. Neurosci. Methods 282, 81–94. doi: 10.1016/j.jneumeth.2017.03.008
Yan, C. G., Wang, X. D., Zuo, X. N., and Zang, Y. F. (2016). DPABI: data processing & analysis for (resting-state) brain imaging. Neuroinformatics 14, 339–351. doi: 10.1007/s12021-016-9299-4
Yan, W., Calhoun, V., Song, M., Cui, Y., Yan, H., Liu, S., et al. (2019). Discriminating schizophrenia using recurrent neural network applied on time courses of multi-site FMRI data. Ebiomedicine 47, 543–552. doi: 10.1016/j.ebiom.2019.08.023
Yuan, Y., Pan, X., and Wang, R. (2021). Biophysical mechanism of the interaction between default mode network and working memory network. Cogn. Neurodyn. doi: 10.1007/s11571-021-09674-1
Zalesky, A., and Breakspear, M. (2015). Towards a statistical test for functional connectivity dynamics. Neuroimage 114, 466–470. doi: 10.1016/j.neuroimage.2015.03.047
Keywords: Methamphetamine, classification, independent component analysis, sliding window, brain network, K-means clustering
Citation: Dong T, Huang Q, Huang S, Xin J, Jia Q, Gao Y, Shen H, Tang Y and Zhang H (2021) Identification of Methamphetamine Abstainers by Resting-State Functional Magnetic Resonance Imaging. Front. Psychol. 12:717519. doi: 10.3389/fpsyg.2021.717519
Received: 31 May 2021; Accepted: 09 August 2021;
Published: 30 August 2021.
Edited by:
Xia-an Bi, Hunan Normal University, ChinaCopyright © 2021 Dong, Huang, Huang, Xin, Jia, Gao, Shen, Tang and Zhang. This is an open-access article distributed under the terms of the Creative Commons Attribution License (CC BY). The use, distribution or reproduction in other forums is permitted, provided the original author(s) and the copyright owner(s) are credited and that the original publication in this journal is cited, in accordance with accepted academic practice. No use, distribution or reproduction is permitted which does not comply with these terms.
*Correspondence: Yan Tang, dGFuZ3lhbkBjc3UuZWR1LmNu; Hao Zhang, aGFvQGNzdS5lZHUuY24=
†These authors share first authorship
Disclaimer: All claims expressed in this article are solely those of the authors and do not necessarily represent those of their affiliated organizations, or those of the publisher, the editors and the reviewers. Any product that may be evaluated in this article or claim that may be made by its manufacturer is not guaranteed or endorsed by the publisher.
Research integrity at Frontiers
Learn more about the work of our research integrity team to safeguard the quality of each article we publish.