 Wouter Oomens
95% of researchers rate our articles as excellent or good
Learn more about the work of our research integrity team to safeguard the quality of each article we publish.
Find out more
TECHNOLOGY AND CODE article
Front. Psychol. , 04 May 2021
Sec. Quantitative Psychology and Measurement
Volume 12 - 2021 | https://doi.org/10.3389/fpsyg.2021.629012
The Random Number Generation (RNG) task has a long history in neuropsychology as an assessment procedure for executive functioning. In recent years, understanding of human (executive) behavior has gradually changed from reflecting a static to a dynamic process and this shift in thinking about behavior gives a new angle to interpret test results. However, this shift also asks for different methods to process random number sequences. The RNG task is suited for applying non-linear methods needed to uncover the underlying dynamics of random number generation. In the current article we present RandseqR: an R-package that combines the calculation of classic randomization measures and Recurrence Quantification Analysis. RandseqR is an easy to use, flexible and fast way to process random number sequences and readies the RNG task for current scientific and clinical use.
The Random Number Generation (RNG) task has potential as an easy to administer and concise assessment tool of executive functioning (EF). The rationale behind the RNG paradigm is simple: it requires executive control (i.e., inhibition of prepotent responses and monitoring of working memory content) to avoid deterministic (i.e., non-random) behavior. Over the years, several measures have been proposed that quantify RNG performance based on deviations from mathematical randomness. Research has shown that these randomization measures could be attributed to different aspects of EF, namely inhibition of prepotent responses and updating of working memory (Towse and Neil, 1998; Miyake et al., 2000; Peters et al., 2007; Maes et al., 2011). It is noteworthy that these aspects of EF imply a strong dependence on the temporal structure of the response sequence. Both inhibition of number selection and updating of working memory content is a function of previously selected numbers. However, randomization measures only explain this temporal structure on minimum timescales. For example, redundancy expresses the inequality of response usage (Shannon, 1948), while RNG expresses the difference between the observed and mathematical diagram distribution (Evans, 1978).
In general, randomization measures are not sensitive to a disruption of the temporal structure of a sequence. In a large pool of experimental and simulated time-series (including random sequences), Giuliani et al. (2001), distinguished between the information gained from an order-dependent analysis and an order-independent analysis of time series and clearly emphasized the role of information as an order-dependent process. This clearly shows that the temporal structure of the response sequence contains a wealth of information about the underlying executive behavior and corresponds to the notion that variability in behavioral data is not mere random fluctuation (Gilden, 2001; Van Orden et al., 2003). To fully understand executive behavior, it is paramount to use complexity methods that quantify the characteristics of any temporal pattern (Shockley, 2005; Webber and Zbilut, 2005). Recurrence quantification analysis (RQA) is such a complexity method, which is applicable to categorical (Dale and Spivey, 2005; Dale et al., 2011) and relatively short time series, like random number sequences.
Quantifying the performance on the RNG task through calculating randomization measures is an onerous task. Two decades ago, Towse and Neil (1998) developed software (i.e., RGcalc) to make the computation of randomization measures more manageable and accessible. Nowadays, the functionality of RGcalc is increasingly obsolescent and it offers little flexibility. Although RQA is a relatively new method, there are already several toolboxes available to compute RQA measures. The first of these toolboxes (The Cross Recurrence Plot toolbox for MATLAB) was released in 2007 by Marwan and in 2014 Coco and Dale released an R package to perform RQA. More recently, Hasselman (2017) developed an R package for studying Complex Adaptive System and NETworks (casnet), that includes extensive RQA functionality. To make the RNG task accessible for current scientific and clinical use we compiled both methods (randomization measures and RQA measures) into a single R package (RandseqR). RandseqR encompasses functions to compute randomization measures, based on mathematical equations taken from Towse and Neil (1998) and RQA functionality imported from casnet. We explain the functionality of RandseqR in the present paper.
For the reproduction of the randomization measures, the source code of the RGcalc software was made available to us by John Towse. The classic randomization measures available in RandseqR are Redundancy (R), RNG, RNG2, Coupon, Null-Score Quotient (NSQ), First-Order Difference (FOD), Adjacency, Turning Point Index (TPI), Phase Length, Runs, Repetition Distance, Repetition Gap, and Phi index. For a full explanation of these measures, see Towse and Neil (1998).
To smooth out the output in RandseqR (compared to RGcalc), small alterations are made to the default calculation of the randomization measures. First, RGcalc returns percentages for some randomization measures, while returning proportions (i.e., a value between 0 and 1) for other measures. For example, RGcalc returns percentages for R, while returning proportions for RNG (which is a redundancy measure for diagrams instead of single numbers). For these measures RandseqR returns proportions of 1. For TPI, which can have values >100%, RandseqR returns a value with a mean of 0 (ranging from −1 to 1), similar to the output of phi-index, which has a mean 0 and values ranging from -infinite to infinite. The output was left the same for all measures where the above is not applicable, like coupon and the frequency distributions. Secondly, RGcalc pairs the last digit in the number sequence to the first for some randomization measures (RNG), but not for all measures (for RNG2 RGcalc does not do this). Since the diagrams created by this pairing have no relevance toward the executive construct under study (e.g., inhibition of prepotent responses), RandseqR never pairs the end of the number sequence to the start. Lastly, according to Towse and Neil (1998), Runs (the variability of Phase lengths) is only calculated over ascending Phase Lengths in RGcalc, whereas RandseqR calculates Runs over both ascending and descending Phase Lengths. Alternatively, RandseqR has the option to override the default calculation of the randomization measures in order to replicate output similar to RGcalc, with the exception of Runs, which could not be reproduced even with the RGcalc source code.
A quantitative description of recurrence is given by the following RQA measures: Recurrence Rate (RR), Determinism (DET), Laminarity (LAM), maximal diagonal line length (Lmax), mean diagonal line length (Lmean), entropy of diagonal line length distribution (Lentr), maximal vertical line length (Vmax), Trapping Time (TT), and entropy of vertical line length distribution (Ventr). For a full explanation of these RQA measures, see Marwan et al. (2007) and Hasselman (2017).
For a tutorial on RQA in R, see Wallot (2017). Although the packages/functions used in this paper are different from those implemented in RandseqR, basic considerations and recommendations are independent of the choice of package. Of importance is that RQA measures are affected by the following parameters: embedding dimension (M), time delay (τ), minimal line length, and radius. To optimize the information for categorical and discontinuous time series (like nominal number sequences), the default value for both (M) and (τ) is set to 1 (Dale and Spivey, 2005; Webber and Zbilut, 2005; Dale et al., 2011; Coco and Dale, 2014). The minimal line length is set to 2 to ensure that every recurring combination of two or more digits is considered a diagonal or vertical line structure. The radius is set to <1, such that only exact matches are considered recurrent (Orsucci et al., 1997). See Supplementary Material for availability of RandseqR.
R is a measure for inequality of response usage. An R score of 0 equals minimum redundancy (i.e., each response alternative is given in equal proportion) and an R score of 1 equals maximum redundancy (i.e., the same response is given throughout). R is computed as:
where n is the length of the number sequences, a is the total number of response alternatives, and ai is the number of occurrences of the ith response alternative. The numerator equals the amount of observed redundancy in the sequence and the denominator equals the amount of maximum redundancy.
Like redundancy, RNG is a measure of inequality of response usage at the level of diagrams at time lag 1 (i.e., adjacent responses). RNG is computed as:
where nij is the frequency count of all observed diagrams and ai is the number of occurrences of the ith response alternative.
NSQ is a measure for diagrams at time lag 1 that do not appear in the number sequence. NSQ is the opposite of RNG and NSQ is computed as:
where NS is the diagram alternatives that do not appear in the number sequence and a is as above.
RNG2 is a measure of inequality of diagram usage at time lag 2 (i.e., interleaved responses). The computation is similar to that of the RNG measure, where nij is the frequency count of all observed diagrams at time lag 2.
Coupon is a measure of the cycling pace of response alternatives, expressed as the mean number of responses before all response alternatives are used. When one or more response alternatives are not used at all, a coupon score cannot be calculated.
First-order differences are presented as a frequency table of the arithmetic differences between numbers at time lag 1 (i.e., the difference between the Ni response and the Ni−1 response).
Adjacency is the number of diagrams at time lag 1 with an ordinal sequence of response alternatives. Ascending diagrams have a first-order difference of −1 and descending diagrams have a first-order difference of +1. Adjacency is computed as:
and adjacency is calculated for both ascending and descending diagrams as well as a total adjacency score.
TPI is a measure of ascending and descending flow in the number sequence. TPI is calculated by counting the number of points in the sequence that mark a change in numerical direction (from ascending to descending or vice versa) and comparing this to the expected value of numerical changes in a random sequence. TPI is computed as:
The denominator is the expected amount of turning points in a sequence of length n. A TPI of >0 equals more numerical changes than expected, relative to a random sequence.
The intervals between turning points are called Phase lengths. Both ascending and descending phase lengths are presented as a frequency table, while Runs is the variance in phase lengths. In RGcalc, runs is the variance of ascending phase lengths only.
Repetition distance is the distance or gap between number repeats in the sequence, presented as a frequency table. From this frequency table three repetition gap scores are derived: the mean gap, the median gap, and the modal gap. The Phi Indices are somewhat related to repetition distance because these are the ratio between the observed repetition distance at time lag x and the expected distance at time lag x. However, the calculation of phi is complex and contra-intuitive (Wagenaar, 1970; Wiegersma, 1984; Towse and Neil, 1998; see Supplementary Materials for an extensive account on the calculation of the Phi indices).
To explain the concept of recurrence, consider an auto-recurrence plot (auto-RP). An auto-RP is created by plotting a number sequence x of length N on both axes in an N x N matrix and marking every point at (i, j), whenever x(j) has the same number as x(i). Due to the auto-recurrent nature, these RPs are symmetrical regarding the diagonal i = j and both planes of the RP contain the same information (see Figure 1). RR is the proportion of recurring numbers (black dots) to non-recurring numbers (white dots), ignoring the main diagonal. A number in the time series is considered recurring if it falls within a given radius (for nominal number sequences this means that only matching numbers are considered recurring). If two or more recurring numbers are adjacent, they form a line structure. DET is the proportion of recurring numbers that form diagonal line structures, while LAM is the proportion of recurring numbers that make up the vertical (or horizontal) line structures. The complexity of these line structures is summarized by the average line length, the longest line length, and the variance in line length distribution; a high variance equals a higher uncertainty of a line of given length occurring (entropy).
RR is the proportion of recurrence in the number sequence (i.e., the proportion of marked points to non-marked points in the auto-RP). RR is computed as:
where N is the length of the number sequence.
DET is the proportion of recurring points forming diagonal line structures and quantifies the number of repetitive patterns. Based on the default parameter settings, every repetition of two or more consecutive numbers is considered a line structure. DET is computed as:
where P(l) is the histogram of the lengths l of the diagonal lines.Lmax and Lmean are measures of stability of these diagonal patterns. Lmax is computed as:
where Nl is the amount of diagonal line structures in the recurrence plot, and Lmean is calculated as:
Lentr is the Shannon information entropy of the probability distribution of the diagonal line lengths p(l) and is indicative of the complexity of the deterministic structures of the number sequence. Lentr is calculated as:
LAM is the proportion of recurring points forming vertical line structures and quantifies the amount of repeating numbers. Based on the default parameter settings, every repetition of two or more of the same number is considered a vertical line structure. LAM is calculated as:
where P(v) is the histogram of the lengths v of the diagonal lines.Vmax and TT are measures of stability of these vertical line structures. Vmax is computed as:
where Nv is the number of vertical line structures in the recurrence plot, and TT is calculated as:
Ventr is the Shannon information entropy of the probability distribution of the vertical line lengths p(v) and is indicative of the complexity of trapped states of the number sequence. Ventr is calculated as:
In the following section, we illustrate the randseqR package based on several computer-generated random sequences: random number sequences from 1 to 9 with a length of respectively 50, 100, 275, and 550 numbers, a sequence of 275 random letters and a sequence of 100 coinflips (the sequences were all generated using the base R sample function with the seed set to 42). The main functions in the RandseqR package are allRNG, which calculates all randomization measures, and crqa_cl, which is imported from casnet and calculates the RQA measures. For the use of the latter we refer to the extensive casnet documentation (Hasselman, 2017). The use of allRNG is quite straightforward and is of the following form:
where y is the sequence for which to calculate the randomization measures. minScale and maxScale are the minimum and maximum value, respectively in the observed sequences. Based on this minimum and maximum value RandseqR calculates all possible response alternatives. Alternatively, it is possible to define all possible response alternatives with responseAlternatives. In this case minScale and maxScale are derived from this set of response alternatives. The term responseAlternatives is used for non-numeric sequences, like random letters or random months, or for number sequences that do not allow for some responses, like only even numbers. The term results controls the output, either classical (similar to RGcalc) or RandseqR, and is defaulted to RandseqR. Optionally, it is possible to disable the calculation of one or more randomization measures. This is controlled by the output terms: Redundancy, RNG, RNG2, RF, Coupon, NSQ, FOD, Adjacency, TPI, PhL, Runs, repDistance, repGap, and PhiIndex. By default allRNG calculates all randomization measures. In addition to the allRNG function, randseqR supports functions for the calculation of separate measures. These work the same as allRNG and can be thought of as allRNG with all the other output measures disabled. For example:
The randomization functions in randseqR have two mandatory terms: y and one of minScale and maxScale or responseAlternatives. Results and the output terms have default settings and are, therefore, optional. The following code was used to calculate part of the output in Table 1:
where x is a sequence of random numbers of length n,
where y is a sequence of random letters of length 275 and, letters contain all 26 letters of the alphabet, and
were z is a sequence of random coinflips of length 100. These three lines of code calculates the RandseqR output for the number sequences, the classical output for the letter sequence, and the RandseqR output for the coinflip sequence, respectively as shown in Table 1.
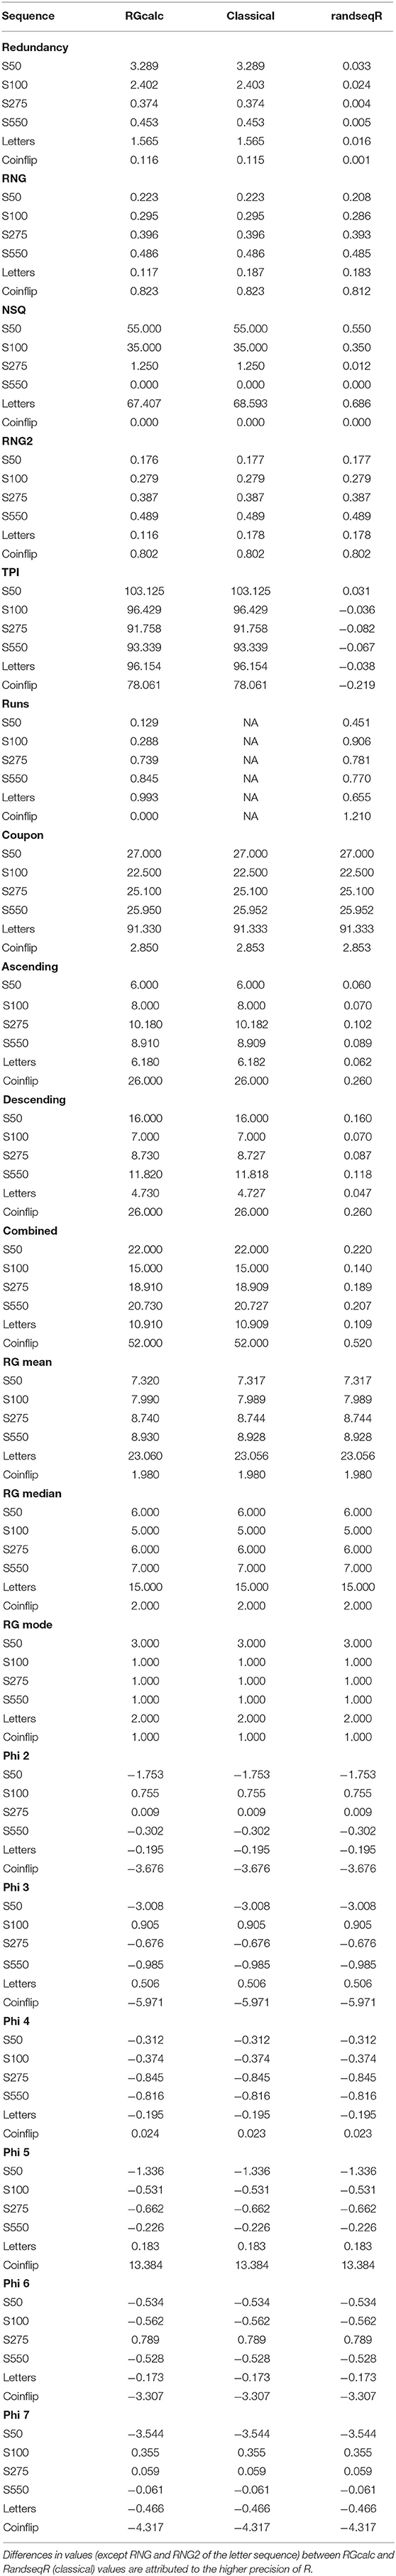
Table 1. RNG output for RGcalc, RandseqR (classical), and RandseqR (default).
Table 1 shows the output for all six sequences using RGcalc and RandseqR (with outcome values expressed in the classic and default mode). Minor differences occur between RGcalc output and RandseqR output, which can be attributed to the higher precision of R compared to 1998 Visual Basic. The rather large difference between RGcalc and RandseqR for RNG and RNG2 in the letter sequence, however, cannot be attributed to this difference. The origin of this difference is unclear, but it is possible the RGcalc code is not optimized for sequences with more than nine response alternatives (like letter sequences). One of the major upsides of RandseqR over RGcalc is that RandseqR enables processing of a multitude of sequences without manually handling the in- and output. Furthermore, RandseqR accepts all types of input (e.g., coinflips), as long as the response alternatives are defined. In contrast, RGcalc does not accept string variables unless heads and tails are manually converted to digits. The one exception is that RGcalc does accept letters as input.
Table 2 shows the RQA output for each sequence. The following line of code was used to calculate RQA measures:
were x is one of the six sequences. For a full explanation on crqa_cl see the documentation in casnet. The only term in crqa_cl that deviates from the default setting is radius (emRad), which is set to a value lower than 1. The term doPlot creates the RPs for the sequences, which are showed in Figure 1.
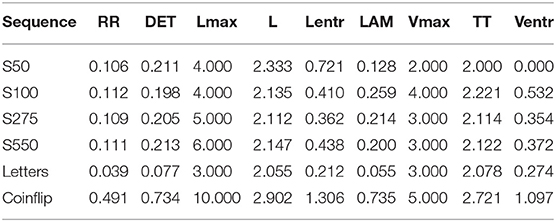
Table 2. RQA output.
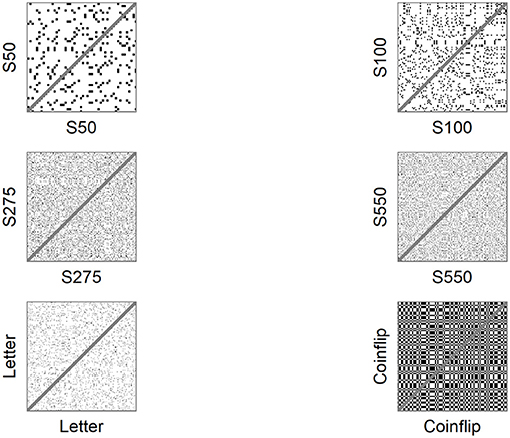
Figure 1. Auto-recurrence plots of sample sequences.
Taking a closer look at the RQA output, all four number sequences are more or less stable, as is to be expected for randomly generated number sequences. Instead, many of the randomization measures (Table 1) show a clear increasing or decreasing trend with increasing N. The most obvious in this regard is NSQ, which shows a downward trend and eventually becomes 0 when all possible digram pairs are used. Other measures that show a downward or upward trend are R, RNG, RNG2, TPI, and Phi. These measures project ratios between the observed number or digram distributions and the expected number or digram distribution. By increasing N (i.e., the amount of numbers in the sequence) in random sequences, the observed distribution better approximates the expected distribution.
Conceptually RR is somewhat similar to R as the amount of recurring numbers increases with increasing redundancy. The calculation differs, however, because redundancy is proportioned to the maximum number of black dots possible, instead of the number of white dots. Furthermore, the phi-indices deal with recurring numbers at a certain time lag and are, therefore, somewhat related to RR. RR, however, is a measure of recurring numbers at all time lags. phi 2 is related to LAM, since a recurring number at time lag 1 (i.e., phi 2) is considered a vertical line structure and therefore counts toward LAM. For most other randomization measures, the calculation uses diagrams (i.e., a combination of two digits), instead of recurring numbers and, therefore, have no obvious equivalence with RQA. Nonetheless, certain diagrams might reoccur, like sequences as measured by RNG and adjacency, and therefore counts toward DET, but only for sequences at time lag 1. If the average line length is close to 2 (time lag 1), measure like RNG are closer related to DET than when the average line length increases. Earlier research using principal component analysis supports these conceptual similarities between randomization and RQA measures (Oomens et al., 2015).
The original contributions presented in the study are included in the article/Supplementary Material, further inquiries can be directed to the corresponding author.
WO, FH, JM, and JE designed and planned the study. WO and FH wrote the R code for randseqR. WO drafted the manuscript. FH, JM, and JE revised and critically reviewed the manuscript for important content. All authors read and authorized the final version of the manuscript.
The authors declare that the research was conducted in the absence of any commercial or financial relationships that could be construed as a potential conflict of interest.
The Supplementary Material for this article can be found online at: https://www.frontiersin.org/articles/10.3389/fpsyg.2021.629012/full#supplementary-material
The RandseqR package is available at: https://github.com/FredHasselman/randseqR.
To download and install RandseqR into your R library use the following line of code:
The RGcalc software is available at: https://www.lancaster.ac.uk/staff/towse/rgcpage.html.
Coco, M. I., and Dale, R. (2014). Cross-recurrence quantification analysis of categorical and continuous time series: an R package. Front. Psychol. 5:510. doi: 10.3389/fpsyg.2014.00510
Dale, R., and Spivey, M. J. (2005). “Categorical recurrence analysis of child language,” in Proceedings of the Cognitive Science Society, Vol. 27. Retrieved from: http://escholarship.org/uc/item/0wz7s448.pdf
Dale, R., Warlaumont, A. S., and Richardson, D. C. (2011). Nominal cross recurrence as a generalized lag sequential analysis for behavioral streams. Int. J. Bifurc. Chaos 21, 1153–1161. doi: 10.1142/S0218127411028970
Evans, F. J. (1978). Monitoring attention deployment by random number generation: an index to measure subjective randomness. Bull. Psychonom. Soc. 12, 35–38. doi: 10.3758/BF03329617
Gilden, D. L. (2001). Cognitive emissions of 1/f noise. Psychol. Rev. 108, 33–56. doi: 10.1037/0033-295x.108.1.33
Giuliani, A., Colafranceschi, M., Webber, C. L., and Zbilut, J. P. (2001). A complexity score derived from principal components analysis of nonlinear order measures. Phys. A Stat. Mech. Appl. 301, 567–588. doi: 10.1016/S0378-4371(01)00427-7
Hasselman, F. (2017). Casnet: A Toolbox for Studying Complex Adaptive Systems and NETworks (Version 0.1.3). Retrieved from: https://github.com/FredHasselman/casnet
Maes, J. H. R., Eling, P. A. T. M., Reelick, M. F., and Kessels, R. P. C. (2011). Assessing executive functioning: On the validity, reliability, and sensitivity of a click/point random number generation task in healthy adults and patients with cognitive decline. J. Clin. Exp. Neuropsychol. 33, 366–378. doi: 10.1080/13803395.2010.524149
Marwan, N., Carmenromano, M., Thiel, M., and Kurths, J. (2007). Recurrence plots for the analysis of complex systems. Phys. Rep. 438, 237–329. doi: 10.1016/j.physrep.2006.11.001
Miyake, A., Friedman, N. P., Emerson, M. J., Witzki, A. H., Howerter, A., and Wager, T. D. (2000). The unity and diversity of executive functions and their contributions to complex “frontal lobe” tasks: a latent variable analysis. Cogn. Psychol. 41, 49–100. doi: 10.1006/cogp.1999.0734
Oomens, W., Maes, J. H. R., Hasselman, F., and Egger, J. I. M. (2015). A time series approach to random number generation: using recurrence quantification analysis to capture executive behavior. Front. Hum. Neurosci. 9:319. doi: 10.3389/fnhum.2015.00319
Orsucci, F., Walter, K., Giuliani, A., Webber, C. L. Jr., and Zbilut, J. P. (1997). Orthographic Structuring of Human Speech and Texts: Linguistic Application of Recurrence Quantification Analysis. Retrieved from: https://arxiv.org/abs/cmp-lg/9712010 (accessed October 3, 2017).
Peters, M., Giesbrecht, T., Jelicic, M., and Merckelbach, H. (2007). The random number generation task: psychometric properties and normative data of an executive function task in a mixed sample. J. Int. Neuropsychol. Soc. 13, 626–634. doi: 10.1017/S1355617707070786
Shockley, K. (2005). “Cross recurrence quantification of interpersonal postural activity,” in Tutorials in Contemporary Nonlinear Methods, eds M. A. Riley and G. C. Van Orden, 142–177. Retrieved from: http://www.nsf.gov/sbe/bcs/pac/nmbs/nmbs.jsp
Towse, J. N., and Neil, D. (1998). Analyzing human random generation behavior: a review of methods used and a computer program for describing performance. Behav. Res. Methods Instr. Comput. 30, 583–591.
Van Orden, G. C., Holden, J. G., and Turvey, M. T. (2003). Self-organization of cognitive performance. J. Exp. Psychol. Gen. 132, 331–350. doi: 10.1037/0096-3445.132.3.331
Wagenaar, W. (1970). Subjective randomness and the capacity to generate information. Acta Psychol. 33, 233–242. doi: 10.1016/0001-6918(70)90135-6
Wallot, S. (2017). Recurrence quantification analysis of processes and products of discourse: a tutorial in R. Discour. Process. 54, 382–405. doi: 10.1080/0163853X.2017.1297921
Webber, C. L., and Zbilut, J. (2005). “Recurrence quantification analysis of nonlinear dynamical systems,” in Tutorials in Contemporary Nonlinear Methods, eds M. A. Riley and G. C. Van Orden, 26–94. Retrieved from: http://www.nsf.gov/sbe/bcs/pac/nmbs/nmbs.jsp
Keywords: recurrence qualification analysis, R-package, executive function, contextual neuropsychology, random number generation, assessment
Citation: Oomens W, Maes JHR, Hasselman F and Egger JIM (2021) RandseqR: An R Package for Describing Performance on the Random Number Generation Task. Front. Psychol. 12:629012. doi: 10.3389/fpsyg.2021.629012
Received: 13 November 2020; Accepted: 31 March 2021;
Published: 04 May 2021.
Edited by:
Cristina Zogmaister, University of Milano-Bicocca, ItalyReviewed by:
Alessandro Giuliani, National Institute of Health (ISS), ItalyCopyright © 2021 Oomens, Maes, Hasselman and Egger. This is an open-access article distributed under the terms of the Creative Commons Attribution License (CC BY). The use, distribution or reproduction in other forums is permitted, provided the original author(s) and the copyright owner(s) are credited and that the original publication in this journal is cited, in accordance with accepted academic practice. No use, distribution or reproduction is permitted which does not comply with these terms.
*Correspondence: Wouter Oomens, w.oomens@donders.ru.nl
Disclaimer: All claims expressed in this article are solely those of the authors and do not necessarily represent those of their affiliated organizations, or those of the publisher, the editors and the reviewers. Any product that may be evaluated in this article or claim that may be made by its manufacturer is not guaranteed or endorsed by the publisher.
Research integrity at Frontiers
Learn more about the work of our research integrity team to safeguard the quality of each article we publish.