- 1Division of Social Sciences, Humanities and Design, College of Professional and Continuing Education, The Hong Kong Polytechnic University, Hung Hom, Hong Kong
- 2Department of Psychology, The Chinese University of Hong Kong, Shatin, Hong Kong
We developed a psychometric scale for measuring the subjective environmental perception of public spaces. In the scale development process, we started with an initial pool of 85 items identified from the literature that were related to environmental perception. A total of 1,650 participants rated these items on animated images of 12 public spaces through an online survey. Using principal component analyses and confirmatory factor analyses, we identified two affective factors (comfort and activity) with 8 items and six cognitive factors (legibility, enclosure, complexity, crime potential, wildlife, and lighting) with 22 items. These eight factors represent the core attributes underlying environmental perception of public spaces. Practicality of the scale and limitations of the study are also discussed.
Introduction
Need for a Tool That Measures Environmental Perception of Public Spaces
This paper reports the development of a psychometric scale for measuring the subjective environmental perception of public spaces. Public spaces refer to “open, publicly accessible places where people go for group or individual activities… Some are under public ownership and management, whereas others are privately owned but open to the public” (Carr et al., 1992, p. 50). Understanding human experience of public spaces is a critical domain in urban studies. Quality of the environment in which people live, according to Pacione (2003), constitutes an important aspect to their quality of life. There are objective and subjective indicators to determine the quality of public spaces. Borrowing Pacione’s words, objective measurements capture “the city on the ground” whereas subjective perception captures “the city in the mind” (p. 20). Subjective perception is a personal interpretation of an objective situation (Pacione, 2003, p. 21). Such differentiation between the objective and the subjective is echoed by van Kamp et al. (2003); thinking about the quality of an environment should not be dictated by the objective condition of that environment. It is also suggested that subjective perception of environmental quality allows us to gain insight into people’s satisfaction and preferences about places (Pacione, 2003; van Kamp et al., 2003). There has been empirical support for the association between people’s perceived quality of public spaces and their residential satisfaction (Aiello et al., 2010) as well as sense of community (Francis et al., 2012). The need for a standard tool that measures subjective perception of public spaces is called for in recent studies. Legendre and Gómez-Herrera (2011) observed developmental changes in children’s use of and independent access to public spaces. As children grew up, they increased their use of and independent access to public spaces. These findings raise the question on what aspects of public spaces could have accounted for the developmental changes in how children use and access public spaces. In another study, Valera-Pertegas and Guàrdia-Olmos (2017) found that women tended to report higher level of perceived insecurity about public spaces than men. Again, these findings open questions regarding how the same objective public spaces could be subjectively perceived by women and men differently. In order to answer these questions, a comprehensive tool for measuring subjective perception of public spaces is needed.
Psychometric scale is a common practice for capturing people’s subjective perception or experiences about a variety of environmental topics, e.g., connectedness to nature, environmental attitude, ecological behavior, and place attachment. Connectedness to nature encompasses people’s perception about their identification, love, and care for nature (Mayer and Frantz, 2004; Perkins, 2010; Martin and Czellar, 2016). Environmental attitude is a broad category of people’s attitudes and beliefs related to their willingness and intention to take environmental actions, support for conservation interventions or policies, belief in environmental threats, etc. (Homburg et al., 2007; Milfont and Duckitt, 2010; Li and Monroe, 2018; Walton and Jones, 2018; Cakmak, 2020). Ecological behavior refers to actual behaviors such as energy conservation, waste avoidance, education in environmental issues, etc. (Kaiser et al., 2007; Alisat and Riemer, 2015; O’Brien et al., 2018). Place attachment takes care of people’s self-identification with and behavioral dependence on a place (Raymond et al., 2010). Furthermore, there are scales that are evaluative in nature. For example, perceived restorativeness captures the extent to which an environmental setting provides its users with the opportunity to relax and temporarily take a break from their daily stressors (Laumann et al., 2001; Pals et al., 2009). Visitability refers to the extent to which people evaluate a place as friendly for visit (Abdulkarim and Nasar, 2014a, b). There are numerous studies that examined environmental perception of public spaces in particular (Nasar and Cubukcu, 2011; Lindal and Hartig, 2013, 2015; Abdulkarim and Nasar, 2014a, b; Motoyama and Hanyu, 2014; Rašković and Decker, 2015; Nasar and Bokharaei, 2017a, b); however, those studies often only focused on particular aspects of public spaces and their operationalizations of environmental perception were inconsistent. For example, Motoyama and Hanyu (2014) examined only the visual properties of public spaces (i.e., brightness, coherence, complexity, legibility, naturalness, nuisance elements, spaciousness, typicality, and upkeep), whereas Nasar and Cubukcu (2011) were only interested in the mystery (the promise of further information) and surprise (the mismatch from one’s expectations) of public spaces. Existing literature does not provide a standard tool for measuring the environmental perception of public spaces. The current paper fills in the research gap and unifies the core attributes underlying environment perception of public spaces.
Affective and Cognitive Domains of Environmental Perception
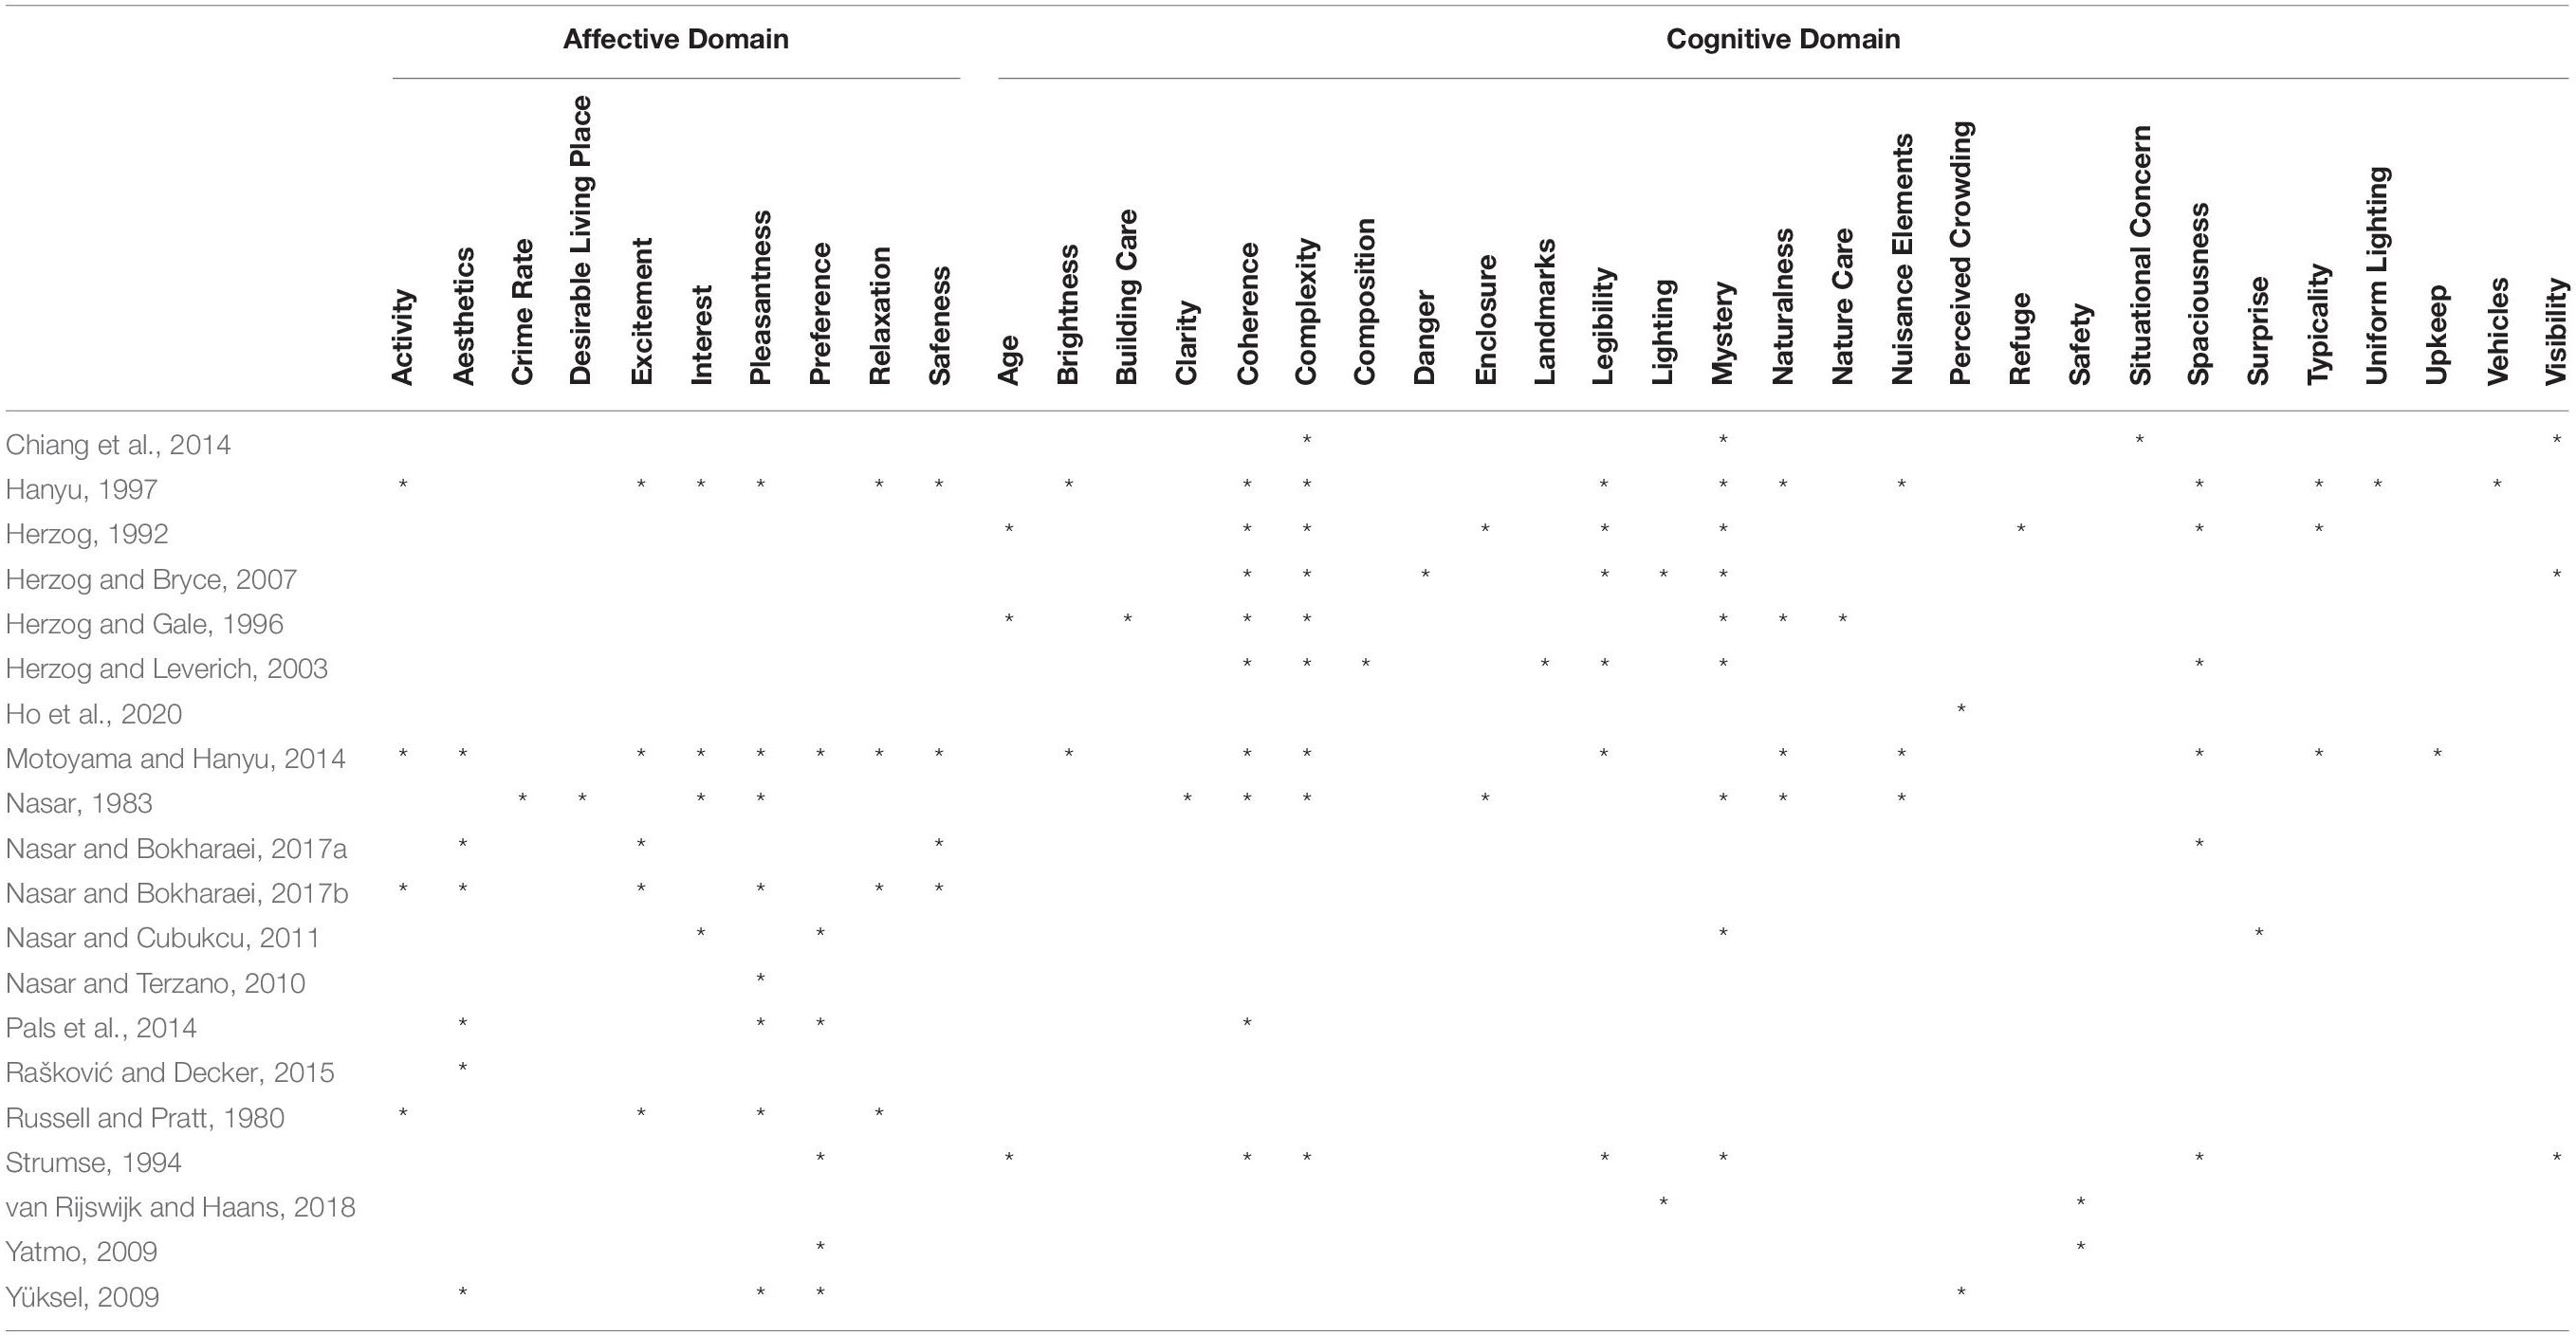
Environmental perception can be divided into affective and cognitive domains (Nasar, 1994; Aiello et al., 2010). In Nasar’s (1994) model of responses to urban aesthetics, affective and cognitive domains encompass, respectively, the interpreted (e.g., character and atmosphere) and the physical (e.g., size and proportion) attributes of a given urban design. We employ the affective-cognitive distinction to organize psychological constructs related to environmental perception of public spaces. Using keywords “urban,” “public space/place,” and “environmental perception/experience/ appraisal/preference/attributes,” we identified from the literature 20 publications dated from 1980 onward that operationalized environmental perception with self-report items (Russell and Pratt, 1980; Nasar, 1983; Herzog, 1992; Strumse, 1994; Herzog and Gale, 1996; Hanyu, 1997; Herzog and Leverich, 2003; Herzog and Bryce, 2007; Yatmo, 2009; Yüksel, 2009; Nasar and Terzano, 2010; Nasar and Cubukcu, 2011; Ho et al., 2020; Chiang et al., 2014; Motoyama and Hanyu, 2014; Pals et al., 2014; Rašković and Decker, 2015; Nasar and Bokharaei, 2017a, b; van Rijswijk and Haans, 2018). A quarter of those publications explicitly state whether they examined the affective or the cognitive domain of environmental perception. Russell and Pratt (1980) focused entirely on affective appraisals including activity (or arousal), excitement, pleasantness, and relaxation. Herzog (1992) and Strumse (1994) conducted cognitive analysis of visual properties such as coherence, complexity, legibility, and spaciousness. Hanyu (1997) and Motoyama and Hanyu (2014) incorporated constructs from both domains. Although the other 15 publications do not specify which domain(s) of environmental perception they were examining, their constructs could clearly be classified as either affective or cognitive. The 20 publications are organized in Table 1; four of them examined affective constructs, seven cognitive, and nine a combination of both. Note that the constructs overlapped; 10 were unique in the affective domain and 27 were unique in the cognitive domain. Affective constructs included activity, aesthetics, crime rate, desirable living place, excitement, interest, pleasantness, preference, relaxation, and safeness. Cognitive constructs included age, brightness, building care, clarity, coherence, complexity, composition, danger, enclosure, landmarks, legibility, lighting, mystery, naturalness, nature care, nuisance elements, perceived crowding, refuge, safety, situational concern, spaciousness, surprise, typicality, uniform lighting, upkeep, vehicles, and visibility. In the affective domain, pleasantness appeared most frequently, followed by aesthetics, excitement, preference, and relaxation. In the cognitive domain, complexity appeared most frequently, followed by coherence, legibility, mystery, perceived crowding, and safety. This body of works provides us with the materials for scale development.
Association Between Environmental Perception and Preference About Public Spaces
Environmental perception can affect people’s satisfaction and preferences about places. Aiello et al. (2010) found that perceived quality of public spaces were positively associated with residential satisfaction. Nasar (1983) found that people preferred residential scenes that appeared well-maintained and clear to use. In Herzog’s (1992) study of urban spaces, coherence and complexity consistently predicted environmental preference. Nasar and Bokharaei (2017a, b) also found that bright lighting enhanced preferences of public spaces. In a virtual study, Nasar and Cubukcu (2011) found that preference of city environments increased as perceived mystery and surprise of those environments increased. It is worth mentioning that the association between environmental perception and preference extends to natural settings. Herzog and Leverich (2003) found that people liked forests that they perceived as legible and coherent. Chiang et al. (2014) found that people disliked forest trails for which they had situational concern about environmental threats. Another related line of research is that certain elements in public space can affect people’s experiences of public space. Abdulkarim and Nasar (2014a, b) demonstrated that public seating, sculpture, and food vendors made public plazas appear more visitable. Lindal and Hartig (2013) found that architectural variation, a concept similar to complexity, enhanced restorativeness. Other studies found that trees and vegetations enhanced the perceived restorativeness of public spaces (Lindal and Hartig, 2015; Rašković and Decker, 2015). Overall, there is a strong research foundation for linking environmental perception to environmental preference. In the current paper, we will examine the criterion validity of our scale by demonstrating how particular aspects of environmental perception can determine preferences about public spaces.
Materials and Methods
We conducted a quantitative study to identify the core attributes underlying the environmental perception of public spaces. We first developed a typology of public spaces. We then constructed pictorial stimuli to represent this typology. Next, we administered an online survey through which research participants evaluated the pictorial stimuli of public spaces on the initial items we identified from the literature. Finally, we performed factor analyses to develop factor models of environmental perception of public spaces. Research-ethics approval was obtained prior to conducting the study.
Stimuli
Typology of Public Spaces
We developed a typology of public spaces to operationalize public spaces. As Project for Public Spaces (2018) describes, public spaces are often “used by many different people for many different purposes at many different times of the day and the year” (p. 1). Public spaces is a broad concept; they are places that are open to all, allowing a vast variety of activities to take place. Public spaces serve a variety of functions and purposes, and can be categorized into different types (Carmona, 2010). Carr et al. (1992) categorized 11 major types of public space: streets, squares and plazas, found/neighborhood spaces, public parks, greenways and parkways, memorials, markets, playgrounds, community open spaces, atriums/indoor marketplaces, and waterfronts. Streets are pedestrian and vehicular corridors where people move on foot. Squares and plazas are multifunctional spaces available to all people. Found/neighborhood spaces are vacant or undeveloped spaces that are either ignored or not intended for a specific use. Public parks and greenways and parkways are green areas intended for social activities. Memorials memorialize people or important events. Markets are outdoor or exterior spaces used for shopping. Playgrounds are play areas that include play equipment (e.g., slides and swings). Community open spaces are spaces designed, developed, or managed by local residents on vacant land. Atriums/indoor marketplaces refer to indoor shopping areas. Waterfronts refer to open spaces along waterways in cities. Similarly, Gehl and Gemzøe (2001) identified five types of public space, among which four resemble Carr et al.’s (1992) categorization: promenades resembling streets, main city squares and recreational squares resembling squares and plazas, and monumental squares resembling memorials. Gehl and Gemzøe added traffic squares – public spaces for transport facilities such as transit stations or stops for subways or busses. Stanley et al. (2012) also identified six types of open space, among which five resemble the previous categorizations: transport facilities, streets, plazas, parks and gardens, and incidental spaces resembling Carr et al.’s (1992) found/neighborhood spaces. Stanley et al. (2012) added recreational spaces – specialized spaces designed or used for sports or exercises. Table 2 summarizes the different typologies of public spaces. Combining the overlapping types and retaining all that are unique, public spaces can be categorized into 12 unique types – transport facility, street, square, recreational space, found neighborhood space, park, memorial, market, playground, community open space, indoor marketplace, and waterfront – each serving a different function. We used this typology to operationalize public spaces in the current study.
Pictorial Stimuli of Public Spaces
We constructed a set of pictorial stimuli to represent the 12 types of public spaces. The use of static media to simulate environmental settings in research is supported by a meta-analysis by Stamps (2010), who showed that subjective evaluations of environmental settings on-site and their static simulations were very strongly correlated at r = 0.86. Based on our typology of public spaces, we started with 48 locations in Hong Kong (in which we are based) that fit the definitions of the 12 space types, four locations per type. We conducted three pilot studies online with a total of 310 local and non-local research participants to finalize the set of 12 public spaces to be used in the main study. Supplementary Appendix A reports the methods and results of the pilot studies. After confirming the 12 locations that would best represent the 12 types of public space, we visited those actual locations and took photographs of them, all using the same camera with the same focal length to ensure we had a consistent depth of field perspective looking into the locations. All photographs were taken during daytime on a weekend to control for the natural pedestrian flow. Using Adobe Photoshop, we then applied slight posterization to all photographs to give emphasis on the environmental settings over the realistic conditions of the actual locations. Figure 1 presents the final construction of the stimuli.
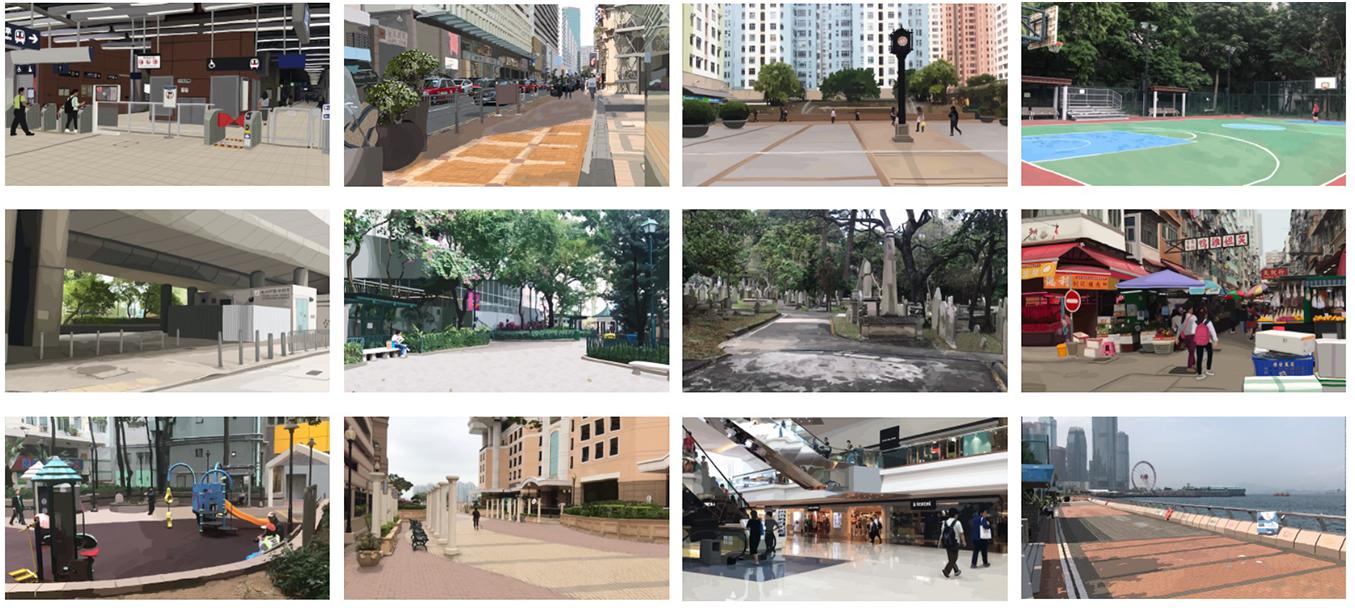
Figure 1. (Top row) From left to right, transport facility, street, square, and recreational space; (middle row) from left to right, found neighborhood space, park, memorial, and market; (bottom row) from left to right, playground, community open space, indoor marketplace, and waterfront.
Instruments
Initial Items
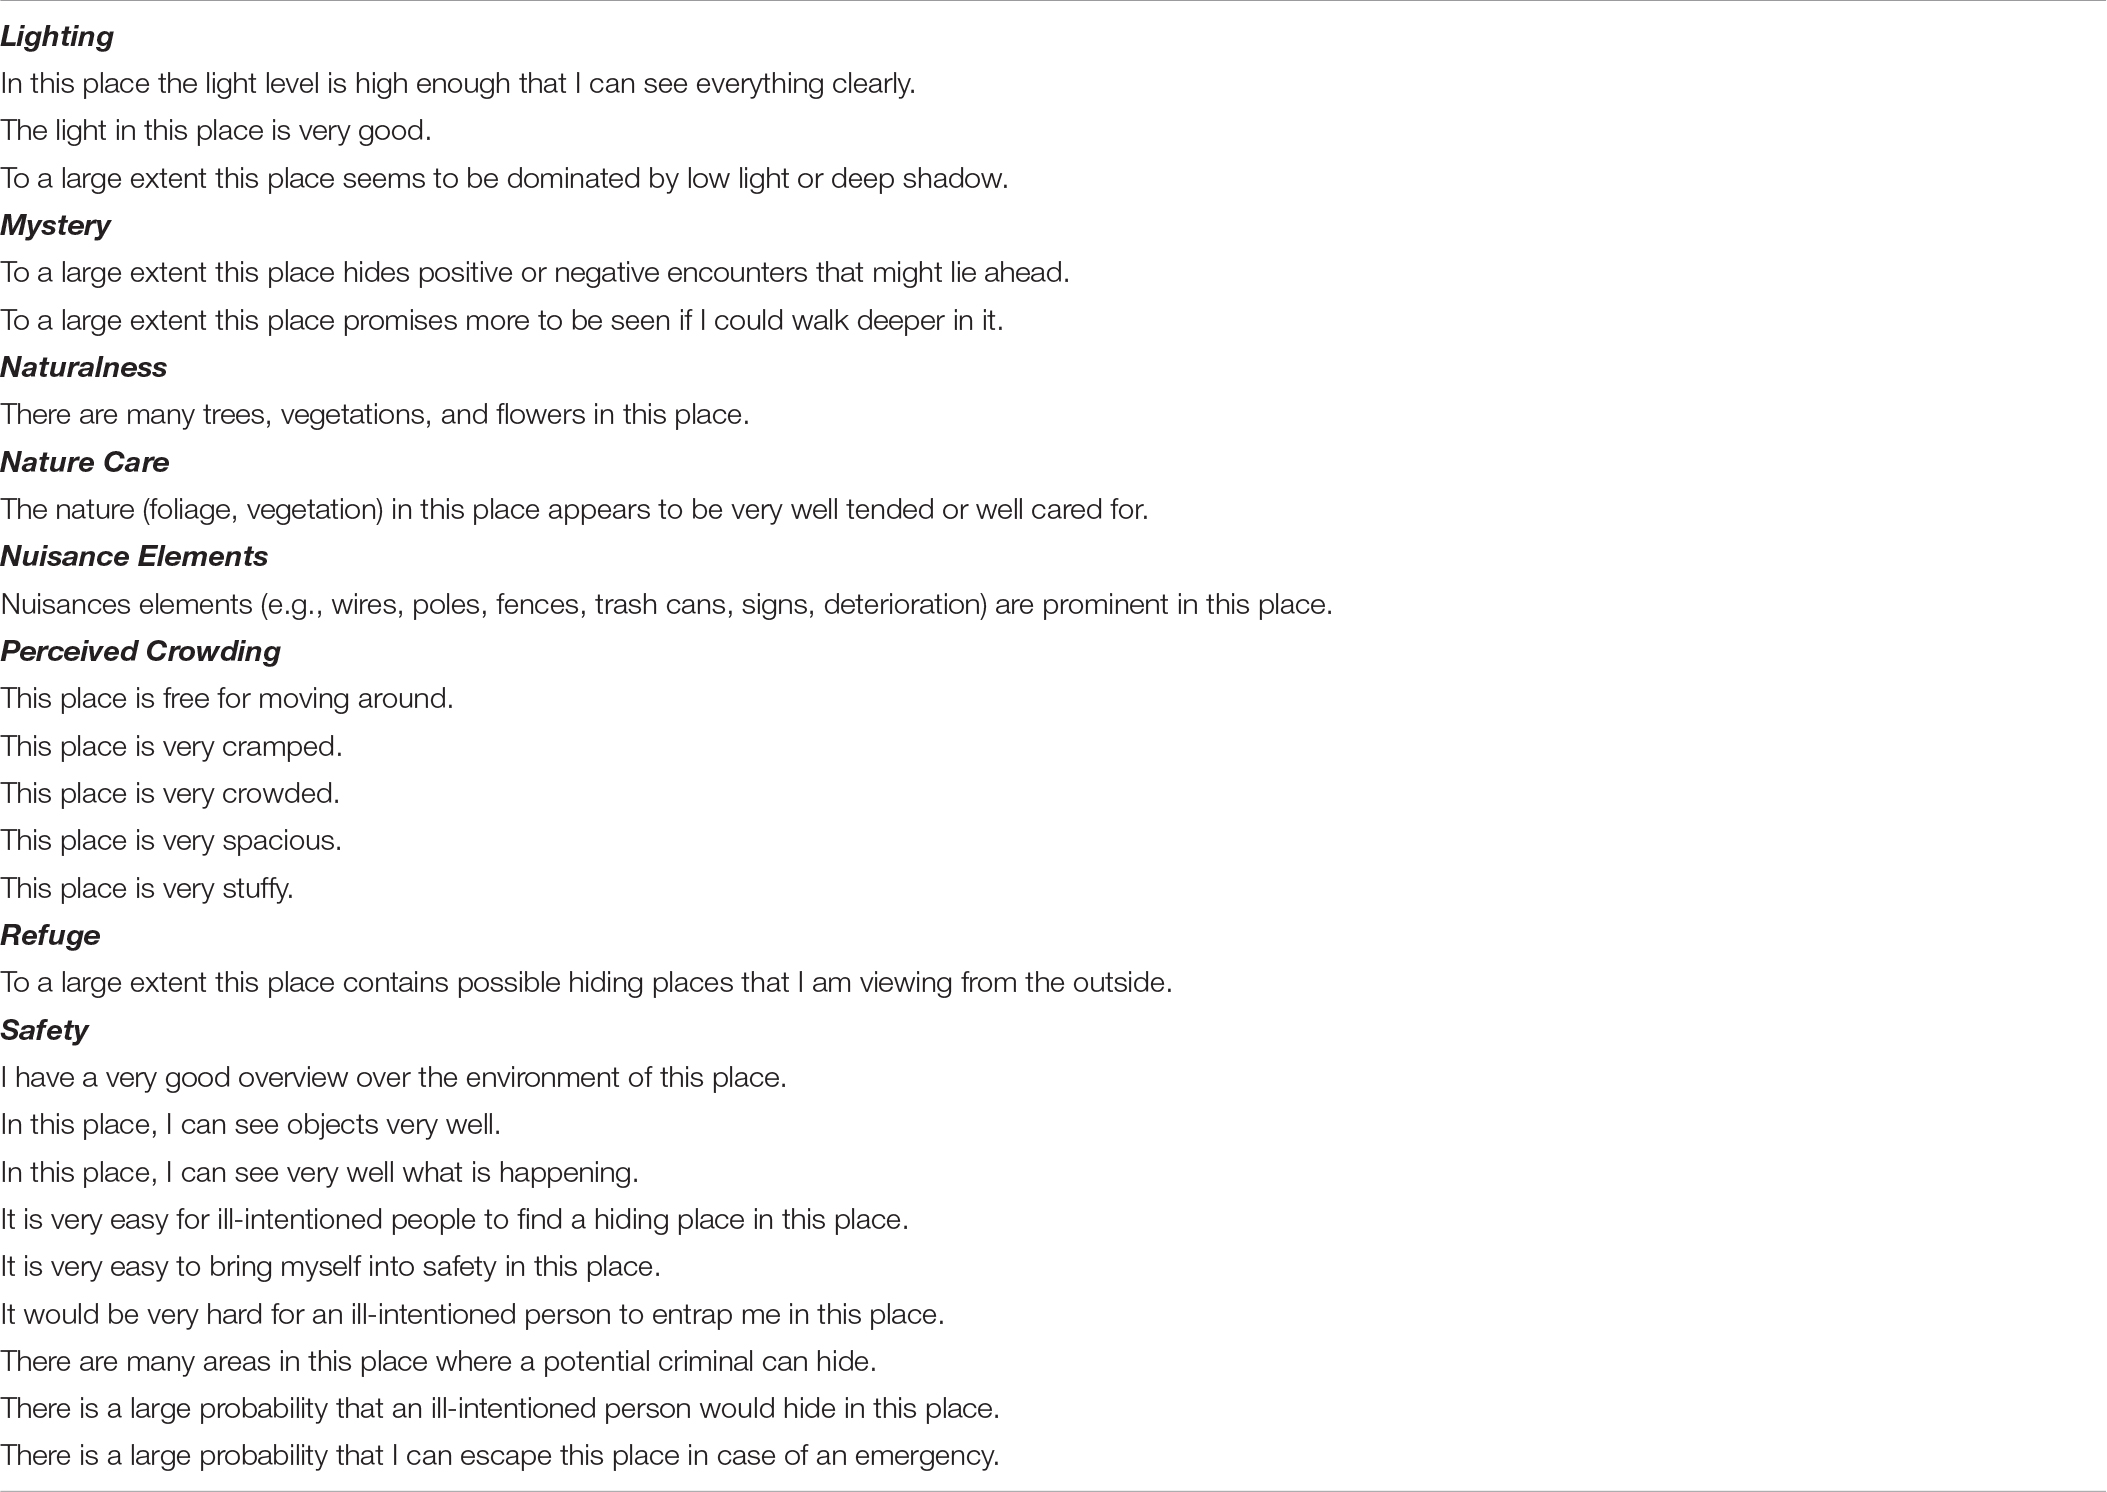
Our literature review identified 20 publications that operationalized environmental perception with self-report items. Those publications provided 210 measurement items in total, among which 47 items covered the 10 affective constructs and 163 items covered the 27 cognitive constructs. For parsimony, this item pool was reduced to just sufficiently cover all of the unique constructs in both domains. We carried out two procedures. First, we removed all duplicate items. For example, in the affective domain, we observed duplications of the item “Boring/Uninteresting–Interesting” among four studies (Nasar, 1983; Hanyu, 1997; Nasar and Cubukcu, 2011; Motoyama and Hanyu, 2014). Those four duplicate items were reduced to one item. Similarly in the cognitive domain, there was a duplication of a set of five “perceived crowding” items between two studies (Yüksel, 2009; Ho et al., 2020). Those two duplicate sets were reduced to one set. After removing duplicate items, we further reduced the number of items for constructs that were operationalized differently among studies. Between different operationalizations of the same construct, we opted for the one with fewest number of items. For example, two studies operationalized lighting in the cognitive domain. Herzog and Bryce (2007) used three items and van Rijswijk and Haans (2018) used six items. We kept Herzog and Bryce’s items but trimmed van Rijswijk and Haans’ items, as the former had fewer items. Following these procedures, 22 affective items and 63 cognitive items were retained in the item pool, as presented in Table 3.
Outcome Variables: Restorativeness, Safety, and Visitability
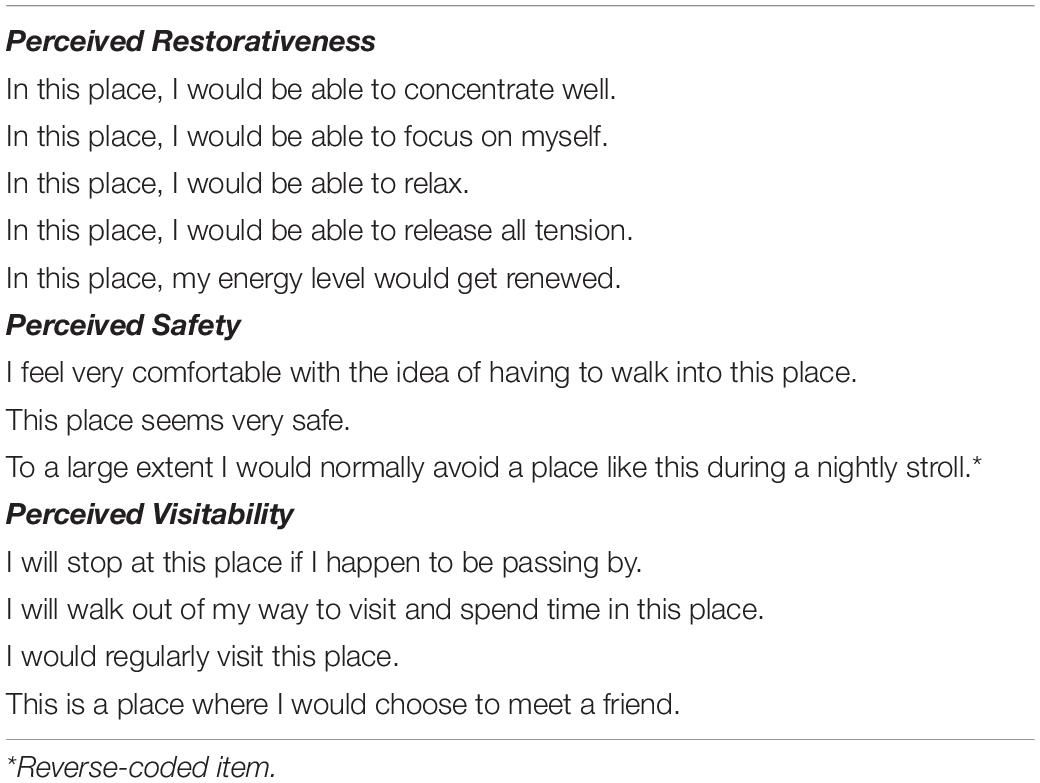
To examine the association between environmental perception of and preferences about public spaces, we included three outcome variables: perceived restorativeness, safety, and visitability. Measurement items for these variables were available from Abdulkarim and Nasar (2014b), Pals et al. (2014), and van Rijswijk and Haans (2018), respectively. Items are presented in Table 4. Perceived restorativeness refers to the extent to which a public space is perceived as relaxing and allowing its viewers to take a break from daily stressors. Perceived safety refers to the extent to which people feel safe and secure about a public space. Visitability examines the extent to which people perceive a public space as friendly for visit. These outcome variables will allow us to explore the impact of environmental perception of public spaces.
Procedure
Data were collected through an online survey. Research participants were recruited on Amazon Mechanical Turk (MTurk). Collecting data on MTurk has the benefit of obtaining samples that are often more socio-economically and ethnically diverse than other forms of convenient samples (e.g., university psychology students; Berinsky et al., 2012; Casler et al., 2013). Each participant received USD$1.50 for participation and was randomly assigned to evaluating one of the 12 types of public space. The survey began with an introduction explicitly stating that the study was to understand the human experience of public spaces. After giving their informed consent, research participants were presented with the complete set of 12 images of public space; the order of the images being presented was random for every participant. After viewing the set, one of the 12 images was chosen randomly to be presented again; this time the presentation of the chosen image came with the definition of the corresponding space type. Presenting the image and the definition together was to ensure that the participants were conscious about which space type the given image was representing. The participants were then asked to evaluate their environmental experience of the public space as portrayed by the image; they were reminded to focus on the public space rather than the quality of the image, and that there were no right or wrong answers. The participants provided demographic information at the end of the survey.
Affective items were rated in a 7-point bipolar format. Cognitive items and items for outcome variables, plus 26 other items for another research purpose, were rated on a 7-point Likert scale (from strongly disagree to strongly agree coded from 1 to 7 with a midpoint neither agree nor disagree as 4). Bipolar items were always presented first. The order among the affective items and the order among the cognitive items were both randomized for every participant. Five instructed response items (IRIs) were included as attention check. IRI is an item to which there is an obvious and unambiguous, correct answer; it is widely used and acceptable in survey research (Gummer et al., 2018; Kam and Chan, 2018; Kung et al., 2018). In the current study, the IRI was: “For this statement, please select [Strongly disagree/Disagree/Somewhat disagree/Neither agree nor disagree/Somewhat agree/Agree/Strongly agree].” All five IRIs needed to be correctly answered for a participant’s responses to be considered as valid and included in the data analysis.
Results
Sample
A total of 1,892 responses were received. After excluding the responses that did not pass the attention check, a total of 1,650 cases were retained for the data analysis. The sample comprised 849 women and 793 men (8 preferred not to answer) whose average age was 37 years old (SD = 12.05; 32 preferred not to answer). Table 5 presents the sample’s demographics. Majority of the sample lived in North America (81.60%) and about a tenth in Asia (12.20%). Proportions were about the same between those who had attained a bachelor’s degree as their highest education level (41.90%) and those who had not (39.20%); the rest had attained an education level above a bachelor’s degree (18.50%). Most of the sample identified themselves as middle class (59.30%) and working class (31.70%). Table 6 presents the samples sizes of the 12 groups.1
Principal Component Analysis and Confirmatory Factor Analysis
We performed an exploratory factor analysis using principal component analysis (PCA) on a subset of the data and then cross-validated the results with a confirmatory factor analysis (CFA) on the remaining subset of the data, in order to develop factor models corresponding to the affective and cognitive domains respectively. The full sample was randomly split into two subsets by a 4:1 ratio. PCA was performed on the larger subset of 1,320 cases to develop the factor models; CFA was then performed on the smaller subset of 330 cases to assess the fit of the models resulted from the PCA. Eventually, the 22 affective items were reduced to 8 items capturing two factors; the 63 cognitive items were reduced to 22 items capturing six factors.
At the initial stage of each PCA, the factorability of the items was examined. We checked that all items correlated at least 0.30 with at least one other item, the diagonals of the anti-image correlation matrix were all above 0.50, and all item communalities were above 0.30. Next, we checked that Kaiser–Meyer–Olkin measure of sampling adequacy (KMO; Kaiser, 1970) was above 0.80 and Bartlett’s (1937) test of sphericity was significant. Parallel analysis (1,000 replications; Hayton et al., 2004) was used to estimate the number of factors to be retained in each model; component extraction with direct oblimin rotation (Δ = 0; Matsunaga, 2010) was performed. After rotation, we took note only of the items whose factor loading was greater than 0.49 and retained only the top four items for parsimony. We then gave each factor an interpretive label.
CFA was then performed using lavaan (Rosseel, 2012) with maximum likelihood estimation to test the factor models resulted from the PCA. To assess model fit, we referred to the Comparative Fit Index (CFI), the Tucker-Lewis Index (TLI), the Standardized Root Mean-Square Residual (SRMR), and the Root Mean-Square Error of Approximation (RMSEA). Whittaker’s (2016) recommended cutoffs are 0.90 or greater for CFI and TLI, 0.10 or less for SRMR, and 0.08 or less for RMSEA. We modified the models where appropriate and re-estimated them after modification.
Affective Domain
Principal component analysis
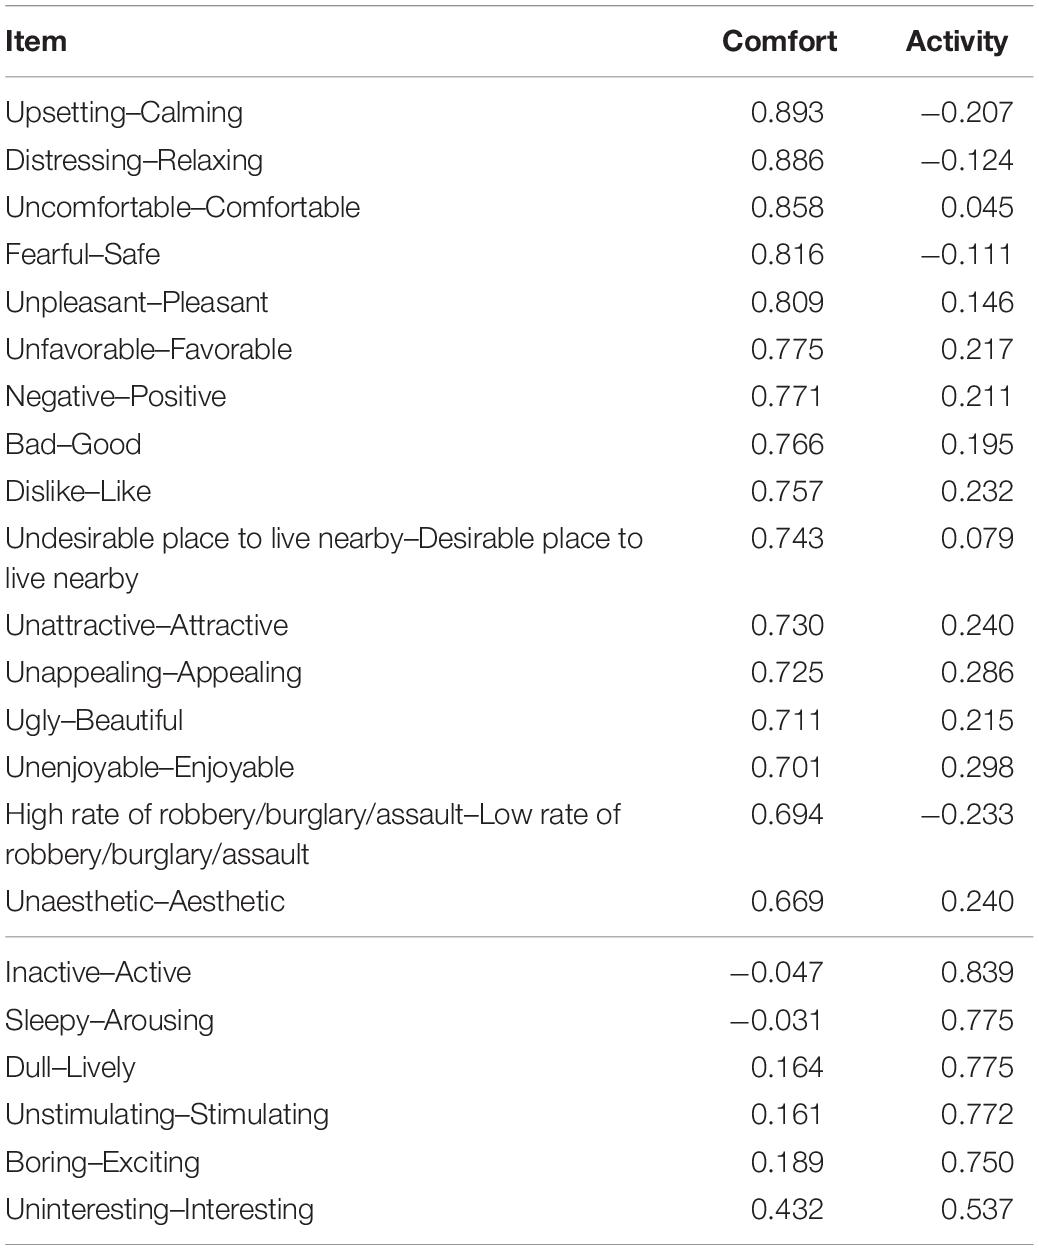
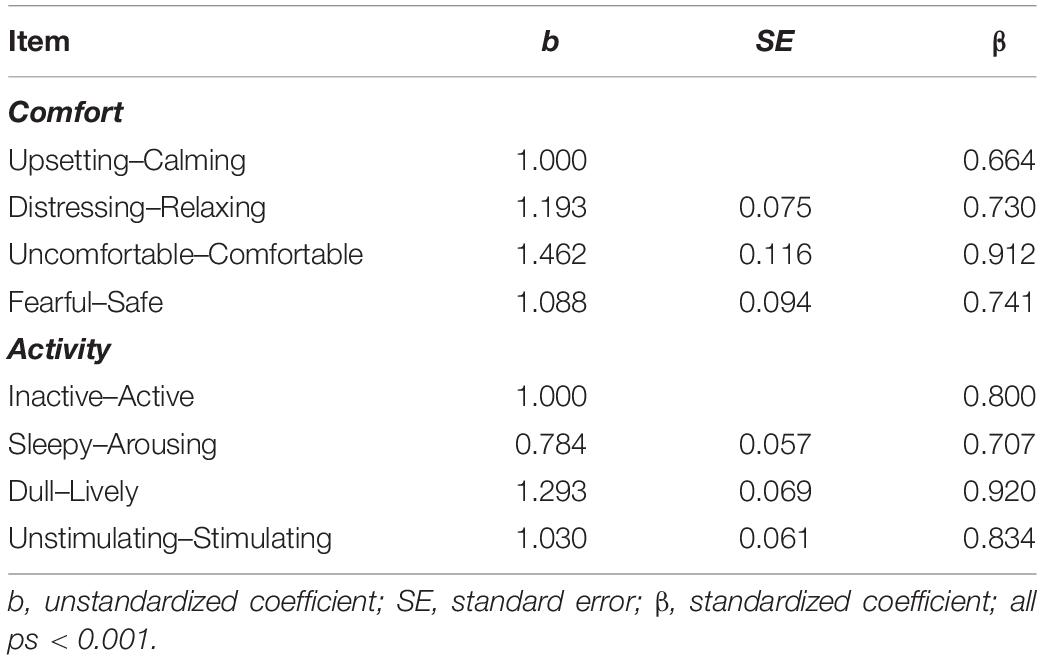
The dataset of 22 affective items was suitable for the analysis; KMO was 0.98 and Bartlett’s test of sphericity was statistically significant, χ2(231, N = 1,320) = 28,781.45, p < 0.001. Parallel analysis suggested that two factors should be retained, which explained 71.06% of the total variance. Factor loadings are presented in Table 7. Interpretive labels are suggested for the two factors: comfort and activity. Comfort describes if a public space conveys calming and relaxing feelings. Activity describes if the public space conveys arousing and lively feelings. The top four loading items were retained for each factor.
Confirmatory factor analysis
The two-factor model, as resulted from the PCA, was estimated, χ2(19, N = 330) = 144.20, p < 0.001; CFI = 0.92; TLI = 0.89; SRMR = 0.07; RMSEA = 0.14 (90% CI: 0.12, 0.16), p < 0.001. At this point, the model satisfied the cutoffs of CFI and SRMR but not TLI and RMSEA. The modification index suggested a path to be added to allow covariance between two items – “Upsetting–Calming” and “Distressing–Relaxing”; that indicated the initial model might be inadequate in accounting for the relation between those two items. Those two items were both related to describing the comfort of a public space. Although they were already loaded onto the same factor, adding the suggested path should not affect the interpretation of the overall model. After adding the suggested path, the model was re-estimated, χ2(18, N = 330) = 88.27, p < 0.001; CFI = 0.96; TLI = 0.93; SRMR = 0.06; RMSEA = 0.11 (90% CI: 0.09, 0.13), p < 0.001. The model now satisfied the cutoffs of all fit indices except RMSEA; also, χ2 difference test indicated a significant improvement in model fit after model modification, χ2(1, N = 330) = 55.93, p < 0.001. Because post hoc model modification was performed, a correlation was calculated between the initial model parameter estimates and the parameter estimates from the modified (re-estimated) model, r = 0.86, p = 0.006; this indicated that parameter estimates were hardly changed despite modification of the model. The coefficients in both unstandardized and standardized forms are presented in Table 8.
Cognitive Domain
Principal component analysis
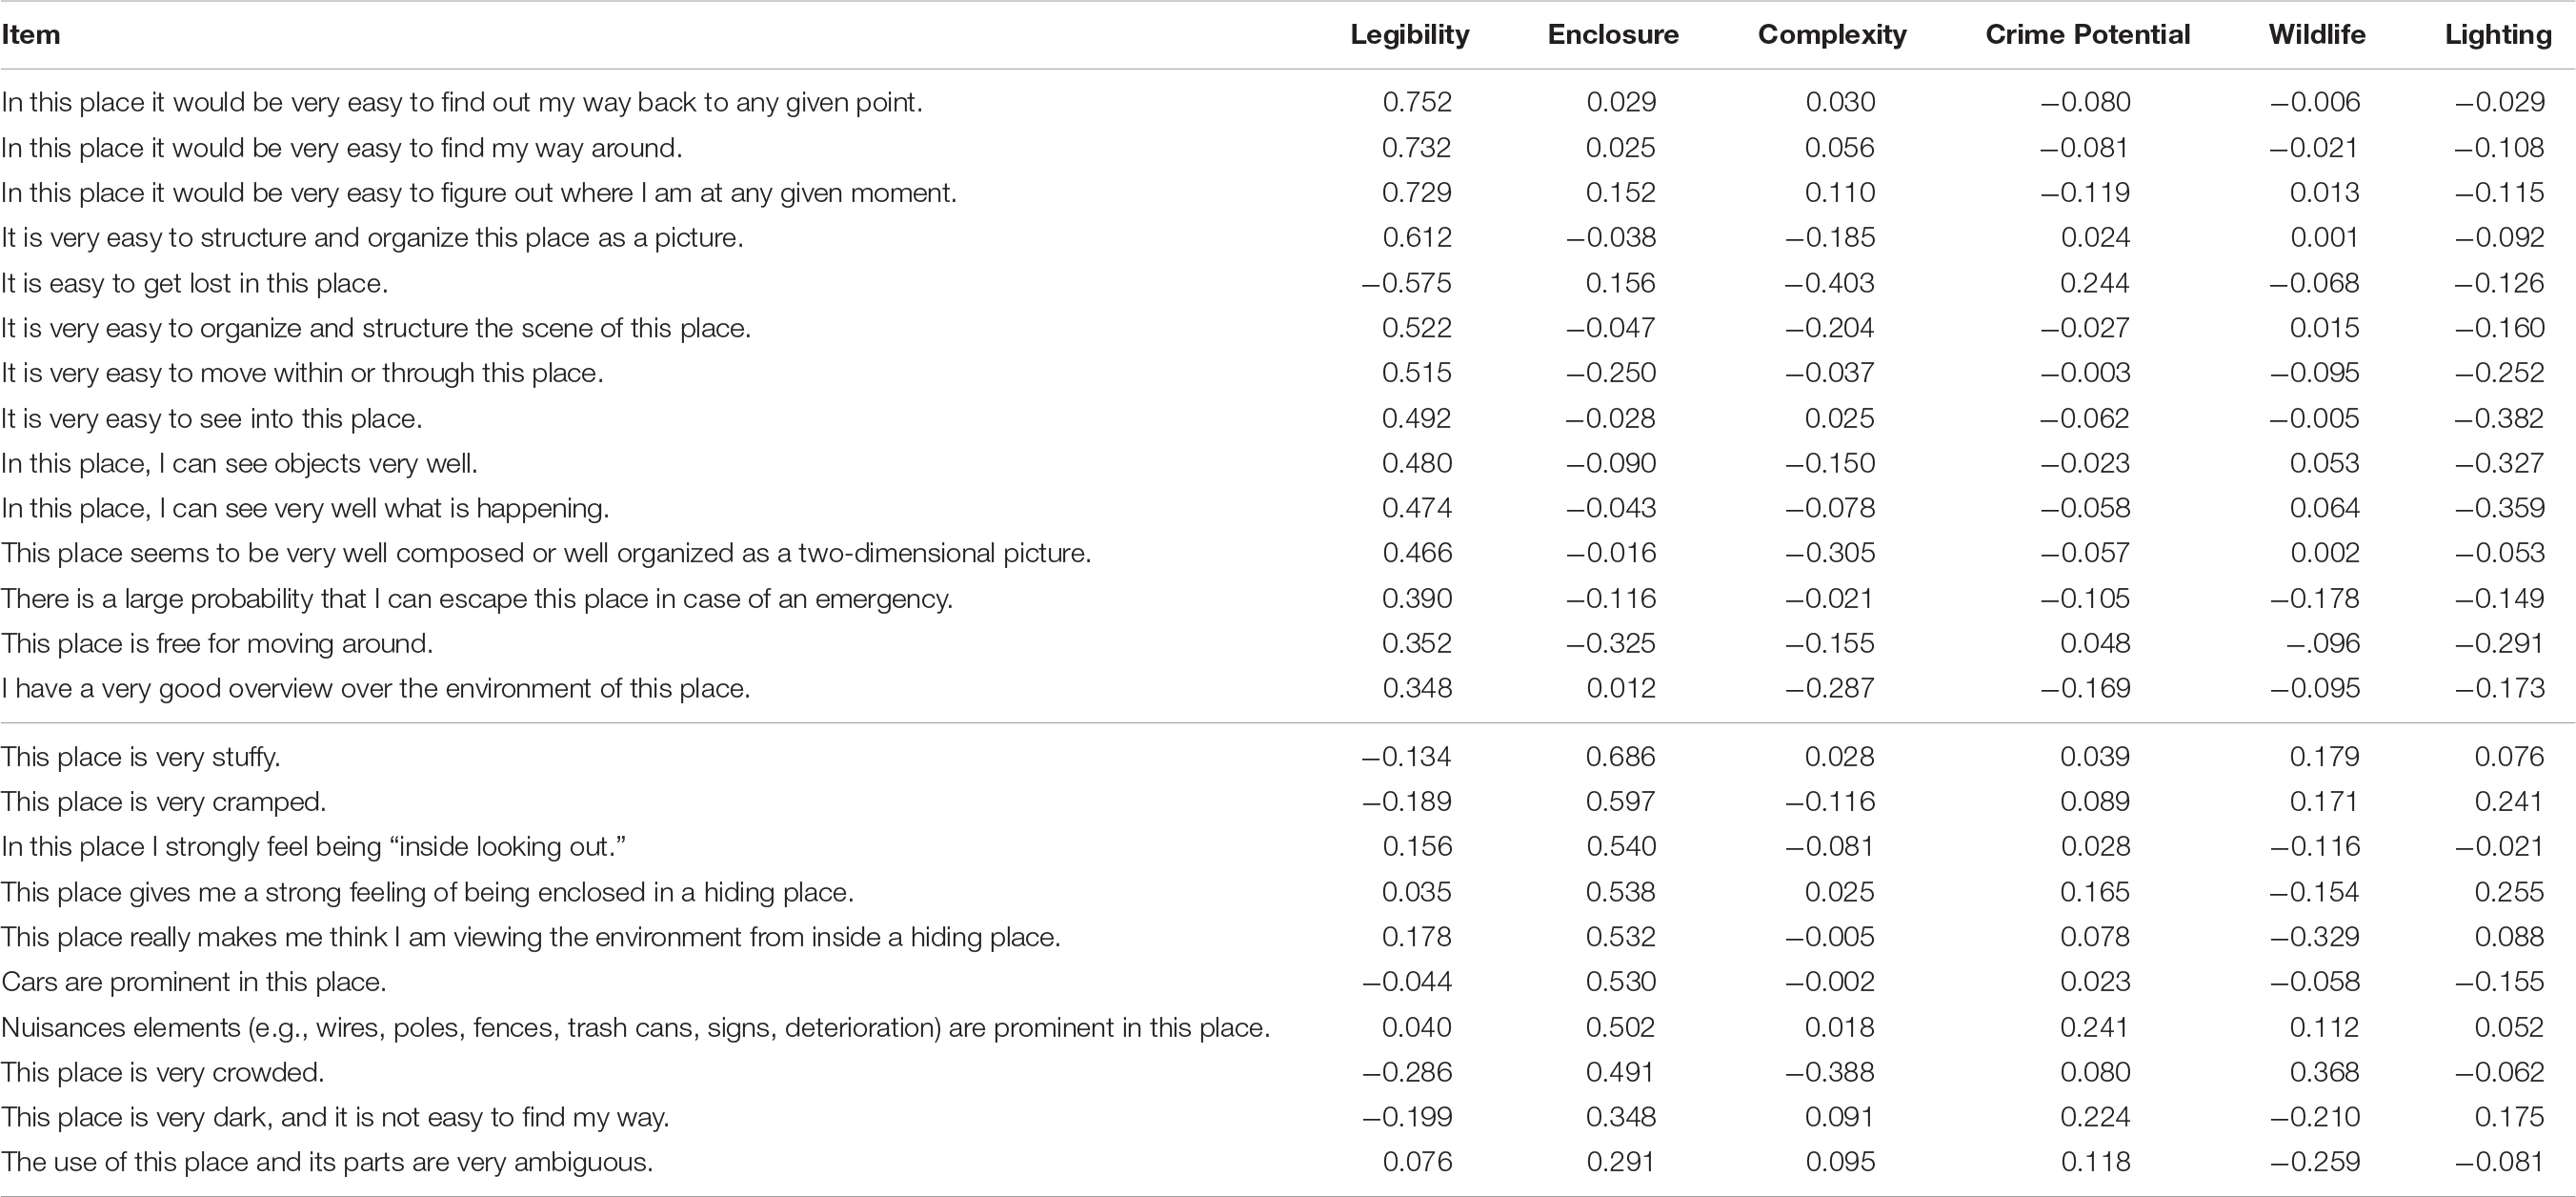
The dataset of 63 cognitive items was suitable for the analysis; KMO was 0.97 and Bartlett’s test of sphericity was statistically significant, χ2(1,953, N = 1,320) = 44,983.50, p < 0.001. Parallel analysis suggested that six factors should be retained, which explained 52.56% of the total variance. Factor loadings are presented in Table 9. Interpretive labels are suggested for the six factors: legibility, enclosure, complexity, crime potential, wildlife, and lighting. Legibility evaluates the extent to which a public space is easy to navigate within. Enclosure evaluates the extent to which the public space makes its viewers feel enclosed. Complexity refers to how much is going on in the public space. Crime potential refers to how much the public space is prone to crimes. Wildlife refers to the amount of trees, plants, and potential wildlife in the public space. Lighting describes the brightness and lighting quality in the public space. For lighting, only the top three loading items were retained because the fourth item had a loading below 0.49; for all the other factors, the top four loading items were retained.
Confirmatory factor analysis
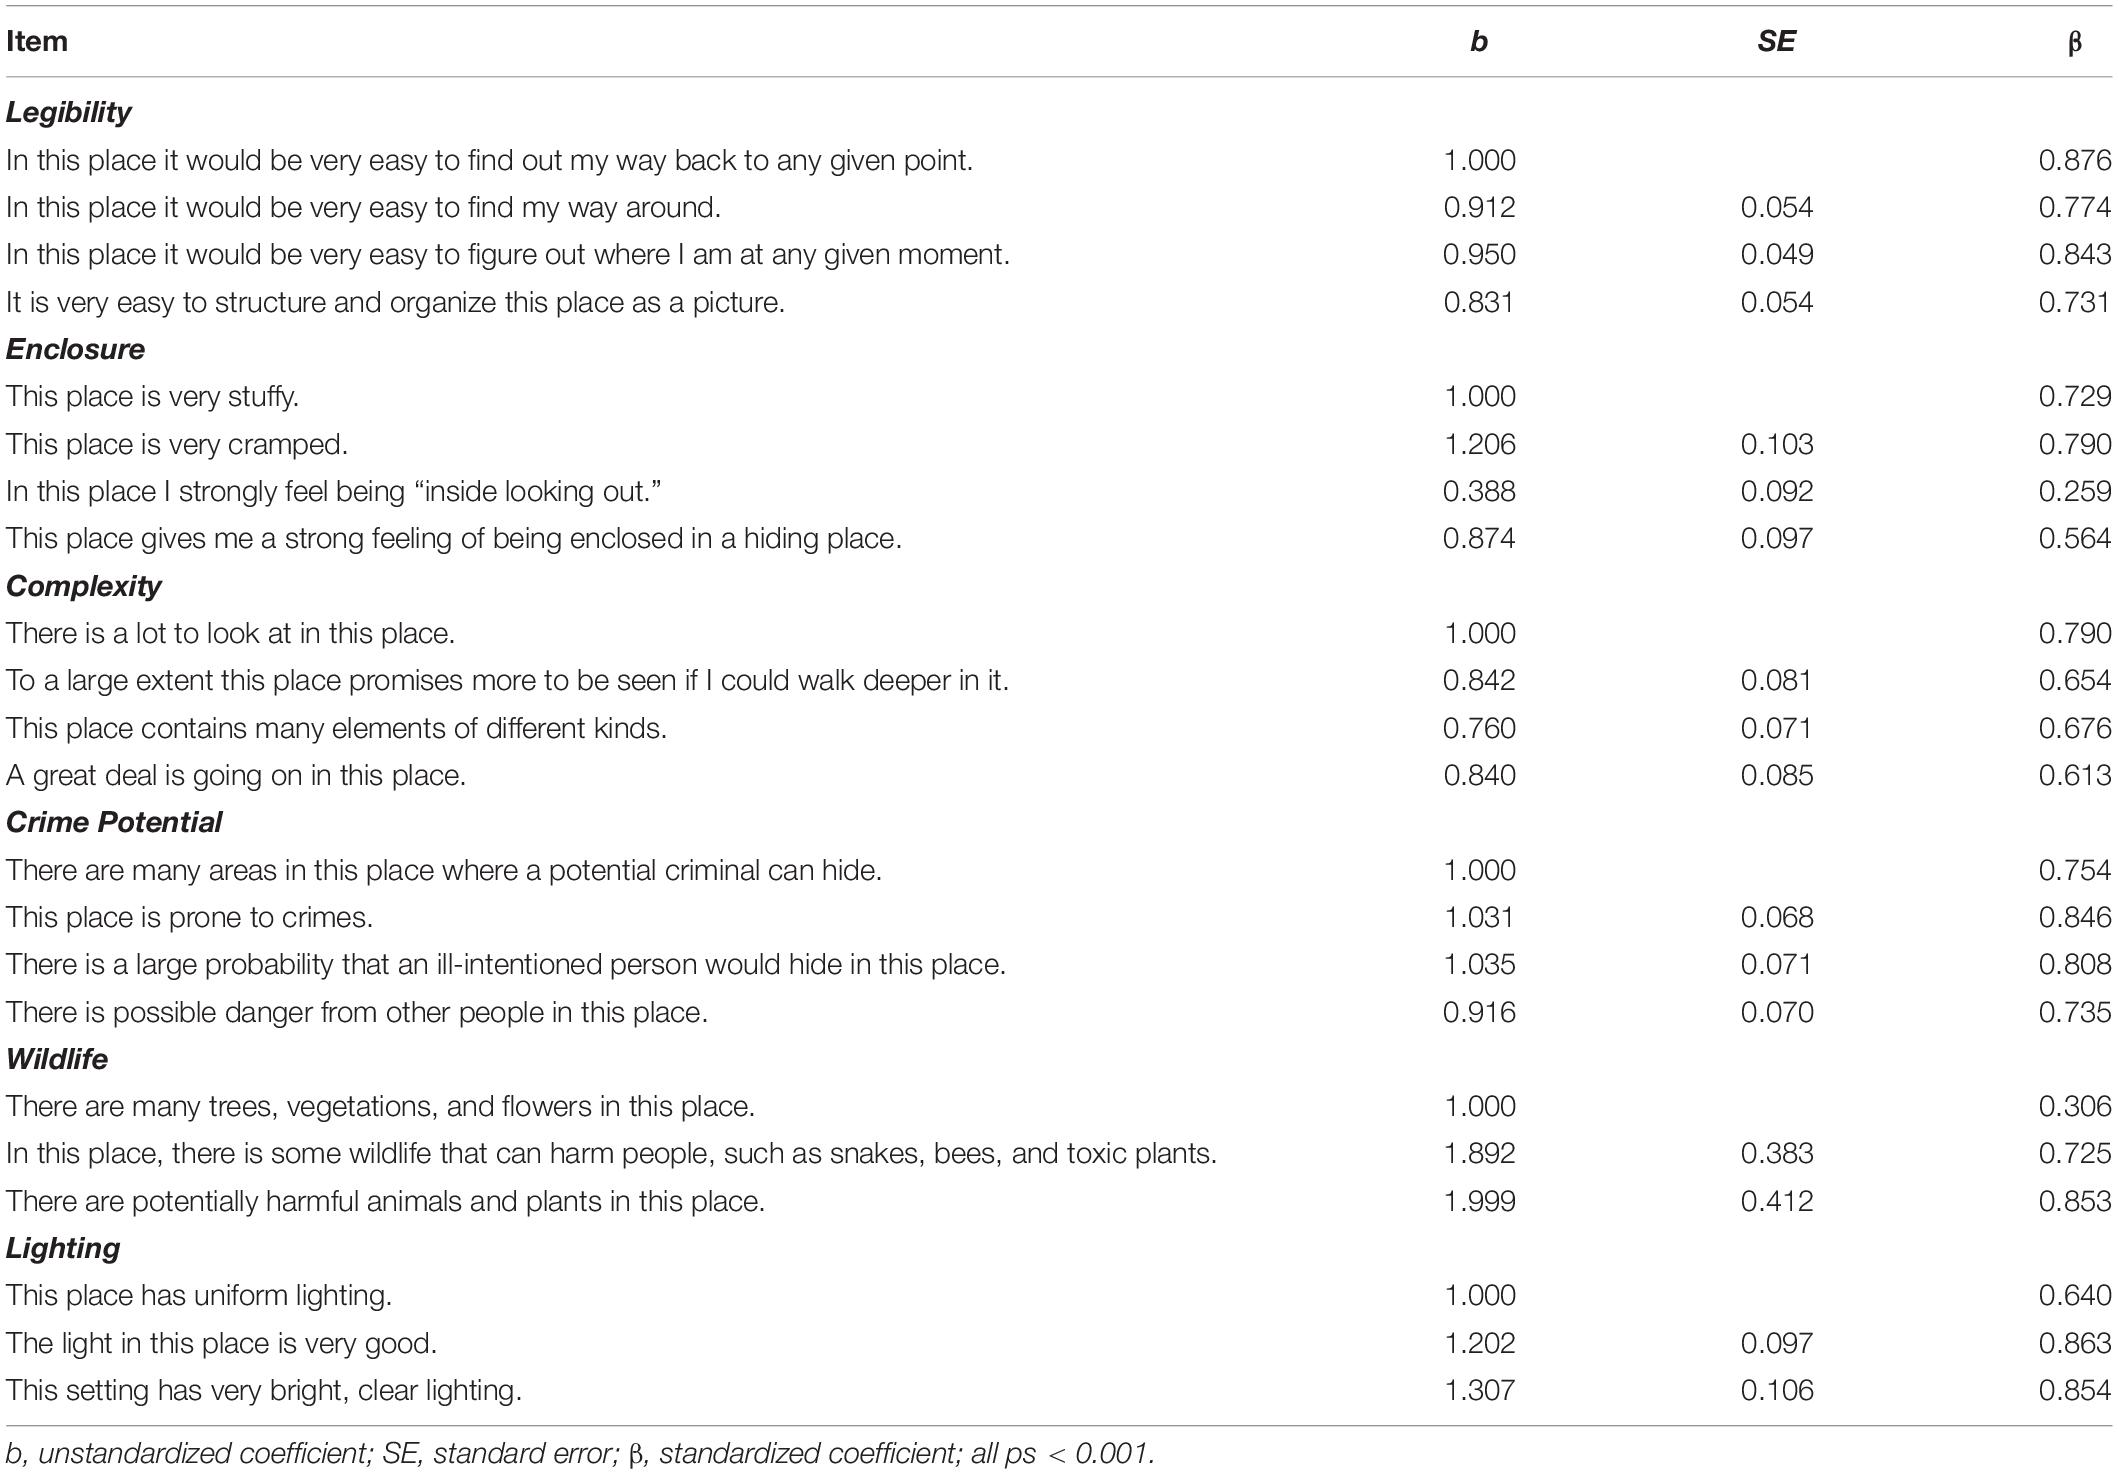
The six-factor model, as resulted from the PCA, was estimated, χ2(215, N = 330) = 653.05, p < 0.001; CFI = 0.88; TLI = 0.85; SRMR = 0.10; RMSEA = 0.08 (90% CI: 0.07, 0.09), p < 0.001. At this point, the model satisfied the cutoffs of SRMR and RMSEA but not CFI and TLI. We observed a non-significant factor loading of one item – “The nature (foliage, vegetation) in this place appears to be very well tended or well cared for” (p = 0.291); that indicated the initial model might be inadequate in accounting for the variance of that item. That item focused on describing the maintenance of the nature of a public space, while the other three items loaded onto the same factor (wildlife) focused on describing the amount of nature in a public space. Excluding the maintenance item would allow the other amount items to convey a more focused meaning; in other words, dropping that item would improve the interpretation of the overall model. After dropping the non-significant item, the model was re-estimated, χ2(194, N = 330) = 484.07, p < 0.001; CFI = 0.91; TLI = 0.90; SRMR = 0.07; RMSEA = 0.07 (90% CI: 0.06, 0.08), p < 0.001. The model now satisfied the cutoffs of all fit indices. Because post hoc model modification was performed, a correlation was calculated between the initial model parameter estimates and the parameter estimates from the modified (re-estimated) model, r = 1.00, p < 0.001; this indicated that parameter estimates were almost unchanged despite modification of the model. The coefficients in both unstandardized and standardized forms are presented in Table 10.
Invariance Analysis
Noting that the online survey in the current study was written and administered entirely in English while we collected samples from locations where English might not necessarily be a primary language, we conducted an invariance analysis to assess the fit of our models across groups from different locations. We divided the entire sample into two groups. The first group comprised 1,351 participants who reported that they resided in North America or Australia/Oceania, where English should be their primary language (English primary group). The second group comprised 289 participants who reported that they resided in South America, Africa, Europe, or Asia, where English might not necessarily be their primary language (English non-primary group). We excluded 10 participants who did not provide their current location. CFAs were performed using lavaan (Rosseel, 2012) with maximum likelihood estimation to assess the fits of both the affective and cognitive models to both the English primary and non-primary groups. We used the same model-fit criteria as in the previous section.
The two-factor affective model fit both groups equally well [English primary group: χ2(18, N = 1,351) = 186.114, p < 0.001; CFI = 0.98; TLI = 0.96; SRMR = 0.05; RMSEA = 0.08 (90% CI: 0.07, 0.09), p < 0.001; English non-primary group: χ2(18, N = 289) = 45.306, p < 0.001; CFI = 0.97; TLI = 0.96; SRMR = 0.04; RMSEA = 0.07 (90% CI: 0.05, 0.10), p < 0.001]. The six-factor cognitive model also fit both groups equally well [English primary group: χ2(194, N = 1,351) = 1,339.192, p < 0.001; CFI = 0.92; TLI = 0.90; SRMR = 0.08; RMSEA = 0.07 (90% CI: 0.06, 0.07), p < 0.001; English non-primary group: χ2(194, N = 289) = 341.066, p < 0.001; CFI = 0.92; TLI = 0.91; SRMR = 0.06; RMSEA = 0.05 (90% CI: 0.04, 0.06), p < 0.001]. Factor loadings of both affective and cognitive models for both the English primary and non-primary groups are provided in Supplementary Appendix B. The factor loadings between the English primary and non-primary groups were significantly positively correlated in both the affective model (r = 0.92, p = 0.001) and the cognitive model (r = 0.80, p < 0.001). In sum, our invariance analysis found that the factor structures of both the affective and cognitive models fit equally well both groups and that factor loadings were similar across the two groups. These findings provide further support for the external validity of our results in the sense that they were replicable across sub-samples regardless of the differences in their primary languages.
Composite Scores
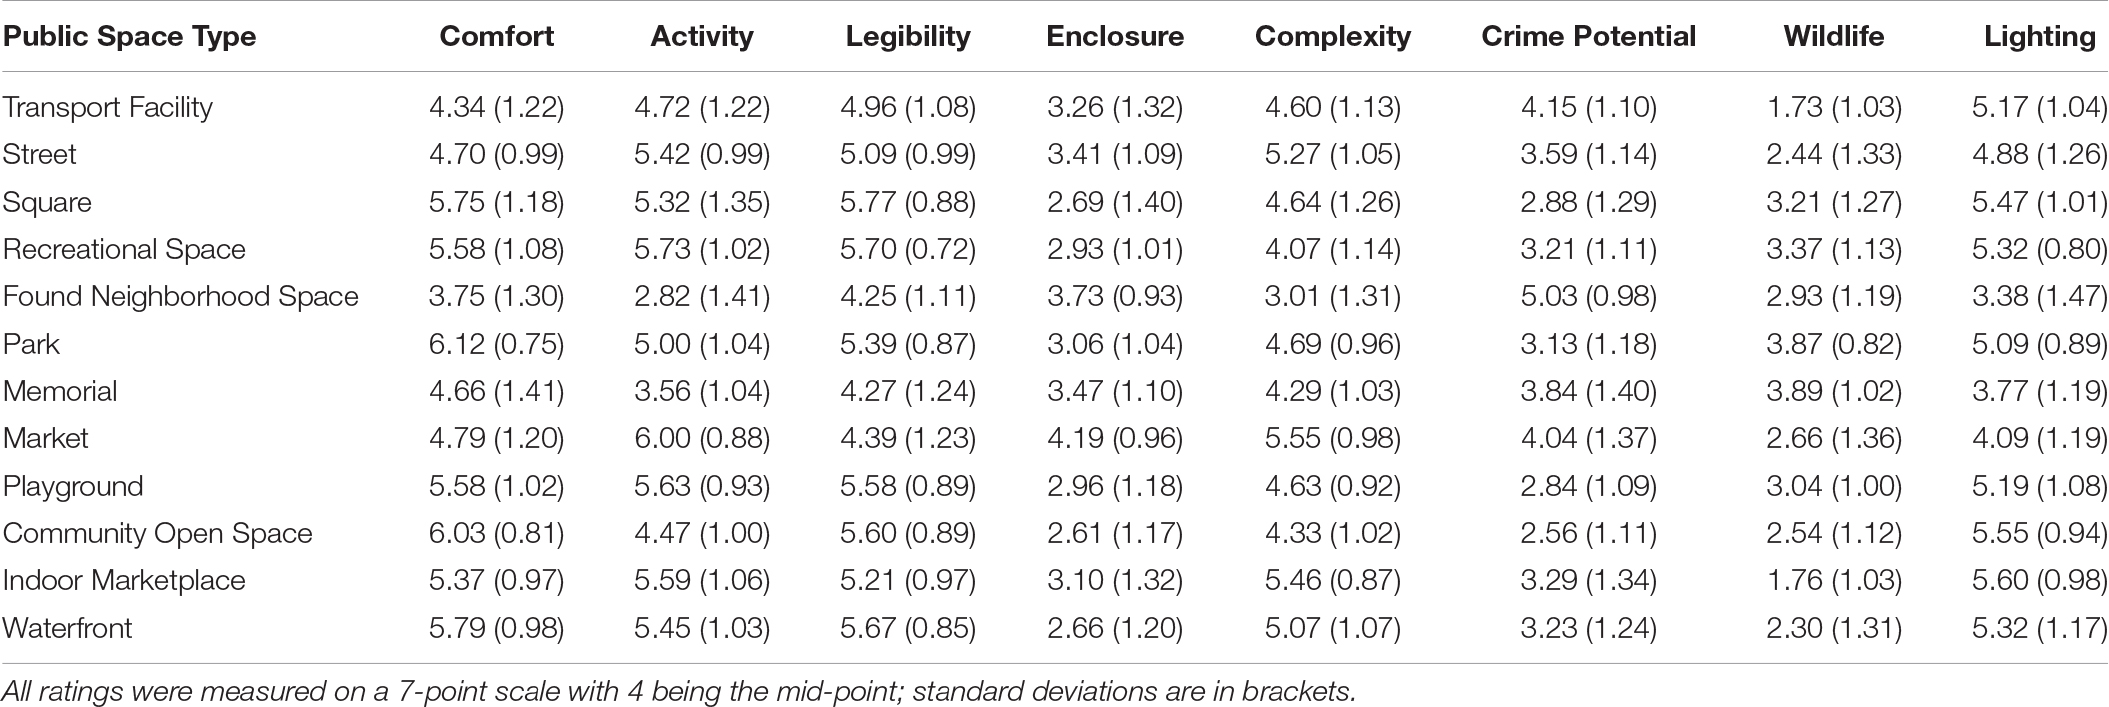
Using simple unit weighting (i.e., averaging the item scores under the same factor), composite scores corresponding to the eight attributes of environmental perception (comfort, activity, legibility, enclosure, complexity, crime potential, wildlife, and lighting) and the three outcome variables (perceived restorativeness, safety, and visitability) were computed for each case in the sample. The correlations among the composite scores and the reliability of each score are presented in Table 11. The significant correlations ranged from 0.07 to 0.76, that is, weak to strong. Between environmental perception and the outcome variables, both restorativeness (r = 0.75, p < 0.001) and visitability (r = 0.68, p < 0.001) were most strongly positively correlated with comfort; safety was most strongly negatively correlated with crime potential (r = −0.71, p < 0.001). Among environmental perception, the significant correlations ranged from 0.07 to 0.64, that is, weak to moderate. Moderate correlations were found between comfort and legibility (r = 0.55, p < 0.001), activity and complexity (r = 0.64, p < 0.001), and legibility and lighting (r = 0.58, p < 0.001). Enclosure, crime potential, and wildlife correlated negatively with all the others. No significant correlations were found between comfort and wildlife (p = 0.126), activity and enclosure (p = 0.247), and enclosure and complexity (p = 0.765). Overall, Cronbach’s alphas ranged from 0.67 to 0.90, indicating acceptable reliability of the measurements. Mean composite scores are generated and reported in Table 12.
Differentiating the 12 Public Spaces by Environmental Perception
Attributes of environmental perception would not be practical if they could not differentiate among different environmental settings. We therefore evaluated the extent to which the attributes of environmental perception could indeed differentiate among the 12 public-space images. We compared every possible pairs of public-space images on each of the eight attributes of environmental perception (comfort, activity, legibility, enclosure, complexity, crime potential, wildlife, and lighting) in terms of statistical and practical significance.2
There was a fair amount of variation among the 12 spaces on all attributes (see Table 12). A one-way multivariate analysis of variance (MANOVA) comparing the 12 spaces on the eight attributes found a statistically significant difference, F(88,4,468.52) = 16.29, p < 0.001; Wilk’s Λ = 0.16, = 0.20. Eight one-way ANOVAs then tested differences among the 12 spaces on each attribute separately. Since there were eight comparisons (i.e., eight attributes), the alpha level was adjusted to 0.05/8 = 0.00625 using a Bonferroni correction. There were still statistically significant differences in all attributes among the 12 public-space images, in terms of comfort [F(11,687) = 25.69, p < 0.001, = 0.29], activity [F(11,687) = 43.10, p < 0.001, = 0.41], legibility [F(11,687) = 19.14, p < 0.001, = 0.24], enclosure [F(11,687) = 9.58, p < 0.001, = 0.13], complexity [F(11,687) = 24.11, p < 0.001, = 0.28], crime potential [F(11,687) = 18.11, p < 0.001, = 0.23], wildlife [F(11,687) = 22.35, p < 0.001, = 0.26], and lighting [F(11,687) = 25.40, p < 0.001, = 0.29].
How the 12 public spaces were different from each other on each attribute was examined by a series of Tukey’s HSD post-hoc tests. Detailed results are reported in Supplementary Appendix C. Given the average group sample size of approximately 50 resulting in large statistical power to detect statistical significance, we also considered if the mean differences (as measured on a 7-point scale) were greater than ±1 as an indication of practical significance. Table 13 is a frequency table that summarizes the number of times a public-space image was statistically and practically different from another image on a given attribute. For example, transport facility was statistically and practically different from seven other space types in comfort, but it was not statistically nor practically different from the others in legibility and enclosure. The bottom row shows the total number of times the 12 spaces differed from each other on a given attribute. A larger number indicates that the 12 public spaces are more likely to differ from each other on the corresponding attribute. Comfort, activity, and lighting are the best three attributes in differentiating the 12 spaces, whereas enclosure is the least discriminating attribute. Overall, these results show that, to various extents, the eight attributes of environmental perception are all able to differentiate among different types of public spaces, which demonstrate the practical utility of the scale of environmental perception.
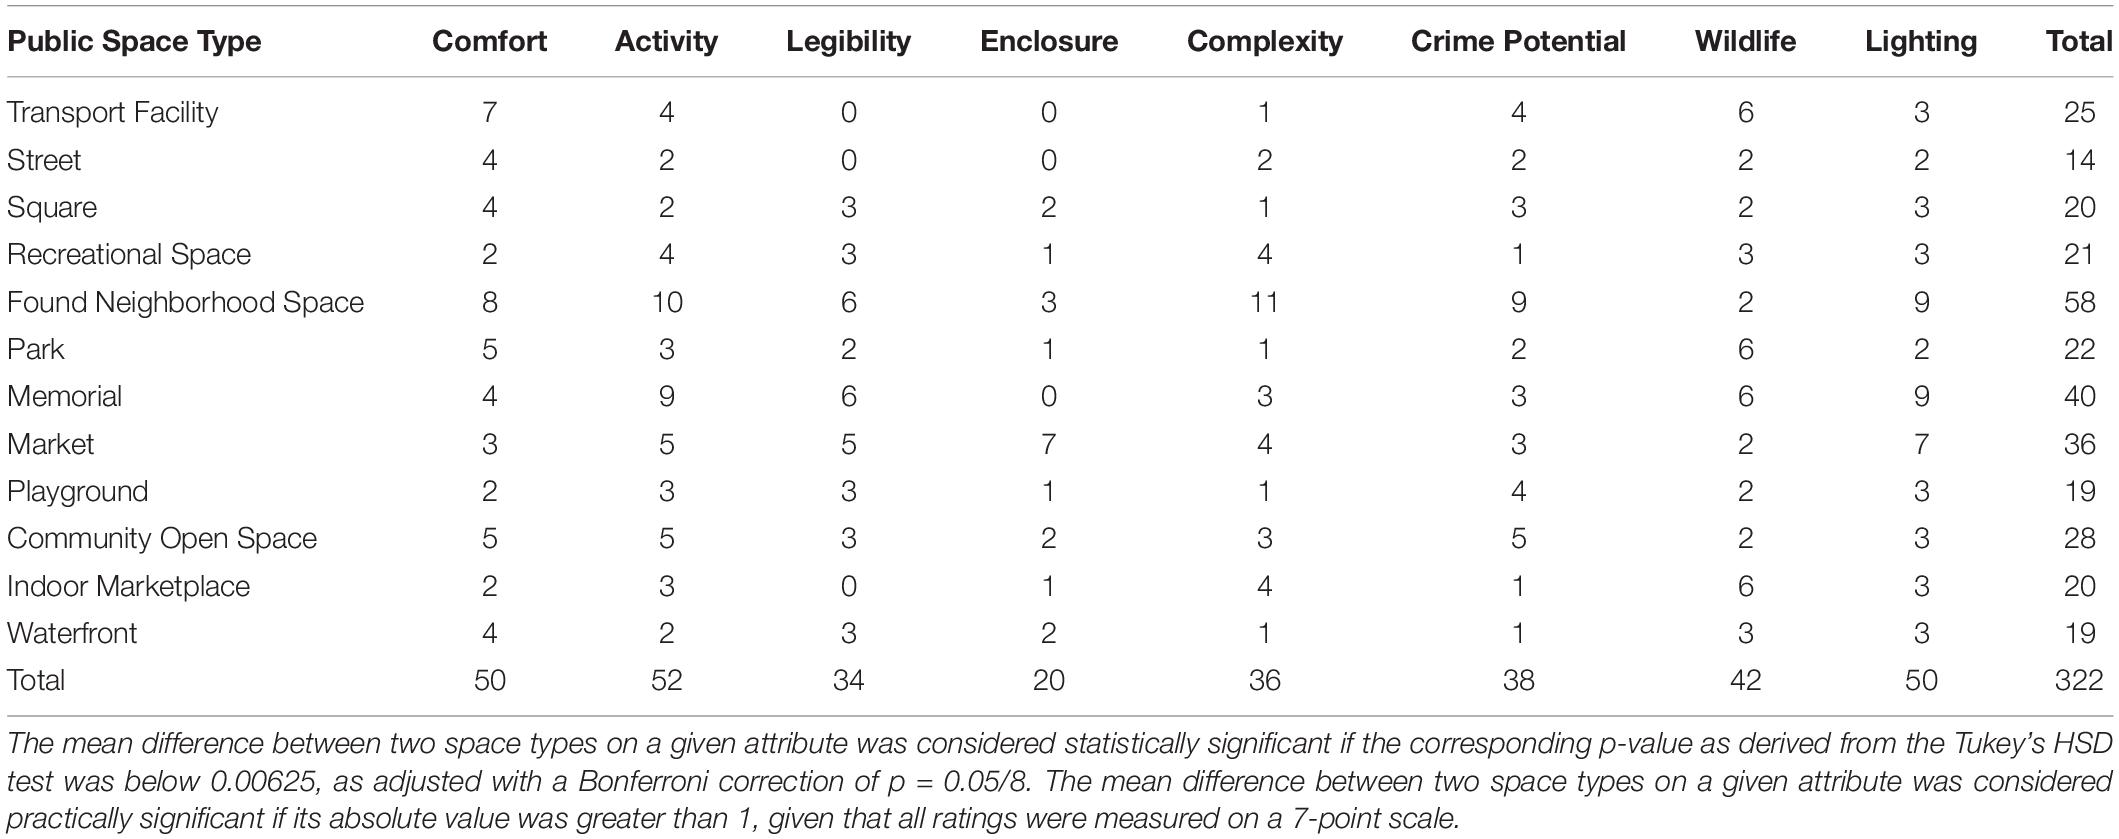
Table 13. Frequencies of statistically and practically significant differences among the 12 public spaces on environmental perception.
Multiple Regression of Outcome Variables on Environmental Perception
Multiple regressions were performed to examine the criterion validity of the scale of environmental perception in predicting evaluation of public spaces, i.e., perceived restorativeness, safety, and visitability. Noting the moderate-to-strong correlations among the variables, we observed variance inflation factors (VIFs) to detect potential threat of multicollinearity. All VIFs were below the threshold of 10 as recommended by Myers (1990; also see O’Brien, 2007), which indicated there was a negligible impact of multicollinearity. Results of the regressions are organized in Table 14, a summary is also provided below.
Environmental perception significantly predicted perceived restorativeness, F(8,1,641) = 411.732, p < 0.001, R2 = 0.667. All variables except activity and enclosure contributed statistical significance to the prediction. Higher perceived restorativeness could be predicted by higher comfort, higher legibility, higher complexity, lower crime potential, higher wildlife, and higher lighting (ps < 0.05).
Environmental perception significantly predicted perceived safety, F(8,1,641) = 463.331, p < 0.001, R2 = 0.693. All variables except wildlife contributed statistical significance to the prediction. Higher perceived safety could be predicted by higher comfort, higher activity, higher legibility, lower enclosure, higher complexity, lower crime potential, and higher lighting (ps < 0.05).
Environmental perception significantly predicted perceived visitability, F(8,1,641) = 419.523, p < 0.001, R2 = 0.672. All variables except enclosure contributed statistically significance to the prediction. Higher perceived visitability could be predicted by higher comfort, higher activity, higher legibility, higher complexity, lower crime potential, higher wildlife, and higher lighting (ps < 0.05).
Overall, these results demonstrate that our scale could predict perceived restorativeness, safety, and visitability about public spaces, and thereby provide support for the criterion validity of the scale.
Discussion
Major Findings
The current study addresses the need for a comprehensive tool for measuring subjectively perceived quality of public spaces. Through PCAs and CFAs, we developed factor models that consist of two affective factors (comfort and activity) and six cognitive factors (legibility, enclosure, complexity, crime potential, wildlife, and lighting). The corresponding scale items should sufficiently capture the core attributes underlying environmental perception of public spaces. Our scale allows us to compare different types of public spaces along the same standardized terms. With this new scale, we are able to describe, in a common language, the similarities as well as differences among different public spaces. Furthermore, this scale enables us to measure perception of public spaces on a quantitative basis, facilitating incorporation of subjective perception of public spaces into other research frameworks such as quality of life (Pacione, 2003). Overall, this scale should open new possibilities in research where public spaces is concerned.
Our factor structures of perception of public spaces follow the affective-cognitive distinction, which is prominent in environmental-perception research. By consolidating constructs and items from previous studies, our scale presents a succinct model of environmental perception. Initially there were 47 items measuring 10 unique affective constructs and 163 items measuring 27 unique cognitive constructs. The final affective model retained 8 affective items originated from 5 affective constructs that are now grouped into two factors. Comfort covers pleasantness, relaxation, and safeness. Activity covers activity and excitement. The final cognitive model retained 22 cognitive items originated from 12 cognitive constructs that are now grouped into six factors. Legibility covers legibility and composition. Enclosure covers enclosure and perceived crowding. Complexity covers complexity and mystery. Crime potential covers safety and situational concern. Wildlife covers naturalness and situational concern. Lighting covers lighting, brightness, and uniform lighting. We do not intend to claim that these 17 constructs in our model are sufficient in mapping the full spectrum of environmental perception of public spaces. We do hope to claim, however, those 17 constructs are necessary in describing the common experiences of public spaces. Our model may be further developed by other researchers through adding extra constructs or refining an existing construct depending on the specific research contexts.
Our scale could predict preferences about public spaces, and that re-confirms our knowledge about the association between environmental perception and preference. Perceived restorativeness of public spaces was predicted by higher comfort, higher legibility, higher complexity, lower crime potential, higher wildlife, and higher lighting. Perceived safety was predicted by higher comfort, higher activity, higher legibility, lower enclosure, higher complexity, lower crime potential, and higher lighting. Visitability was predicted by higher comfort, higher activity, higher legibility, higher complexity, lower crime potential, higher wildlife, and higher lighting. Not only do these results confirm the findings of previous research, but they also highlight the importance of the various aspects of environmental perception. At the practical level, for example, urban planners could use our model and scale to examine which aspects of public-space perception may account for other urban-related concepts such as inhabitants’ perceived insecurity, residential satisfaction, etc. At the theoretical level, our findings contribute to establishing the link between perceived attributes of an environment and preference of that environment.
Limitations
Our findings are limited by the use of pictorial stimuli to represent environmental settings of public spaces. There is an obvious difference between experiencing a real-world environment and a simulated environment. Being situated in a real-world environment, a person receives visual, audio, olfactory, and tactile sensations whereas our stimuli were only static, two-dimensional visual stimuli. Also, a real-world environment provides a 360°, immersive experience with the environment whereas our pictorial depiction provided only a restricted point of view into the environment. That being said, the validity of using pictorial stimuli to simulate public spaces is supported by a meta-analysis of 17 empirical studies that evaluated environmental settings either on-site or through static simulations (Stamps, 2010); subjective evaluations of environmental settings on-site and their static simulations were very strongly correlated at r = 0.86. Thus, we are confident that our static pictorial stimuli were adequate in representing the actual locations in the real world. Also, using pictorial stimuli provided us with stronger experimental control over the research participants’ experiences. By adopting a single visual point of view into the public spaces in the current study, we could standardize the experiences of public spaces among all research participants. To overcome the limitation of the use of static stimuli, we suggest future studies to examine perception of public spaces in the real world or through a medium that allows a more immersive environmental experience. Higher-fidelity simulations such as videos and virtual reality, and stimuli accompanied by audios are good examples. Field experiments, while affording much less experimental control, should also be considered for maximizing the ecological validity of research findings.
The current findings are also limited by the use of only 12 images built upon a self-developed typology to represent the broad concept of public spaces. In reality, there are endless possibilities in how public spaces take shape across cultures and histories. It is impossible to exhaust all environmental settings that meet the definition of public spaces in one single study. Knowing the challenges in representing the vast notion of public spaces, we were cautious in developing the theoretical typology of public spaces and identifying the most appropriate images to our knowledge to depict that typology. Our typology is a result of combining well-established typologies in the literature; those typologies categorize public spaces according to their functions and purposes. Our pilot studies evaluated real-world public spaces in terms of their fit in representing our typology; our participant samples included both people local and foreign to the geographical region from which our public spaces were selected. In other words, the 12 public-space images of the current study had a theoretical root and were constructed with respect for real populations from different cultural contexts. Thus, although our collection of public spaces were limited, they should represent the most common types of public spaces. Future studies that cross-validate our scale should consider examining public spaces that are atypical or do not fit easily into our typology. Evaluating atypical public spaces can help uncover additional components or sub-components underlying environmental perception of public spaces.
The current findings are based on a convenient sample recruited on Amazon MTurk. As the individuals who make themselves available on MTurk are supposedly motivated by monetary rewards, some might question if such an unsupervised sample would show a genuine concern and interest for the welfare of scientific research. Research has shown that MTurk samples respond in a manner consistent with other convenient samples to experimental stimuli in framing experiments (Berinsky et al., 2012) and behavioral experiments (Casler et al., 2013), and thereby lends support to the reliability of the data collected through MTurk. We also included attention check in our survey as often suggested (Goodman et al., 2013; Kees et al., 2017). While correctly answering all attention-check items could not prove that a research participant had paid full attention throughout the survey, we excluded participants who failed attention check to safeguard the quality of the data at some level. Thus, despite the unsupervised nature of the MTurk samples, data-quality research findings and the attention-check mechanisms we employed provide us with the confidence about the reliability of our data. Future studies of public-space perception should incorporate alternative data sources. For example, respondents in field study are “real” people who might not necessarily behave the same way as people responding to an online survey. Actual field data will provide a good opportunity to cross-validate the scale.
Finally, there is the related issue regarding the cross-cultural nature of our online survey. Smith (2004) discusses the challenges of conducting research at the cross-cultural level. One major challenge relates to the language or linguistic aspects of the research materials. For example, questionnaire items might no longer convey the same meanings after being translated to a different language. Or some concepts simply do not exist in some cultures. Furthermore, some research procedures might not make sense to people from a culture different from that of the researcher. Majority of our sample resided in North America, while others resided in South America, Africa, Europe, Asia, and Australia/Oceania (see Table 5). Since our online survey was constructed and administered in English entirely, people outside the North America, where English might not necessarily be their primary language, could have responded differently to our survey due to linguistic differences. As our analysis has shown, our factor structures could fit both the English primary and non-primary groups equally well; that gives us confidence about our findings. Certainly, there was only a small proportion of samples that were recruited from outside the North America. Thus, further studies may try to establish proper cross-cultural comparisons. For example, data collection may be restricted to a particular location in the world. That way, we could systematically manipulate the cultural context where we collect our samples.
Data Availability Statement
The raw data supporting the conclusions of this article will be made available by the authors, without undue reservation.
Ethics Statement
The studies involving human participants were reviewed and approved by The Survey and Behavioural Research Ethics Committee of The Chinese University of Hong Kong. The patients/participants provided their written informed consent to participate in this study.
Author Contributions
RH was the principal investigator of this research and was responsible for creating the main content of this manuscript. WTA was a co-principal investigator and was involved in the design, methodology, analysis, and reporting of this manuscript. Both authors contributed to the article and approved the submitted version.
Funding
This work was partially supported by a grant from The Department of Psychology at The Chinese University of Hong Kong.
Conflict of Interest
The authors declare that the research was conducted in the absence of any commercial or financial relationships that could be construed as a potential conflict of interest.
Supplementary Material
The Supplementary Material for this article can be found online at: https://www.frontiersin.org/articles/10.3389/fpsyg.2020.596790/full#supplementary-material
Footnotes
- ^ To be precise, there were 56 groups of research participants. The current study was part of a larger research project, which was also interested in the effects of mislabeling, prompting, and street performance (i.e., the act of performing or entertaining in public spaces with the intention of seeking donations from passersby). To examine the effect of mislabeling, two extra space types – a mislabeled found neighborhood space and a mislabeled community open space – were added to the research design. When presented with their assigned public-space image, the participants in the Mislabel conditions were provided with a space-type definition that was deliberately mislabeled; found neighborhood space was mislabeled as street and community open space was mislabeled as square. To examine the effect of prompting, the 14 space types (12 originals plus 2 mislabels) were doubled by the variation between prompting and no prompting. Participants in the Prompt conditions were instructed to actively imagine themselves using the space on a regular basis, whereas those in the No-Prompt conditions received no such instructions. To examine the effect of street performance, we manipulated all images between with and without an animated event of street performance. Participants in the No-Street-Performance conditions evaluated the public-space images as they were originally constructed whereas those in the Street-Performance conditions evaluated the exact same images but with an addition of a street performer playing a guitar and interacting with two adult passersby. In sum, the original 12 public-space types plus 2 extra mislabeled versions, doubled by the variation of prompting, and then doubled by the addition of street performance, resulted in a total of (12 + 2) × 2 × 2 = 56 groups of research participants in the current study.
- ^ In this analysis, we excluded the samples of the Mislabel groups and the Street-Performance groups (see description in Footnote 1), given the fundamental interest here was to differentiate the 12 public spaces as in their base (unmanipulated) settings.
References
Abdulkarim, D., and Nasar, J. L. (2014a). Are livable elements also restorative? J. Environ. Psychol. 38, 29–38. doi: 10.1016/j.jenvp.2013.12.003
Abdulkarim, D., and Nasar, J. L. (2014b). Do seats, food vendors, and sculptures improve plaza visitability? Environ. Behav. 46, 805–825. doi: 10.1177/0013916512475299
Aiello, A., Ardone, R. G., and Scopelliti, M. (2010). Neighbourhood planning improvement: physical attributes, cognitive and affective evaluation and activities in two neighbourhoods in Rome. Eval. Program Plan. 33, 264–275. doi: 10.1016/j.evalprogplan.2009.10.004
Alisat, S., and Riemer, M. (2015). The environmental action scale: development and psychometric evaluation. J. Environ. Psychol. 43, 13–23. doi: 10.1016/j.jenvp.2015.05.006
Bartlett, M. S. (1937). Properties of sufficiency and statistical tests. Proc. R. Soc. Lond. A Math. Phys. Sci. 160, 268–282. doi: 10.1098/rspa.1937.0109
Berinsky, A. J., Huber, G. A., and Lenz, G. S. (2012). Evaluating online labor markets for experimental research: amazon.com’s Mechanical Turk. Polit. Anal. 20, 351–368. doi: 10.1093/pan/mpr057
Cakmak, M. (2020). Environmental perception scale: a study of reliability and validity. Int. Online J. Educ. Sci. 12, 268–287. doi: 10.15345/iojes.2020.03.019
Carmona, M. (2010). Contemporary public space, part two: classification. J. Urban Des. 15, 157–173. doi: 10.1080/13574801003638111
Carr, S., Francis, M., Rivlin, L. G., and Stone, A. M. (1992). Public Space. Cambridge, MA: Cambridge University Press.
Casler, K., Bickel, L., and Hackett, E. (2013). Separate but equal? A comparison of participants and data gathered via Amazon’s MTurk, social media, and face-to-face behavioral testing. Comput. Hum. Behav. 29, 2156–2160. doi: 10.1016/j.chb.2013.05.009
Chiang, Y.-C., Nasar, J. L., and Ko, C.-C. (2014). Influence of visibility and situational threats on forest trail evaluations. Landsc. Urban Plann. 125, 166–173. doi: 10.1016/j.landurbplan.2014.02.004
Francis, J., Giles-Corti, B., Wood, L., and Knuiman, M. (2012). Creating sense of community: the role of public space. J. Environ. Psychol. 32, 401–409. doi: 10.1016/j.jenvp.2012.07.002
Goodman, J. K., Cryder, C. E., and Cheema, A. (2013). Data collection in a flat world: the strengths and weaknesses of Mechanical Turk samples. J. Behav. Dec. Mak. 26, 213–224. doi: 10.1002/bdm.1753
Gummer, T., Roßmann, J., and Silber, H. (2018). Using instructed response items as attention checks in web surveys: properties and implementation. Sociol. Methods Res. 1, 1–27. doi: 10.1017/psrm.2019.53
Hanyu, K. (1997). Visual properties and affective appraisals in residential areas after dark. J. Environ. Psychol. 17, 301–315. doi: 10.1006/jevp.1997.0067
Hayton, J. C., Allen, D. G., and Scarpello, V. (2004). Factor retention decisions in exploratory factor analysis: a tutorial on parallel analysis. Organ. Res. Methods 7, 191–205. doi: 10.1177/1094428104263675
Herzog, T. R. (1992). A cognitive analysis of preference for urban spaces. J. Environ. Psychol. 12, 237–248. doi: 10.1016/S0272-4944(05)80138-0
Herzog, T. R., and Bryce, A. G. (2007). Mystery and preference in within-forest settings. Environ. Behav. 39, 779–796. doi: 10.1177/0013916506298796
Herzog, T. R., and Gale, T. A. (1996). Preference for urban buildings as a function of age and nature context. Environ. Behav. 28, 44–72. doi: 10.1177/0013916596281003
Herzog, T. R., and Leverich, O. L. (2003). Searching for legibility. Environ. Behav. 35, 459–477. doi: 10.1177/0013916503035004001
Ho, R., Au-Young, W. T., and Au, W. T. (2020). Effects of environmental experience on audience experience of street performance (busking). Psychol. Aesth. Creat. Arts [Epub ahead of print]. doi: 10.1037/aca0000301
Homburg, A., Stolberg, A., and Wagner, U. (2007). Coping with global environmental problems: development and first validation of scales. Environ. Behav. 39, 754–778. doi: 10.1177/0013916506297215
Kaiser, F. G., Oerke, B., and Bogner, F. X. (2007). Behavior-based environmental attitude: development of an instrument for adolescents. J. Environ. Psychol. 27, 242–251. doi: 10.1016/j.jenvp.2007.06.004
Kaiser, H. F. (1970). A second generation little jiffy. Psychometrika 35, 401–415. doi: 10.1007/BF02291817
Kam, C. C. S., and Chan, G. H.-H. (2018). Examination of the validity of instructed response items in identifying careless respondents. Pers. Individ. Diff. 129, 83–87. doi: 10.1016/j.paid.2018.03.022
Kees, J., Berry, C., Burton, S., and Sheehan, K. (2017). An analysis of data quality: professional panels, student subject pools, and Amazon’s mechanical turk. J. Advert. 46, 141–155. doi: 10.1080/00913367.2016.1269304
Kung, F. Y. H., Kwok, N., and Brown, D. J. (2018). Are attention check questions a threat to scale validity? Appl. Psychol. 67, 264–283. doi: 10.1111/apps.12108
Laumann, K., Gärling, T., and Stormark, K. M. (2001). Rating scale measures of restorative components of environments. J. Environ. Psychol. 21, 31–44. doi: 10.1006/jevp.2000.0179
Legendre, A., and Gómez-Herrera, J. (2011). Interindividual differences in children’s knowledge and uses of outdoor public spaces. Psyecology 2, 193–206. doi: 10.1174/217119711795712577
Li, C., and Monroe, M. C. (2018). Development and validation of the climate change hope scale for high school students. Environ. Behav. 50, 454–479. doi: 10.1177/0013916517708325
Lindal, P. J., and Hartig, T. (2013). Architectural variation, building height, and the restorative quality of urban residential streetscapes. J. Environ. Psychol. 33, 26–36. doi: 10.1016/j.jenvp.2012.09.003
Lindal, P. J., and Hartig, T. (2015). Effects of urban street vegetation on judgments of restoration likelihood. Urban For. Urban Green. 14, 200–209. doi: 10.1016/j.ufug.2015.02.001
Martin, C., and Czellar, S. (2016). The extended inclusion of nature in self scale. J. Environ. Psychol. 47, 181–194. doi: 10.1016/j.jenvp.2016.05.006
Matsunaga, M. (2010). How to factor-analyze your data right: do’s, don’ts, and how-to’s. Int. J. Psychol. Res. 3, 97–110. doi: 10.21500/20112084.854
Mayer, F. S., and Frantz, C. M. (2004). The connectedness to nature scale: a measure of individuals’ feeling in community with nature. J. Environ. Psychol. 24, 503–515. doi: 10.1016/j.jenvp.2004.10.001
Milfont, T. L., and Duckitt, J. (2010). The environmental attitudes inventory: a valid and reliable measure to assess the structure of environmental attitudes. J. Environ. Psychol. 30, 80–94. doi: 10.1016/j.jenvp.2009.09.001
Motoyama, Y., and Hanyu, K. (2014). Does public art enrich landscapes? The effect of public art on visual properties and affective appraisals of landscapes. J. Environ. Psychol. 40, 14–25. doi: 10.1016/j.jenvp.2014.04.008
Myers, R. H. (1990). Classical and Modern Regression With Applications, 2nd Edn. Boston, MA: PWS-Kent Publishing Company.
Nasar, J. L. (1983). Adult viewers’ preferences in residential scenes: a study of the relationship of environmental attributes to preference. Environ. Behav. 15, 589–614. doi: 10.1177/0013916583155003
Nasar, J. L. (1994). Urban design aesthetics: the evaluative qualities of building exteriors. Environ. Behav. 26, 377–401. doi: 10.1177/001391659402600305
Nasar, J. L., and Bokharaei, S. (2017a). Impressions of lighting in public squares after dark. Environ. Behav. 49, 227–254. doi: 10.1177/0013916515626546
Nasar, J. L., and Bokharaei, S. (2017b). Lighting modes and their effects on impressions of public squares. J. Environ. Psychol. 49, 96–105. doi: 10.1016/j.jenvp.2016.12.007
Nasar, J. L., and Cubukcu, E. (2011). Evaluative appraisals of environmental mystery and surprise. Environ. Behav. 43, 387–414. doi: 10.1177/0013916510364500
Nasar, J. L., and Terzano, K. (2010). The desirability of views of city skylines after dark. J. Environ. Psychol. 30, 215–225. doi: 10.1016/j.jenvp.2009.11.007
O’Brien, L. V., Meis, J., Anderson, R. C., Rizio, S. M., Ambrose, M., Bruce, G., et al. (2018). Low Carbon Readiness Index: a short measure to predict private low carbon behaviour. J. Environ. Psychol. 57, 34–44. doi: 10.1016/j.jenvp.2018.06.005
O’Brien, R. M. (2007). A caution regarding rules of thumb for variance inflation factors. Qual. Q. Int. J. Methodol. 41, 673–690. doi: 10.1007/s11135-006-9018-6
Pacione, M. (2003). Urban environmental quality and human wellbeing—A social geographical perspective. Landsc. Urban Plann. 65, 19–30. doi: 10.1016/S0169-2046(02)00234-7
Pals, R., Steg, L., Dontje, J., Siero, F. W., and van der Zee, K. I. (2014). Physical features, coherence and positive outcomes of person–environment interactions: a virtual reality study. J. Environ. Psychol. 40, 108–116. doi: 10.1016/j.jenvp.2014.05.004
Pals, R., Steg, L., Siero, F. W., and van der Zee, K. I. (2009). Development of the PRCQ: a measure of perceived restorative characteristics of zoo attractions. J. Environ. Psychol. 29, 441–449. doi: 10.1016/j.jenvp.2009.08.005
Perkins, H. E. (2010). Measuring love and care for nature. J. Environ. Psychol. 30, 455–463. doi: 10.1016/j.jenvp.2010.05.004
Project for Public Spaces (2018). Placemaking: What If We Built Our Cities Around Places? Available online at: https://uploads-ssl.webflow.com/5810e16fbe876cec6bcbd86e/5b71f88ec6f4726edfe3857d_2018%20placemaking%20booklet.pdf (accessed October 8, 2020).
Rašković, S., and Decker, R. (2015). The influence of trees on the perception of urban squares. Urban For. Urban Green. 14, 237–245. doi: 10.1016/j.ufug.2015.02.003
Raymond, C. M., Brown, G., and Weber, D. (2010). The measurement of place attachment: personal, community, and environmental connections. J. Environ. Psychol. 30, 422–434. doi: 10.1016/j.jenvp.2010.08.002
Rosseel, Y. (2012). lavaan: an R package for structural equation modeling. J. Stat. Softw. 48, 1–36. doi: 10.18637/jss.v048.i02
Russell, J. A., and Pratt, G. (1980). A description of the affective quality attributed to environments. J. Pers. Soc. Psychol. 38, 311–322. doi: 10.1037/0022-3514.38.2.311
Smith, T. W. (2004). “Developing and evaluating cross-national survey instruments,” in Methods for Testing and Evaluating Survey Questionnaires, eds S. Presser, J. M. Rothgeb, M. P. Couper, J. T. Lessler, E. Martin, J. Martin, et al. (John Wiley and Sons, Inc), 431–452. doi: 10.1002/0471654728.ch21
Stamps, A. E. III (2010). Use of static and dynamic media to simulate environments: a meta-analysis. Percept. Mot. Skills 111, 355–364. doi: 10.2466/22.24.27.PMS.111.5.355-364
Stanley, B. W., Stark, B. L., Johnston, K. L., and Smith, M. E. (2012). Urban open spaces in historical perspective: a transdisciplinary typology and analysis. Urban Geogr. 33, 1089–1117. doi: 10.2747/0272-3638.33.8.1089
Strumse, E. (1994). Environmental attributes and the prediction of visual preferences for agrarian landscapes in Western Norway. J. Environ. Psychol. 14, 293–303. doi: 10.1016/S0272-4944(05)80220-8
Valera-Pertegas, S., and Guàrdia-Olmos, J. (2017). Vulnerability and perceived insecurity in the public spaces of Barcelona / Vulnerabilidad y percepción de inseguridad en el espacio público de la ciudad de Barcelona. Psyecology 8, 177–204. doi: 10.1080/21711976.2017.1304880
van Kamp, I., Leidelmeijer, K., Marsman, G., and de Hollander, A. (2003). Urban environmental quality and human well-being: towards a conceptual framework and demarcation of concepts; a literature study. Landsc. Urban Plann. 65, 5–18. doi: 10.1016/S0169-2046(02)00232-3
van Rijswijk, L., and Haans, A. (2018). Illuminating for safety: investigating the role of lighting appraisals on the perception of safety in the urban environment. Environ. Behav. 50, 889–912. doi: 10.1177/0013916517718888
Walton, T. N., and Jones, R. E. (2018). Ecological identity: the development and assessment of a measurement scale. Environ. Behav. 50, 657–689. doi: 10.1177/0013916517710310
Whittaker, T. A. (2016). “Structural equation modeling,” in Applied Multivariate Statistics for the Social Sciences, 6th Edn, eds K. A. Pituch and J. P. Stevens (Abingdon: Routledge), 639–733.
Yatmo, Y. A. (2009). Perception of street vendors as ‘out of place’ urban elements at day time and night time. J. Environ. Psychol. 29, 467–476. doi: 10.1016/j.jenvp.2009.08.001
Keywords: scale development, environmental perception, public place, public space, urban
Citation: Ho R and Au WT (2020) Scale Development for Environmental Perception of Public Space. Front. Psychol. 11:596790. doi: 10.3389/fpsyg.2020.596790
Received: 20 August 2020; Accepted: 26 October 2020;
Published: 23 November 2020.
Edited by:
Bernardo Hernández, University of La Laguna, SpainReviewed by:
Sergi Valera, University of Barcelona, SpainGabriela Gonçalves, University of Algarve, Portugal
Copyright © 2020 Ho and Au. This is an open-access article distributed under the terms of the Creative Commons Attribution License (CC BY). The use, distribution or reproduction in other forums is permitted, provided the original author(s) and the copyright owner(s) are credited and that the original publication in this journal is cited, in accordance with accepted academic practice. No use, distribution or reproduction is permitted which does not comply with these terms.
*Correspondence: Robbie Ho, cm9iYmllLmhvQGNwY2UtcG9seXUuZWR1Lmhr
 Robbie Ho1*
 Wing Tung Au