- School of Psychology, Jiangxi Normal University, Nanchang, China
This study was carried out to examine the factor structure and psychometric properties of the Social Interaction Anxiety Scale (SIAS) and Social Phobia Scale (SPS) in a sample of 1,001 Chinese college students (male: 34%; female: 66%). Confirmatory factor analysis (CFA) indicated that the two-factor shortened version of the SIAS-6/SPS-6 fit the data well. In addition, the item response theory (IRT) method confirmed the construct and items for the 12 items of the SIAS-6/SPS-6 with satisfactory discrimination, threshold parameters, and test information curve. It was concluded that the factor structure and psychometric properties of the SIAS-6/SPS-6 support their use for such assessment in a Chinese college sample.
Introduction
Individuals with social anxiety disorder (SAD) show significant and persistent concerns or fears in one or more social or performance situations (American Psychiatric Association [APA], 2013). Most individuals experience social anxiety at some point in their lives, but for those with SAD, these symptoms can have a detrimental impact on their lives (e.g., on their education, career, family relationships, and friendships) (Aderka et al., 2012). There are a variety of symptoms commonly associated with social anxiety (e.g., heart palpitations, blushing, trembling, and avoidance) (Blanco et al., 2001), and the situations during which these symptoms are experienced have often been subdivided into two broad categories (Mattick and Clarke, 1998; Blanco et al., 2001). One of these categories is social interaction (e.g., talking with others or participating at a social party). The other is social performance (e.g., eating, drinking or formal speaking in front of others). The Social Interaction Anxiety Scale (SIAS) and the Social Phobia Scale (SPS) (Mattick and Clarke, 1998) are companion measures that were developed as measures of social anxiety within each of these two broad situational categories and are among the most commonly used tools for assessing social anxiety and the outcome of psychosocial therapy. Since Mattick and Clarke (1998) published their paper in 1998, it has been cited over 2,764 times (Google Scholar, 2019), which means that the SIAS and SPS have had an enormous impact on the research and practice of social anxiety.
Many studies from different populations and countries have demonstrated the satisfactory reliability and validity of these scales. For instance, Mattick and Clarke (1998) were the first to show the coefficient of internal consistency (SIAS: 0.88–0.93; SPS: 0.89–0.94) and test-retest reliability (SIAS: r > 0.92; SPS: 0.91–0.93) across 4- and 12-week intervals. Excellent internal consistency (Cronbach’s α) of 0.87 and 0.90 of the Chinese versions of the SIAS and SPS, respectively, has also been reported (Ye et al., 2007).
Although the full scales (i.e., the 19-item SIAS and 20-item SPS) have a good psychometric characteristic, the issue regarding their factor structures has not been fully clarified. Previous studies have analyzed the SIAS and SPS simultaneously and separately and used a series of different sample types in different cultures to determine various factor structures for the SIAS/SPS (Fergus et al., 2012; Peters et al., 2012; Mörtberg et al., 2017; Wong et al., 2019). In addition, as the scales have a total of 39 items, they take approximately 15 to 20 min to administer. They are too long to ever be used in epidemiological research where there is pressure to reduce the respondent burden (Peters et al., 2012). Furthermore, over the last decade several short-version scales of the SIAS and SPS have been developed. Many studies have indicated that the short forms of the SIAS and SPS have similar psychometric properties as those of the full forms (Carleton et al., 2014; Fergus et al., 2014; Le Blanc et al., 2014; Erceg-Hurn and McEvoy, 2018; Sunderland et al., 2019). These findings suggest that either of the short-version scales can be used instead of the full scales to efficiently measure social anxiety.
The purpose of this study is to explore the factor structure of the SIAS and SPS in a Chinese college sample. Some factor models discussed earlier were tested and compared in the context of Chinese culture. According to previous studies (Carleton et al., 2014; Le Blanc et al., 2014; Gomez, 2016; Mörtberg et al., 2017; Erceg-Hurn and McEvoy, 2018; Sunderland et al., 2019; Wong et al., 2019), we expected the SIAS-6/SPS-6 to fit the data best. Ye et al. (2007) employed paper-and-pencil full forms to administer the scales, and the Chinese version had better internal consistency and convergent validity. Most self-reported psychometrics were based on classical test theory (CTT) with internal consistency and construct validity. However, CTT approaches do not provide direct clues for accurate social anxiety symptoms at different points in the range of anxiety severity. Given that the SIAS and SPS are valuable measures for social anxiety, a more thorough analysis of their psychometric properties with the item response theory (IRT) method is warranted. Compared with CTT, IRT can provide more complex information about the psychometric properties of the individual assessment items. As the basis of modern psychometric techniques, IRT approaches can offer estimations of individual latent traits and item characteristics (Pang et al., 2019).
The rest of this article is arranged as follows. First, it will introduce the characteristics of participants and the scales used, as well as a brief review of the scale factor most widely used in previous studies. Second, this study will confirm the best factor model of the SIAS and SPS for Chinese college students. Then, the study will analyze the psychometric characteristics of the scales through the IRT method. Finally, some conclusions and limitations for future work will be provided.
Materials and Methods
Participants
The college sample included 1,001 Chinese men (34%) and women (66%), who were citizens of China and voluntarily recruited from universities in Jiangxi Province. In this study, individuals were recruited from universities or the Internet through advertisements, and college participants completed the questionnaire survey online or used the paper questionnaire with a small gift. The final proportion of online and paper questionnaires was 1:4, respectively. The participants were approximately 17 to 23 years old (Mean = 19, SD = 1.28). The majority of the participants came from the fields of science (69%), and the others came from the fields of liberal arts (31%). The sample consisted of four grades: 43.5% were freshmen, 34.6% were sophomores, 20.7% were juniors, and 1.2% were seniors. There are 397 (39.7%) participants from urban areas and 604 (60.3%) from rural areas. All procedures carried out in studies involving human participants met the institutional ethical standards. All individual participants provided informed consent.
Measures
Social Interaction Anxiety Scale (SIAS) and Social Phobia Scale (SPS)
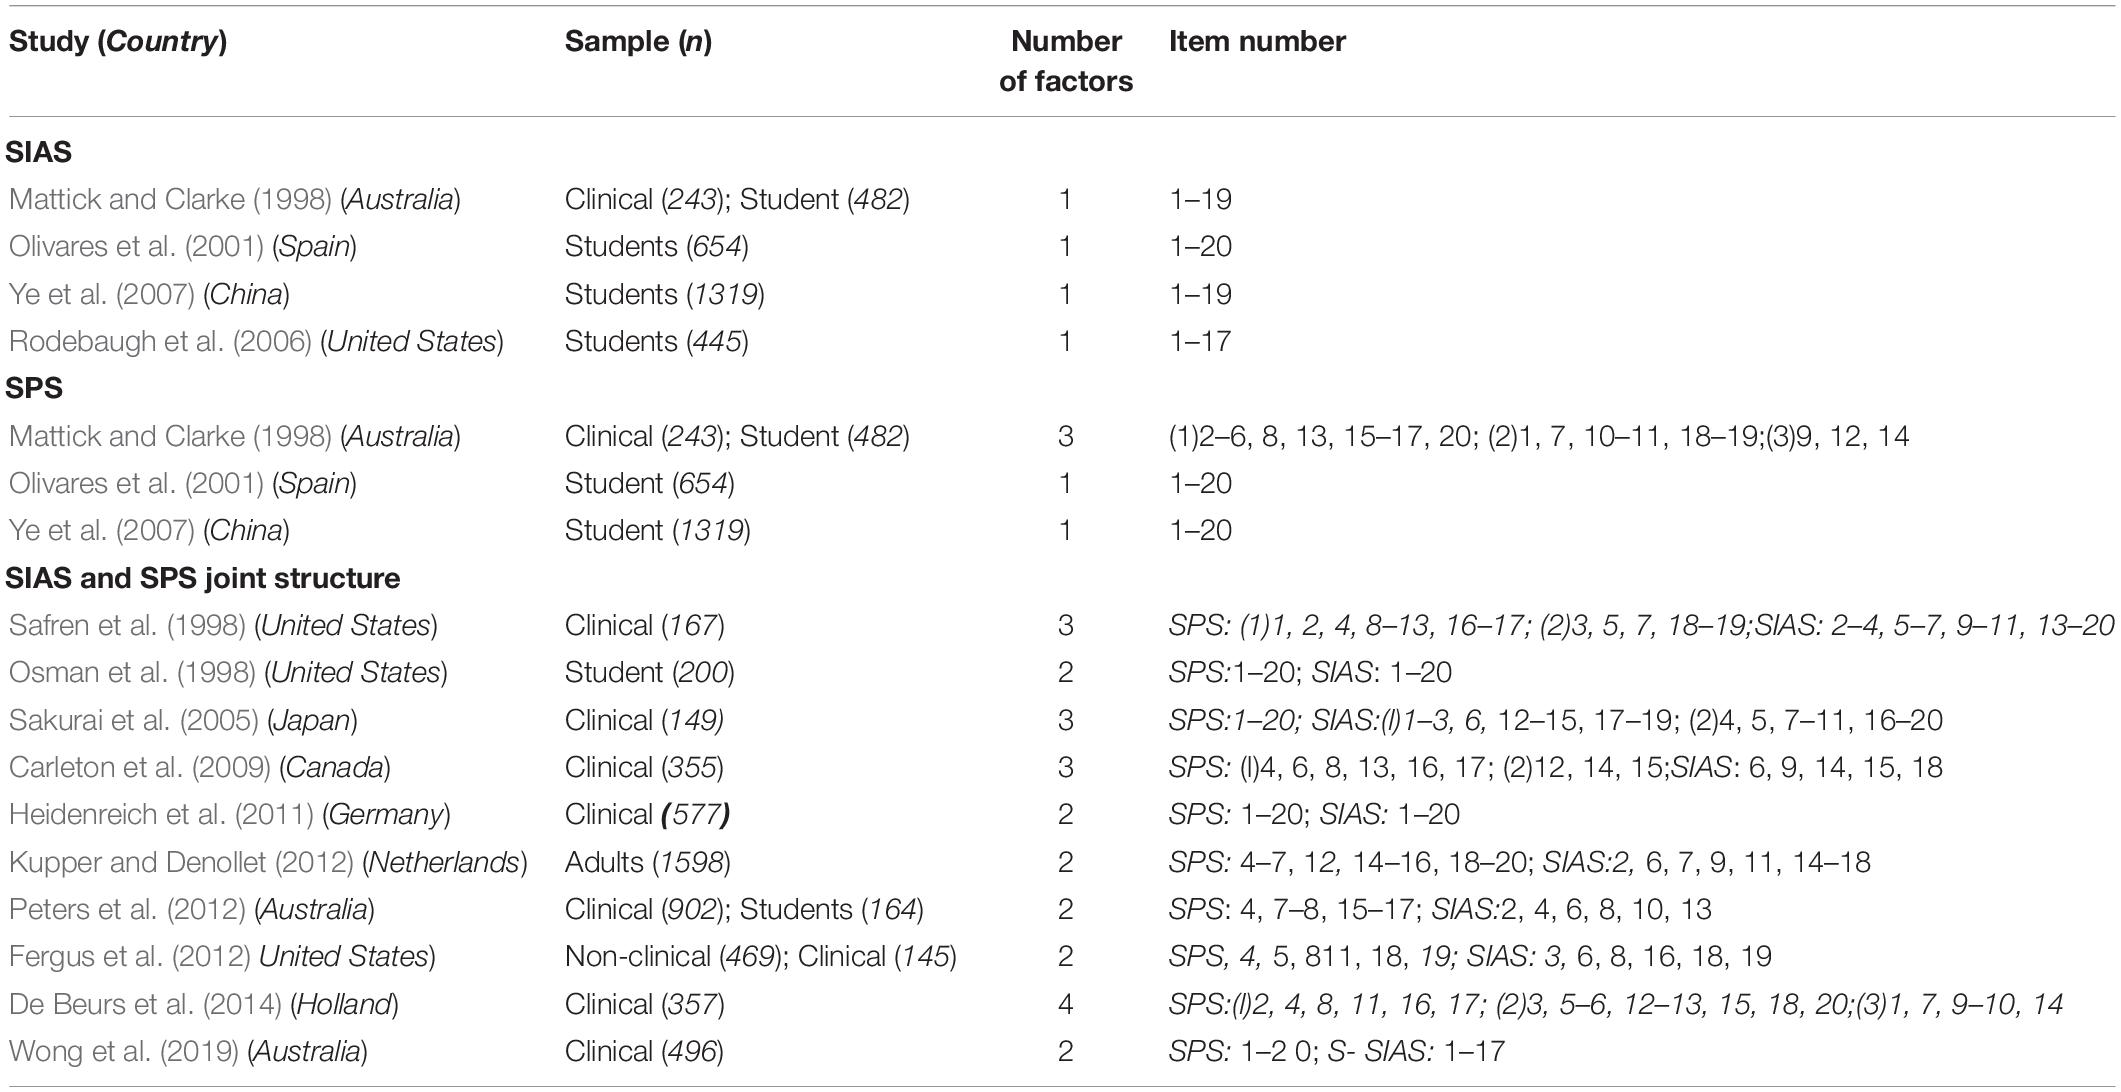
Social Interaction Anxiety Scale (SIAS) and Social Phobia Scale (SPS) (Mattick and Clarke, 1998). In this study, all the factor structures share the same initial pool from the full-length SIAS and SPS (see Table 1). The SIAS and SPS are companion scales that were designed to measure two related situations of social anxiety and fears. The SIAS is a self-report scale in which each item is rated on a 5-point Likert scale, with values ranging from 0 to 4 (i.e., ranging from “Not at all characteristic or true of me” to “Extremely characteristic or true of me”). In the current study, we used the 19-item SIAS (Mattick and Clarke, 1998), which removes Item 5 “I find it easy to make friends of my own age” from the original 20-item scale unpublished measure developed by Mattick and Clarke in 1989. Similarly, the SPS is also a 20-item self-report scale using the same 5-point scores. The Chinese versions were developed by Ye et al. (2007). The internal consistency, split half reliability and retest reliability of the SIAS (SPS) were 0.874, 0.862, and 0.863 (0.904, 0.865, and 0.849), respectively (Ye et al., 2007). There were no inconsistencies between the translations.
Interaction Anxiousness Scale (IAS)
Interaction Anxiousness Scale (IAS) (Leary, 1983). The IAS contains 15 items with self-statements focusing on subjective feelings of anxiety related to social interactions, and Items 3, 6, 10 and 15 are scored in reverse. Items are rated on a 5-point Likert scale, ranging from 1 (completely uncharacteristic) to 5 (extremely characteristic). Total scores were calculated by adding the responses of each item, where higher scores represent higher levels of social anxiety (Cao et al., 2016). The Chinese version of the IAS has excellent psychometric properties in Chinese colleges (Peng et al., 2004; Cao et al., 2016). Calibration was based on individuals’ scores on the IAS.
Analyses
Factor Structure
CFA was first conducted to assess the fit of the previously demonstrated factor structures and to guide the subsequent analyses. For comparison purposes only, the fit indices for all factor structures of the full scales have been included (Carleton et al., 2014; Wang et al., 2019). To validate the scale’s structure in Chinese college students, CFA with Mplus 7.0 was used to test the previously reported factor structures in different cultures (see Table 1): (a) single factor structures of the SIAS (e.g., Mattick and Clarke, 1998; Olivares et al., 2001; Rodebaugh et al., 2006; Ye et al., 2007) and SPS (Olivares et al., 2001; Ye et al., 2007), (b) three-factor model of the SPS (Mattick and Clarke, 1998), (c) two-factor joint model of the SIAS and SPS (Osman et al., 1998; Carleton et al., 2009; Heidenreich et al., 2011; Fergus et al., 2012; Kupper and Denollet, 2012; Peters et al., 2012; Wong et al., 2019), (d) three-factor joint model of the SIAS and SPS (Safren et al., 1998; Sakurai et al., 2005; Carleton et al., 2009), and (e) four-factor joint model of the SIAS and SPS (De Beurs et al., 2014).
The chi-square, the chi-square/degrees of freedom ratio, root mean square error of approximation (RMSEA), comparative fit index (CFI), Tucker-Lewis index (TLI), and standardized root mean square residual (SRMR) were used to evaluate model fit. For the RMSEA and SRMR, the recommended cutoff values for these indices are close to or lower than 0.06, while for CFI and TLI, these indices are close to or higher than 0.95 (Hu and Bentler, 1999; Brown, 2015; Mörtberg et al., 2017).
Reliability and Criterion Validity
The current study investigates both the internal consistency with Cronbach’s α and McDonald’s coefficient omega (ω; McDonald, 1999) along with CIs for the total of all subscales and each subscale (Dunn et al., 2013). Cronbach’s α and McDonald’s omega are probably the most widely used measures of composite reliability. The reliability was interpreted as follows: <0.6 = insufficient, 0.6 to 0.69 = marginal, 0.7 to 0.79 = acceptable, 0.80 to 0.89 = good, and 0.9 or higher = excellent (Barker et al., 1994). In addition, this study also investigates the criterion validity of the scales by using the IAS as the criterion scale.
IRT Analyses
CFA was used to obtain the most suitable factor structure to accomplish the following IRT analyses. Here, the graded response model (GRM; Samejima, 1969) was employed to carry out the IRT analysis by using R software (Version 3.6.1) and the R package mirt (Version 1.30; Clalmers, 2012), including three phases.
First, the GRM was applied to evaluate the SIAS/SPS at the item level. The discrimination parameter and threshold parameters were estimated for each item. The discrimination parameter represents the slope of the item characteristic curve (ICC), and is measured at the steepest point. It also refers to how well an item differentiates among levels of the trait below and above the thresholds for that item. Baker (2001) suggested that values below 0.65 belong to low discrimination, values between 0.65 and 1.34 are moderate, and values above 1.34 are high. This study followed these guidelines.
Second, the discrimination parameter and threshold parameters are used to develop an ICC for each item. The ICCs showed that at the same level, the probability of the trait or ability of different participants obtaining the category score is different, and for a certain trait or ability, the probability of different categories is also different. An ICC can be transformed into an item information curve, indicating the amount of item psychometric information contained at all points along θ (Olino et al., 2012).
Third, based on the information concept of IRT, the function of information as the latent variable is called the item information function (IIF, Ii(θ)). The sum of the individual item information functions equals the test information function (TIF, I(θ)) of the scale (i.e., , m is the test length) (Iwata et al., 2016). The standard error of the measurement (SE) is an inverse function of this TIF (i.e., ). Greater information reflects greater measurement precision or reliability. It can convert the SE into the reliability coefficient for different degrees of latent severity in classic psychometric evaluation (i.e., reliability(θ) = 1−SE(θ)2; Thissen and Wainer, 2001).
Results
Factor Structure
The fit indices for different structures via CFA in the Chinese college samples are reported in Table 2. From the results, we can see that the 12-item two-factor model of the SIAS-6/SPS-6 (Peters et al., 2012) had the best fit indices (χ2/df = 3.05, RMSEA = 0.045, CFI = 0.972, TLI = 0.966, SRMR = 0.030) in the Chinese college sample. More concretely, except for the 12-item two-factor model of the SIAS-6/SPS-6 (Peters et al., 2012), the values of CFI and TLI of other models did not reach 0.95. In particular, the table shows the fit indices for the CFA of the short forms of Peter et al.’s one-factor and two-factor models. Between these models, the two-factor model of the SIAS-6/SPS-6 showed better fit, and was deemed the optimum model.
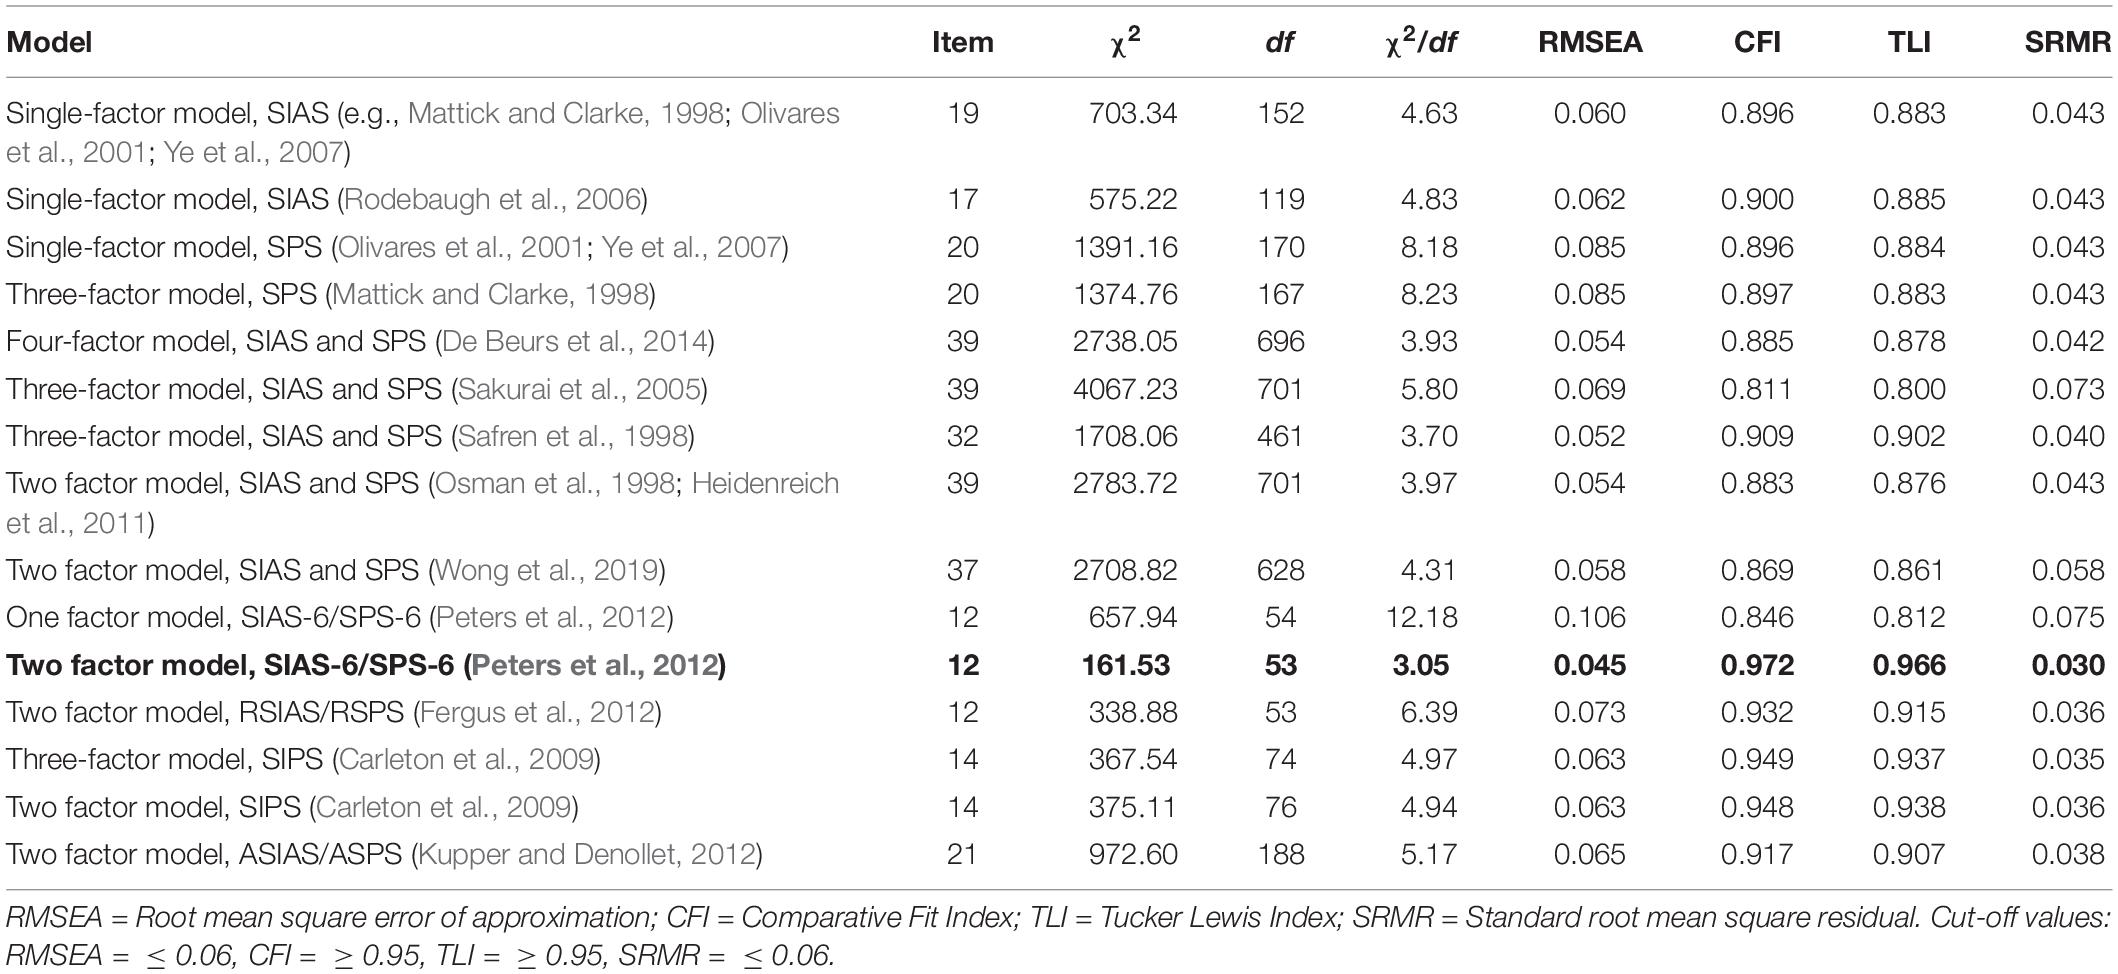
Table 2. Confirmatory factor analyses of factors structures of the social phobia scale and the social interaction anxiety scale.
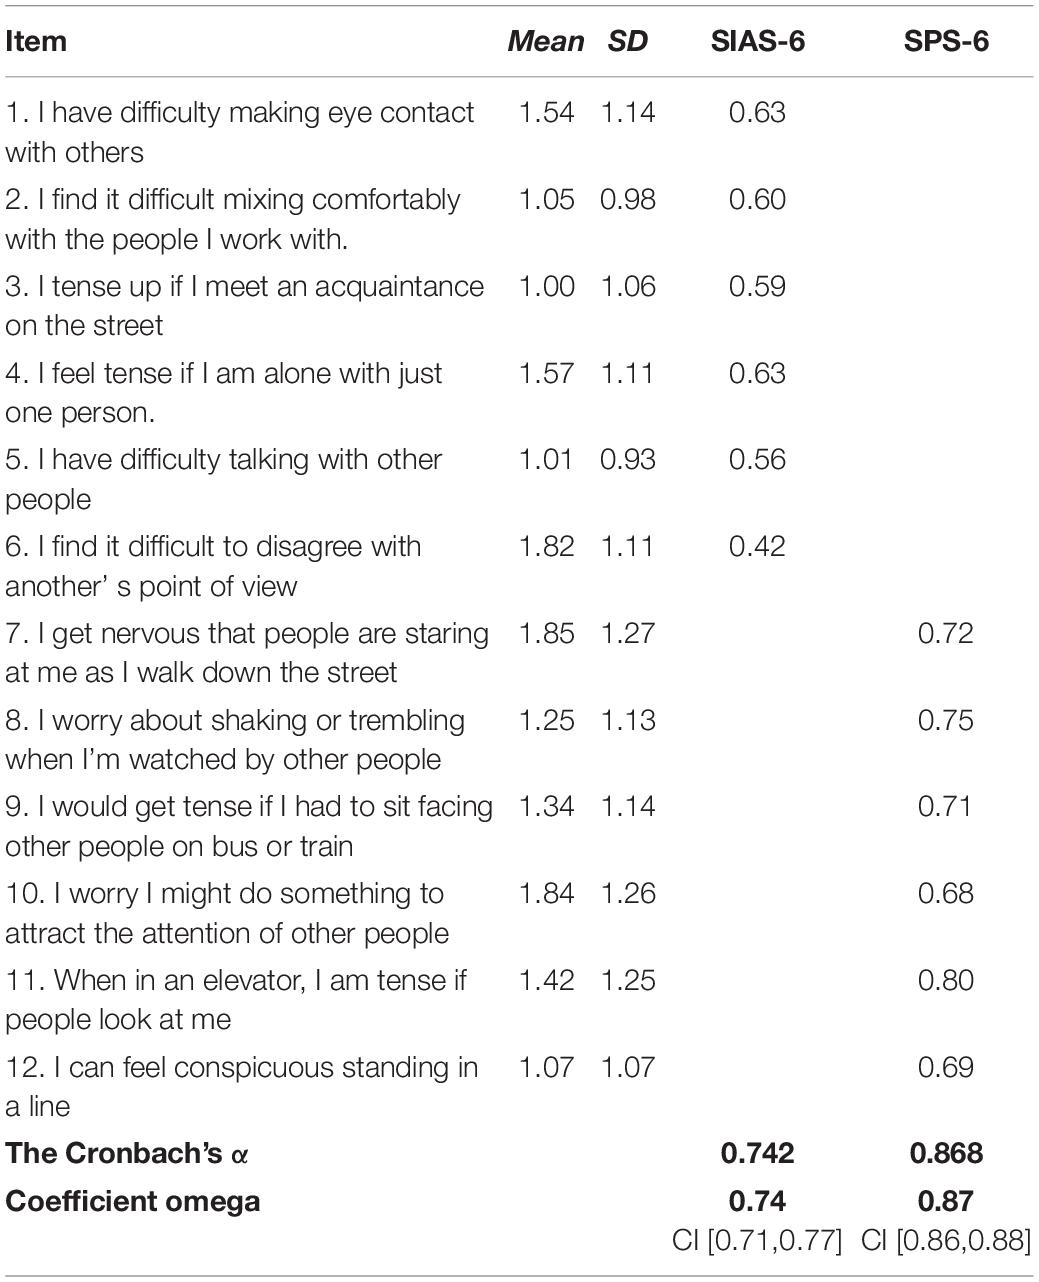
Based on the results from the Table 2, we further studied the 12-item two-factor model of the SIAS-6/SPS-6 (Peters et al., 2012). The factor loadings of the 12 items are shown in Table 3, and all factor loadings are more than 0.40 (p < 0.001) in their corresponding factor. Therefore, the two-factor structure of the SIAS-6/SPS-6 not only has the fewest items but also has the best fit with the Chinese college sample.
Reliability and Criterion Validity
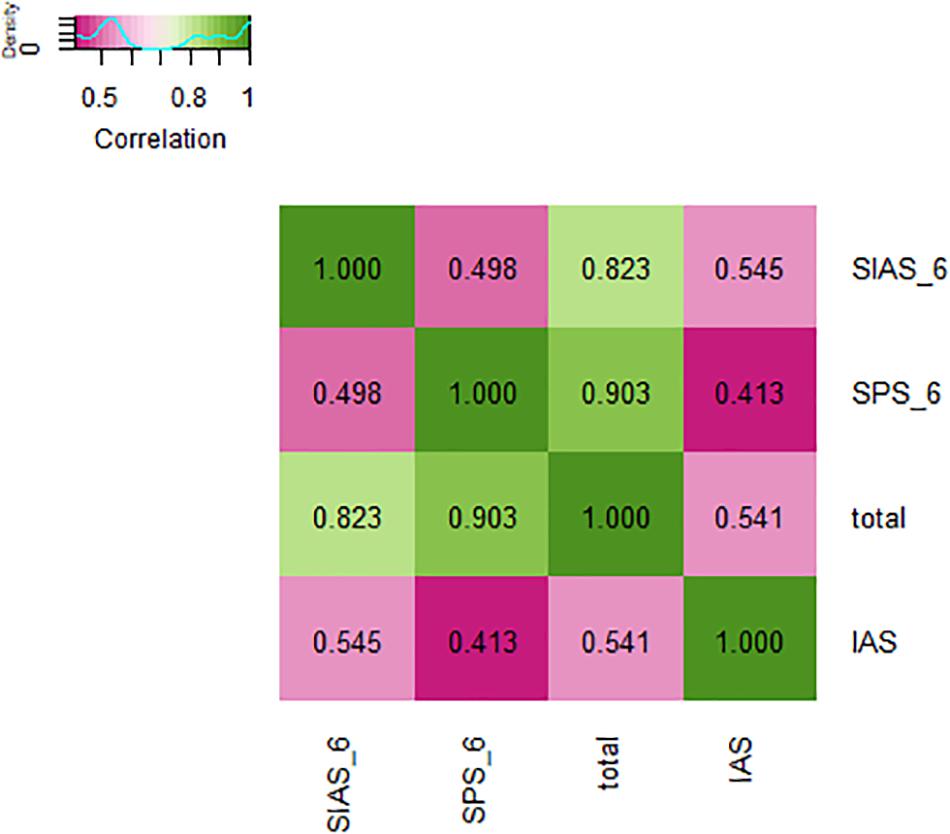
From Table 3, the results show that the Cronbach’s α coefficients of the SIAS-6 and SPS-6 are acceptable. The coefficient omega of the SIAS-6 and SPS-6 shows that omega performs at least as well as alpha. Regarding criterion validity, the SIAS-6/SPS-6 score was positively related to the IAS score (r = 0.541, p < 0.01), and every subscale of the SIAS-6/SPS-6 was also positively related to the IAS score (r = 0.545, p < 0.01; r = 0.431, p < 0.01). From Figure 1, the results show that the SIAS-6/SPS-6 has reasonable criterion validity.
IRT Analyses
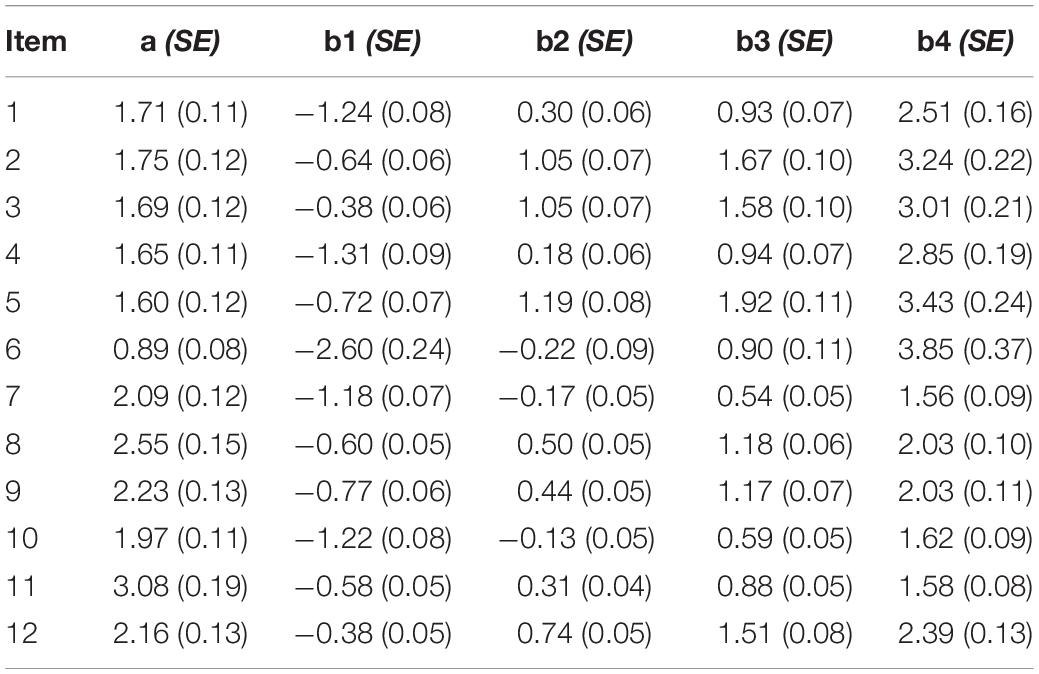
Table 4 shows the parameterization of the 12-item scale based on the GRM. It should be noted that item discrimination in the GRM depends on the ai and the distances among bik parameters, so item discrimination can be considered generally adequate.
The item discrimination parameters range from 0.89 to 3.08, and the average value is 1.948 (see Table 4). However, a higher discrimination parameter does not mean that it is a “better” item; both the discrimination parameters and category threshold parameters need to be considered (Rauch et al., 2008). Item location index bik represents the level of the latent trait when an individual has a 0.50 chance of picking an option in a given direction (such as a selection that matches a trait). The bik parameters of the 12 items ranged from −2.60 to 3.85, showing that they have a wider range coverage of trait values and can be suitable for different levels of anxiety; the location parameters of all the items in this scale are incrementally positive. At the same time, there was no increase or decrease confounding phenomenon, which is consistent with the characteristics of graded response model.
IRT Characteristic of the SIAS-6/SPS-6 Items
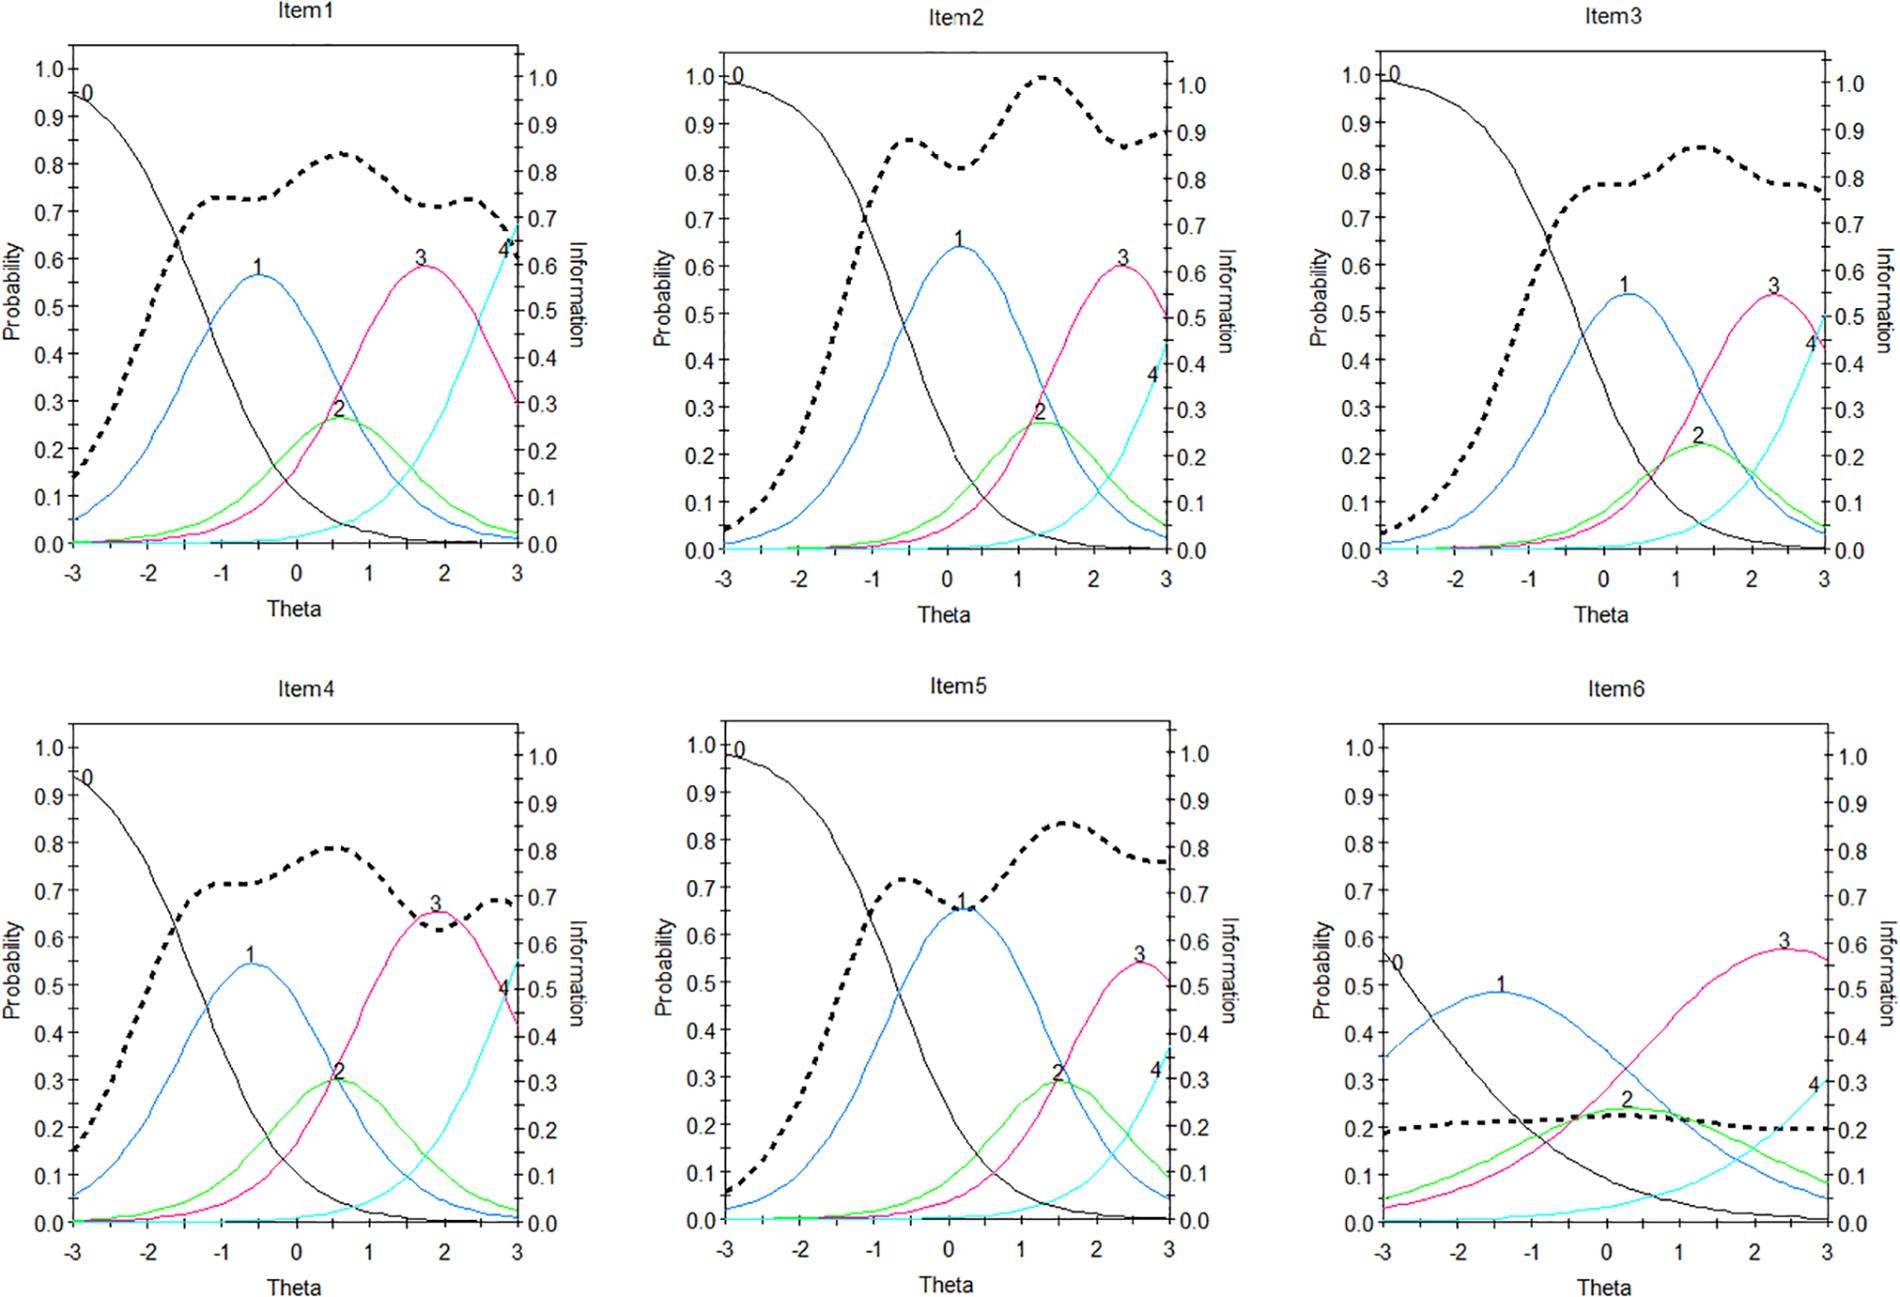
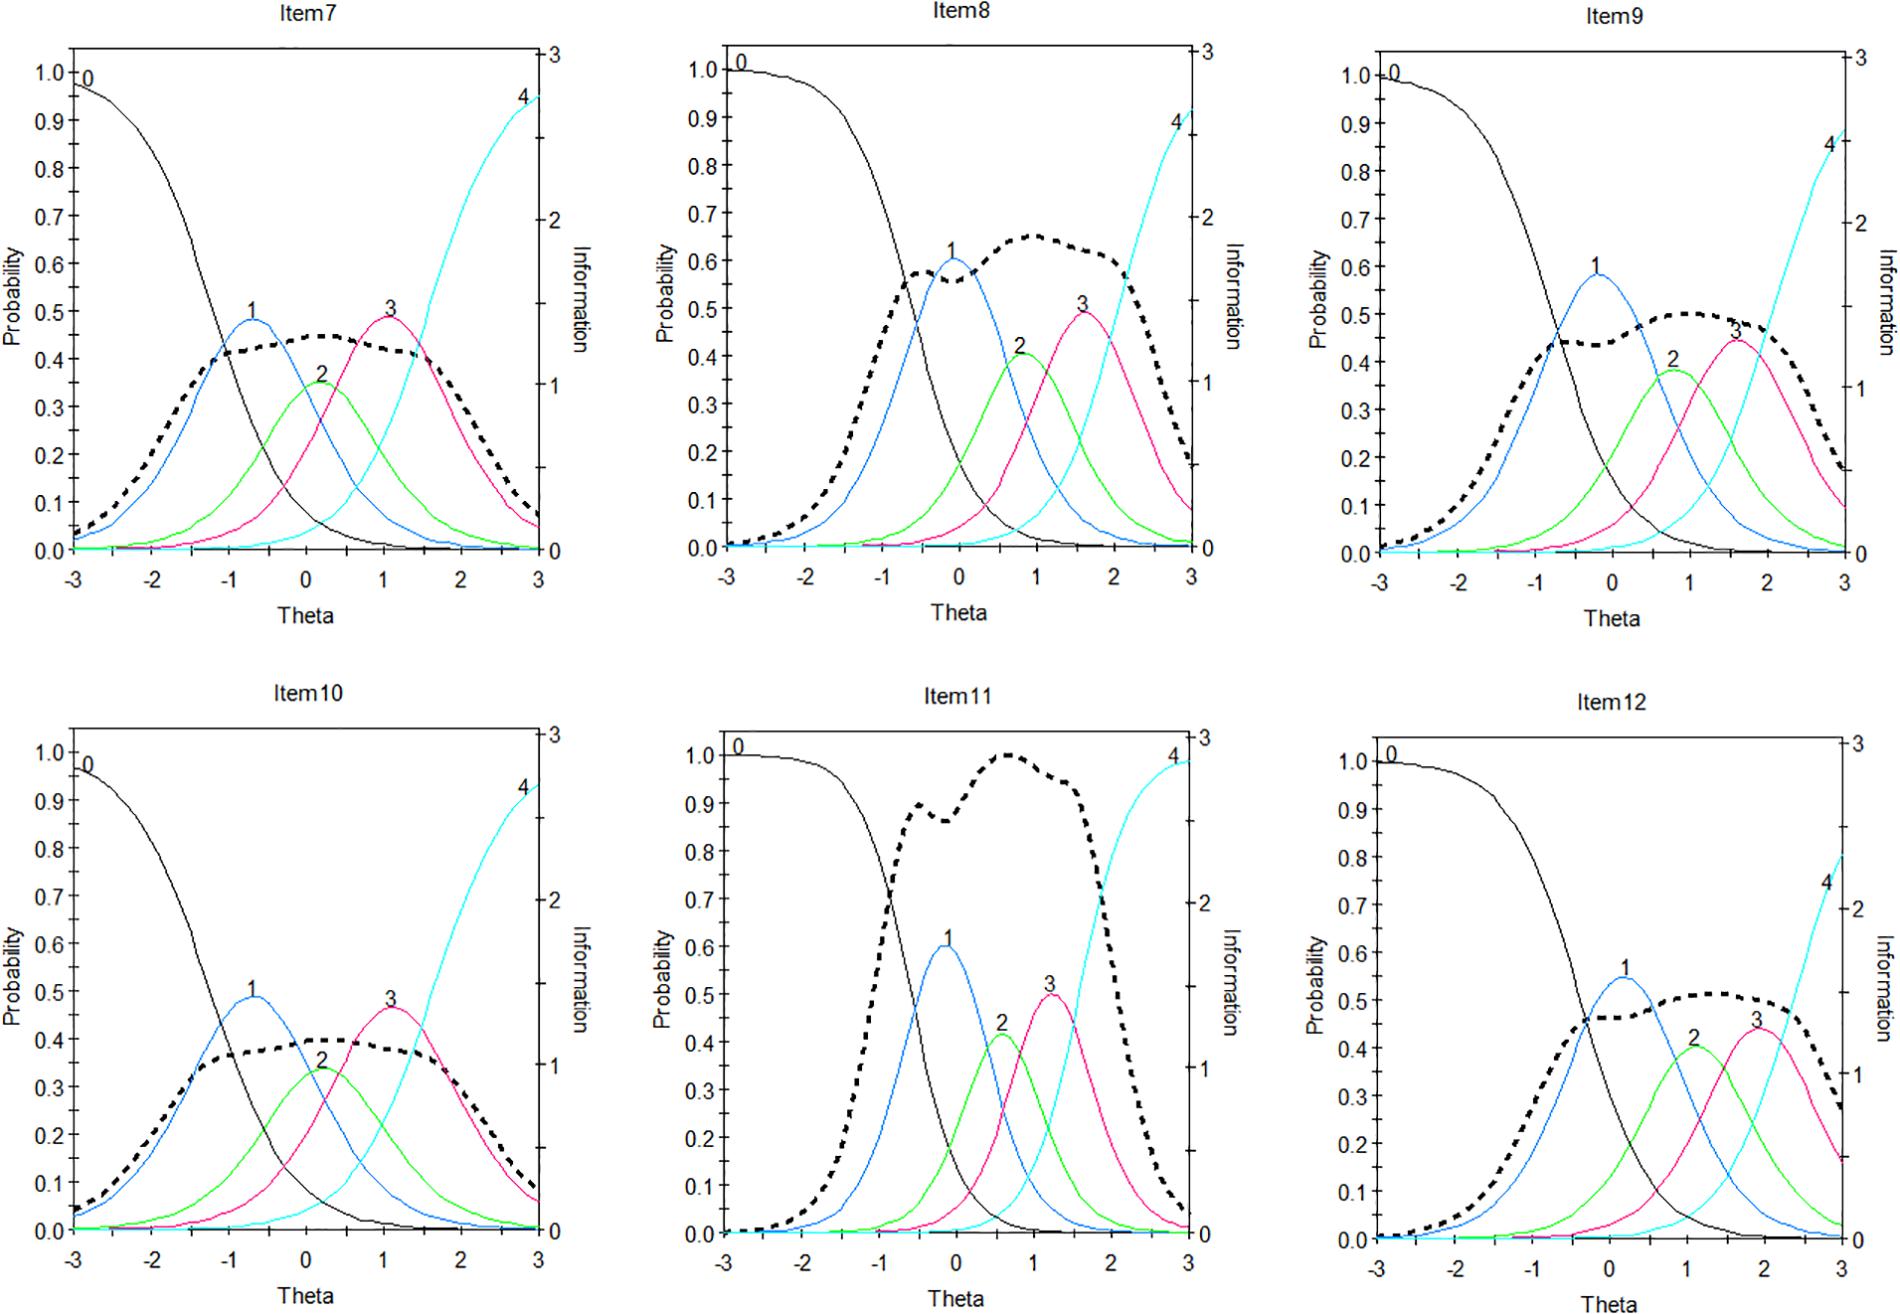
To further analyze the characteristics of the items, we draw each item’s characteristic curve and item information curve in Figures 2, 3 (e.g., Item 1…12), respectively. For example, Figure 1 shows that the item has five response categories, ranging from 0 (completely uncharacteristic) to 4 (extremely characteristic) (Mattick and Clarke, 1998). The left-most curve indicates the probability that the individual will select 0 at different trait levels, and this is a monotonic curve, which shows that the lower the trait level is, the greater the probability of choosing 0. The curve on the far right is also a monotonic curve, but it represents the probability of choosing 4 for individuals with different traits. The higher the trait level is, the greater the probability of choosing 4. The curve of each intermediate option presents a single peak shape, which indicates that the probability of selecting the option is the greatest for individuals with only a certain level of the trait.
In the figures, the black dotted line indicates the item information curve. Highly discriminating items have “peaked” information curves because they provide a large amount of information in a narrow range of trait values, whereas low discriminating items have flatter and more spread out information, and as such, they can only provide a small amount of information (Iwata et al., 2016).
Based on the item discrimination parameters, we select 3 items (e.g., Item 2, 6, and 11) as examples for analysis. The discrimination of Item 6 is at the lowest level, that of Item 2 is at the medium level, and that of Item 11 is at the highest level. For Items 2 and 6, the probability of obtaining 2 or 4 points is smaller than that of obtaining other scores. The item information curve of Item 6 is also very low, and there is little information available from this item. This indicates that Item 6 is not good and needs further modifications. The probability of the corresponding score of the participants with different trait levels on Item 11 basically exceeds 0.4, and this item performs well at relatively higher levels of the latent trait, which may involve much information for a whole. This means that the item is good.
Test Information and Standard Error of Measurement
The test information functions and associated standard errors of measurement for the SIAS-6/SPS-6 are displayed in Figure 4. As seen from the left of Figure 4, information was distributed near the average value of the latent trait, with the peak information value at θ = 1.1 (information value = 4.35, SE = 0.48). The highest measurement accuracy was from θ = −1 to θ = 3, where the information values were greater than 0.36, the standard errors were less than 0.524, and their corresponding reliabilities were greater than 0.7. In the right of Figure 4, similar to the SIAS-6, information for the SPS-6 was distributed around the mean of the latent trait, with the peak information value at θ = 0.8 (information value = 10.61, SE = 0.31). The range of the highest measurement precision was from θ = −1 to θ = 2, where the information values were greater than 7.1, the standard errors were less than 0.37, and their corresponding reliabilities were greater than 0.86. These results indicated that the SIAS-6/SPS-6 can provide a great deal of information for most participants and that the quality of the scale is satisfied.
Discussion
In previous studies, researchers and clinicians used the SIAS and SPS to assess, screen and evaluate treatment outcomes in studying SAD (Clark et al., 2006; Mörtberg et al., 2011, 2017), nevertheless, the culturally validated scale is significant. In this study, the psychometric characteristics of the SIAS/SPS were studied in a Chinese college sample, with the main aim of exploring the factor structure of the scales in the Chinese context.
The factor models suggested in the article with different cultures were tested and compared, and the results showed that the two-factor model of the short form of the SIAS-6/SPS-6 demonstrated acceptable fit. Consistent with most previous studies (Le Blanc et al., 2014; Erceg-Hurn and McEvoy, 2018; Sunderland et al., 2019; Wong et al., 2019), the SIAS-6/SPS-6 was the most widely used short form in the future and exhibited similar psychometric properties as those of the full forms. This means that the two-factor model is robust and has cross-cultural significance. The correlation of the shortened forms with related constructs, such as IAS, shows that the convergent validity of the shortened forms is good.
The IRT analyses revealed encouraging item properties of the SIAS-6/SPS-6. The slope parameters of each item for the SIAS-6/SPS-6 were above 0.89, indicating that each item contributed fully to the test information. The research results of the SIAS-6/SPS-6 on the latent structure of social anxiety indicated that the current Chinese sample shared similar manifest behavior with that of the previous Western research samples. In addition, based on the information provided by the ICC of each item, we identified all the items that performed well in the IRT analyses, but only one to two items could be improved by modification. If an item was either too narrow or too wide, then some options for specific items were combined. For example, in Item 6, options 2 and 3 could be combined into one, or options 1 and 2 could be combined into one, due to the narrow step between thresholds 2 and 3.
However, the current study has some limitations that should be acknowledged. The first is sample characteristics (such as non-clinical samples and clinical samples) which may lead to inconsistency. The findings of the current study were obtained from Chinese college students, and whether they can be generalized to clinical samples or other non-clinical samples (e.g., community adults and senior high school students) requires further validation. The second limitation is about the potency of the interventions for treating SAD. This study did not treat participants so we cannot report on the responsiveness of the short form of the SIAS-6/SPS-6 in a clinical setting. It has been previously shown that the full scale of the SIAS and SPS has good sensitivity to treatment (Acarturk et al., 2009). Whether the short form of the SIAS-6/SPS-6 is as sensitive at detecting changes in social anxiety during treatment as the full scale should be the subject of further study.
Conclusion
In conclusion, the current study shows that adequate construct validity and excellent psychometric properties support the use of the shortened version of the SIAS-6/SPS-6 in the Chinese contest. Social anxiety is validly captured by the short versions of the SIAS-6/SPS-6, reducing the questionnaire burden for individuals in epidemiological and treatment outcome research.
Data Availability Statement
The raw data supporting the conclusions of this article will be made available by the authors, without undue reservation.
Ethics Statement
The studies involving human participants were reviewed and approved by the Moral & Ethics Committee of School of Psychology, Jiangxi Normal University. The patients/participants provided their written informed consent to participate in this study.
Author Contributions
DT and YC selected the topic and made some modifications of the manuscript. XO collected the data and wrote the manuscript. All authors contributed to the article and approved the submitted version.
Funding
This work was supported by the National Natural Science Foundation of China (31960186, 31760288, and 31660278).
Conflict of Interest
The authors declare that the research was conducted in the absence of any commercial or financial relationships that could be construed as a potential conflict of interest.
Acknowledgments
The authors thank Jiangxi Normal University for valuable time support when conducting this study.
References
Acarturk, C., Cuijpers, P., van Straten, A., and de Graaf, R. (2009). Psychological treatment of social anxiety disorder: a meta-analysis. Psychol. Med. 39, 241–254. doi: 10.1017/s0033291708003590
Aderka, I. M., Hofmann, S. G., Nickerson, A., Hermesh, H., Gilboa-Schectman, E., and Marom, S. (2012). Functional impairment in social anxiety disorder. J. Anxiety Disord. 26, 393–400. doi: 10.1016/j.janxdis.2012.01.003
American Psychiatric Association [APA] (2013). Diagnostic and Statistical Manual of Mental Disorders, 5th Edn. Washington, DC: American Psychiatric Association.
Baker, F. B. (2001). The Basics of Item Response Theory, 2nd Edn. College Park, MD: ERIC Clearinghouse on Assessment and Evaluation.
Barker, C., Pistran, N., and Elliot, R. (1994). Research Methods in Clinical and Counselling Psychology. Chichester: John Wiley.
Blanco, C., Nissenson, K., and Liebowitz, M. R. (2001). Social anxiety disorder: recent findings in the areas of epidemiology, etiology, and treatment. Curr. Psychiatry Rep. 3, 273–280. doi: 10.1007/s11920-001-0019-9
Brown, T. A. (2015). Confirmatory Factor Analysis for Applied Research, 2nd Edn. New York, NY: The Guilford Press.
Cao, J., Yang, J., Zhou, Y., Chu, F., Zhao, X., Wang, W., et al. (2016). The effect of Interaction Anxiousness Scale and Brief Social Phobia Scale for screening social anxiety disorder in college student: a study on discriminative validity. J. Ment. Health 25, 500–505. doi: 10.3109/09638237.2015.1124391
Carleton, N. R., Thibodeau, M. A., Weeks, J. W., Teale-Sapach, M. J. N., McEvoy, P. M., Horswill, S. C., et al. (2014). Comparing short forms of the Social Interaction Anxiety Scale and the Social Phobia Scale. Psychol. Assess. 26, 1116–1126. doi: 10.1037/a0037063
Carleton, R. N., Collimore, K. C., Asmundson, G. J. G., McCabe, R. E., Rowa, K., and Antony, M. M. (2009). Refining and validating the Social Interaction Anxiety Scale and the Social Phobia Scale. Depress. Anxiety 26, E71–E81. doi: 10.1002/da.v26:2
Clalmers, R. P. (2012). mirt: a multidimensional item response theory package for the R environment. J. Stat. Softw. 48, 1–29. doi: 10.18637/jss.v048.i06
Clark, D. M., Ehlers, A., Hackmann, A., McManus, F., Fennell, M., Grey, N., et al. (2006). Cognitive therapy versus exposure and applied relaxation in social phobia: a randomized controlled trial. J. Consult. Clin. Psychol. 74, 568–578. doi: 10.1037/0022-006X.74.3.568
De Beurs, E., Tielen, D., and Wollmann, L. (2014). The Dutch social interaction anxiety scale and the social phobia scale: reliability, validity, and clinical utility. Psychiatry J. 10:360193. doi: 10.1155/2014/360193
Dunn, T. J., Baguley, T., and Brunsden, V. (2013). From alpha to omega: a practical solution to the pervasive problem of internal consistency estimation. Br. J. Psychol. 105, 399–412. doi: 10.1111/bjop.12046
Erceg-Hurn, D. M., and McEvoy, P. M. (2018). Bigger is better: full-length versions of the social interaction anxiety scale and social phobia scale outperform short forms at assessing treatment outcome. Psychol. Assess. 30, 1512–1526. doi: 10.1037/pas0000601
Fergus, T. A., Valentiner, D. P., Kim, H. S., and McGrath, P. B. (2014). The social interaction anxiety scale (SIAS) and the social phobia scale (SPS): a comparison of two short form versions. Psychol. Assess. 26, 1281–1291. doi: 10.1037/a0037313
Fergus, T. A., Valentiner, D. P., McGrath, P. B., Gier-Lonsway, S. L., and Kim, H. S. (2012). Short forms of the social interaction anxiety scale and the social phobia scale. J. Pers. Assess. 94, 310–320. doi: 10.1080/00223891.2012.660291
Gomez, R. (2016). Factor structure of the social interaction anxiety scale and the social phobia scale short forms. Pers. Individ. Dif. 96, 83–87. doi: 10.1016/j.paid.2016.02.086
Google Scholar (2019). Mattick: Development and Validation of Measures of Social Phobia Scrutiny and Social Interaction Anxiety. Available online at: https://scholar.google.com.au/scholar?cites?5567530842631190421
Heidenreich, T., Schermelleh-Engel, K., Schramm, E., Hofmann, S., and Stangier, U. (2011). The factor structure of the social interaction anxiety scale and the social phobia scale. J. Anxiety Disord. 25, 579–583. doi: 10.1016/j.janxdix.2011.01006
Hu, L., and Bentler, P. M. (1999). Cutoff criteria for fit indexes in covariance structure analysis: conventional criteria versus new alternatives. Struct. Equ. Model. 6, 1–55. doi: 10.1080/10705519909540118
Iwata, N., Tsutsumi, A., Wakita, T., Kumagai, R., Noguchi, H., and Watanabe, N. (2016). The effect of alternative scoring procedures on the measurement properties of a self-administered depression scale: an IRT investigation on the CES-D scale. Eur. J. Psychol. Assess. 35, 55–62. doi: 10.1027/1015-5759/a000371
Kupper, N., and Denollet, J. (2012). Social anxiety in the general population: introducing abbreviated versions of SIAS and SPS. J. Affect. Disord. 136, 90–98. doi: 10.1016/j.jad.2011.08.014
Le Blanc, A. L., Bruce, L. C., Heimberg, R. G., Hope, D. A., Blanco, C., Schneier, F. R., et al. (2014). Evaluation of the psychometric properties of two short forms of the social interaction anxiety and the social phobia scale. Assessment 21, 312–323. doi: 10.1177/1073191114521279
Leary, M. R. (1983). Social anxiousness: the construct and its measurement. J. Pers. Assess. 47, 66–75. doi: 10.1207/s15327752jpa4701_8
Mattick, R. P., and Clarke, J. C. (1998). Development and validation of measures of social phobia scrutiny fear and social interaction anxiety. Behav. Res. Ther. 36, 455–470. doi: 10.1016/S0005-7967(97)10031-6
Mörtberg, E., Clark, D. M., and Bejerot, S. (2011). Intensive group cognitive therapy and individual cognitive therapy for social phobia: sustained improvement at 5-year follow-up. J. Anxiety Disord. 25, 994–1000. doi: 10.1016/j.janxdis.2011.06.007
Mörtberg, M., Reuterskiöld, L., Tillfors, M., Furmark, T., and Öst, L. G. (2017). Factor solution of the social phobia scale (SPS) and the social interaction anxiety scale (SIAS) in a Swedish population. Cogn. Behav. Ther. 46, 300–314. doi: 10.1080/16506073.2016.1258723
Olino, T. M., Yu, L., Klein, D. N., Rohde, P., Seeley, J. R., and Pilkonis, P. A. (2012). Measuring depression using item response theory: an examination of three measures of depressive symptomatology. Int. J. Methods Psychiatr. Res. 21, 76–85. doi: 10.1002/mpr.1348
Olivares, J., García-López, L. J., and Hidalgo, M. D. (2001). The social phobia scale and the social interaction anxiety scale: factor structure and reliability in a spanish-speaking population. J. Psychoeduc. Assess. 19, 69–80. doi: 10.1177/073428290101900105
Osman, A., Gutierrez, P. M., Barrios, F. X., Kopper, B. A., and Chiros, C. E. (1998). The social phobia and social interaction anxiety scales: evaluation of psychometric properties. J. Psychophatol. Behav. Assess. 20, 249–264. doi: 10.1023/A:1023067302227
Pang, Z., Tu, D., and Cai, Y. (2019). Psychometric properties of the SAS, BAI, and S-AI in Chinese college students. Front. Psychol. 10:93. doi: 10.3389/fpsyg.2019.00093
Peng, C., Gong, Y., and Zhu, X. (2004). The applicabiliy of interaction anxiousness scale in Chinese undergraduate students. Chin. Ment. Health J. 18, 39–41.
Peters, L., Sunderland, M., Andrews, G., Rapee, R. M., and Mattick, R. P. (2012). Development of a short form social interaction anxiety (SIAS) and social phobia scale (SPS) using nonparametric item response theory: the SIAS-6 and the SPS-6. Psychol. Assess. 24, 66–76. doi: 10.1037/a0024544
Rauch, W. A., Schweizer, K., and Moosbrugger, H. (2008). An irt analysis of the personal optimism scale. Eur. J. Psychol. Assess. 24, 49–56. doi: 10.1027/1015-5759.24.1.49
Rodebaugh, T. L., Woods, C. M., Heimberg, R. G., Liebowitz, M. R., and Schneier, F. R. (2006). The factor structure and screening utility of the social interaction anxiety scale. Psychol. Assess. 18, 231–237. doi: 10.1037/1040-3590.18.2.231
Safren, S. A., Turk, C. L., and Heimberg, R. G. (1998). Factor structure of the social interaction anxiety scale and the social phobia scale. Behav. Res. Ther. 36, 983–994. doi: 10.1016/j.janxdis.2011.01.006
Sakurai, A., Nagata, T., Harai, H., Yamada, H., Mohri, I., Nakano, Y., et al. (2005). Is “relationship fear” unique to Japan? Symptom factors and patient clusters of social anxiety disorder among the Japanese clinical population. J. Affect. Disord. 87, 131–137. doi: 10.1016/j.jad.2005.03003
Samejima, F. (1969). Estimation of latent ability using a response pattern of graded scores. Psychometr. Monogr. 17, 5–17. doi: 10.1007/BF03372160
Sunderland, M., Afzali, M. H., Batterham, P. J., Calear, A. L., Carragher, M., HoBbs, M., et al. (2019). Comparing scores from full length short form, and adaptive tests of the social interaction anxiety and social phobia scale. Assessment 27, 518–532. doi: 10.1177/1073191119832657
Wang, M. C., Deng, Q., Shou, Y. Y., Lai, H. Y., Deng, J. X., Guo, Y., et al. (2019). Assessing impulsivity in chinese elaborating validity of BIS among male prisoners. Crim. Justice Behav. 46, 492–506. doi: 10.1177/0093854818806033
Wong, Q. J. J., Chen, J., Gregory, B., Baillie, A. J., Nagata, T., Furukawa, T. A., et al. (2019). Measurement equivalence of the social interaction anxiety scale (SIAS) and social phobia scale (SPS) across individuals with social anxiety disorder from Japanese and Australian sociocultural contexts. J. Affect. Disord. 243, 165–174. doi: 10.1016/j.jad.2018.09.028
Keywords: social interaction anxiety, social phobia, item response theory, short form, psychometric properties
Citation: Ouyang X, Cai Y and Tu D (2020) Psychometric Properties of the Short Forms of the Social Interaction Anxiety Scale and the Social Phobia Scale in a Chinese College Sample. Front. Psychol. 11:2214. doi: 10.3389/fpsyg.2020.02214
Received: 02 June 2020; Accepted: 07 August 2020;
Published: 21 October 2020.
Edited by:
Dubravka Svetina Valdivia, Indiana University Bloomington, United StatesReviewed by:
Ronald Rapee, Macquarie University, AustraliaMilagros Ocalin Sánchez Hernández, National Autonomous University of Nicaragua at León, Nicaragua
Copyright © 2020 Ouyang, Cai and Tu. This is an open-access article distributed under the terms of the Creative Commons Attribution License (CC BY). The use, distribution or reproduction in other forums is permitted, provided the original author(s) and the copyright owner(s) are credited and that the original publication in this journal is cited, in accordance with accepted academic practice. No use, distribution or reproduction is permitted which does not comply with these terms.
*Correspondence: Yan Cai, Y3kxOTc5MTIzQGFsaXl1bi5jb20=; Dongbo Tu, dHVkb25nYm9AYWxpeXVuLmNvbQ==
 Xueyuan Ouyang
 Yan Cai
 Dongbo Tu