
95% of researchers rate our articles as excellent or good
Learn more about the work of our research integrity team to safeguard the quality of each article we publish.
Find out more
ORIGINAL RESEARCH article
Front. Psychol. , 15 November 2019
Sec. Auditory Cognitive Neuroscience
Volume 10 - 2019 | https://doi.org/10.3389/fpsyg.2019.02481
This article is part of the Research Topic Children Listen: Psychological and Linguistic Aspects of Listening Difficulties During Development View all 25 articles
Background: Some children appear to not hear well in class despite normal hearing sensitivity. These children may be referred for auditory processing disorder (APD) assessment but can also have attention, language, and/or reading disorders. Despite presenting with similar concerns regarding hearing difficulties in difficult listening conditions, the overall profile of deficits can vary in children with suspected or confirmed APD. The current study used cluster analysis to determine whether subprofiles of difficulties could be identified within a cohort of children presenting for auditory processing assessment.
Methods: Ninety school-aged children (7–13 years old) with suspected APDs were included in a cluster analysis. All children had their reading, language, cognition and auditory processing assessed. Parents also completed the Children’s Auditory Performance Scale (CHAPS). Cluster analysis was based on tasks where age-norms were available, including word reading (Castles and Coltheart irregular and non-words test), phonological awareness (Queensland University Inventory of Literacy), language [Comprehensive Language of Assessment-4, Comprehensive Assessment of Spoken Language (CASL)], sustained attention (Continuous Performance Test), working memory (digits forward and backward), and auditory processing [Frequency Pattern Test (FPT), Dichotic Digits Test (DDT)]. Hierarchical cluster analysis was undertaken to determine the optimal number of clusters for the data, followed by a k-means cluster analysis.
Results: Hierarchical cluster analysis suggested a four-group solution. The four subgroups can be summarized as follows: children with (1) global deficits, n = 35; (2) poor auditory processing with good word reading and phonological awareness skills, n = 22; (3) poor auditory processing with poor attention and memory but good language skills, n = 15; and (4) poor auditory processing and attention with good memory skills, n = 18.
Conclusion: The cluster analysis identified distinct subgroups of children. These subgroups display the variation in areas of difficulty observed across different studies in the literature (e.g., not every child with APD has an attention deficit), highlighting the heterogeneous nature of APD and the need to assess a range of skills in children with suspected APD. It would be valuable for future studies to independently verify these subgroups and to determine whether interventions can be optimized based on these subgroups.
Some school-aged children appear to not hear well in difficult listening situations such as the classroom, in the absence of a hearing loss based on pure tone audiometry (Purdy et al., 2018). These children are often described as having problems hearing in noise, needing to have instructions repeated, being unable to follow verbal instructions and having generally poor listening skills (Chermak et al., 2002). Some of these children also show co-existing reading difficulties and/or attention deficits (Richardson et al., 2004; Sharma et al., 2009; Tomlin et al., 2015). These children are initially tested for hearing loss and in the absence of any audiometric hearing loss they should be referred for auditory processing assessment (Jerger and Musiek, 2000). Clinical practice varies widely, however, despite considerable efforts internationally to develop auditory processing assessment and treatment guidelines (Iliadou et al., 2018).
In children diagnosed with APD, there is impaired processing of auditory information that is not consistent with their hearing thresholds (Moore et al., 2013). Auditory processing includes the ability of the auditory system to localize, discriminate, recognize auditory patterns, and discriminate temporal aspects of sounds (including but not limited to temporal resolution, masking, integration and sequencing) (American Speech and Hearing Association [ASHA], 1996; Jerger and Musiek, 2000). A significant deficit in any of these auditory skills is indicative of APD (American Speech and Hearing Association [ASHA], 1996). Thus to diagnose any child with APD, many established guidelines (American Speech and Hearing Association [ASHA], 1996; Jerger and Musiek, 2000; Wilson, 2018) recommend a test battery that evaluates multiple auditory processing skills.
Clinicians working with children with suspected APD face three important challenges. One is that auditory processing is not a unitary skill and therefore cannot be assessed with one test (Jerger and Musiek, 2000; Wilson, 2018), hence clinicians need to access a range of tests that have age-dependent norms and demonstrated reliability, test efficiency and validity (Musiek et al., 2010; Emanuel et al., 2011; Wilson, 2018; Keith et al., 2019). For example, commonly used tests such as the FPT (Musiek, 1994) and the DDT (Musiek, 1983) have age-related norms while the Random Gap Detection Test (RGDT) has a screening pass level that is applied to all school aged children (Sharma et al., 2006; Kelly, 2007). A second challenge is that children with APD can have co-existing language, attention, and/or reading disorders (Sharma et al., 2009; Wilson, 2018) that may affect test results and/or management choices. A third challenge stems from the need for efficient, clinically feasible diagnostic protocols that can capture APD in children who are heterogeneous and that assist the children and their families in receiving appropriate management that includes appropriate evidence-based treatments (Wilson, 2018). The current research attempts to address the second and third challenges by determining whether there are identifiable subprofiles of children who are suspected to have APD with other potential co-existing disorders, since such subprofiles may help guide management. The research aim is to determine whether cluster analysis identifies distinct subgroups of children, which would help researchers and clinicians to better understand the range of challenges that children with APD present with, and could guide recommendations to parents and clinicians regarding appropriate clinical referral pathways. There have been attempts to define subgroups of children with APD in the past (Bellis and Ferre, 1999), recognizing the potential values of this approach for clarifying referral pathways and planning treatment, but to our knowledge the current study is the first that uses cluster analysis to define subgroups.
There is ample evidence that children with auditory processing deficits can display reading and language deficits, but typically this is not the case for all children (Jerger and Musiek, 2000; Ramus, 2003; Bishop, 2007; Sharma et al., 2009; Leppänen et al., 2010; Hämäläinen et al., 2013; Halliday et al., 2017; Mealings and Cameron, 2019). A causal relationship between auditory deficits and poor reading and/or language skills has been proposed, or at least it has been suggested that these share some common underlying neurodevelopmental etiology (Leppänen et al., 2010; Moore et al., 2013; Halliday et al., 2017). This is difficult to prove, however, and there is no empirical evidence that confirms this. A theoretical framework has been proposed (Ramus, 2003; Goswami, 2011; Halliday et al., 2017) that attempts to explain why auditory processing and reading disorders are associated (Sharma et al., 2006; Leppänen et al., 2010; Hämäläinen et al., 2013) but there is no agreement on the “nature or magnitude of the link” between auditory processing and reading disorders (Ramus, 2003). There are also reports that children with auditory processing deficits have cognitive (attention and/or working memory) difficulties that account, at least in part, for their poor performance on auditory processing tests (Moore et al., 2013). This is also not straightforward as some children with APD do not have attention and memory deficits (Sharma et al., 2009, 2014a; Tomlin et al., 2015).
Links between auditory, cognitive, reading, and language abilities of children with APD are still not fully understood. It is recommended that children with suspected APD are assessed using a wide range of measures that encompass all these domains (American Speech Language Hearing Association [ASHA], 2005). In the current study auditory, cognitive, reading, and language abilities of children with suspected APD were assessed and cluster analysis was used to determine whether the results revealed distinct subgroups of children. The subgrouping was then tested by comparing the groups across a range of related measures not included in the cluster analysis to determine where there were significant differences in performance.
The University of Auckland Human Research Participants’ Ethics Committee approved this study. Written informed consent to participate in this study was provided by the participants’ legal guardian/next of kin. Ninety children aged 7–12.8 years old (Mean = 9.8 years ± 1.5) with listening concerns participated: 58 males with an average age of 9.8 years ± 1.6 and 32 females with an average age of 9.7 years ± 1.5. Children were referred to the study by speech language pathologists, teachers, educational psychologists, and audiologists. Most came to the research with suspected APD and reports of other reading and language concerns, making this a potentially heterogeneous group of participants. A subset of these children was reported on previously (Sharma et al., 2009, 2019; Gilley et al., 2016).
Children were tested individually in a sound-treated laboratory booth over two sessions of about 3 h each with multiple breaks. Pure-tone audiometry and behavioral auditory processing tests were administered using a GSI clinical audiometer and TDH-39 earphones. Test materials were presented at 60 dB HL using a CD player (Bass XPander, P882). All children were administered hearing, auditory processing (behavioral and electrophysiological), language, cognitive, and reading assessments.
Inclusion criteria included normal peripheral hearing and a standard score of 80 or more on the TONI (Brown et al., 1990). Parents were invited to report on their children’s perceived listening difficulties by completing the Children’s Auditory Performance Scale (CHAPS) questionnaire (Smoski et al., 1998), which rates the children’s difficulties compared to classroom peers (a score a “0” indicates equivalent performance to peers) (Sharma et al., 2009). Smoski et al. (1998) proposed a normative cut-off of −11 for the overall CHAPS score, with scores lower than this indicating significant listening difficulties. In total 83 parents (92% of participants) returned the CHAPS questionnaire.
All participants had normal hearing sensitivity. Pure tone thresholds were 15 dB HL or better at octave frequencies from 250 to 8000 Hz. All children had Type A tympanograms, measured using a 226-Hz probe tone (Jerger, 1970) and ipsilateral 1000-Hz acoustic reflex thresholds less than 100 dB HL (Silman and Gelfand, 1981) consistent with normal middle ear function. For all children otoacoustic emissions (OAE) strength was within the normal range based on the pass/refer criteria in the TEOAE protocols of the Scout Sport System (Bio-Logic Systems Corp®) (Hall, 2000).
Children were evaluated on multiple measures after completing the peripheral hearing assessments. The tasks included in the cluster analysis are the ones where published age-specific norms were available. Details of the stimuli, procedure and scoring are provided in Table 1.
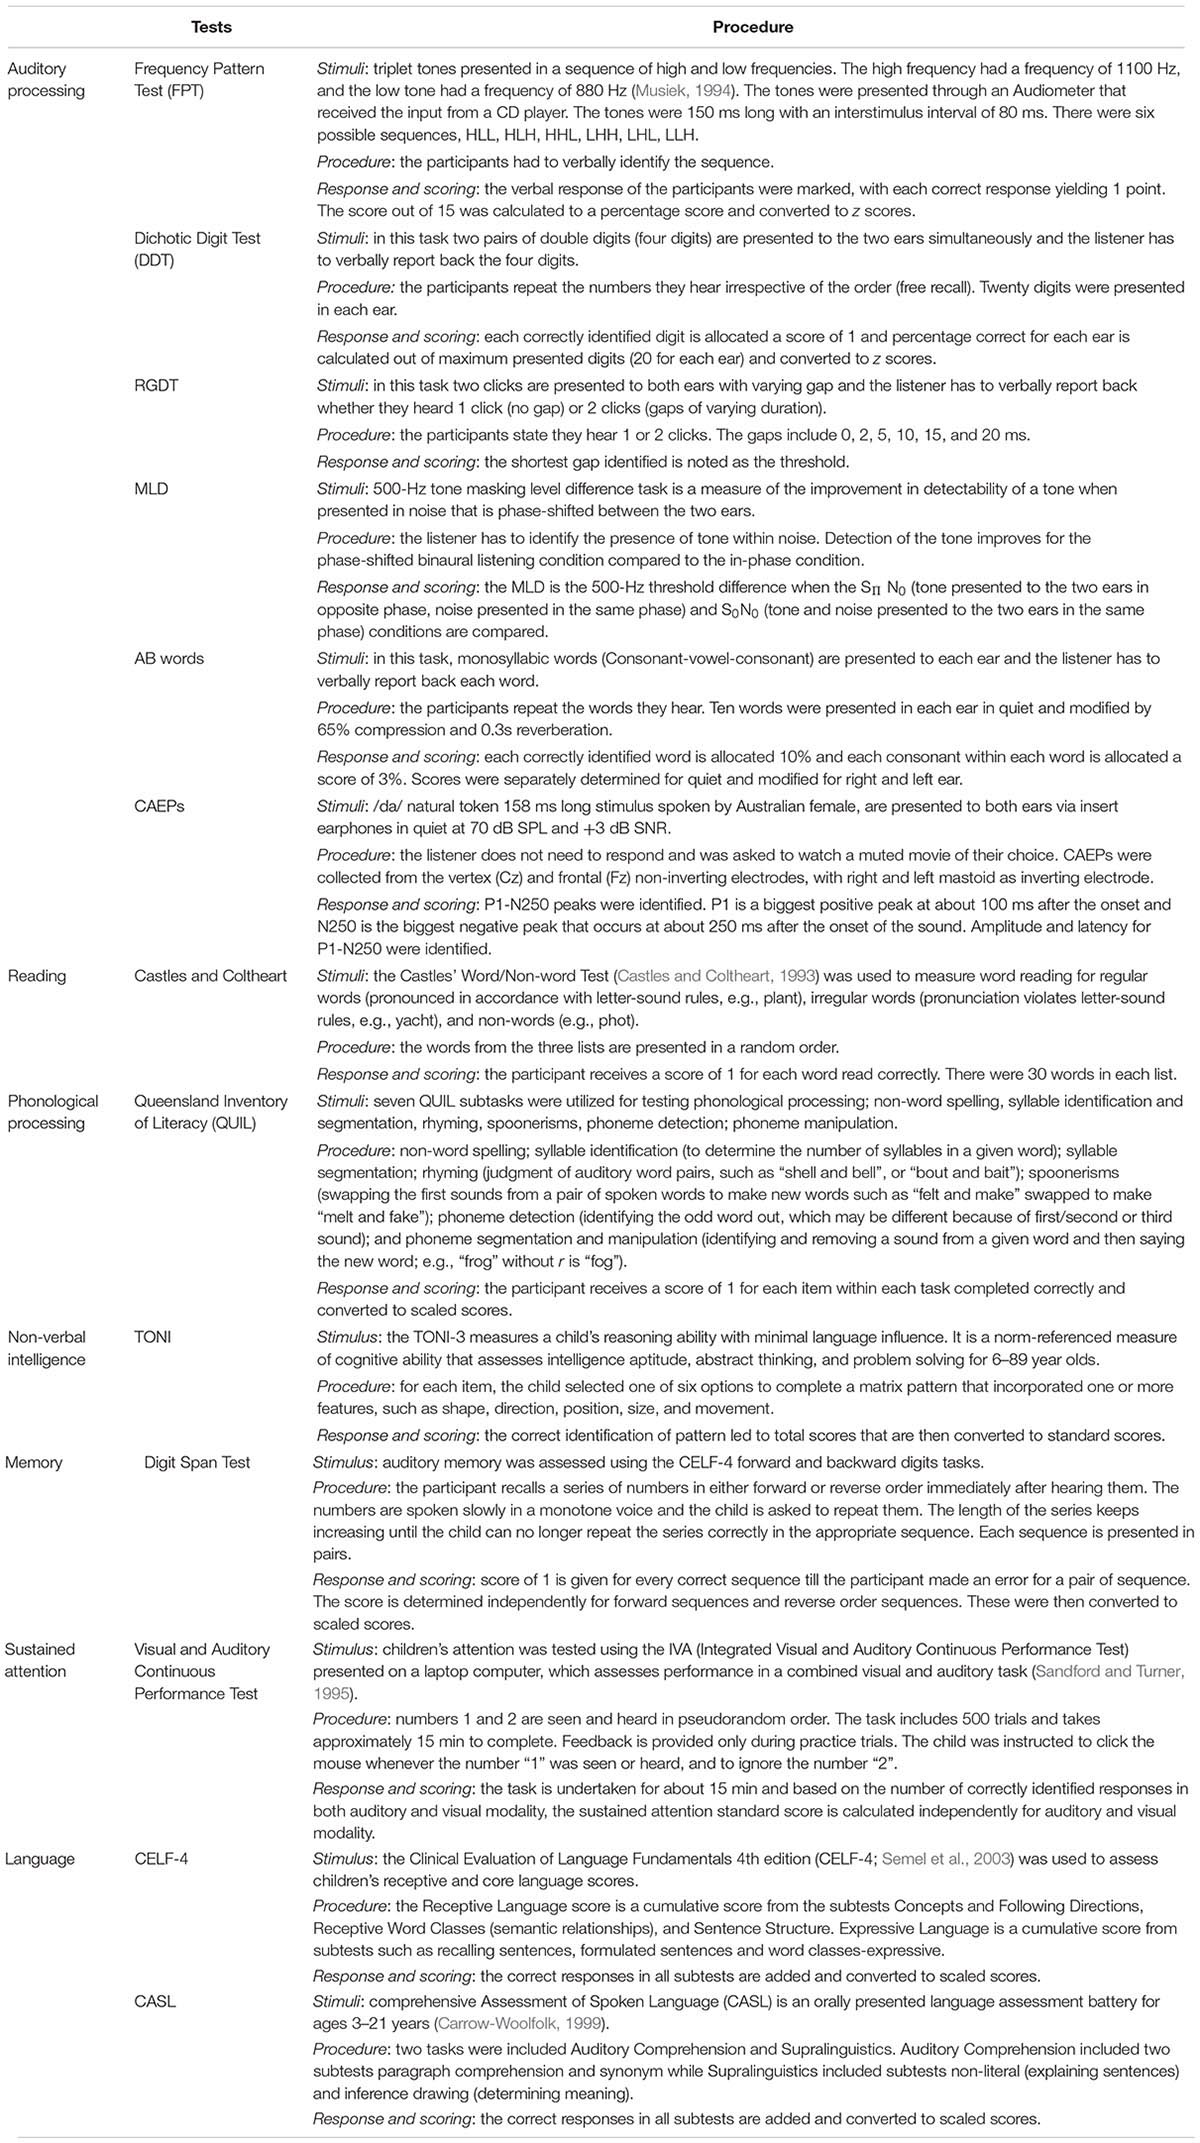
Table 1. The details of the all tests that included auditory processing, reading, language, attention, memory in the current study.
The auditory processing measures were the FPT (Musiek, 1994) and DDT (Musiek, 1983). Cognitive measures were memory (Comprehensive Evaluation of Language Fundamentals, CELF-4, digit span forward and backward) (Semel et al., 2003) and sustained attention [Integrated Visual and Auditory (IVA) Continuous Performance Test] (Sandford and Turner, 2000). Language measures were Receptive and Core Language standard scores from the CELF-4, and Auditory Comprehension and Supralinguistics standard scores from the Comprehensive Assessment of Spoken Language (CASL), as these all rely on auditory perception (Carrow-Woolfolk, 1999). The reading task included was word reading measured using the Castle and Coltheart’s word lists (Castles and Coltheart, 1993). Phonological processing was measured using the Queensland Inventory of Literacy (QUIL) (Dodd et al., 1996). Only those QUIL tasks specifically linked to auditory perception were included (syllable identification, segmentation, rhyming, spoonerisms, phoneme detection, phoneme manipulation). Non-word spelling and visual rhyme subtests were not included in the cluster analysis. All analyses were undertaken using Statistica 10.0.
The entire dataset included 23 variables. Pearson correlation analyses were undertaken to remove highly correlated variables. This is important step as strongly correlated variables represent potentially the same measure and may receive higher weighting during cluster analysis. Both correlation and factor analysis were undertaken to avoid this (Chiarello et al., 2012). Variables with strong correlations (r ≥ 0.70) were not placed in the cluster analysis (Taylor, 1990). Following the correlational analysis, exploratory factor analysis was used to further reduce the number of variables.
Before undertaking the cluster analysis, the selected variables were standardized to control for unequal scaling of the data (Clatworthy et al., 2005). The standardization transforms all values (regardless of their distributions and original units of measurement) to compatible units from a distribution with a mean of 0 and a standard deviation of 1. This transformation makes the distributions of values easy to compare across variables and independent of the units of measurements. A hierarchical cluster analysis using Ward’s method was performed on the data to determine how many clusters are appropriate for the final selected variables (Clatworthy et al., 2005; Chiarello et al., 2012). Following this, a k-means cluster analysis was performed on the data to determine the membership of the individual cases into the clusters. Once group membership was determined, a discriminant function analysis was undertaken to confirm predicted membership.
The stability of the clustering was determined by comparing groups on the variables that were not used in the cluster analysis to evaluate generalizability of the clusters (Chiarello et al., 2012). The group comparisons included gender distribution, paragraph reading [Wheldall Accuracy of Reading Passages (WARP)] (Madelaine and Wheldall, 1998), non-word spelling (QUIL subtest), CELF-4 Expressive language (Semel et al., 2003), RGDT (Keith, 2000), Masking Level Differences (MLD) (Sweetow and Reddell, 1978; Jerger et al., 1984), word recognition scores (AB words in quiet and in noise with 65% compression and 0.3s reverberation of words) (Sharma et al., 2009), and speech-evoked cortical auditory evoked potential (CAEP) latencies and amplitudes. The procedure for recording CAEPs to /da/ in quiet and in noise (at 3 dB signal-to-noise ratio, SNR) is described elsewhere (Sharma et al., 2014b). All comparisons were performed with age as a covariate and results were adjusted for multiple testing using Bonferroni correction.
FPT and DDT scores for right and left ears were significantly correlated (r = 0.86, p < 0.001 and r = 0.070, p < 0.001, respectively) and therefore, only FPT and DDT right ear scores were included in the cluster analysis. Castle and Coltheart regular word and irregular word scores were also highly correlated (r = 0.78, p < 0.001) so only irregular words were included. Non-word scores on the Castle and Coltheart test and QUIL were correlated (r = 0.72, p < 0.001); the Castle and Coltheart non-word task was included in the cluster analysis and the QUIL subtests were examined separately.
Tables 2A,B provide Pearson’s correlational results for QUIL and language tasks respectively. Scores for the QUIL subtests were weakly or modestly correlated with each other (r values in the range 0.28–0.55). All QUIL measures were therefore included in the next stage of data reduction using factor analysis (Taylor, 1990) (Table 2A).
Performance on the memory tasks (digit span forward and backward) were significantly correlated but the correlation was weak (p = 0.001, r = 0.35); both measures were included in the cluster analysis. Auditory and visual sustained attention were strongly correlated (p < 0.001, r = 0.74) and therefore, only auditory attention scores were included. Language scores were not highly correlated (r values 0.52–0.69) (Table 2B), therefore, all languages scores (Receptive, Core, Auditory Comprehension, Supralinguistics) were included in the next stage of data reduction using factor analysis.
Of the now 18 tasks included based on the correlation analysis, there were six measures of phonological processing and four language measures. From the six measures of phonological processing, (unrotated) principal component analysis identified only one factor with an eigenvalue greater than 1, explaining 48.6% of the variance. This included all six items with loadings greater than 0.50 (Table 3). Individual principal component scores were therefore included in the cluster analysis. Similarly, when the unrotated principal component analysis was undertaken for the four language measures, only one principal component was extracted that explained 68.0% of the variance. All four items within the component had loadings greater than 0.77 and hence the principal component scores were used for the cluster analysis.
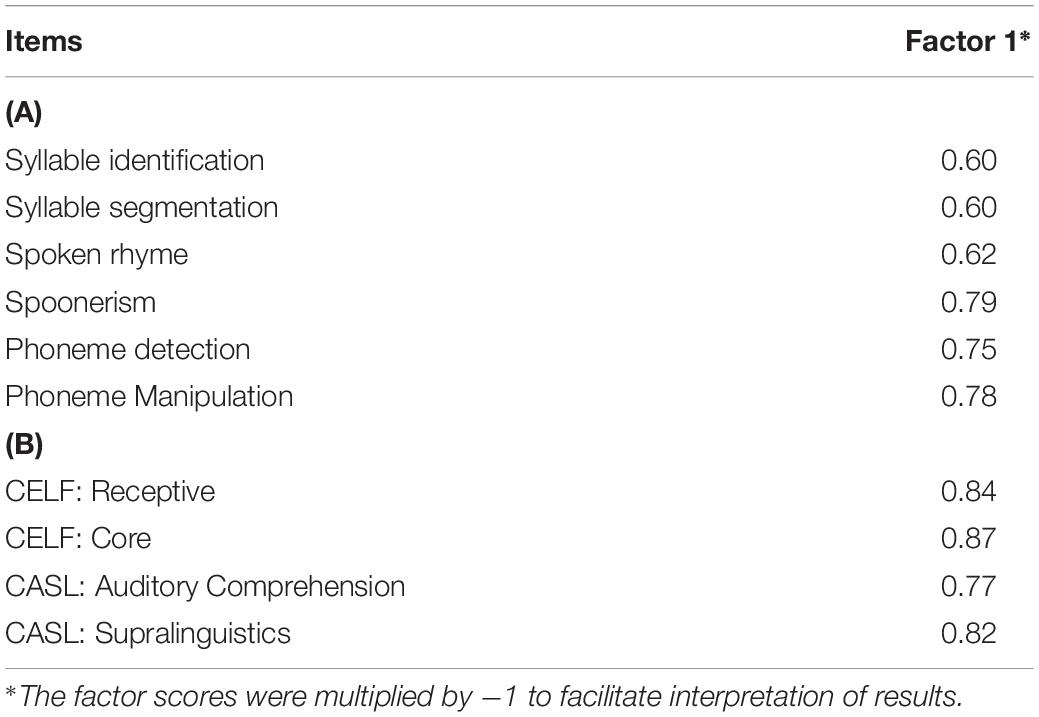
Table 3. Factor loadings and communalities based on a (unrotated) principal components analysis for six items from the (A) QUIL subtests and (B) language measures from CELF-IV and CASL (N = 90).
For the next stage of analysis, the now remaining 10 measures were standardized. The tasks included were auditory processing (FPT, DDT), reading (irregular, non-word), language (one principal component derived from Receptive, Core, Auditory Comprehension, Supralinguistics), TONI, phonological processing (one principal component derived from syllable identification and segmentation, spoken rhyme, spoonerism, phoneme detection, and manipulation), sustained auditory attention, and both memory measures (digit span forward and backward). All the values for the factors were within two standard deviations of the mean and therefore, no outliers were identified.
The hierarchical cluster analysis, as seen in Figure 1, suggested a four-cluster solution appropriate for the final 10 selected variables. Using the plot of linkage distances, Figure 2 shows a plateau, thus a large number of clusters were at the same linkage distance. A four-cluster solution was determined at a point where the plateau ended between linkage distances of 10–15. The final grouping of cases into four clusters was determined after three iterations of the k-means algorithm, using equally spaced centers. Figure 3 shows the means of the 10 standardized variables in each of the four clusters.
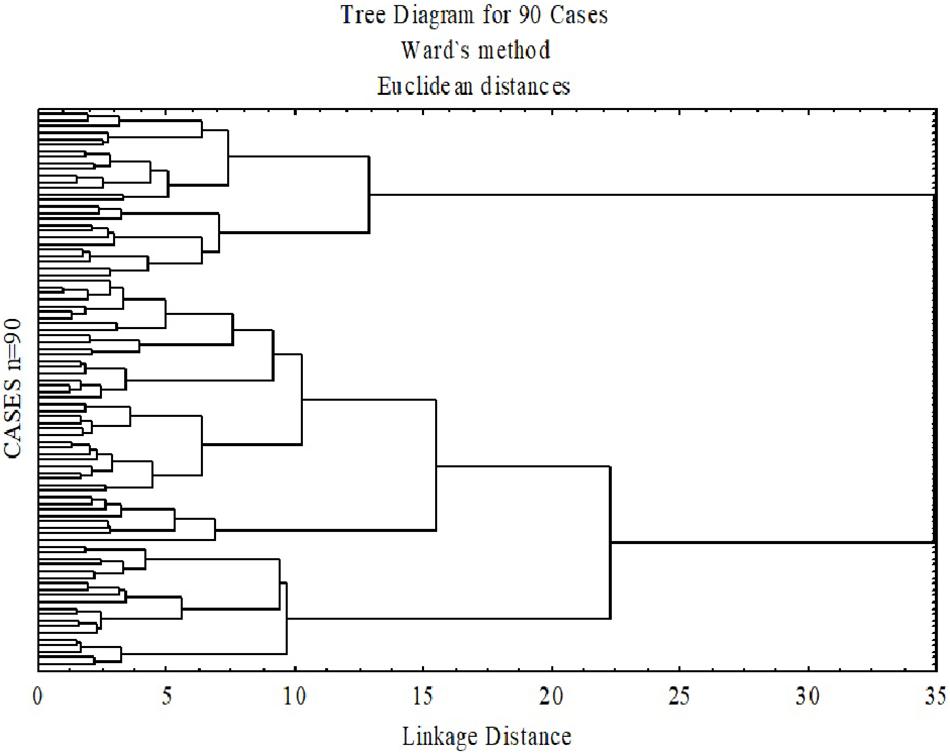
Figure 1. Dendrogram based on Wald’s minimum-variance hierarchical clustering method. The 90 participants were clustered into a single final group. At each generation of clusters, samples were merged into larger clusters to minimize the within cluster sum of squares.
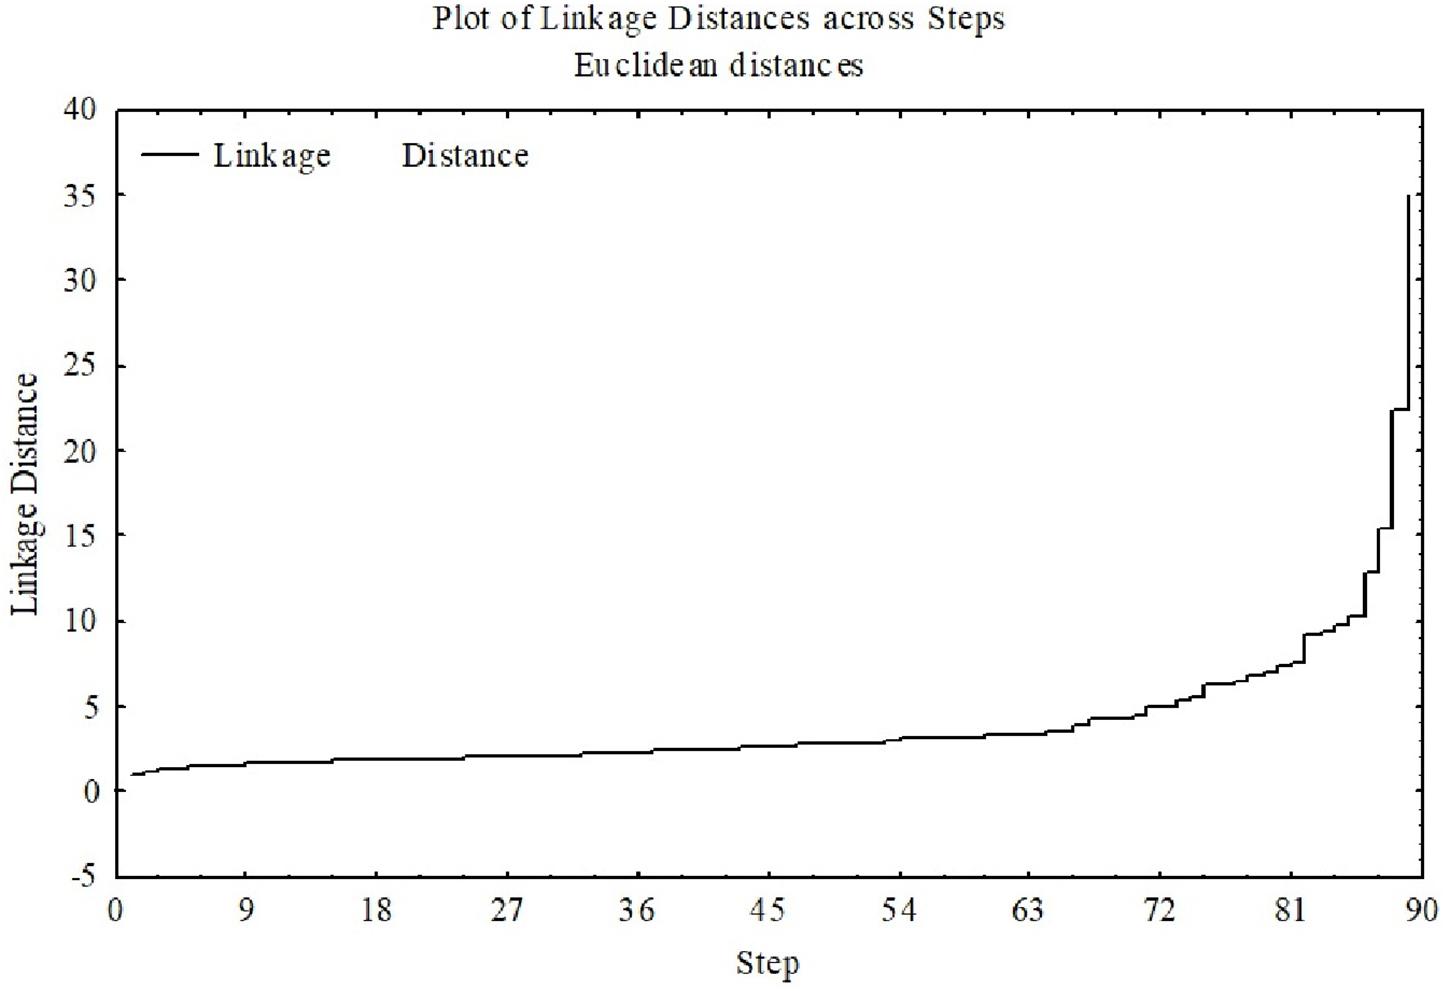
Figure 2. Linkage distance with a clear plateau means that many clusters were formed at essentially the same linkage distance. The higher the linkage distance (y-axis), the more dissimilar the groups are.
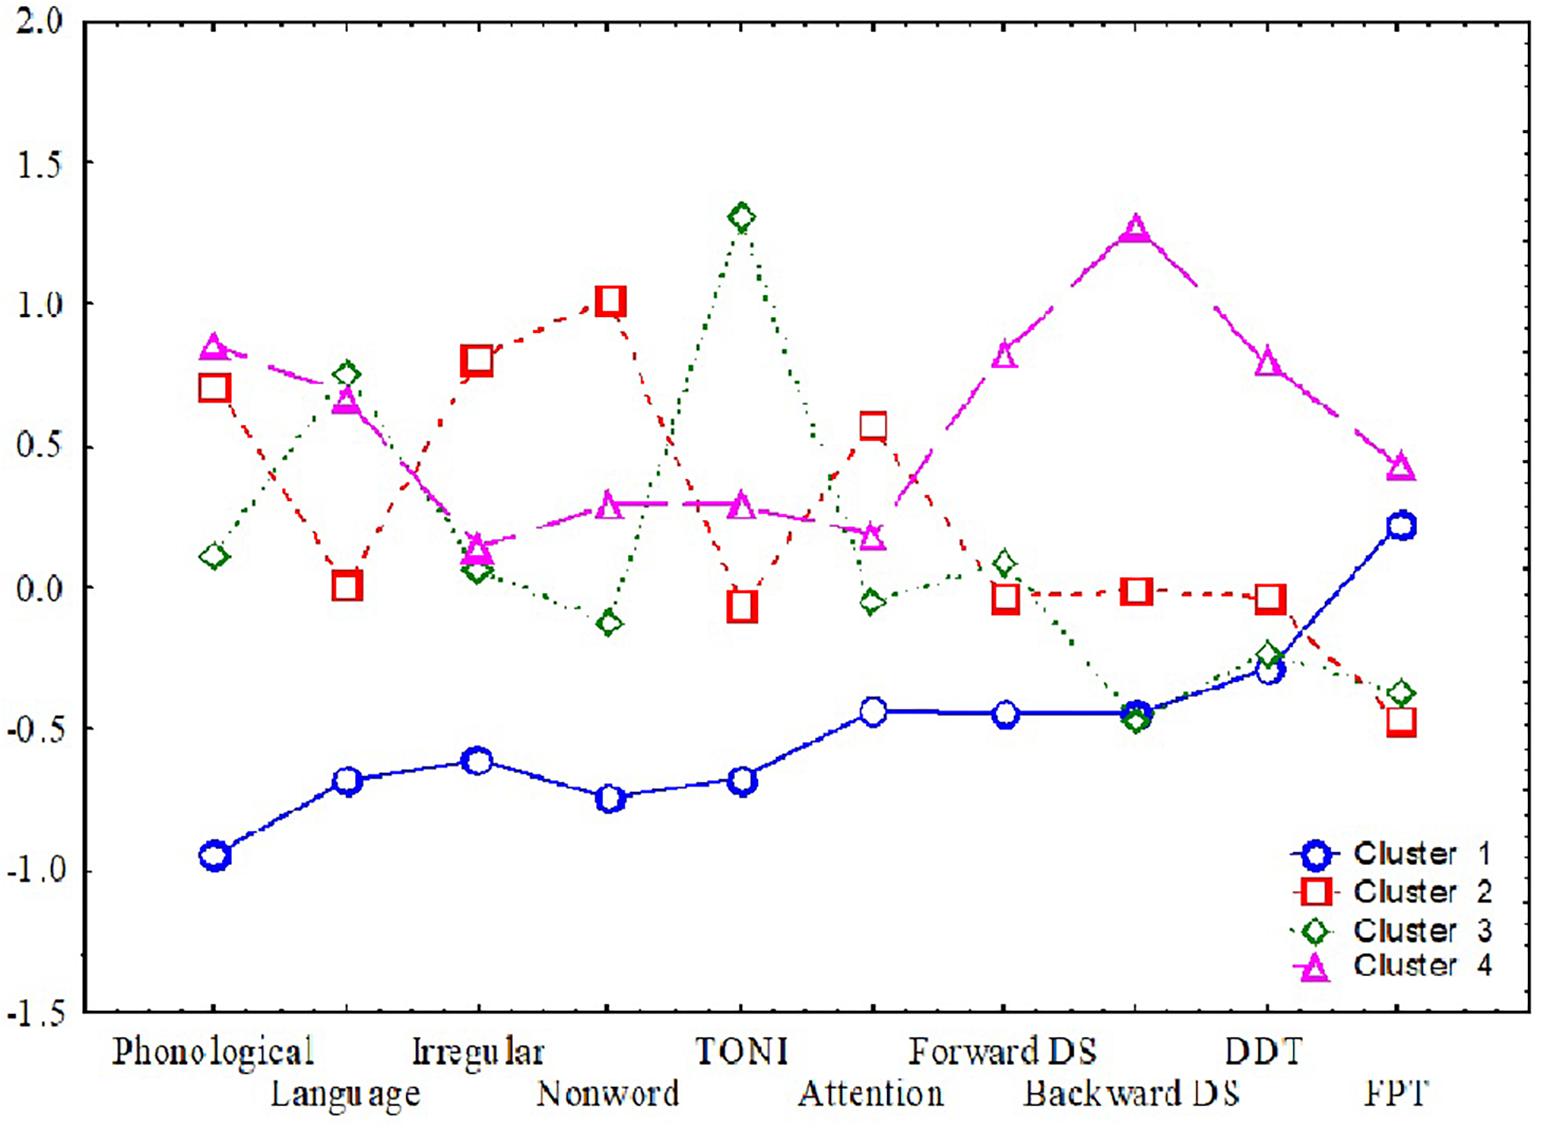
Figure 3. Means for the four clusters. The y-axis shows the means (of standardized scores such that +1 is one standard deviation better than the average sample score) and the x-axis shows the 10 variables used to determine the clusters.
The discriminant analysis and the cluster analysis showed very similar membership of the cases. The accuracy was 97% for group one, 95% for group 2, 93% for group 3, and 89% for group 4. Box’s M test (p = 0.134) was not significant, indicating that the assumption of homoscedasticity is justified. A significant Wilks lambda (Λ = 0.072, p < 0.001) shows a good difference in the mean scores between the four clusters. Table 4 shows the demographics and performance on auditory processing, reading, language and cognitive skills of children across the four clusters.
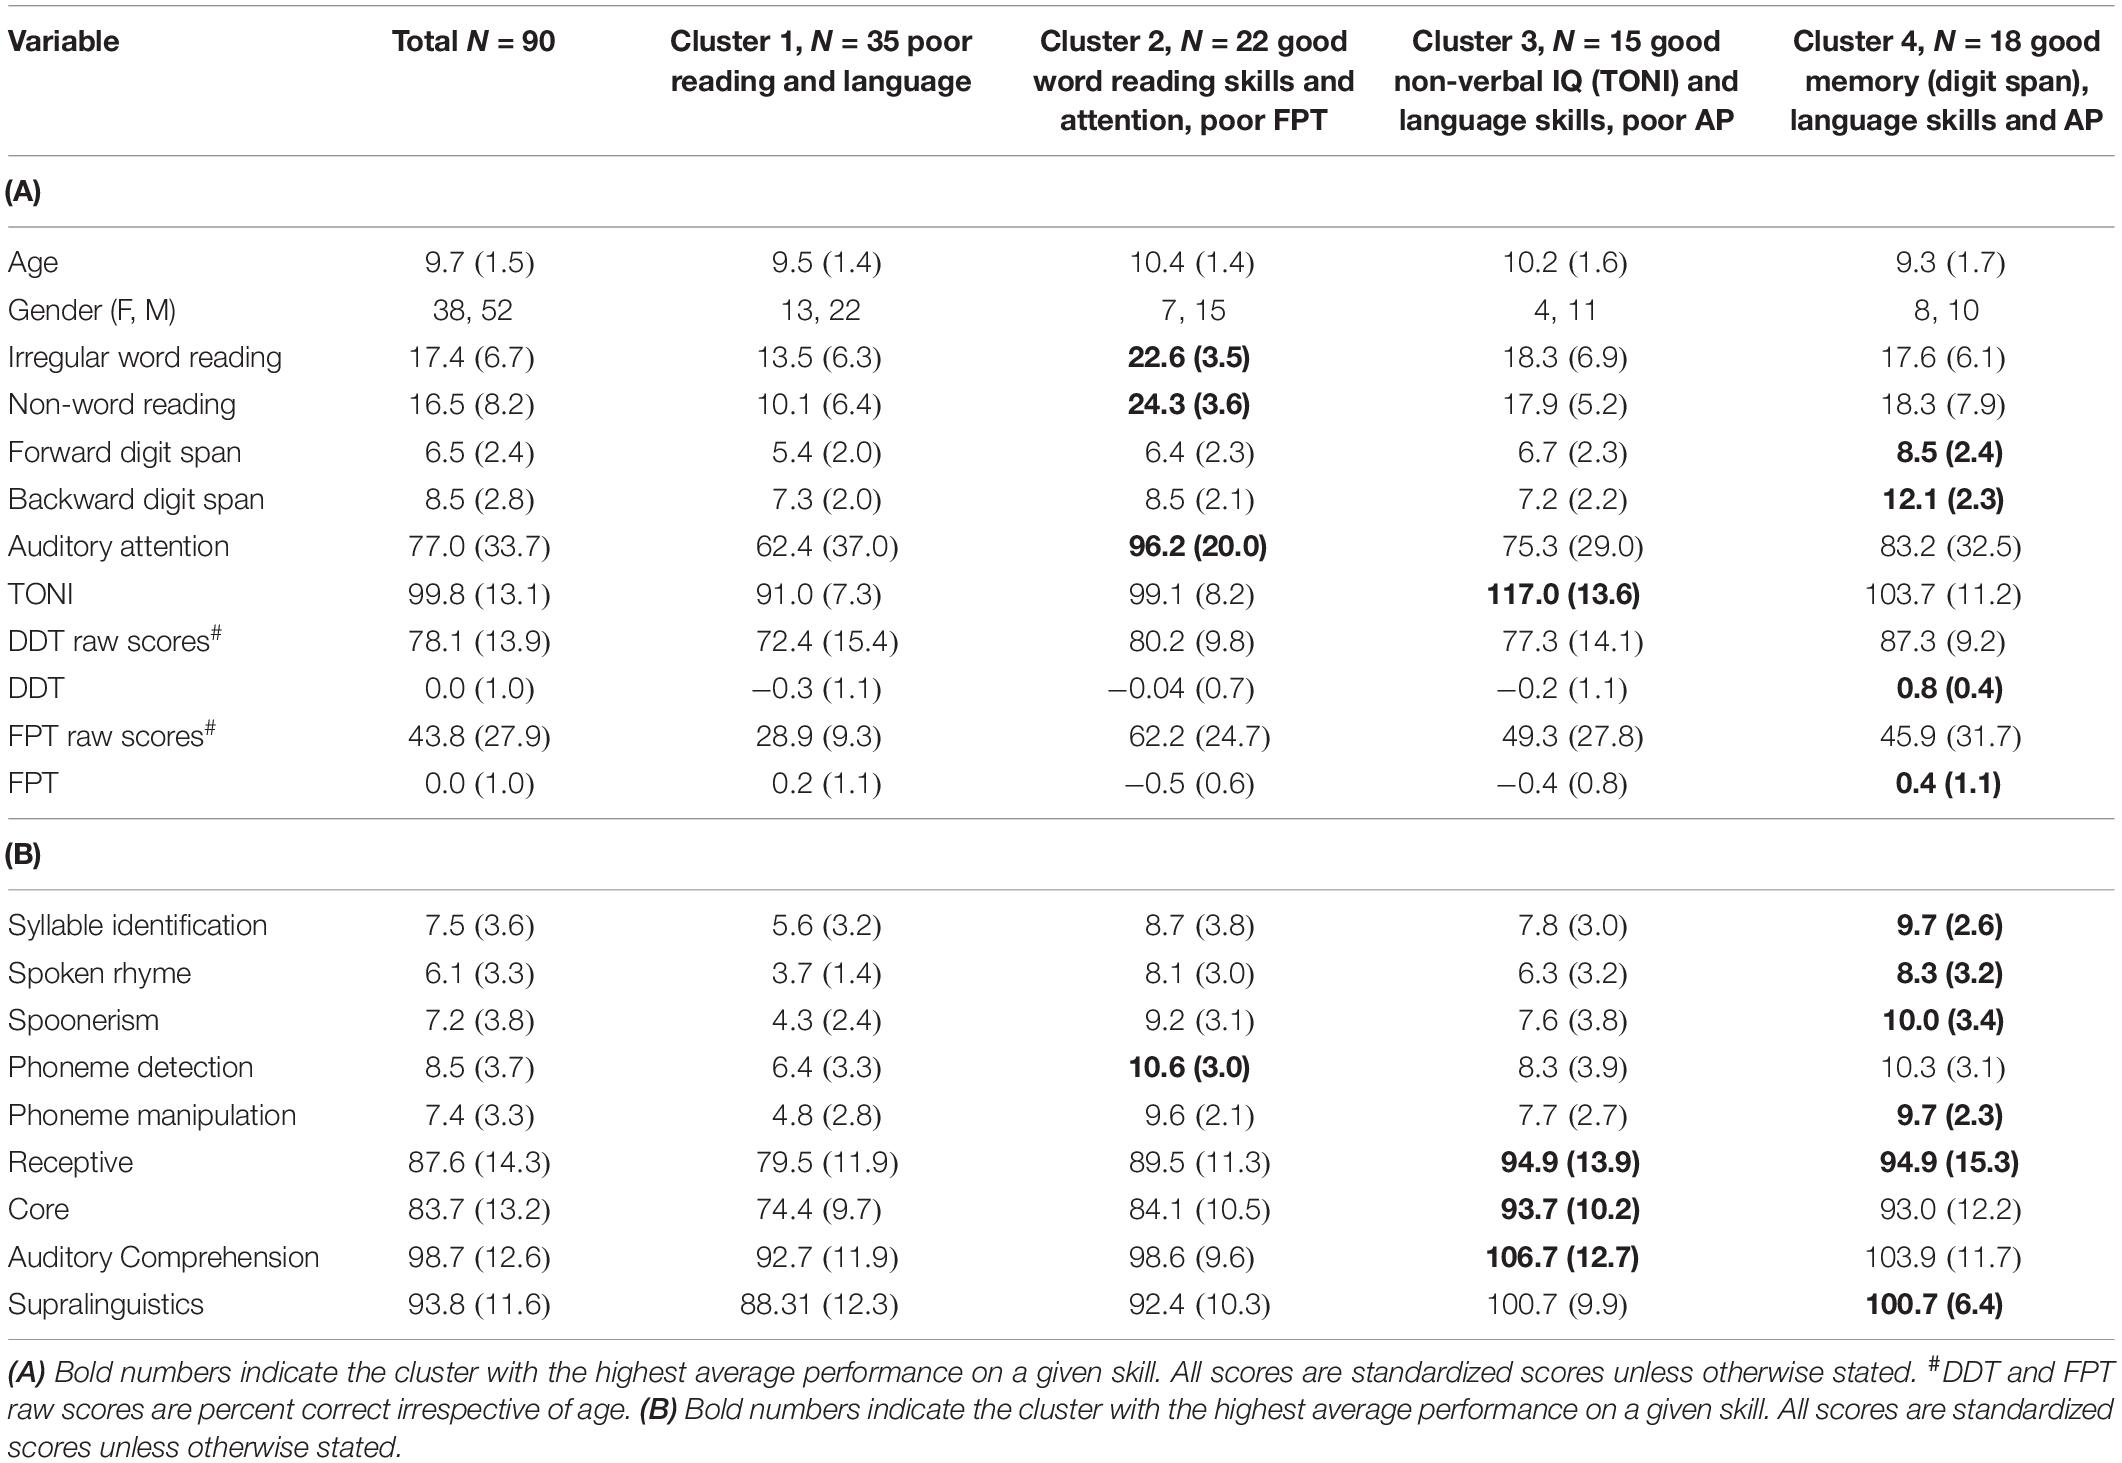
Table 4. (A) Demographics and means (and standard deviation) of participants within each cluster on all skills; (B) means (and standard deviation) of participants within each cluster on phonological processing and language.
Four variables that provided a three-function solution had much higher discriminant function coefficients and hence were more relevant in determining cluster membership. These variables were phonological processing, digit span backward (function 1), TONI (function 2), and non-word reading (with backward digit, function 3) (Λ = 0.1, p ≤ 0.004 for all) (Supplementary Table 1). Figures 4A,B shows the scatterplot of cases for the four clusters across the three functions.
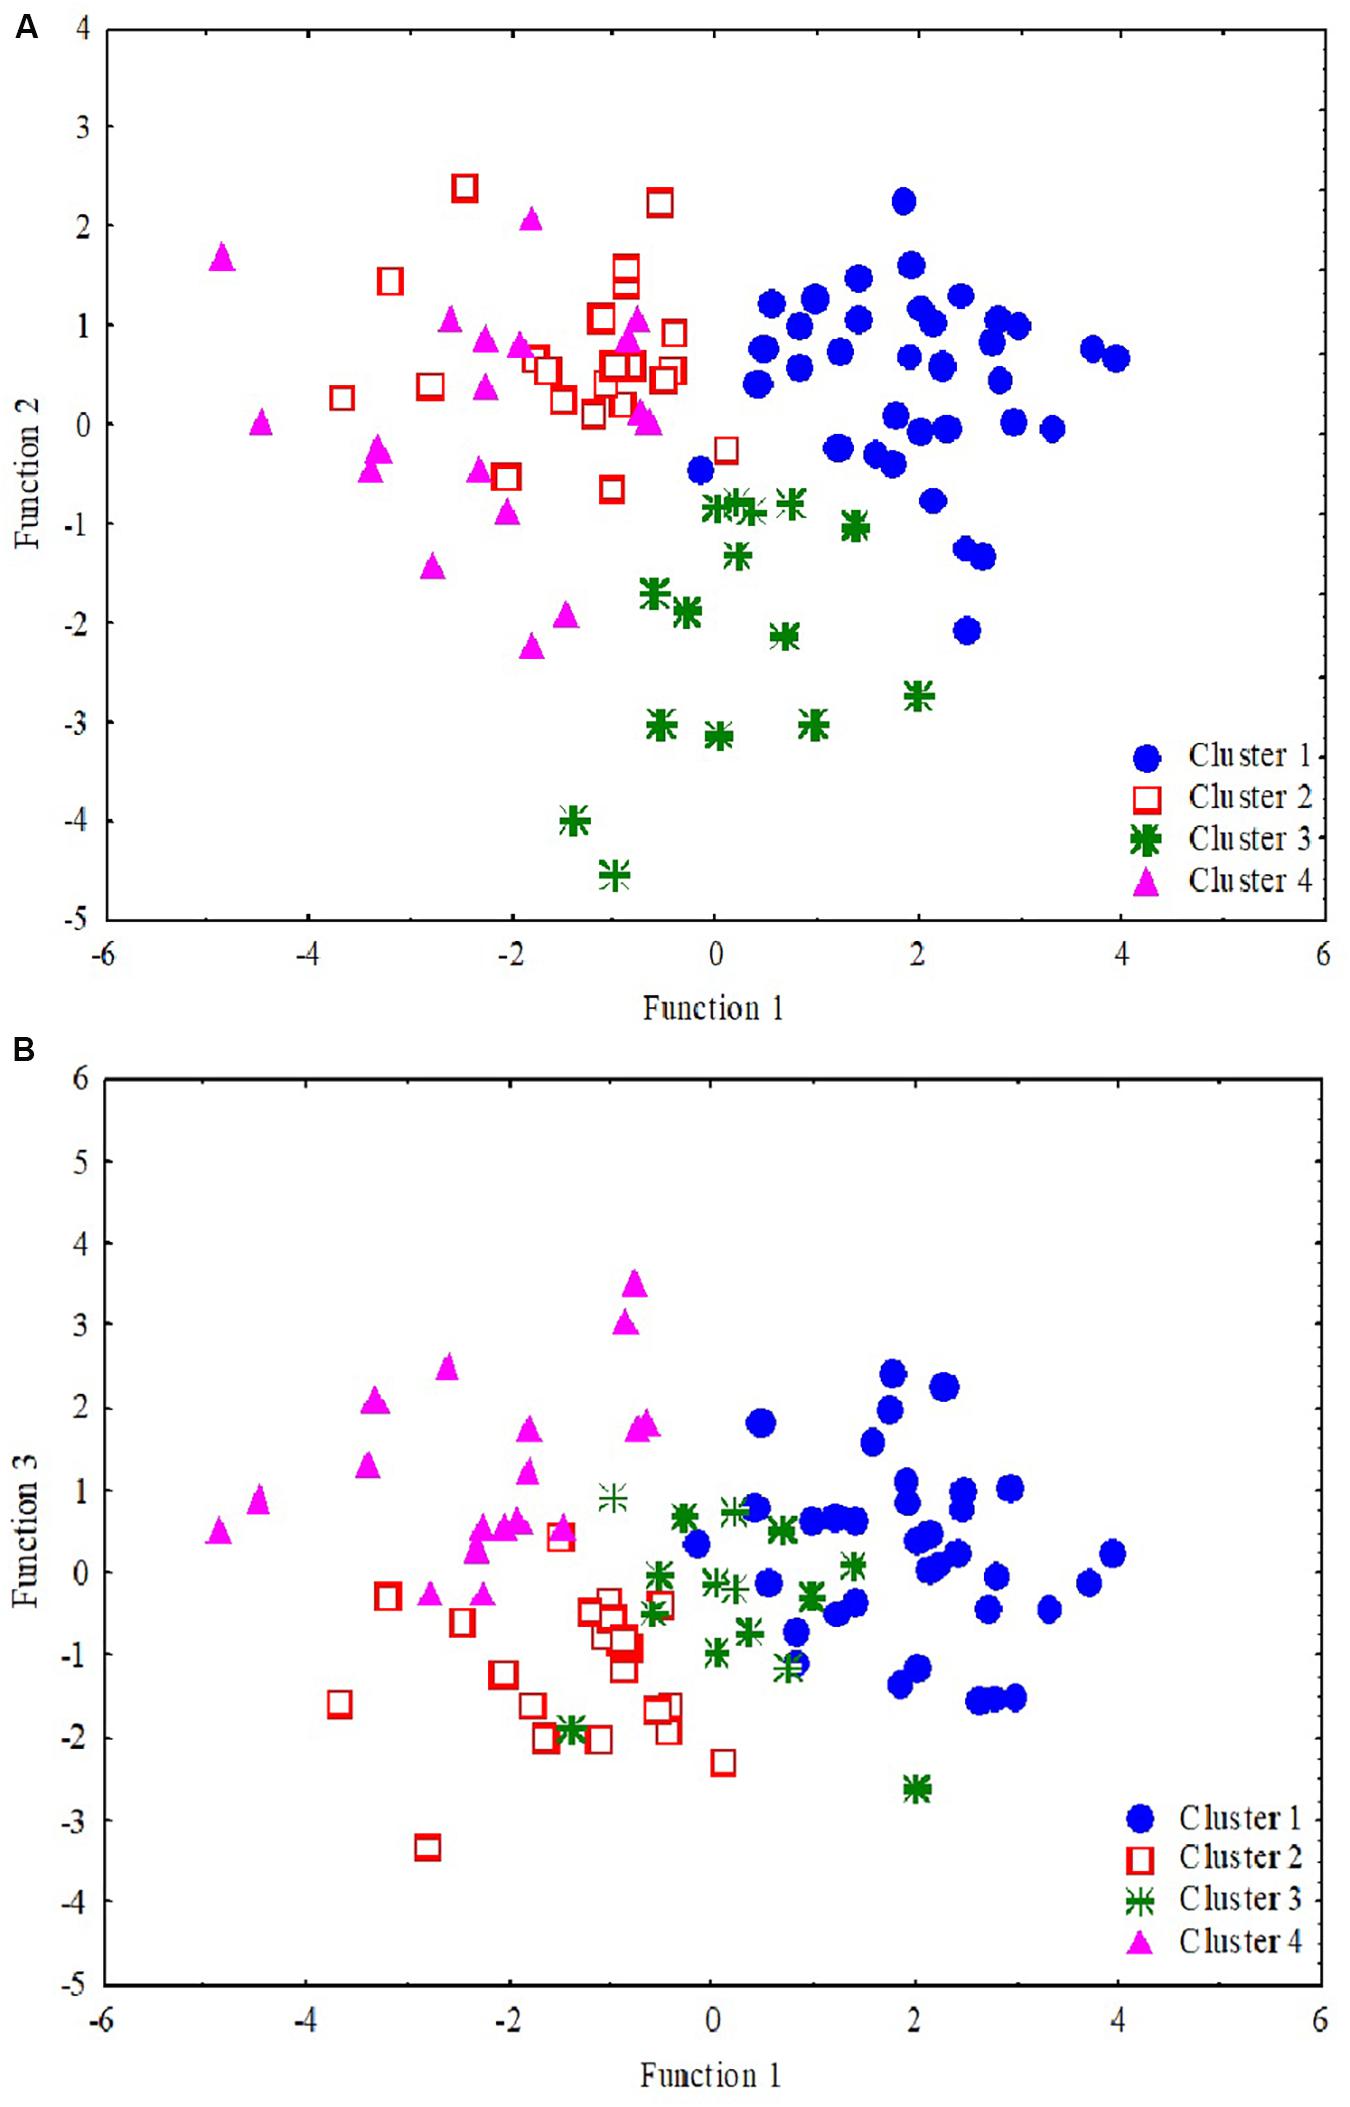
Figure 4. Scatterplot of the discriminant functions. Each data point represents a single participant where cluster 1 (blue dots, n = 35), cluster 2 (red empty square, n = 22), cluster 3 (green star, n = 15), and cluster 4 (pink triangle, n = 18). The two plots depict clustering and separating of four clusters using three factors (of the 10 variables). While (A) shows that the clusters 1 and 3 are separated clearly by functions 1 and 2, (B) shows that clusters 2 and 4 separate very clearly by functions 1 and 3.
Table 5 shows how the four clusters differ on the additional auditory processing and language tasks that were not included in the cluster analysis. The four clusters of children did not differ significantly based on any of the auditory processing measures including CAEPs (Table 5). There were significant performance differences between the four clusters, however, for several reading, phonological, and language measures (WARP paragraph reading, non-word spelling, visual rhyme, expressive language) (Table 5).
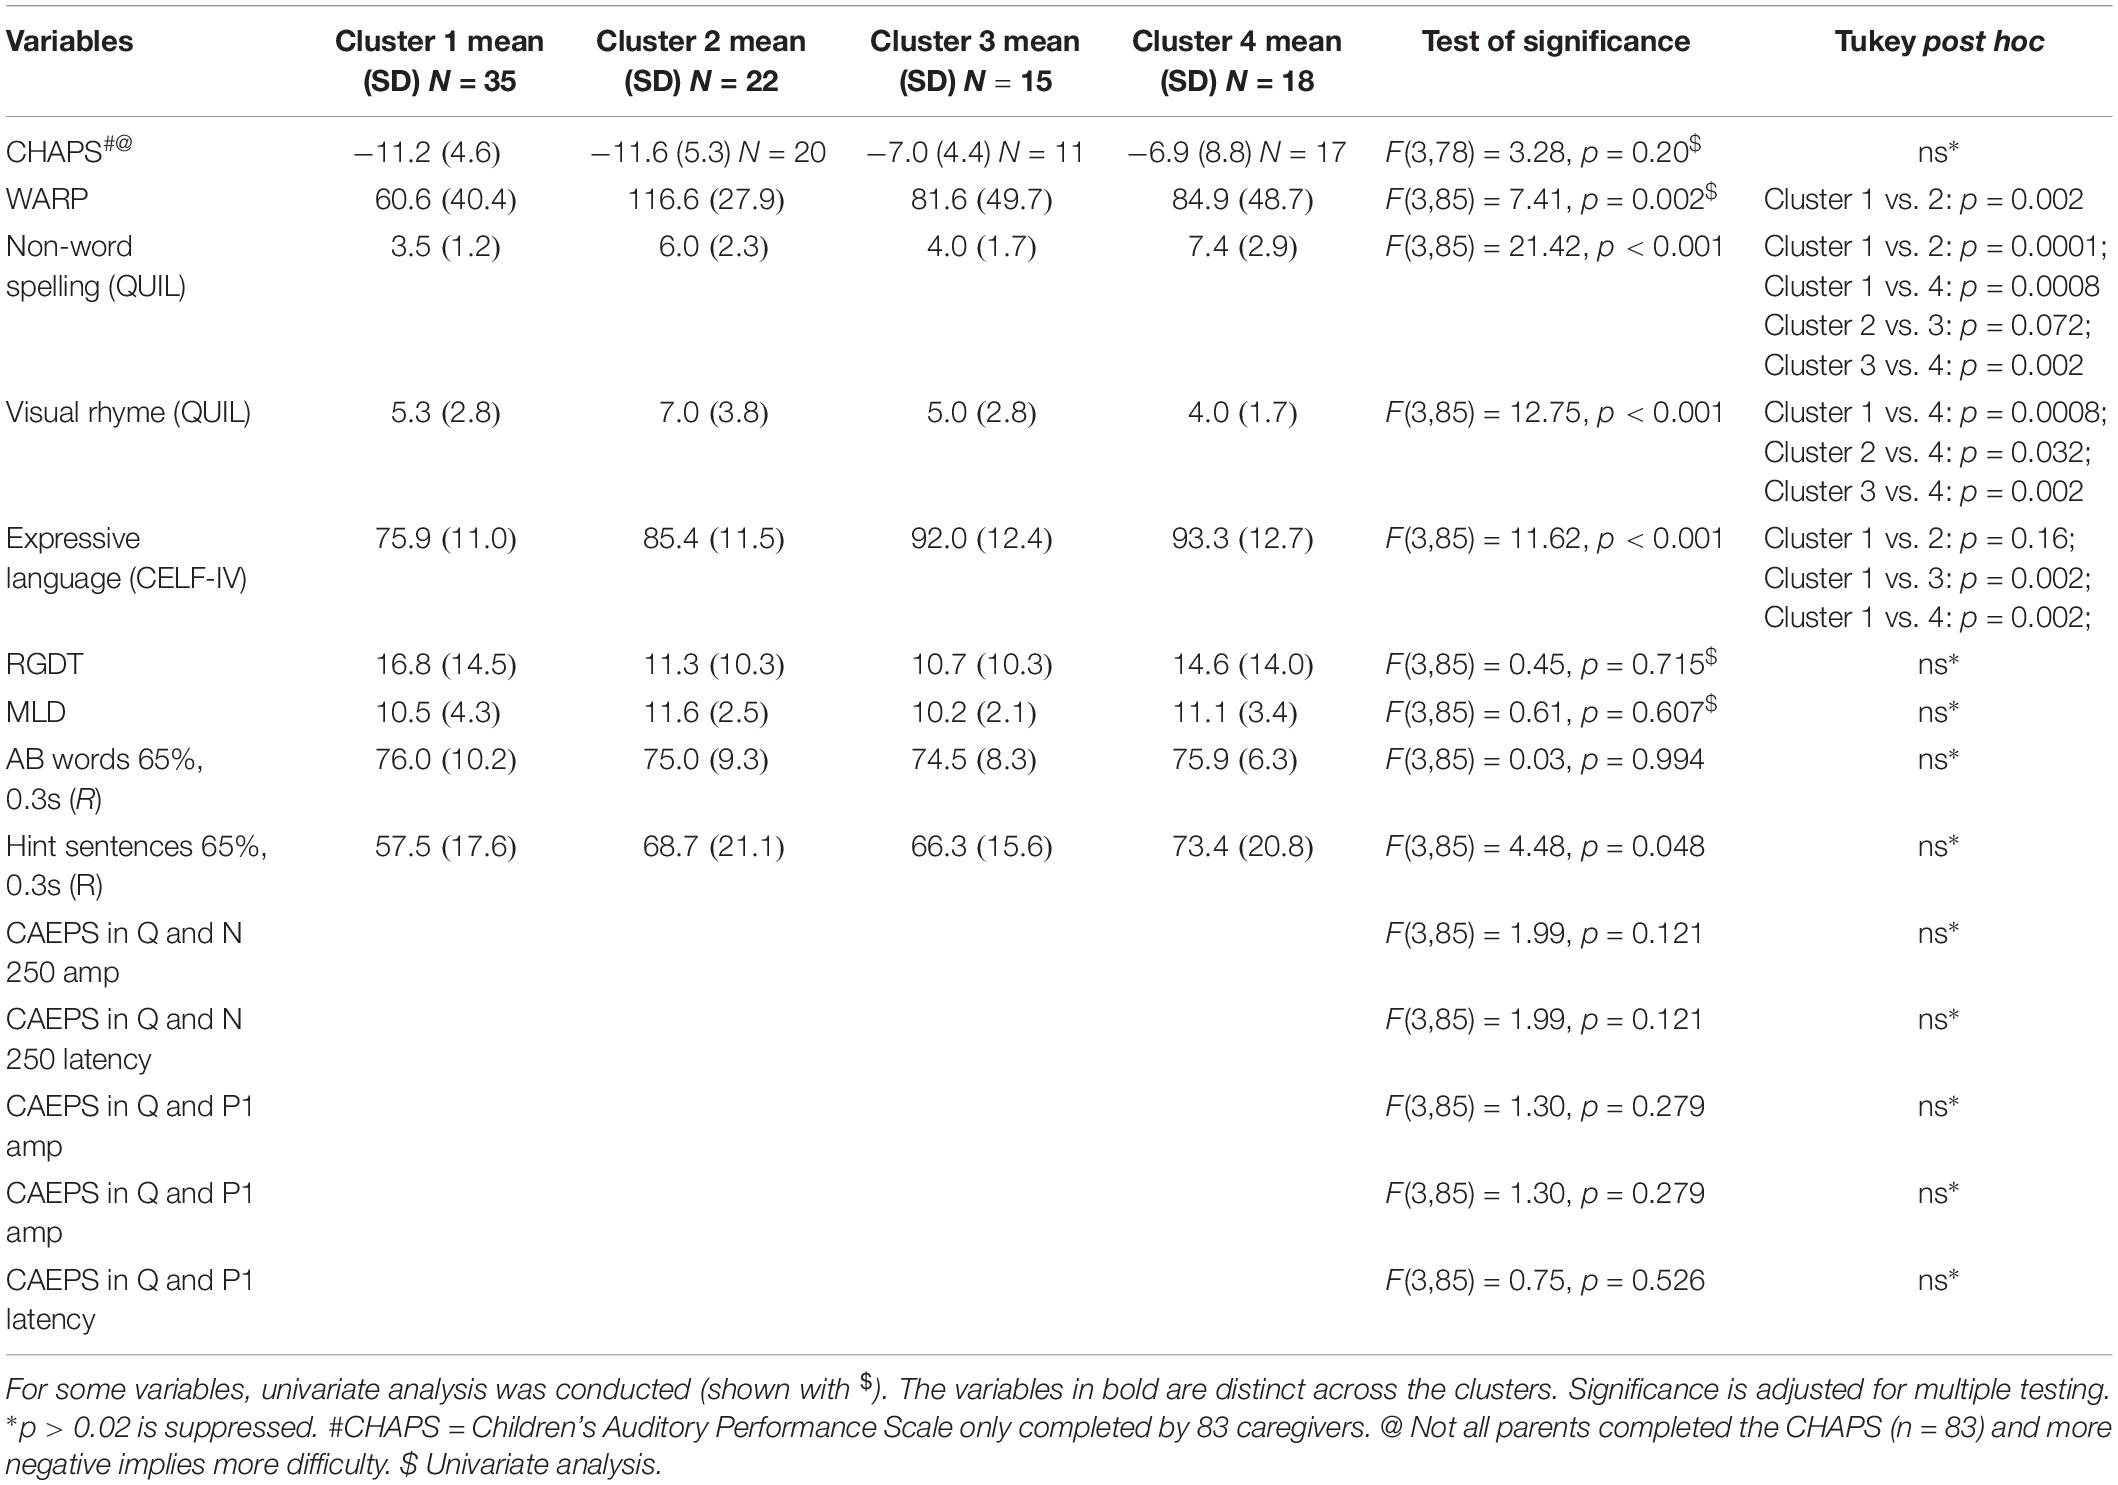
Table 5. Clusters in predicting reading, auditory processing performance, only significant results on ANOVA are shown.
Four clusters emerged based on ten tasks included in the cluster analysis. To determine differences between clusters, each skill was scaled against the mean to determine the proportion of children with relatively poor results for the different areas included in the cluster analysis.
Cluster 1 included 35 children who showed overall poor scores on reading, language, and cognitive measures. Dichotic scores were also impacted relatively more in this group compared to other clusters. This cluster of children appear to have global deficits across all domains. All children had scores more than 1 SD below the overall mean (N = 90) for more than one measure (Tables 4A,B). One quarter of the children in this cluster had TONI standard scores of 80–85 (a standard score of 80 was the lower limit for study inclusion), and 63% had scores more than 1 SD below the mean for sustained auditory attention. About half of the Cluster 1 parents (51%) reported that their children had significant listening difficulties based on the CHAPS scoring criterion proposed by Smoski et al. (1998) (overall score < −11). Children within this cluster also showed performance 2 SD below the mean on FPT (n = 12, 34%), DDT (n = 3, 9%) or both (n = 19, 54%). Pearson’s partial correlations within the cluster exploring associations between cognitive, reading, and language skills, and DDT and FPT auditory processing measures (with age as covariate) showed no significant associations (with Bonferroni adjustments).
Cluster 2 included 22 children with good reading and good phonological processing skills. Only one child had a TONI score more than 1 SD below the mean and this child had high reading and phonological skills. Another child had a score more than 2 SD below the mean for the digit span backward test but had average language, reading, and phonological processing scores. Auditory processing skills measured using the FPT and DDT showed that 27% of this group only had FPT scores that were more than 2 SD below the mean, 18% only had DDT scores more than 2 SD below the mean, while 27% had poor performance on both the FPT and DDT. This cluster includes children with auditory processing difficulties in the presence of relatively good reading and phonological processing skills and, like Cluster 1, the CHAPS showed that half of the children in this cluster had parent-reported listening difficulties (overall score < −11) (Smoski et al., 1998). This cluster showed a moderate and significant partial correlation (age as covariate) between non-word reading and paragraph reading (r = 0.58, p = 0.048).
Cluster 3 included 15 children with relatively high non-verbal IQ scores, and good phonological processing and word reading. Thirty percent of children in this cluster had FPT scores that were more than 2 SD below the mean, while 13% only had DDT scores that were more than 2 SD below the mean, and 40% of children had scores 2 SD below the mean for both FPT and DDT. Four children with scores more than 2 SD below the mean for FPT and DDT also showed scores 1 SD below the mean on sustained auditory attention and working memory (backward digit span) tasks. In general, this cluster had good TONI and language skills with poor auditory processing and poor attention and memory and about 27% of parents (3/11 who completed the questionnaire) reported listening difficulties based on the CHAPS criterion. For this cluster, the DDT showed a significant partial correlation (age as covariate) with digit span forward scores (r = 0.69, p = 0.048).
Cluster 4 included 18 children mostly with at least average scores on all tasks other than FPT. Three children who showed DDT deficits with scores more than 2 SD below the norm also showed difficulties with the FPT. Forty four percent of children had difficulties only on FPT and seven of these also had poor sustained attention deficits. This cluster represents children with good memory, word reading, and language skills, combined with poor FPT scores and sustained attention. For cluster 4, 35% of the parents (6/17) reported listening difficulties based on responses to the CHAPS questionnaire. Although not significant, a trend was observed for an association between non-word reading and phonological processing (r = 0.62, p = 0.064) and between Core Language and paragraph reading (WARP, r = 0.62, p = 0.064).
Children with suspected APDs have been reported to differ from control group children without auditory difficulties on measures of attention, memory, reading and/or language skills. Comorbidity of APDs with other neurodevelopmental conditions is a norm rather than an exception (Sharma et al., 2009; Musiek et al., 2010; Tomlin et al., 2015); the proportion of children with co-occurring conditions varies across studies but is typically about 40–50% (Sharma et al., 2009; Ferguson et al., 2011). Variations are likely to reflect sampling and test protocol differences across studies. These studies have largely been cross-sectional and have used simple group comparisons, analysis of variance, and regression and correlation analyses to demonstrate links between different domains of neurodevelopmental difficulties.
A cluster analysis is unsupervised, in other words, it does not employ any a priori restrictions. Consequently, cluster analysis offers an advantage over other approaches in determining distinct groups based on dominant features or common skills (Clatworthy et al., 2005; Chiarello et al., 2012). The current analyses provide evidence for the validity of four clusters of children amongst the 90 children referred to the study with suspected APDs. These clusters differentiate largely based on backward digit span, phonological processing, and non-verbal intelligence with smaller contributions from irregular word reading, forward digit span, DDT, and FPT.
The cluster analysis does not provide any information on causal relationships, instead the purpose of the clusters is to determine common links and associations within groups of participants presenting with similar difficulties (i.e., listening complaints in the current study). Cluster 1 is the only group showing global difficulties across all domains. The remaining groups all have areas of strength as well as difficulties. The question arises – what makes Cluster 1 different. It is possible that the executive function is the missing link that may explain the poor performance overall of Cluster 1. In a recent paper Snowling et al. (2018) suggested that difficulties with executive control might explain the widely reported associations between language, reading and auditory processing difficulties. Partial correlations were not significant in this cluster and hence do not support a link such as this between these skills, however, this may be due to the relatively small sample in Cluster 1.
An alternative view is that all children (N = 90) within this cohort are similar and the differences in their profiles are due to strengths the children have developed, which could be compensatory or as a result of previous training or therapy. The children in the current study participated in the research when they were at least 7 years old. There were no reports of any injury or medical misadventure to account for the auditory processing concerns and, therefore, one can assume that all these children have a “developmental” APD (Moore et al., 2013). Could the current clusters be the consequence of individual compensatory mechanisms? At present, there are no empirical data to answer this question; however, future longitudinal research could consider this question regarding the effects of variations in intervention, neuroplasticity, and maturation on the profile of skills in children with auditory processing difficulties. According to the questionnaire completed by the parents, all children showed mild to extreme deficits on CHAPS, irrespective of their groups. A longitudinal study with intervention for younger children presenting with auditory processing difficulties (e.g., 5–6 year olds) might be the best way to determine validity of these clusters and to better understand the casual relation (if it exists) between cognitive skills including attention and memory, auditory processing, and language. Leppänen et al. (2010) found electrophysiological evidence for atypical processing of sound frequency in newborns who were later identified as having phonological, reading, and language difficulties.
Another noteworthy finding is the presence of poor FPT and DDT performance in the presence of good reading and phonological processing in Cluster 2. This is an important finding as it challenges the framework suggested by Tallal or Goswami that the auditory processing link to word reading is mediated by phonological processing (Ramus, 2003). It also challenges the proposal that executive control links language, auditory processing, and reading (Snowling et al., 2018). Overall, children in Cluster 2 showed good attention and memory skills. Cluster 2, therefore, appears to be a subgroup of children who have poor auditory processing skills not linked to reading, language, memory, or attention.
Children in Cluster 3 had poor FPT, attention, and memory scores in the presence of relatively good TONI, language, and reading skills. Based on structural equation modeling, Snowling et al. (2018) observed that executive function was predictive of frequency discrimination; therefore, it is possible that, as was the case for Cluster 1, this group could have poor executive function. The FPT test encompasses a range of skills, however, in addition to frequency discrimination, including pattern perception and verbal reporting skills, so this finding may be unrelated to the frequency discrimination aspect of the task.
Cluster 4 is somewhat similar to Cluster 3 as both groups exhibit poor performance on FPT and poor attention skills. However, Clusters 3 and 4 differ in their backward digit span scores, with Cluster 4 showing higher performance compared to Cluster 3. Poor attention is not an obvious explanation for poor auditory processing, as children in Cluster 2 had poor auditory processing despite the presence of good attention skills. While attention has been linked with performance on the AP tasks in general (Moore et al., 2010), sustained attention has not been found to contribute to the performance on the FPT (Gyldenkærne et al., 2014; Tomlin et al., 2015).
The participants in this study are likely to be representative of the children referred for clinical evaluation of auditory processing (since referrals to the research came from a range of professionals and parents). Consequently, the four clusters may be representative of children with suspected APD, but the identified clusters are unlikely to be the only ones that exist in the population of children with neurodevelopmental difficulties affecting learning and behavior. Despite this limitation, there are some potential benefits of identifying these subgroups of children presenting for auditory processing assessment. The distinct clusters identified in the current study highlight the heterogeneity of children with suspected APD, and this result encourages clinicians to ensure assessments span all the domains examined here, especially those that contributed most to the separation of the clusters, namely working memory (backward digit span), non-verbal IQ, non-word reading, and phonological processing. Assessment of these areas in children with a diagnosis of APD could assist clinicians to choose appropriate referral pathways and treatments.
Although all groups included children with APD and parent-rated listening difficulties based on the CHAPS questionnaire, some children might make better functional gains if their specific phonological processing, reading, and/or other difficulties are targeted. For instance, Cluster 1 might benefit from referral to a psychologist for cognitive assessment that includes measures of executive control and is likely to need a broad range of supports. Audiologists would best manage children in Cluster 2. Clusters 3 and 4 could benefit from auditory training delivered by an audiologist or speech pathologist and a psychologist would be able to conduct more comprehensive attention and memory assessment and management suggestions. Although this suggests a different pathway for each cluster, all children presented with listening difficulties, and hence all are likely to benefit from treatments such as personal remote microphone technology to improve the signal to noise ratio in difficult listening situations (Sharma et al., 2012).
Leppänen et al. (2010) identified auditory insensitivity 3–5 days after birth in about half of the infants they tested with familial risk for dyslexia, using a mismatch negativity paradigm (event-related potential response to infrequently presented 1100 Hz deviant sinusoidal stimulus among frequently presented 1000 Hz sinusoidal stimulus). They found that about half of the participants in this longitudinal study had impaired differentiation of basic pitch changes at birth and these children were later diagnosed with dyslexia; the other half of the children with normal mismatch negativity responses in infancy did not have problems in reading acquisition when tested 8 years later. This paper highlights the possibility of earlier identification of auditory difficulties using electrophysiological approaches. This would allow the possibility of early interventions targeted at enhancing auditory processing that might prevent later literacy difficulties. This could change the profiles of children with APD in the future.
Cluster analysis is an unbiased way to determine subgroups; there are some limitations, however. For instance, the participating 90 children created the current four clusters, and validation using a different, larger sample would be useful to confirm the characteristics of the clusters. With a larger sample, the details of the clustering might change (as in, some children could be assigned to a different cluster if the data looked a bit different, or different tests were included), but the overall differences between clusters identified in the current study are sufficiently pronounced that the interpretation of the subgroups identified here may not change. With a larger sample, the stability of the clusters could be determined by comparing the clustering of the original data set with the clustering obtained on subsamples or with a completely new data set (Levine and Domany, 2001).
The clusters did not differ in the balance of boys to girls (Chi-square = 1.31, p = 0.73), although there were more males than females overall. There was a trend for two clusters (Clusters 1 and 4) to be slightly younger [F(1, 3) = 3.02, p = 0.034] than the other two, however. Higher numbers with equal gender proportions to account for slight age and gender variations may assist in generalization of the clusters.
In the current cluster analysis only two auditory processing measures with established age norms were included (FPT and DDT). Inclusion of other auditory skills, such as spatial listening (LISN-S) (Cameron and Dillon, 2007) or temporal or frequency discrimination (Moore et al., 2010) might yield different results if these auditory skills are more strongly linked than FPT and DDT to cognition and other skill areas. In future research, it would be useful to include a wider range of norm-referenced auditory processing measures that capture the range of auditory skills typically included in the clinical auditory processing test battery. Due to the complexity of reading disorders (Horbach et al., 2019), a more detailed assessment of reading abilities and potential underlying deficits such as temporal or phonological processing might also affect cluster membership.
It is possible that children with neurodevelopmental disorders will show evidence of different difficulties at different ages, even if deficits were solely in the auditory domain at an early age. More longitudinal research is needed to establish the stability of clusters over time as it is possible that training of specific cognitive and/or auditory skills would give rise to different results over time.
The datasets analyzed in this manuscript are not publicly available. Requests to access the datasets should be directed tobXJpZHVsYS5zaGFybWFAbXEuZWR1LmF1.
The studies involving the human participants were reviewed and approved by the University of Auckland Human Research Participants’ Ethics Committee. Written informed consent to participate in this study was provided by the participants’ legal guardian/next of kin and verbal assent from all participating children was also gathered.
MS: the concept of the project, data analysis, and writing of the manuscript. SP: the concept of the project and editorial of the manuscript. PH: advising on the data analysis and editorial of the manuscript.
The authors declare that the research was conducted in the absence of any commercial or financial relationships that could be construed as a potential conflict of interest.
The authors like to thank all the participants and their families and Prof. Harvey Dillon for advising on the analyses.
The Supplementary Material for this article can be found online at: https://www.frontiersin.org/articles/10.3389/fpsyg.2019.02481/full#supplementary-material
APD, auditory processing disorder; TONI, test of nonverbal intelligence; PA, phonological awareness; FPT, Frequency Pattern Test; DDT, Dichotic Digits Test.
American Speech and Hearing Association [ASHA] (1996). Central auditory processing: current status of research and implications for clinical practice. Am. J. Audiol. 5, 41–52. doi: 10.1044/1059-0889.0502.41
American Speech Language Hearing Association (2005). (Central) Auditory Processing Disorders – The Role of the Audiologist. Available at: www.asha.org/policy
Bellis, T. J., and Ferre, J. M. (1999). Multidimensional Approach to. J. Am. Acad. Audiol. 10, 319–328.
Bishop, D. (2007). Using mismatch negativity to study central auditory processing in developmental language and literacy impairments: where are we, and where should we be going? Psychol. Bull. 133, 651–672. doi: 10.1037/0033-2909.133.4.651
Brown, L., Sherbenou, R. J., and Johnsen, S. K. (1990). Test of Nonverbal Intelligence: A Language-Free Measure of Cognitive Ability. Austin, TX: PRO-ED.
Cameron, S., and Dillon, H. (2007). Development of the listening in spatialized noise-sentences test (LISN-S). Ear Hear. 28, 196–211. doi: 10.1097/aud.0b013e318031267f
Carrow-Woolfolk, E. (1999). CASL: Comprehensive Assessment of Spoken Language. Circle Pines, MN: American Guidance Services.
Castles, A., and Coltheart, M. (1993). Varieties of developmental dyslexia. Cognition 47, 149–180. doi: 10.1016/0010-0277(93)90003-e
Chermak, G. D., Tucker, E., and Seikel, J. A. (2002). Behavioral characteristics of auditory processing disorder and attention-deficit hyperactivity disorder: predominantly inattentive type. J. Am. Acad. Audiol. 13, 332–338.
Chiarello, C., Welcome, S. E., and Leonard, C. M. (2012). Individual differences in reading skill and language lateralisation: a cluster analysis. Laterality 17, 225–251. doi: 10.1080/1357650X.2011.561860
Clatworthy, J., Buick, D., Hankins, M., Weinman, J., and Horne, R. (2005). The use and reporting of cluster analysis in health psychology: a review. Br. J. Health Psychol. 10, 329–358. doi: 10.1348/135910705x25697
Dodd, B., Holm, A., Orelemans, M., and McCormick, M. (1996). QUIL: Queensland University Inventory of Literacy. Brisbane: The University of Queensland.
Emanuel, D. C., Ficca, K. N., and Korczak, P. (2011). Survey of the diagnosis and management of auditory processing disorder. Am. J. Audiol. 20, 48–60. doi: 10.1044/1059-0889(2011/10-0019)
Ferguson, M. A., Hall, R. L., Riley, A., and Moore, D. R. (2011). Communication, listening, cognitive and speech perception skills in children with auditory processing disorder (APD) or specific language impairment (SLI). J. Speech Lang. Hear. Res. 54, 211–227. doi: 10.1044/1092-4388(2010/09-0167)
Gilley, P. M., Sharma, M., and Purdy, S. C. (2016). Oscillatory decoupling differentiates auditory encoding deficits in children with listening problems. Clin. Neurophysiol. 127, 1618–1628. doi: 10.1016/j.clinph.2015.11.003
Goswami, U. (2011). A temporal sampling framework for developmental dyslexia. Trends Cogn. Sci. 15, 3–10. doi: 10.1016/j.tics.2010.10.001
Gyldenkærne, P., Dillon, H., Sharma, M., and Purdy, S. C. (2014). Attend to this: the relationship between auditory processing disorders and attention deficits. J. Am. Acad. Audiol. 25, 676–687. doi: 10.3766/jaaa.25.7.6
Halliday, L. F., Tuomainen, O., and Rosen, S. (2017). Auditory processing deficits are sometimes necessary and sometimes sufficient for language difficulties in children: evidence from mild to moderate sensorineural hearing loss. Cognition 166, 139–151. doi: 10.1016/j.cognition.2017.04.014
Hämäläinen, J. A., Salminen, H. K., and Leppänen, P. H. (2013). Basic auditory processing deficits in dyslexia: systematic review of the behavioral and event-related potential/field evidence. J. Learn. Disabil. 46, 413–427. doi: 10.1177/0022219411436213
Horbach, J., Mayer, A., Scharke, W., Heim, S., and Günther, T. (2019). Development of behavior problems in children with and without specific learning disorders in reading and spelling from kindergarten to fifth grade. Sci. Stud. Read. 1–15. doi: 10.1080/10888438.2019.1641504
Iliadou, V. V., Ptok, M., Grech, H., Pedersen, E. R., Brechmann, A., Deggouj, N., et al. (2018). European 17 countries consensus endorses more approaches to APD than reported in Wilson, 2018. Int. J. Audiol. 57, 395–396. doi: 10.1080/14992027.2018.1442937
Jerger, J. (1970). Clinical experience with impedance audiometry. Arch. Otolaryngol. 92, 311–324. doi: 10.1001/archotol.1970.04310040005002
Jerger, J., Brown, D., and Smith, S. (1984). Effect of peripheral hearing loss on the masking level difference. Arch. Otolaryngol. 110, 290–296. doi: 10.1001/archotol.1984.00800310014003
Jerger, J., and Musiek, F. (2000). Report of the consensus conference on the diagnosis of auditory processing. J. Am. Acad. Audiol. 11, 467–474.
Keith, W., Purdy, S. C., Baily, M., and Kay, F. (2019). New Zealand Guidelines on Auditory Processing Disorder. Available at: https://www.audiology.org.nz/: New Zealand Audiological Society (accessed May 31, 2019).
Kelly, A. (2007). Normative data for behavioural tests of auditory processing for New Zealand school children aged 7 to 12 years. Aust. N. Z. J. Audiol. 29, 60–64. doi: 10.1375/audi.29.1.60
Leppänen, P. H., Hämäläinen, J. A., Salminen, H. K., Eklund, K. M., Guttorm, T. K., Lohvansuu, K., et al. (2010). Newborn brain event-related potentials revealing atypical processing of sound frequency and the subsequent association with later literacy skills in children with familial dyslexia. Cortex 46, 1362–1376. doi: 10.1016/j.cortex.2010.06.003
Levine, E., and Domany, E. (2001). Resampling method for unsupervised estimation of cluster validity. Neural Comput. 13, 2573–2593. doi: 10.1162/089976601753196030
Madelaine, A., and Wheldall, K. (1998). Towards a curriculum-based passage reading test for monitoring the performance of low-progress readers using standardised passages: a validity study. Educ. Psychol. 18, 471–478. doi: 10.1080/0144341980180408
Mealings, K., and Cameron, S. (2019). Investigating auditory spectral and temporal resolution deficits in children with reading difficulties. J. Am. Acad. Audiol. 30, 533–543. doi: 10.3766/jaaa.17142
Moore, D. R., Ferguson, M. A., Edmondson-Jones, A. M., Ratib, S., and Riley, A. (2010). Nature of auditory processing disorder in children. Pediatrics 126, e382–e390. doi: 10.1542/peds.2009-2826
Moore, D. R., Rosen, S., Bamiou, D.-E., Campbell, N. G., and Sirimanna, T. (2013). Evolving concepts of developmental auditory processing disorder (APD): a British society of audiology APD special interest group “white paper.”. Int. J. Audiol. 52, 3–13. doi: 10.3109/14992027.2012.723143
Musiek, F. E. (1983). Assessment of central auditory dysfunction: the dichotic digit test revisited. Ear Hear. 4, 79–83. doi: 10.1097/00003446-198303000-00002
Musiek, F. E. (1994). Frequency (pitch) and duration pattern tests. J. Am. Acad. Audiol. 5, 265–265.
Musiek, F. E., Baran, J. A., Bellis, T. J., Chermak, G. D., Hall, J. W., Keith, R. W., et al. (2010). Guidelines for the diagnosis, treatment and management of children and adults with central auditory processing disorder. Am. Acad. Audiol. 1–50.
Purdy, S. C., Sharma, M., and Morgan, A. (2018). Measuring perceptions of classroom listening in typically developing children and children with auditory difficulties using the LIFE-UK questionnaire. J. Am. Acad. Audiol. 29, 656–667. doi: 10.3766/jaaa.17053
Ramus, F. (2003). Developmental dyslexia: specific phonological deficit or general sensorimotor dysfunction? Curr. Opin. Neurobiol. 13, 212–218. doi: 10.1016/s0959-4388(03)00035-7
Richardson, U., Thomson, J. M., Scott, S. K., and Goswami, U. (2004). Auditory processing skills and phonological representation in dyslexic children. Dyslexia 10, 215–233. doi: 10.1002/dys.276
Sandford, J., and Turner, A. (2000). Integrated Visual and Auditory Continuous Performance Test Manual. Richmond, VA: Braintrain Inc.
Sandford, J. A., and Turner, A. (1995). Manual for the Integrated Visual and Auditory Continuous Performance Test. Richmond: Braintrain.
Semel, E., Wiig, E., and Secord, W. (2003). Clinical Evaluation of Language Fundamentals (CELF-4). San Antonio, TX: The psychological corporation.
Sharma, M., Cupples, L., and Purdy, S. C. (2019). Predictors of reading skills in children with listening concerns. Ear. Hear. 40, 243–252. doi: 10.1097/AUD.0000000000000608
Sharma, M., Dhamani, I., Leung, J., and Carlile, S. (2014a). Attention, memory, and auditory processing in 10-to 15-year-old children with listening difficulties. J. Speech Lang. Hear Res. 57, 2308–2321. doi: 10.1044/2014_JSLHR-H-13-0226
Sharma, M., Purdy, S., and Kelly, A. (2014b). The contribution of speech-evoked cortical auditory evoked potentials to the diagnosis and measurement of intervention outcomes in children with auditory processing disorder. Semin. Hear. 35, 51–64.
Sharma, M., Purdy, S., and Kelly, A. (2012). A randomized control trial of interventions in school-aged children with auditory processing disorders. Int. J. Audiol. 51, 506–518. doi: 10.3109/14992027.2012.670272
Sharma, M., Purdy, S., Newall, P., Wheldall, K., Beaman, R., and Dillon, H. (2006). Electrophysiological and behavioral evidence of auditory processing deficits in children with reading disorder. Clin. Neurophysiol. 117, 1130–1144. doi: 10.1016/j.clinph.2006.02.001
Sharma, M., Purdy, S. C., and Kelly, A. S. (2009). Comorbidity of auditory processing, language, and reading disorders. J. Speech Lang. Hear. Res 52, 706–722. doi: 10.1044/1092-4388(2008/07-0226)
Silman, S., and Gelfand, S. A. (1981). The relationship between magnitude of hearing loss and acoustic reflex threshold levels. J. Speech Hear. Dis. 46, 312–316. doi: 10.1044/jshd.4603.312
Smoski, W., Brunt, M. A., and Tannahill, J. C. (1998). Children’s Auditory Performance Scale (CHAPS). Tampa, FL: Educational Audiology Association.
Snowling, M. J., Gooch, D., McArthur, G., and Hulme, C. (2018). Language skills, but not frequency discrimination, predict reading skills in children at risk of dyslexia. Psychol. Sci. 29, 1270–1282. doi: 10.1177/0956797618763090
Sweetow, R., and Reddell, R. (1978). The use of masking level differences in the identification of children with perceptual problems. J. Am. Aud. Soc. 4, 52–56.
Taylor, R. (1990). Interpretation of the correlation coefficient: a basic review. J. Diagn. Med. Sonogr. 6, 35–39. doi: 10.1177/875647939000600106
Tomlin, D., Dillon, H., Sharma, M., and Rance, G. (2015). The impact of auditory processing and cognitive abilities in children. Ear Hear 36, 527–542. doi: 10.1097/AUD.0000000000000172
Keywords: auditory processing disorders, cluster, subgroup, memory, attention, reading, language
Citation: Sharma M, Purdy SC and Humburg P (2019) Cluster Analyses Reveals Subgroups of Children With Suspected Auditory Processing Disorders. Front. Psychol. 10:2481. doi: 10.3389/fpsyg.2019.02481
Received: 19 June 2019; Accepted: 21 October 2019;
Published: 15 November 2019.
Edited by:
K. Jonas Brännström, Lund University, SwedenReviewed by:
Tone Stokkereit Mattsson, Ålesund Hospital, NorwayCopyright © 2019 Sharma, Purdy and Humburg. This is an open-access article distributed under the terms of the Creative Commons Attribution License (CC BY). The use, distribution or reproduction in other forums is permitted, provided the original author(s) and the copyright owner(s) are credited and that the original publication in this journal is cited, in accordance with accepted academic practice. No use, distribution or reproduction is permitted which does not comply with these terms.
*Correspondence: Mridula Sharma, bXJpZHVsYS5zaGFybWFAbXEuZWR1LmF1
Disclaimer: All claims expressed in this article are solely those of the authors and do not necessarily represent those of their affiliated organizations, or those of the publisher, the editors and the reviewers. Any product that may be evaluated in this article or claim that may be made by its manufacturer is not guaranteed or endorsed by the publisher.
Research integrity at Frontiers

Learn more about the work of our research integrity team to safeguard the quality of each article we publish.