 Eun-Young Mun
 Yan Huo2
- 1University of North Texas Health Science Center, Fort Worth, TX, United States
- 2Educational Testing Service, Princeton, NJ, United States
- 3Rutgers University Center of Alcohol Studies, Piscataway, NJ, United States
- 4The University of Hong Kong, Pokfulam, Hong Kong
Many clinical and psychological constructs are conceptualized to have multivariate higher-order constructs that give rise to multidimensional lower-order traits. Although recent measurement models and computing algorithms can accommodate item response data with a higher-order structure, there are few measurement models and computing techniques that can be employed in the context of complex research synthesis, such as meta-analysis of individual participant data or integrative data analysis. The current study was aimed at modeling complex item responses that can arise when underlying domain-specific, lower-order traits are hierarchically related to multiple higher-order traits for individual participant data from multiple studies. We formulated a multi-group, multivariate higher-order item response theory (HO-IRT) model from a Bayesian perspective and developed a new Markov chain Monte Carlo (MCMC) algorithm to simultaneously estimate the (a) structural parameters of the first- and second-order latent traits across multiple groups and (b) item parameters of the model. Results from a simulation study support the feasibility of the MCMC algorithm. From the analysis of real data, we found that a bivariate HO-IRT model with different correlation/covariance structures for different studies fit the data best, compared to a univariate HO-IRT model or other alternate models with unreasonable assumptions (i.e., the same means and covariances across studies). Although more work is needed to further develop the method and to disseminate it, the multi-group multivariate HO-IRT model holds promise to derive a common metric for individual participant data from multiple studies in research synthesis studies for robust inference and for new discoveries.
Introduction
Item response theory (IRT; Hambleton and Swaminathan, 1985; Van der Linden and Hambleton, 1997; Embretson and Reise, 2000) is a modern psychometric theory that provides a statistical modeling framework for expressing observed item responses as a function of latent (unobserved) traits (e.g., abilities, attributes, psychological constructs). IRT has been extensively used in educational testing and measurement, psychological assessment, and health outcomes measurement (Bartolucci et al., 2015; Gibbons et al., 2016). The present study draws from the IRT literature to retrospectively establish a common metric across independently conducted studies with different items and response options. Having a common metric or understanding of how scores from different studies can be made comparable is important in comparative effectiveness research. However, in part because it is difficult to observe and quantify unobserved latent traits, different measures for assessing the same trait have proliferated in the literature. For example, more than 280 different depression scales have been developed and used in the past century (Fried and Flake, 2018). Any measurement differences between studies ultimately need to be taken into account when interpreting effect sizes. However, it is virtually impossible to empirically tease apart the sources of between-study heterogeneity because study-level differences are often confounded with one another (e.g., some of the trials aimed at seriously ill patients may have used outcome measures intended to capture more serious symptoms). Consequently, any resulting interpretation of treatment effect sizes obtained from studies that used different outcome measures would be subjective and difficult to verify. Therefore, combining effect sizes from different outcome measures in meta-analysis has long been discouraged (Hedges and Olkin, 1985).
Prospectively, it is possible to link different items from multiple surveys and questionnaires by testing them using the single group design or the anchor test design (Streiner et al., 2015; e.g., Choi et al., 2014 for depression). Other non-IRT methods also exist to link items. However, the existing approaches have limited utility when there is no established “standard” metric to compare measures against, and when the number of utilized measures is high because it would be impractical to study all measures. More important, these approaches require preplanning to establish measurement equivalence in a separate investigation. Therefore, there is a need for new methods and approaches that directly address the measurement challenge for meta-analysis studies combining individual participant data (IPD) or for integrative data analysis (IDA; Curran and Hussong, 2009).
Advances in IRT and Challenges for IPD Meta-Analysis
Traditionally, IRT involves a unidimensional underlying trait, denoted as θ. The two most basic and common unidimensional IRT models are the Rasch model and the two-parameter logistic (2PL) model. There are two major assumptions involved in IRT—unidimensionality and local independence. The unidimensionality assumption of IRT requires that a single latent dimension θ substantially accounts for the way participants respond to items. The local independence assumption describes that items should be conditionally independent given θ. The IRT models for binary item response can be extended to accommodate polytomous item response in a number of related models (Bacci et al., 2014).
Further, as an extension of the unidimensional IRT model, multidimensional IRT (MIRT) models can accommodate joint modeling of multiple dimensions, typically expressed as θ. The bifactor IRT model (Gibbons and Hedeker, 1992) is one of the most well-known MIRT models. Although MIRT models have greater generality and may provide greater flexibility in real data applications, they are associated with more complexity in terms of both model parameterization and estimation, compared to traditional unidimensional IRT models. MIRT models can also be modified to accommodate multidimensional discrete latent traits (instead of continuous latent traits θ) so that the lower-order latent traits are construed as latent classes, which can be seen as a latent class IRT model. A number of studies pertaining to multidimensional latent class IRT models have become available in recent years. For example, Bartolucci (2007) proposed a class of MIRT models that measures discrete latent traits in the context of binary items. More recently, Gnaldi et al. (2016) extended the model to incorporate item response data nested within students that are nested in schools.
More broadly, there are a number of new IRT models and factor analysis (FA) models and software programs that can account for multidimensional data with a higher-order structure (e.g., Sheng and Wikle, 2008; de la Torre and Song, 2009; de la Torre and Hong, 2010; Huang and Wang, 2013, 2014; Huang et al., 2013; Rijmen et al., 2014). Other recent models can also accommodate respondents' or testlets' effects in multilevel, multi-group, and/or mixture IRT models (e.g., van der Linden, 2007; Klein Entink et al., 2009; Cho and Cohen, 2010; Azevedo et al., 2015; Camilli and Fox, 2015; Fox and Marianti, 2016; Schmidt et al., 2016). In addition, Bayesian estimation is possible using general purpose software programs, such as Mplus (with Bayes estimator; Muthén and Muthén, 1998-2018), Stan (Bürkner, 2017), or WinBUGS (Lunn et al., 2000).
Despite the advances noted above, it is challenging to apply existing IRT or FA models and associated computing algorithms to item-level IPD obtained from independently conducted studies (see Huo et al., 2015; Mun et al., 2015). Some of the major challenges include study-level missing data, limited item overlap across studies, and other between-study differences (Hussong et al., 2013; Mun et al., 2015). These challenges associated with analyzing IPD from multiple sources have been discussed extensively elsewhere (e.g., Hussong et al., 2013; Mun et al., 2015; Brincks et al., 2018; Siddique et al., 2018). In spite of the challenges, it is of critical importance that commensurate measures for participants from multiple studies be established as the first major step toward ensuring the same data interpretation across studies for IDA or meta-analysis of IPD.
Multivariate HO-IRT Model for Item Response Data From Multiple Studies
We focus on psychological constructs with a multivariate higher-order structure, which give rise to multidimensional lower-order traits in the present study. A multivariate higher-order item response theory (HO-IRT) model is developed to estimate trait scores of participants from multiple studies and tested using a Markov chain Monte Carlo (MCMC) estimation approach. We use the term “multidimensional” to indicate that multiple, possibly related traits give rise to observed item response data. A “hierarchical structure” or “higher-order structure” is said to exist when multiple lower-order traits can be expressed as function of an overall, higher-order trait. When there are two or more higher-order traits, a “multivariate” higher-order structure exists.
It has been noted that a lack of new methods and application examples to address the challenges of analyzing data from multiple studies has hindered the broader adoption of IDA by applied researchers despite its promise (Curran et al., 2017). On one hand, it is difficult to fully grasp the unique challenges of analyzing IPD from multiple studies and to be motivated to develop new methods and algorithms, yet; on the other hand, without the algorithms designed for IPD obtained from multiple studies, there would be no reports to share, resulting in a “catch 22” situation. If there were more options available, applied researchers could choose more appropriate analytic approaches to meet their needs in the context of subsequent analyses, which would be more preferable than either invoking unreasonable data assumptions or not considering research synthesis even when it is feasible (Mun and Ray, 2018).
In sum, the present study is aimed at addressing the aforementioned gaps in available methods by developing a multivariate HO-IRT model and associated computing algorithm. Our rationale for the development of the multivariate HO-IRT model is two-fold. First, many clinical and psychological constructs have been conceptualized to have multivariate higher-order constructs that give rise to multidimensional lower-order traits; yet most of the available measurement models for the purpose of analyzing existing data from multiple studies are unidimensional and non-hierarchical. Second, the multivariate HO-IRT model may be appealing for certain research applications because it estimates multiple trait scores at the higher-order, as well as lower-order, levels, thereby achieving data reduction. Having more options in our methodological tool box can empower researchers in the field of psychology in their pursuit of fully maximizing available data for new discoveries. In the following sections, we describe the multivariate HO-IRT model, MCMC estimation, results from a simulation study, and application results from a motivating data example.
Multivariate HO-IRT Model: Model Specification
In univariate HO-IRT models (de la Torre and Song, 2009; de la Torre and Hong, 2010), θ(d) is the domain-specific, first-order latent trait for the dth domain with d = 1, 2, …, D. The D dimensions of θ can be linked to a single overall latent trait ω via a weighted linear function: θi(d) = λ(d)ωi+εi(d), where the subscript [i] indexes participant, λ(d) is the regression coefficient, and εi(d) is the residual term conditioned on ωi. However, θ may not be sufficiently captured by a single overall latent trait. In such a case, we need to extend the univariate HO-IRT model to accommodate a vector of higher-order latent traits (i.e., ω) when describing relationships between first- and second-order latent traits. Figure 1 graphically shows the structure of the multivariate HO-IRT model for multiple groups with the subscript g indicating group (or study).
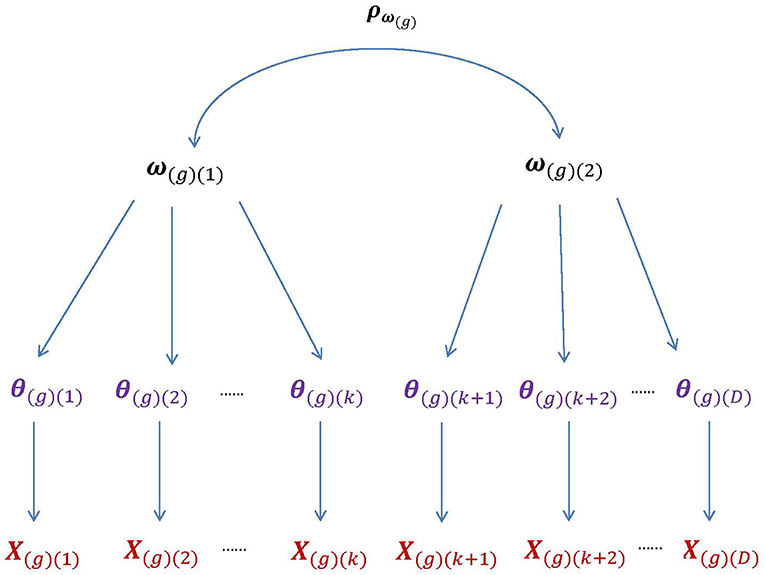
Figure 1. The higher-order structure of the bivariate HO-IRT model for multiple groups. The second-order latent trait for group g, ω(g), is bivariate with the correlation matrix ρω(g), whereas the first-order latent trait, θ(g), is D-dimensional. The first higher-order component, ω(g)(1), are related to the first k components (i.e., dimensions) of θ, whereas the second higher-order component, ω(g)(2), to the remaining (D − k) components. Further, the components of the first-order trait θ(g) are assumed to be independent conditional on the second-order traits ω(g).
In this paper, we use the hierarchical, multi-unidimensional two-parameter logistic item response theory (2PL-MUIRT) model as the item response function (Huo et al., 2015), where each item individually measures a single dimension and all items collectively measure the D dimensions of θ. Specifically,
where Xi(g)j(d) is the response of respondent i in group g to the jth item of the dth dimension; θi(g)(d) is the dth component of vector θig = {θi(g)(d)}; αj(d) and βj(d) are the discrimination and difficulty parameters, respectively, of the jth item of the dth dimension; j(d) = 1(d), 2(d), …, J(d); and . All item parameters are assumed to be the same across the g = 1, 2, …, G groups. The likelihood of the data matrix Xg (g = 1, 2, …, G) is given by
To take multiple groups into account, the following function can be used to connect θ to ω: θi(g)(d) = λ(g)(d)ωi(g)(h)+εi(g)(d). The subscript h = 1, 2, …, H denotes the hth dimension of ω. When H takes the value of 1, 2, or 3 or more, the multivariate HO-IRT model can be described specifically as univariate, bivariate, and multivariate models, respectively. Figure 2 shows the essential parameters of the multivariate HO-IRT model to be estimated from a Bayesian perspective. The proposed multivariate HO-IRT model shares the same item response function with the hierarchical 2PL-MUIRT model but differs in its approach to estimating covariance structures among first-order latent traits across groups. In the hierarchical 2PL-MUIRT model, the correlation or covariance structures of the first-order latent traits are directly estimated as unknown parameters. In contrast, in the proposed multivariate HO-IRT model, the correlation or covariance structures of first-order latent traits are estimated indirectly as a function of the estimated regression coefficients relating first-order traits to second-order traits and the variances of the first-order latent traits.
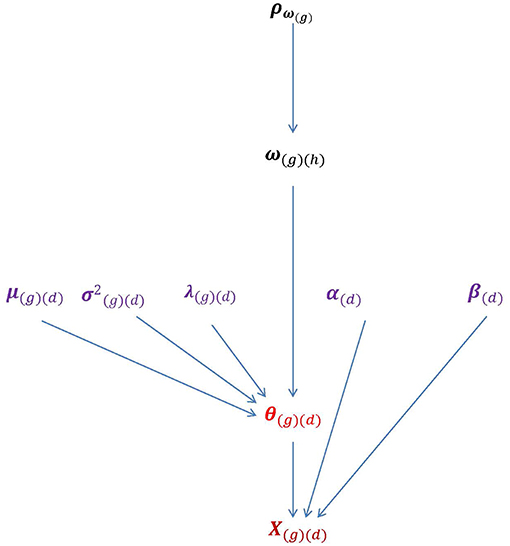
Figure 2. The parameters of the bivariate HO-IRT model for multiple groups. Lower-order trait scores θ(g)(d) can be seen as a direct function of higher-order latent traits ω(g)(h) and characterized by regression coefficients λ(g)(d) that relate θ(g)(d) to ω(g)(h) as well as by the mean vector and covariance matrices μ(g)(d) and . Item parameters αj(d) and βj(d) are also displayed.
Markov Chain Monte Carlo Estimation
Prior, Posterior, and Conditional Distributions
We use the hierarchical Bayesian formulation with the following prior distributions:
where μH was set to 0 and ΣH was a correlation matrix with the off-diagonal element set to 0.5;
where 4Beta indicates the four-parameter beta distribution with υ and ω as shape parameters and a and b as the location parameters defining the support of the distribution. ρω(g) needs to be transformed from Σω(g), which we describe later in this section. Here,
The priors were chosen based on previous studies (e.g., de la Torre and Patz, 2005; de la Torre and Song, 2009; Huo et al., 2015) and adapted to meet the goals of the current study.
The joint posterior distribution of interest is as follows:
which cannot be fully simplified into an explicit distribution from which samples can be drawn directly. Therefore, we decompose the joint posterior distribution into several full conditional distributions for samples to be drawn more easily by using either the direct sampling approach (i.e., Gibbs sampling; Casella and George, 1992) or the indirect sampling approach (i.e., Metropolis-Hasting [M-H] algorithm; e.g., Chib and Greenberg, 1995). The full conditional distribution of θ(g) is
The full conditional distribution of ω(g) is
The full conditional distribution of μ(g) is MVN (μ1(g), Σ1(g)), where the parameters can explicitly be expressed as
Samples can be drawn directly from this distribution using Gibbs sampling. The full conditional distribution of is
and similarly the full conditional distribution of λ(g) is
As previously noted, ρω(g) needs to be drawn from Σω(g), which has a full conditional distribution of
and can be directly sampled using Gibbs sampling. To draw ρω(g), first, samples are drawn from the conditional distribution of Σω(g), as in the Inverse Wishart distribution (see Gelman et al., 2004), and the sampled Σω(g) is then transformed into the corresponding provisional ρω(g), which is evaluated by the M-H acceptance criteria. This method was originally developed by Liu (2008) and Liu and Daniels (2006), and utilized in Huo et al. (2015). Finally, the full conditional distribution of the item parameters is
For the full conditional distributions for and λ(g), the M-H algorithm can be used to indirectly draw samples from the corresponding distributions. The multivariate HO-IRT model with multiple groups formulated above is a full model containing the multivariate higher-order latent traits for multiple groups. Details of the MCMC algorithms are shown in the Appendix.
Estimation Indeterminacy
We note two unique challenges to address when estimating a multivariate HO-IRT model for multiple groups. The first challenge involves addressing estimation indeterminacy. We set constraints on the latent distributions by selecting an anchor group, setting its mean to be 0, and constraining its covariance matrix to be equivalent to a correlation matrix. Along with the estimation of the correlation matrix for the anchor group, the mean vectors and covariance matrices of the remaining groups are directly estimated by modifying the relevant MCMC algorithms (Liu and Daniels, 2006; Liu, 2008), and adapting them to the multivariate HO-IRT model. Alternatively, constraints can be imposed on item parameters (e.g., fixing one discrimination parameter to 1 and one difficulty parameter to 0; e.g., Fox and Glas, 2001) without setting any particular anchor group. Although both options address estimation indeterminacy, we chose the first, which is more consistent with the IRT tradition of constraining the latent distributions (i.e., structural parameters) rather than the item parameters.
The second challenge is in constructing the correlation/covariance structures of θ|ω. For each group, conditioned on ω, θs are independent from one another. The conditional variance of θ(d)|ω is . However, the θs are not marginally independent across dimensions. The elements of the correlation or covariance matrices can be derived from for θ(d). Given that the covariance matrix of the anchor group is constrained, the covariance matrix θ(d) for the anchor group is equivalent to the correlation matrix because . Therefore, for any two θs (e.g., θd and , d≠d′) sharing the same higher-order ω, their covariances can be estimated as σ(d)σ(d′)λ(d)λ(d′). If two θs do not share the same ω, the covariances can be estimated as σ(d)σ(d′)λ(d)λ(d′)ρω.
Simulation Study
Simulation Design
A simulation study was conducted to evaluate the feasibility of the MCMC algorithms for the bivariate HO-IRT model with multiple groups. In this simulation study we examined the bivariate HO-IRT model with multiple groups in the saturated form, that is, different means and covariance structures for bivariate second-order latent traits across groups. In other words, the feasibility of the most comprehensive MCMC algorithm for a saturated (full) model was examined because any reduced models are special cases of the saturated model with constraints. More specifically, for the simulation design, three groups with each having 1,000 participants were specified. The second-order latent trait, ω(g), for the three groups was set to be identical. Specifically, the underlying distribution for the second-order latent trait was bivariate normal with μ = 0, Σ = R, and ρ = 0.5. The first-order latent traits θi(g)(d) were generated from . The true parameters of μ, λ, σ2, and covariance matrices are presented in Table 1. Note that the first group was designated as the anchor group with a zero mean vector and a correlation matrix.
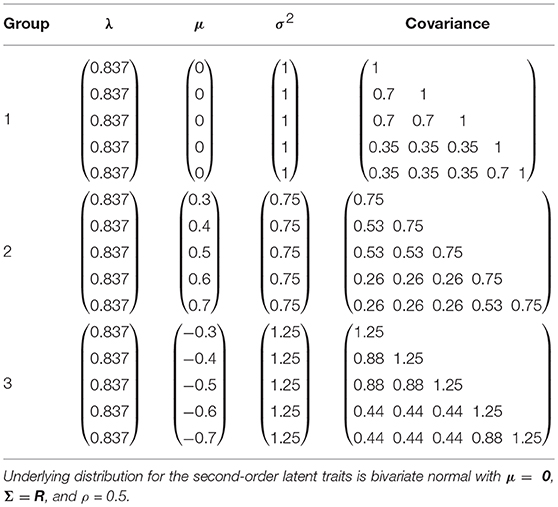
Table 1. True parameter values of μ, λ, and σ2 for the first-order traits θ(d) in the simulation study.
The complete item responses were generated based on θs and item parameters. Thirty items were randomly drawn from 80 2PL item parameters in an item pool. The item parameters were constructed based on our prior experience of analyzing similar data. Their discrimination and difficulty parameters are presented in Table 2. To ensure that item quality is identical across dimensions, these 30 items were repeated five times and used in the simulation phase as a 150-item test set, measuring five correlated traits. All three groups (a total sample size of 3,000) had complete responses on all 150 items. A total of 25 replication data sets were generated and analyzed. All estimation codes were written and implemented using Ox, an object oriented programming language (Doornik, 2009), and can be made available to interested readers upon request.
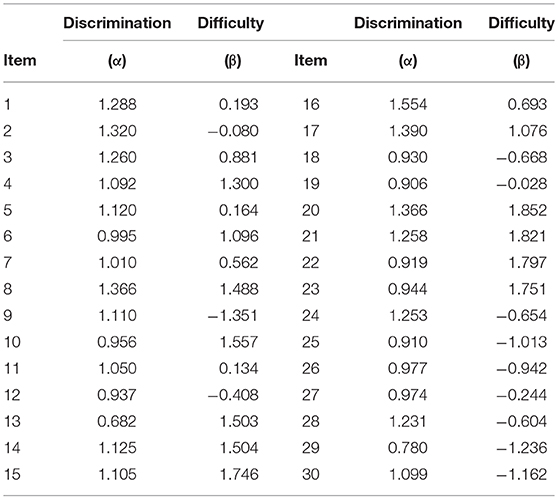
Table 2. Item parameters used in the simulation study (First 30 items).
Simulation Results
Four MCMC chains were simultaneously run to monitor their convergence. Each chain had 25,000 iterations and the first 10,000 iterations were discarded as burn-in. The Gelman–Rubin (G–R) diagnostic statistics (Gelman and Rubin, 1992) across all parameters were <1.1 (when tested with a single replication and one chain), suggesting that convergence was achieved. Table 3 presents the estimation results. The MCMC estimates of the means were almost identical to their true values. The computed standard errors (SEs) were small and generally comparable across different μs. The estimates of λs for the three groups ranged from 0.827 to 0.840, which indicates a fairly good estimation recovery of their true value, 0.837. The SEs were generally small and consistent across dimensions and groups. The estimates of σ2s were also quite close to their respective true values, and the estimated correlations between the two second-order traits were very close to the true correlation (0.5) in all three groups. Table 4 presents the bias and RMSE of the discrimination and difficulty parameter estimates of the 150 items as well as for the entire test. Overall, the magnitudes of the bias and RMSE of the discrimination and difficulty parameter estimates were very small (i.e., maximum absolute bias and RMSE of 0.008 and 0.014, respectively), indicating that these item parameters were accurately recovered.
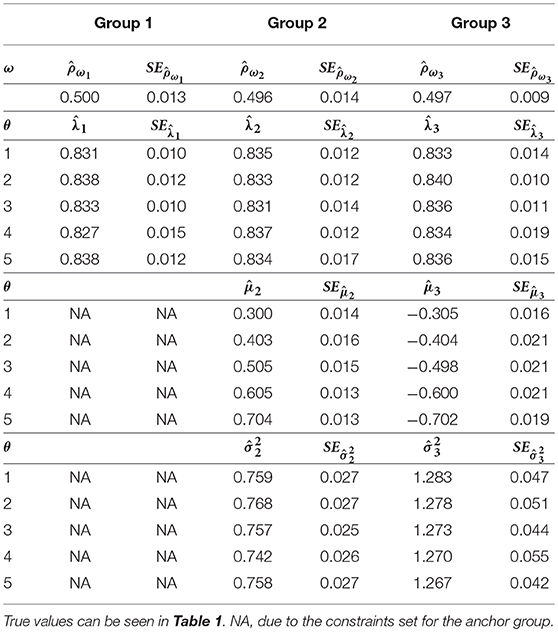
Table 3. Estimated parameters and SEs of the simulated bivariate HO-IRT model for three groups (data averaged across 25 replications).
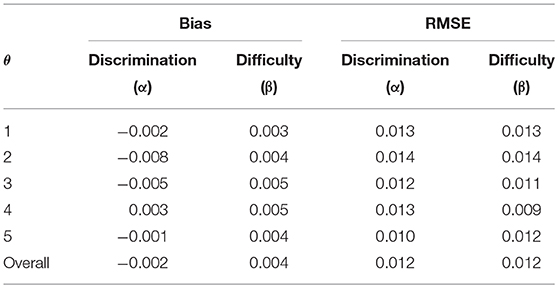
Table 4. Bias and RMSE of the discrimination and difficulty parameter estimates of the 150 items.
Figure 3 shows the scatter plots of the true and estimated first-order latent trait scores from 3,000 respondents (from all three groups) averaged across 25 replications. All five plots show that the true and estimated trait scores were highly correlated (Pearson's r ≥ 0.985). Similarly, Figure 4 shows the scatter plots of the true and estimated second-order latent trait scores for each of the two second-order dimensions. The two plots in Figure 4 show that the true and estimated trait scores at this second-order level were highly correlated (Pearson's r = 0.914 and 0.884, respectively, for the two second-order trait dimensions).
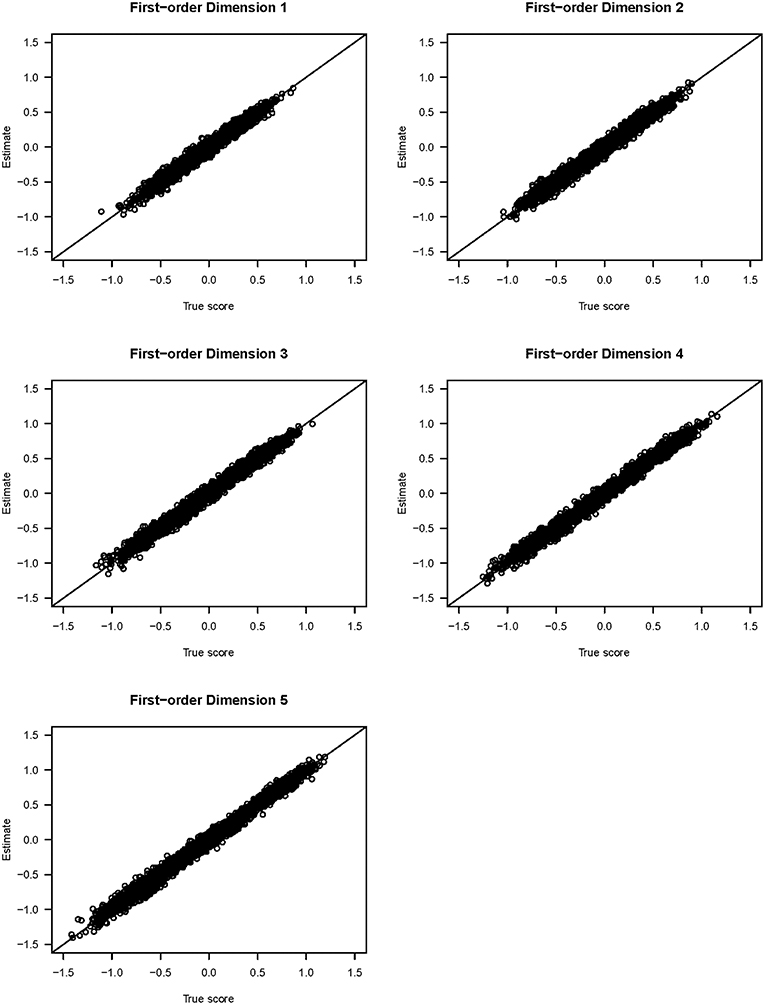
Figure 3. Scatter plots of the true and estimated first-order latent trait scores from the simulation study.
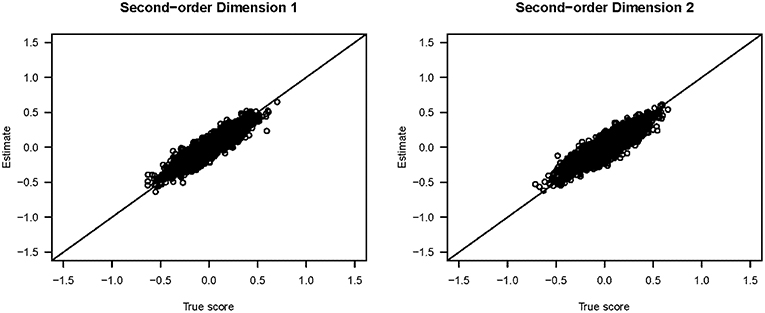
Figure 4. Scatter plots of the true and estimated second-order latent trait scores from the simulation study.
Although the simulation study illustrated the MCMC algorithms for the bivariate HO-IRT model in the saturated form, the MCMC algorithms can flexibly be adapted to fit reduced (i.e., simpler) models. For example, a reduced model may be a bivariate HO-IRT model with multiple groups with different means and a common covariance structure across groups. This reduced model may be needed for studies with small samples or sparse data, because the estimation of different covariance structures across groups may result in unreliable estimates under challenging data situations. With a common covariance structure assumed among multiple groups, it is straightforward to estimate the reduced models. In this case, only one set of the common λ and σ2 needs to be specified in the model. Moreover, additional model constraints can be imposed to the anchor group to avoid estimation indeterminacy, which renders the common covariance matrix being equivalent to the common correlation matrix. The implied correlation between any two θs sharing the same second-order ω simplifies to λ(d) × λ(d′), and between any two θs stemming from two different ωs to λ(d) × λ(d′) × .
Bivariate HO-IRT Analysis Application
Data and Measures
We focus on the Alcohol Expectancies and Drinking Motives constructs from Project INTEGRATE (Mun et al., 2015) in the current study. Alcohol Expectancies and Drinking Motives are closely associated constructs, although they are different from each other conceptually. Alcohol Expectancies address the positive or negative beliefs about alcohol's cognitive, emotional, and behavioral effects (e.g., It would be easier to express feelings), whereas Drinking Motives address specific reasons for drinking to achieve desired outcomes (e.g., I drink to be sociable). Based on the literature and the preliminary exploratory data analysis, we conceptualized Alcohol Expectancies and Drinking Motives as second-order trait dimensions that are hierarchically and linearly related to the following five first-order trait dimensions: (1) Social Enhancement and Disinhibition Expectancies, (2) Tension Reduction and Relaxation Expectancies, (3) Negative Alcohol Expectancies, (4) Coping Motives, and (5) Social and Enhancement Motives. The first three and the latter two first-order dimensions represent Alcohol Expectancies and Drinking Motives, respectively.
The entire item data pool consisted of a total of 126 items assessed in 19 studies from several questionnaires and items. These items were originally from the Comprehensive Effects of Alcohol Questionnaire (CEOA; Fromme et al., 1993), the revised Alcohol Expectancies Questionnaire (AEQ; George et al., 1995), the Sex-Related Alcohol Expectancy Questionnaire (SRAEQ; Dermen and Cooper, 1994), the Expectancy/Context Questionnaire (ECQ; Darkes and Goldman, 1993, 1998), and the Drinking Motives Questionnaire Revised (DMQ-R; Cooper, 1994). For some of the questionnaires, the responses were coded identically across studies and, for others, responses were obtained using different response formats. Therefore, the different polytomous response options were converted to binary responses to harmonize item responses across studies, a standard strategy in the field (e.g., Curran et al., 2008, 2014; Bauer, 2017).
Analyzing the entire data set in a single analysis was challenging because the combined data were very sparse (i.e., a high rate of missing data at the item level due to different study designs), which is typical in the analysis of existing IPD from multiple studies. We followed the same strategies used in Huo et al. (2015) to address this challenge. Briefly, we increased common linkage among items and reduced the proportion of missingness by identifying pairs of items eligible for item collapsing, and then checked these collapsed items more closely during the item calibration stage. For the purpose of illustration, we chose a subset of the data with fairly good item coverage (93%) across three studies in terms of data completeness. Most of the missing data within this subset of data occurred at the participant level; not at the group (study) level. Because the participants had a subset of the item response data, we assumed that any missing items in the data were missing at random, and that any inference bias may be ignorable. Accordingly, we could reasonably expect to obtain stable estimates. The data analyzed contained a total of 49 items from three studies (studies 6, 15, and 16) out of the full data set. The total combined sample size was 665 (N = 115, 263, and 287, respectively). There were 15 items on dimension 1; 6 items on dimension 2; 13 items on dimension 3; 5 items on dimension 4; and 10 items on dimension 5.
Comparison of the Results From Univariate and Bivariate HO-IRT Models
We analyzed the data using four different HO-IRT models: univariate HO-IRT model with a common correlation structure across groups (model 1); univariate HO-IRT model with different correlation/covariance structures across groups (model 2); bivariate HO-IRT model with a common correlation structure across groups (model 3); and bivariate HO-IRT model with different correlation/covariance structures across groups (model 4). In each model estimation, Group 1 was set as the anchor group because it had moderate mean responses on average, compared to the other two groups. A total of four chains with different starting values were implemented to monitor convergence. Each chain had 75,000 draws and the initial 10,000 iterations were considered as the burn-in. The G-R statistics (Gelman and Rubin, 1992) for all parameters were <1.1, indicating that convergence was reached for all models. To assess the extent to which the samples drawn from a given chain were independent, the effective sample sizes (ESS) were computed for all parameters of model 4. The ESS ranged from 1535.93 to 6573.40 across the four chains, with an average ESS of 2684.11.
We compared the model fit of the four models based on the deviance information criterion (DIC; Spiegelhalter et al., 2002). DIC is well-suited to compare models that were estimated from the MCMC analysis, and can be treated as a Bayesian extension of the Akaike information criterion (AIC; Akaike, 1974), with lower scores indicating better fit. To compute DIC statistics, half of the deviance variance was used as the effective number of parameters (Gelman et al., 2004). The DIC values for models 1 through 4 were 35571, 32133, 35379, and 31976, respectively. These results indicated that bivariate HO-IRT models (models 3 and 4) outperformed their univariate counterparts (models 1 and 2). In addition, the models with different correlation/covariance structures (models 2 and 4) showed a much better model fit than the models with a common correlation structure across groups (models 1 and 3). Both univariate and bivariate HO-IRT models with different correlation/covariance matrices across groups (models 2 and 4) showed noticeable between-group differences, suggesting that the HO-IRT models with a common correlation matrix were not ideal for the data. Overall, model 4 was the best fitting model. Because the DIC values of models 2 and 4 were relatively close, we report results from models 2 and 4 in Table 5.
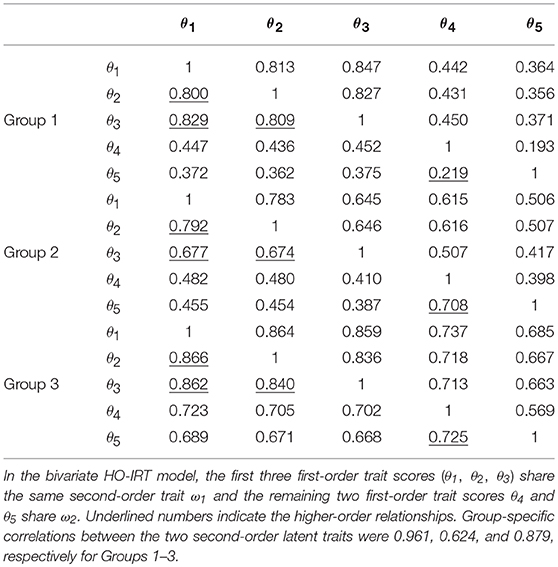
Table 5. Derived correlation matrices from the bivariate HO-IRT model (lower off-diagonal) and from the univariate HO-IRT model (upper off-diagonal).
Table 5 shows three sets of correlation matrices among five first-order latent traits for the three groups for the bivariate HO-IRT model (lower off-diagonal; model 4) and for the univariate HO-IRT model (upper off-diagonal; model 2). In both HO-IRT models, the correlations of the first three first-order trait dimensions were strong in all three groups. However, the correlations of the last two first-order trait dimensions varied across groups and across the two models. In Group 1, the correlations from both HO-IRT models were rather weak (0.219 and 0.193 for models 4 and 2, respectively). However, in Group 2, they were 0.708 vs. 0.398 for models 4 and 2, respectively; in Group 3, they were 0.725 vs. 0.569 for models 4 and 2, respectively. The results suggest that the bivariate HO-IRT model better captured the expected relationships between the first-order latent traits. In contrast, the univariate HO-IRT model did not show evidence of a two-cluster hierarchical data structure. This difference between the two HO-IRT models can be attributed to different formulations of the second-order latent traits in these models. The formulation of the two dimensions at the second-order latent trait level in the bivariate HO-IRT model provided greater flexibility in capturing the associations between dimensions 4 and 5 at the first-order latent trait level for Groups 2 and 3. Furthermore, the bivariate HO-IRT model yielded group-specific correlations between the two second-order latent trait levels: 0.961, 0.624, and 0.879, respectively, for the three groups. When the correlation between the two second-order latent traits was high (i.e., 0.961 for Group 1), both the bivariate and univariate HO-IRT models produced similar correlation/covariance matrices. However, when the correlation was moderate (i.e., 0.624 for Group 2), the covariance matrices for the first-order trait dimensions from the two HO-IRT models diverged.
Finally, we implemented the posterior predictive model check (PPMC) procedure to evaluate the model fit. We used the proportion correct (i.e., the proportion of items endorsing the “correct,” “agree” or “true” response) as a discrepancy measure for this procedure. The posterior predictive p-values (ppp; Meng, 1994; Sinharay et al., 2006) for all items from the best fitting model (model 4) fell between 0.025 and 0.975, suggesting that the model was reasonable for the data.
Discussion
The current study provides findings from a simulation study as well as from real data analysis, which demonstrates the feasibility of the MCMC algorithms and potential utility of the multivariate HO-IRT model for multiple groups in connection with analysis of IPD from multiple studies. In recent years, a number of flexible IRT and FA programs have emerged for estimating unidimensional or multidimentional 1PL, 2PL, 3PL, graded response, partial credit, higher-order IRT, and bifactor models, including BMIRT II, a component of a Bayesian multivariate IRT (BMIRT) toolkit by Yao (2010); IRTPRO (Cai et al., 2011); exMIRT (Cai, 2013); FLIRT (Jeon et al., 2014); a general-purpose IRT program (Haberman, 2013); Mplus (with Bayes estimator; Muthén and Muthén, 1998-2018); Stan (Bürkner, 2017); or WinBUGS (Lunn et al., 2000).
Despite the advances, there is an unmet need for additional tools to help address the challenges of analyzing item response data to combine and synthesize IPD from multiple studies. The existing approaches to establishing commensurate scores across studies have been limited to unidimensional and first-order item response data. For example, a two-parameter logistic IRT (2PL-IRT) model (Curran et al., 2008), a moderated non-linear factor analysis model (MNLFA; Bauer and Hussong, 2009; Curran et al., 2014; Witkiewitz et al., 2016; Bauer, 2017; Hussong et al., 2019), and a longitudinal invariant Rasch test (LIRT; McArdle et al., 2009) are measurement models for unidimensional or multi-unidimensional constructs without any second-order constructs. The 2PL-MUIRT model (Huo et al., 2015) is also unidimensional within each item (i.e., each item measures a single dimension only), except that it can “borrow strength” from related dimensions (i.e., multi-unidimensional) in the pool of items under investigation. Therefore, the development of the proposed multivariate HO-IRT model for multiple groups is a step in the right direction for providing methodological tools to advance the field.
The multivariate HO-IRT model reported in the current study may be appealing as more investigators attempt to combine IPD from different studies and to establish equivalent scores at the participant level for complex item response data. The multivariate HO-IRT model can correctly reflect a theoretical higher-order model for a given construct while estimating latent traits at different hierarchical levels across studies, providing greater flexibility. We demonstrated that the MCMC algorithm accurately estimated the item parameters, and first-order and second-order latent trait scores, as well as the parameters of the hierarchical structures (i.e., the means and regression coefficients) in the simulation study. From the real data application, we found that a bivariate HO-IRT model with different correlation/covariance structures for studies fit the data best as expected, compared with its counterpart univariate HO-IRT model or with the bivariate HO-IRT model with unreasonable constraints (i.e., the same means and covariances across studies).
Note that although we used a multi-group approach to reflect study-level differences, other approaches also exist, such as adding individual-level and study-by-individual level covariates into measurement models when deriving commensurate scores as in MNLFA (Bauer and Hussong, 2009; Curran et al., 2014, 2016). The multiple-indicator and multiple-cause model (MIMIC) approach also accounts for the influence of both categorical (e.g., study membership) and numerical covariates when estimating individual scores. However, results from both of the MNLFA and MIMIC approaches can be quite challenging to interpret (see Lee et al., 2013; Bauer, 2017). In the absence of individual participant data, others have attempted to combine aggregate data, such as correlation/covariance matrices, from multiple studies (e.g., meta-analytic structural equation modeling, Cheung, 2014, 2015). More studies are needed to develop new approaches and compare their relative performance.
The multivariate HO-IRT model and the MCMC algorithms in the present study were developed to address the measurement and computational challenges in the original project. However, the algorithms can be adapted to accommodate new features and converted into program codes (e.g., Stan; Bürkner, 2017) and developed further into a package for R (R Core Team, 2018) in future studies for better accessibility.
With regard to specific areas for model refinement in future studies, first, the current study assumed that the means of the higher-order latent traits are 0 s and their variances are 1 s for model simplicity. Setting such model constraints is not the only solution to handle estimation indeterminacy. Depending on specific research requirements, different constraints can be imposed. In the future, different mean levels of higher-order latent traits, not necessarily 0 s, may be estimated to better understand how higher-order structural parameters function in multiple-group applications. Similarly, for even more complex situations, such as third-order latent traits subsuming second-order latent traits, more constraints may be considered to model data parsimoniously.
Second, we assumed that the same items administered in different studies had the same item parameters. This is the same assumption made for the hierarchical 2PL-MUIRT model (Huo et al., 2015). All participants in the data application were college students from the same college campus who were assessed at the same time or a year apart from one another, and their demographic and alcohol-related characteristics were generally similar. In addition, in an earlier larger study from Project INTEGRATE, we found that there was no meaningful difference between the model constrained to have the same item parameters across studies and the model that allowed items to have different item parameters (DIF items; see Mun et al., 2015 for detailed discussion on the relationship between DIF and latent traits). Therefore, the assumption that item parameters are the same across studies may be reasonable for this study. In future studies, it may be beneficial to further refine model parameterization and estimation to test which of the items may function differently in a large sample with limited missing data.
Finally, the simulation study was rather limited in scope. We focused on demonstrating the feasibility of the MCMC algorithms. It would be helpful to examine several key data conditions under which the MCMC algorithms perform well in a carefully designed simulation study. In sum, the multivariate HO-IRT model for multiple groups has room to further improve.
Having described the areas to improve, we now highlight the promise of this new method in broader terms. In the field of clinical research, it is increasingly important to share and link data across different systems measured in different time scales for data-driven discoveries to deliver faster and more individualized treatment decisions (i.e., the Precision Medicine Initiative; Collins and Varmus, 2015). The National Institutes of Health has long promoted the use of standard measures of phenotypes, such as the PhenX toolkit (https://www.phenxtoolkit.org/), in health research. When measures are not the same across studies, the current paper shows how to establish a “common metric” for complex item response data. With new measurement models specifically developed for such applications, it would be feasible to validly assign psychometrically comparable scale scores to individuals from different studies despite using different questions or surveys, as long as at least some of the items across studies can properly be linked. The new multivariate HO-IRT model for multiple groups that we developed and tested in the current paper may be instrumental for appropriately linking complex item responses given by individual participants from multiple studies to examine them as a whole and expedite scientific discoveries (Hesse et al., 2015; Goldstein and Avenevoli, 2018).
Ethics Statement
The North Texas Regional IRB reviewed and approved this study.
Author Contributions
E-YM developed ideas and secured funding for the parent project, oversaw the entire analytical plan, and drafted the manuscript. YH developed the MCMC, analyzed data, drafted technical sections, and contributed to the writing of the manuscript. HRW contributed to the preparation of real data for analysis and edited the manuscript. SS edited the manuscript. JdlT developed and oversaw the analytical plan for this paper and contributed to the writing of this manuscript.
Funding
The project described was supported by Award Number R01 AA019511 from the National Institute on Alcohol Abuse and Alcoholism (NIAAA). The content is solely the responsibility of the authors and does not necessarily represent the official views of the NIAAA or the National Institutes of Health.
Conflict of Interest Statement
The authors declare that the research was conducted in the absence of any commercial or financial relationships that could be construed as a potential conflict of interest.
Acknowledgments
We would like to thank the following data contributors in alphabetical order: John S. Baer, Department of Psychology, The University of Washington, and Veterans' Affairs Puget Sound Health Care System; Nancy P. Barnett, Center for Alcohol and Addiction Studies, Brown University; M. Dolores Cimini, University Counseling Center, The University at Albany, State University of New York; William R. Corbin, Department of Psychology, Arizona State University; Kim Fromme, Department of Psychology, The University of Texas, Austin; Joseph W. LaBrie, Department of Psychology, Loyola Marymount University; Mary E. Larimer, Department of Psychiatry and Behavioral Sciences, The University of Washington; Matthew P. Martens, Department of Educational, School, and Counseling Psychology, The University of Missouri; James G. Murphy, Department of Psychology, The University of Memphis; Scott T. Walters, Department of Health Behavior and Health Systems, The University of North Texas Health Science Center; and the late Mark D. Wood, Department of Psychology, The University of Rhode Island.
Supplementary Material
The Supplementary Material for this article can be found online at: https://www.frontiersin.org/articles/10.3389/fpsyg.2019.01328/full#supplementary-material
References
Akaike, H. (1974). A new look at the statistical model identification. IEEE Trans. Autom. Control 19, 716–723. doi: 10.1109/TAC.1974.1100705
Azevedo, C. L. N., Fox, J.-P., and Andrade, D. F. (2015). Longitudinal multiple-group IRT modelling: covariance pattern selection using MCMC and RJMCMC. Int. J. Quant. Res. Educ. 2, 213–243. doi: 10.1504/IJQRE.2015.071737
Bacci, S., Bartolucci, F., and Gnaldi, M. (2014). A class of multidimensional latent class IRT models for ordinal polytomous item responses. Commun. Stat. 43, 787–800. doi: 10.1080/03610926.2013.827718
Bartolucci, F. (2007). A class of multidimensional IRT models for testing unidimensionality and clustering items. Psychometrika 72, 141–157. doi: 10.1007/s11336-005-1376-9
Bartolucci, F., Bacci, S., and Gnaldi, M. (2015). Statistical Analysis of Questionnaires: A Unified Approach Based on Stata and R. New York, NY: CRC Press. doi: 10.1201/b18735
Bauer, D. J. (2017). A more general model for testing measurement invariance and differential item functioning. Psychol. Methods 22, 507–526. doi: 10.1037/met0000077
Bauer, D. J., and Hussong, A. M. (2009). Psychometric approaches for developing commensurate measures across independent studies: traditional and new models. Psychol. Methods 14, 101–125. doi: 10.1037/a0015583
Brincks, A., Montag, S., Howe, G. W., Huang, S., Siddique, J., Ahn, S., et al. (2018). Addressing methdologic challenges and minimizing threats to validity in synthesizing findings from individual-level data across longitudinal randomized trials. Prevent. Sci. 19, 60–73. doi: 10.1007/s11121-017-0769-1
Bürkner, P.-C. (2017). brms: an R package for Bayesian multilevel models using Stan. J. Stat. Softw. 80, 1–28. doi: 10.18637/jss.v080.i01
Cai, L. (2013). flexMIRT Version 2: Flexible Multilevel Multidimensional Item Analysis and Test Scoring [Computer software]. Chapel Hill, NC: Vector Psychometric Group.
Cai, L., du Toit, S. H. C., and Thissen, D. (2011). IRTPRO: Flexible, Multidimensional, Multiple Categorical IRT Modeling [Computer software]. Lincolnwodd, IL: Scientific Software International.
Camilli, G., and Fox, J.-P. (2015). An aggregate IRT procedure for exploratory factor analysis. J. Educ. Behav. Stat. 40, 377–401. doi: 10.3102/1076998615589185
Casella, G., and George, E. I. (1992). Explaining the Gibbs sampler. Am. Stat. 46, 167–174. doi: 10.1080/00031305.1992.10475878
Cheung, M. W.-L. (2014). Fixed-and random-effects meta-analytic structural equation modeling: examples and analyses in R. Behav. Res. Methods 46, 29–40. doi: 10.3758/s13428-013-0361-y
Cheung, M. W.-L. (2015). Meta-Analysis: A Structural Equation Modeling Approach. New York, NY: Wiley. doi: 10.1002/9781118957813
Chib, S., and Greenberg, E. (1995). Understanding the Metropolis-Hastings algorithm. Am. Stat. 49, 327–335. doi: 10.1080/00031305.1995.10476177
Cho, S.-J., and Cohen, A. S. (2010). A multilevel mixture IRT model with an application to DIF. J. Educ. Behav. Stat. 35, 336–370. doi: 10.3102/1076998609353111
Choi, S., Schalet, B., Cook, K., and Cella, D. (2014). Establishing a common metric for depressive symptoms: linking the BDI-II, CES-D, and PHQ-9 to PROMIS depression. Psychol. Assess. 26, 513–527. doi: 10.1037/a0035768
Collins, F. S., and Varmus, H. (2015). A new initiative on precision medicine. N. Engl. J. Med. 372, 793–795. doi: 10.1056/NEJMp1500523
Cooper, M. L. (1994). Motivations for alcohol use among adolescents: development and validation of a four-factor model. Psychol. Assess. 6, 117–128. doi: 10.1037/1040-3590.6.2.117
Curran, P. J., Cole, V., Bauer, D. J., Hussong, A. M., and Gottfredson, N. (2016). Improving factor score estimation through the use of observed background characteristics. Struct. Equat. Model. Multidisc. J. 23, 827–844. doi: 10.1080/10705511.2016.1220839
Curran, P. J., Cole, V., Giordano, M., Georgeson, A. R., Hussong, A. M., and Bauer, D. J. (2017). Advancing the study of adolescent substance use through the use of integrative data analysis. Eval. Health Prof. 41, 216–245. doi: 10.1177/0163278717747947
Curran, P. J., and Hussong, A. M. (2009). Integrative data analysis: the simultaneous analysis of multiple data sets. Psychol. Methods 14, 81–100. doi: 10.1037/a0015914
Curran, P. J., Hussong, A. M., Cai, L., Huang, W., Chassin, L., Sher, K. J., et al. (2008). Pooling data from multiple longitudinal studies: the role of item response theory in integrative data analysis. Dev. Psychol. 44, 365–380. doi: 10.1037/0012-1649.44.2.365
Curran, P. J., McGinley, J. S., Bauer, D. J., Hussong, A. M., Burns, A., Chassin, L., et al. (2014). A moderated nonlinear factor model for the development of commensurate measures in integrative data analysis. Multivariate Behav. Res. 49, 214–231. doi: 10.1080/00273171.2014.889594
Darkes, J., and Goldman, M. S. (1993). Expectancy challenge and drinking reduction: experimental evidence for a mediational process. J. Consult. Clin. Psychol. 61, 344–353. doi: 10.1037/0022-006X.61.2.344
Darkes, J., and Goldman, M. S. (1998). Expectancy challenge and drinking reduction: process and structure in the alcohol expectancy network. Exp. Clin. Psychopharmacol. 6, 64–76. doi: 10.1037/1064-1297.6.1.64
de la Torre, J., and Hong, Y. (2010). Parameter estimation with small sample size: a higher-order IRT model approach. Appl. Psychol. Meas. 34, 267–285. doi: 10.1177/0146621608329501
de la Torre, J., and Patz, R. J. (2005). Making the most of what we have: a practical application of multidimensional item response theory in test scoring. J. Educ. Behav. Stat. 30, 295–311. doi: 10.3102/10769986030003295
de la Torre, J., and Song, H. (2009). Simultaneous estimation of overall and domain abilities: a higher-order IRT model approach. Appl. Psychol. Meas. 33, 620–639. doi: 10.1177/0146621608326423
Dermen, K. H., and Cooper, M. L. (1994). Sex-related alcohol expectancies among adolescents: I. Scale development. Psychol. Addict. Behav. 8, 152–160. doi: 10.1037/0893-164X.8.3.152
Doornik, J. A. (2009). Object-Oriented Matrix Programming Using Ox (Version 3.1) [Computer software]. London: Timberlake Consultants Press.
Fox, J.-P., and Glas, C. A. W. (2001). Bayesian estimation of a multilevel IRT model using Gibbs sampling. Psychometrika 66, 271–288. doi: 10.1007/BF02294839
Fox, J.-P., and Marianti, S. (2016). Joint modeling of ability and differential speed using responses and response times. Multivariate Behav. Res. 51, 540–553. doi: 10.1080/00273171.2016.1171128
Fried, E. I., and Flake, J. K. (2018). Measurement matters. Observer 31, 29–31. Available online at: https://www.psychologicalscience.org/observer/measurement-matters
Fromme, K., Stroot, E. A., and Kaplan, D. (1993). Comprehensive effects of alcohol: development and psychometric assessment of a new expectancy questionnaire. Psychol. Assess. 5, 19–26. doi: 10.1037/1040-3590.5.1.19
Gelman, A., Carlin, J. B., Stern, H. S., and Rubin, D. B. (2004). Bayesian Data Analysis, 2nd Edn. Boca Raton, FL: Chapman & Hall/CRC.
Gelman, A., and Rubin, D. B. (1992). Inference from iterative simulation using multiple sequences. Stat. Sci. 7, 457–472. doi: 10.1214/ss/1177011136
George, W. H., Frone, M. R., Cooper, M. L., Russell, M., Skinner, J. B., and Windle, M. (1995). A revised alcohol expectancy questionnaire: factor structure confirmation and invariance in a general population sample. J. Stud. Alcohol 56, 177–185. doi: 10.15288/jsa.1995.56.177
Gibbons, R. D., and Hedeker, D. (1992). Full information item bi-factor analysis. Psychometrika 57, 423–436. doi: 10.1007/BF02295430
Gibbons, R. D., Weiss, D. J., Frank, E., and Kupfer, D. (2016). Computerized adaptive diagnosis and testing of mental health disorders. Annu. Rev. Clin. Psychol. 12, 83–104. doi: 10.1146/annurev-clinpsy-021815-093634
Gnaldi, M., Bacci, S., and Bartolucci, F. (2016). A multilevel finite mixture item response model to cluster examinees and schools. Adv. Data Anal. Classif. 10, 53–70. doi: 10.1007/s11634-014-0196-0
Goldstein, A. B., and Avenevoli, S. (2018). Strength in numbers. Prevent. Sci. 19, 109–111. doi: 10.1007/s11121-017-0856-3
Haberman, S. J. (2013). A General Program for Item-Response Analysis That Employs the Stabilized Newton-Raphson Algorithm. (ETS Research Rep. No. RR-13-32). Princeton, NJ: Educational Testing Service. doi: 10.1002/j.2333-8504.2013.tb02339.x
Hambleton, R. K., and Swaminathan, H. (1985). Item Response Theory: Principles and Applications. Boston, MA: Kluwer-Nijhoff. doi: 10.1007/978-94-017-1988-9
Hedges, L., and Olkin, I. (1985). Statistical Methods for Meta-Analysis. New York, NY: Academic Press.
Hesse, B. W., Moser, R. P., and Riley, W. T. (2015). From Big Data to Knowledge in the social sciences. Ann. Am. Acad. Pol. Soc. Sci. 659, 16–32. doi: 10.1177/0002716215570007
Huang, H.-Y., and Wang, W.-C. (2013). Higher-order testlet response models for hierarchical latent traits and testlet-based items. Educ. Psychol. Meas. 73, 491–511. doi: 10.1177/0013164412454431
Huang, H.-Y., and Wang, W.-C. (2014). Multilevel higher-order item response theory models. Educ. Psychol. Meas. 74, 495–515. doi: 10.1177/0013164413509628
Huang, H.-Y., Wang, W.-C., Chen, P.-H., and Su, C.-M. (2013). Higher-order item response models for hierarchical latent traits. Appl. Psychol. Meas. 37, 619–637. doi: 10.1177/0146621613488819
Huo, Y., de la Torre, J., Mun, E.-Y., Kim, S.-Y., Ray, A. E., Jiao, Y., et al. (2015). A hierarchical multi-unidimensional IRT approach for analyzing sparse, multi-group data for integrative data analysis. Psychometrika 80, 834–855. doi: 10.1007/s11336-014-9420-2
Hussong, A. M., Curran, P. J., and Bauer, D. J. (2013). Integrative data analysis in clinical psychology research. Annu. Rev. Clin. Psychol. 9, 61–89. doi: 10.1146/annurev-clinpsy-050212-185522
Hussong, A. M., Gottfredson, N. C., Bauer, D. J., Curran, P. J., Haroon, M., Chandler, R., et al. (2019). Approaches for creating comparable measures of alcohol use symptoms: harmonization with eight studies of criminal justice populations. Drug Alcohol Depend. 194, 59–68. doi: 10.1016/j.drugalcdep.2018.10.003
Jeon, M., Rijmen, F., and Rabe-Hesketh, S. (2014). Flexible item response theory modeling with FLIRT. Appl. Psychol. Meas. 38, 404–405. doi: 10.1177/0146621614524982
Klein Entink, R. H., Fox, J.-P., and van der Linden, W. J. (2009). A multivariate multilevel approach to the modelling of accuracy and speed of test takers. Psychometrika 74, 21–48. doi: 10.1007/s11336-008-9075-y
Lee, N., Cadogan, J. W., and Chamberlain, L. (2013). The MIMIC model and formative variables: problems and solutions. AMS Rev. 3, 3–17. doi: 10.1007/s13162-013-0033-1
Liu, X. (2008). Parameter expansion for sampling a correlation matrix: an efficient GPX-RPMH algorithm. J. Stat. Comput. Simul. 78, 1065–1076. doi: 10.1080/00949650701519635
Liu, X., and Daniels, M. J. (2006). A new efficient algorithm for sampling a correlation matrix based on parameter expansion and re-parameterization. J. Comput. Graph. Stat. 15, 897–914. doi: 10.1198/106186006X160681
Lunn, D. J., Thomas, A., Best, N., and Spiegelhalter, D. (2000). WinBUGS – A Bayesian modelling framework: concepts, structure, and extensibility. Stat. Comput. 10, 325–337. doi: 10.1023/A:1008929526011
McArdle, J. J., Grimm, K. J., Hamagami, F., Bowles, R. P., and Meredith, W. (2009). Modeling life-span growth curves of cognition using longitudinal data with multiple samples and changing scales of measurement. Psychol. Methods 14, 126–149. doi: 10.1037/a0015857
Meng, X. L. (1994). Posterior predictive p-values. Ann. Stat. 22, 1142–1160. doi: 10.1214/aos/1176325622
Mun, E.-Y., de la Torre, J., Atkins, D. C., White, H. R., Ray, A. E., Kim, S.-Y., et al. (2015). Project INTEGRATE: an integrative study of brief alcohol interventions for college students. Psychol. Addict. Behav. 29, 34–48. doi: 10.1037/adb0000047
Mun, E.-Y., and Ray, A. E. (2018). “Integrative data analysis from a unifying research synthesis perspective,” in Alcohol Use Disorders: A Developmental Science Approach to Etiology, eds H. E. Fitzgerald and L. I. Puttler (New York, NY: Oxford University Press), 341–353. doi: 10.1093/oso/9780190676001.003.0020
Muthén, L., and Muthén, B. (1998-2018). Mplus: Statistical Analysis With Latent Variables (Version 8.2) [Computer software]. Los Angeles, CA: Muthén & Muthén.
R Core Team (2018). R: A Language and Environment for Statistical Computing. Vienna: R Foundation for Statistical Computing. Retrieved from: http://www.R-project.org/
Rijmen, F., Jeon, M., von Davier, M., and Rabe-Hesketh, S. (2014). A third order item response theory model for modeling the effects of domains and subdomains in large-scale educational assessment surveys. J. Educ. Behav. Stat. 39, 235–256. doi: 10.3102/1076998614531045
Schmidt, S., Zlatkin-Troitschanskaia, O., and Fox, J. P. (2016). Pretest-posttest-posttest multilevel IRT modeling of competence growth of students in higher education in Germany. J. Educ. Measure. 53, 332–351. doi: 10.1111/jedm.12115
Sheng, Y., and Wikle, C. K. (2008). Bayesian multidimensional IRT models with a hierarchical structure. Educ. Psychol. Meas. 68, 413–430. doi: 10.1177/0013164407308512
Siddique, J., de Chavez, P. J., Howe, G., Cruden, G., and Brown, C. H. (2018). Limitations in using multiple imputation to harmonize individual participant data for meta-analysis. Prevent. Sci. 19, 95–108. doi: 10.1007/s11121-017-0760-x
Sinharay, S., Johnson, M. S., and Stern, H. S. (2006). Posterior predictive assessment of item response theory models. Appl. Psychol. Meas. 30, 298–321. doi: 10.1177/0146621605285517
Spiegelhalter, D. J., Best, N. G., Carlin, B. P., and van der Linde, A. (2002). Bayesian measures of model complexity and fit (with discussion). J. R. Stat. Soc. Ser. B 64, 583–639. doi: 10.1111/1467-9868.00353
Streiner, D. L., Norman, G. R., and Cairney, J. (2015). Health Measurement Scales: A Practical Guide to Their Development and Use, 5th Edn. New York, NY: Oxford University Press. doi: 10.1093/med/9780199685219.001.0001
van der Linden, W. J. (2007). A hierarchical framework for modeling speed and accuracy on test items. Psychometrika 72, 287–308. doi: 10.1007/s11336-006-1478-z
Van der Linden, W. J., and Hambleton, R. K. (1997). Handbook of Modern Test Theory. New York, NY: Springer. doi: 10.1007/978-1-4757-2691-6
Witkiewitz, K., Hallgren, K. A., O'Sickey, A. J., Roos, C. R., and Maisto, S. A. (2016). Reproducibility and differential item functioning of the alcohol dependence syndrome construct across four alcohol treatment studies: an integrative data analysis. Drug Alcohol Depend. 158, 86–93. doi: 10.1016/j.drugalcdep.2015.11.001
Yao, L. (2010). BMIRT: Bayesian Multivariate Item Response Theory (Version 2) [Computer software]. Monterey, CA. Available online at: www.BMIRT.com
Keywords: higher-order IRT, multivariate IRT, multi-group IRT, Bayesian estimation, individual participant data, meta-analysis
Citation: Mun E-Y, Huo Y, White HR, Suzuki S and de la Torre J (2019) Multivariate Higher-Order IRT Model and MCMC Algorithm for Linking Individual Participant Data From Multiple Studies. Front. Psychol. 10:1328. doi: 10.3389/fpsyg.2019.01328
Received: 24 December 2018; Accepted: 21 May 2019;
Published: 12 June 2019.
Edited by:
Alessandro Giuliani, Istituto Superiore di Sanità (ISS), ItalyReviewed by:
Francesco Bartolucci, University of Perugia, ItalyHolmes Finch, Ball State University, United States
Copyright © 2019 Mun, Huo, White, Suzuki and de la Torre. This is an open-access article distributed under the terms of the Creative Commons Attribution License (CC BY). The use, distribution or reproduction in other forums is permitted, provided the original author(s) and the copyright owner(s) are credited and that the original publication in this journal is cited, in accordance with accepted academic practice. No use, distribution or reproduction is permitted which does not comply with these terms.
*Correspondence: Eun-Young Mun, ZXVuLXlvdW5nLm11bkB1bnRoc2MuZWR1