
94% of researchers rate our articles as excellent or good
Learn more about the work of our research integrity team to safeguard the quality of each article we publish.
Find out more
ORIGINAL RESEARCH article
Front. Psychol. , 11 April 2019
Sec. Eating Behavior
Volume 10 - 2019 | https://doi.org/10.3389/fpsyg.2019.00824
 Phaik Ling Quah1
 Lisa R. Fries2
 Mei Jun Chan1
 Anna Fogel3
 Keri McCrickerd3
 Ai Ting Goh3
 Izzuddin M. Aris1,4Yung Seng Lee1,4,5Wei Wei Pang6Iccha Basnyat7Hwee Lin Wee7,8Fabian Yap9
 Keith M. Godfrey10Yap-Seng Chong1,6Lynette P. C. Shek1,4
 Kok Hian Tan11
 Ciaran G. Forde3,12Mary F. F. Chong1,3,7*
Revised subscales of the Children’s Eating Behavior Questionnaire (CEBQ) have been proposed to be more appropriate for assessing appetitive traits in Singaporean 3 year-olds, but the CEBQ has not yet been validated in older children in this population. The current study aimed to validate the CEBQ at ages 5 (n = 653) and 6 (n = 449) in the ethnically diverse GUSTO cohort. Confirmatory factor analysis (CFA) examined whether the established eight-factor model of the CEBQ was supported in this sample. Overall, the CFA showed a poor model fit at both ages 5 and 6. At both ages 5 and 6, an exploratory factor analysis revealed a six-factor structure: food fussiness, enjoyment of food, slowness in eating, emotional undereating, emotional overeating and desire to drink. Cronbach’s alpha estimates ranged from 0.70 to 0.85 for all subscales. Criterion validity was tested by correlating subscales with the weight status of 6 years of age. At age 5 and 6, lower scores of slowness of eating while higher scores of enjoyment of food was associated with child overweight. At age 6, higher scores of desire to drink was also associated child overweight. In conclusion, a revised six factor-structure of the CEBQ at ages 5 and 6 were more appropriate for examining appetitive traits in this sample.
Individual differences in appetitive traits may determine how children learn to regulate their food intake, which eventually determines their weight gain later on in life (Fisher and Birch, 2002; Jansen et al., 2003; Wardle, 2007). The preschool years are a critical period when distinct eating behavior traits are formed, and when obesity interventions are most effective (Reinehr et al., 2010; Danielsson et al., 2012), making this a sensitive window for shaping healthy eating behaviors (Ashcroft et al., 2008; Svensson et al., 2011).
The Children’s Eating Behavior Questionnaire (CEBQ) (Wardle et al., 2001) is a parental-report instrument, developed to measure four food-approach subscales (food responsiveness, enjoyment of food, emotional overeating, and desire to drink), and four food-avoidant subscales (slowness in eating, satiety responsiveness, food fussiness, and emotional undereating) using 35 items. It was validated in the United Kingdom, in a sample of children with a mean age of 5 years with the use of directly observed measures of eating behavior (Carnell and Wardle, 2007), and has since been widely used in other countries (Croker et al., 2011; van Jaarsveld et al., 2011; Fuemmeler et al., 2013).
However, subsequent validation studies in other Western countries and in Asian countries have shown mixed results, with some replicating the original subscales (Mallan et al., 2013; Domoff et al., 2015), while others could not (Sleddens et al., 2008; Santos et al., 2011; Svensson et al., 2011; Cao et al., 2012; Quah et al., 2017). For studies that have failed to replicate the original subscales, exploratory factor analysis (EFA) was used to generate revised subscales that were more culturally relevant to Western countries like Sweden (Svensson et al., 2011), the Netherlands (Sleddens et al., 2008), Chile (Santos et al., 2011), and to Asian countries such as China (Cao et al., 2012), and Singapore (Quah et al., 2017).
Other than cultural factors affecting the interpretation of the items of this questionnaire, the emergence of different subscales across studies may vary depending on the age at which these eating behaviors were captured (Wardle et al., 2001; Ashcroft et al., 2008; Sleddens et al., 2008; Svensson et al., 2011). There is evidence suggesting that eating behaviors may still be changing and developing in children between ages 1–6 years (Dovey et al., 2008; Svensson et al., 2011).
We have previously demonstrated that among Singaporean preschoolers that CEBQ administered at children aged 3 year old was a poor fit to the original questionnaire by Wardle et al. (2001). The factor structure differed from the original, such that items from the enjoyment of food, food responsiveness and food fussiness subscales, and items from the food responsiveness and emotional eating items were merged as new subscales (Quah et al., 2017). However, as eating behaviors tend to stabilize at later ages (Wardle et al., 2001), we hypothesize that the original 8-factor CEBQ administered to our Singapore population may be a better fit in the older children. In the current study, we aim to examine the fit of the original 8-factor CEBQ 2–3 years later in children aged 5 and 6 years of age.
We obtained data from the Growing Up in Singapore Toward healthy Outcomes (GUSTO) Study1. Detailed information on study design and measurements were previously published (Soh et al., 2014). In this study, the main participants were pregnant Chinese, Malay, and Indian women recruited at 14 weeks of gestation from 2 major public maternity units of Kandang Kerbau Women’s and Children’s Hospital (KKH) and the National University Hospital (NUH) in Singapore from June 2009 to September 2010. Women excluded from the study were those on chemotherapy or psychotropic drugs, or those with type 1 diabetes. Of 3751 women screened, 2034 met eligibility criteria, 1247 were recruited and 1152 women had naturally conceived singleton pregnancies. This study was carried out in accordance with the recommendations from the National Healthcare Group Domain Specific Review Board and the SingHealth Centralized Institutional Review Board with written informed consent from all the mothers. All the mothers gave written informed consent in accordance with the Declaration of Helsinki. The protocol was approved by the National Healthcare Group Domain Specific Review Board and the SingHealth Centralized Institutional Review Board.
We collected data on maternal ethnicity, educational level, household income, marital status, and maternal age from participants at the recruitment visit. Maternal pre-pregnancy BMI was derived from self-reported pre-pregnancy weight, and standing height measured with the stadiometer (SECA model 213). Information on child sex and birth order was obtained from obstetric records. The weight of the child at 6 years of age was measured using a calibrated digital scale to the nearest 10 g, and standing height was measured with the use of a stadiometer (SECA model 813; SECA Corp.). For reliability, all measurements were taken in duplicates. Child BMI was calculated as weight divided by the square of height. Based on WHO Child Growth Standards 2007, age and sex-adjusted BMI z-scores were derived using the WHO Anthro software (Version 3.2.2) (de Onis et al., 2007). Using the Center for Disease Control (CDC) guidelines, overweight subjects are defined as BMI z-scores at or above the 85th percentile, normal weight as 5th percentile to less than the 85th percentile, and underweight subjects as those below the 5th percentile (Kuczmarski et al., 2000).
The original CEBQ was intended to capture eight eating behavior subscales (Wardle et al., 2001): Satiety Responsiveness; Slowness in Eating; Food Fussiness; Food Responsiveness; Enjoyment of Food; Desire to Drink; Emotional Undereating and Emotional Overeating. It was completed by the mother in English, which is the administrative language in Singapore, when her child turned 5 and 6 years old.
As with our previous study on the validation of the CEBQ in children aged 3, the CFA was applied in this study to test the adequacy of fit of the 35-item, 8-factor CEBQ model hypothesized in the original development paper by Wardle et al. (2001). In children aged 3, the statistical methods of the CFA and EFA, revealed a revised seven-factor structure of eating behavior subscales that were more suited for our population (Quah et al., 2017). To enable comparisons with our previous study (Quah et al., 2017) and others (Sleddens et al., 2008; Svensson et al., 2011), we have adopted similar data analytical methods, and have analyzed our data sequentially as follows: (i) adequacy of fit of the CEBQ at ages 5 and 6 years to original model using the CFA. (ii) if required, modification indices will be explored and parameters will be freed to improve the model fit. (iii) if modifications fail to improve the model fit, an EFA approach will be adopted to generate revised subscales for the questionnaire at each time point.
The model fit was evaluated using several fit indices: RMSEA, SRMR, CFI, and TLI. Smaller values for RMSEA (ideally < 0.06) and SRMR (<0.08), while larger values for CFI and TLI (ideally > 0.90) are indicative of acceptable model fit of the data (Hu and Bentler, 1999). A chi-square statistic was used to test the overall model fit, where non-significance (p > 0.05) suggests the model fits the data (Hu and Bentler, 1999). The EFA was run using the principal component factor method, and the number of factors to retain was determined using parallel analysis. Factors extracted were retained for further analysis when eigenvalues from actual data are larger than parallel eigenvalues from random data. This method is a more reliable than solely depending on eigenvalue scores generated by factor analytic processes alone, and was chosen to minimize over-extraction of factors (Horn, 1965). The varimax rotation was still applied for easier interpretation, and a factor loading cutoff of >0.35 was applied (Kim and Mueller, 1978; Kline, 1994). New variables (estimated scores) were generated for further analysis by the default regression method (Thompson scoring) (Thomson, 1951).
Of 1152 women with naturally conceived singleton pregnancy, and who met the eligibility criteria, n = 668 subjects filled out the questionnaire at year 5 and n = 468 at year 6. Subjects who did not participate in the study were the ones who did not answer the questionnaire, twins and drop-outs of the study. Out of all the subjects who attempted the questionnaires, 2.3% (n = 15) of the subjects at year 5, and 4.9% (n = 23) at year 6, had missing data from not completing the entire questionnaire. We had a subgroup of n = 375 subjects who answered the questionnaires at both ages 5 and 6 years that was used to conduct sensitivity analysis. All values were assumed to be missing at random based on the Little Missing Completely at Random (MCAR) test (p-value > 0.05). Based on this assumption and the low percentage of missing data, we chose to apply a listwise deletion to the subjects with missing data (Kang, 2013).
The distribution of maternal and infant characteristics between subjects who completed the questionnaires at years 5, 6 and at both time points were compared using the chi-square test for categorical outcome variables, and ANOVA for continuous outcomes to determine if there were significant differences across the groups. Internal consistency of the subscales was determined using Cronbach’s alpha coefficient, where a value greater than 0.7 was considered to be acceptable (Tavakol and Dennick, 2011). Criterion-related validity was assessed by using a one-way ANCOVA (analysis of covariance) to examine the associations between the eating behavior subscales and weight status (overweight, normal weight, and underweight) controlling for maternal ethnicity. A stratified analysis was also conducted to examine these associations by ethnic groups. All analyses were performed using STATA version 14.1 (StataCorp LP, United States). A 2-sided p < 0.05 was considered to be statistically significant.
Characteristics of the participants who completed the questionnaire at age 5 (n = 653) and age 6 (n = 445) were included in Supplementary Table 1. There were no significant differences in the characteristics between the two groups. On average, mothers were 30 years old, of post-secondary or tertiary educational status, had an average household income of S$2000-5999, a pre-pregnancy BMI of 26.5 and a majority was married. Approximately half the children were boys and were not first born, and the average BMI z-score at age 6 years was within the normal range of 0.06 to 0.08. There were approximately 16% of children who were overweight, 5% who were underweight and 80% with normal weight statuses. The characteristics of the subset with overlapping subjects (n = 375) at both time points did not significantly differ from these two groups (Supplementary Table 1).
The model was a poor fit at age 5 years according to the CFA goodness-of-fit indices: χ2(540) = 2890.2, p < 0.001, RMSEA = 0.081 (PCLOSE < 0.001), SRMR = 0.233, CFI = 0.780, and TLI = 0.758 (Hu and Bentler, 1999). Modification indices followed by freeing of parameters did not improve the model fit. We then proceeded to use EFA as a data driven approach to generate revised eating behavior subscales. The parallel analysis recommended 6 factors to be retained, and items were retained with factor loading scores of 0.35 or greater. Of the six factors, two subscales, food fussiness and desire to drink, maintained their original items, whereas four had revised items lists (Table 1). In the revised enjoyment of food subscale, four items from the enjoyment of food subscale loaded together with four items from the food responsiveness subscale, and one item from the satiety responsiveness subscale (“My child has a big appetite”). In the revised slowness in eating subscale, four items from the slowness in eating subscale loaded together with two items from the satiety responsiveness subscale. In the revised emotional undereating subscale, four items from the emotional undereating subscale loaded together with two items from the satiety responsiveness subscale. In the revised emotional overeating subscale, one item from the food responsiveness subscale loaded together with all four items from the emotional overeating subscale.
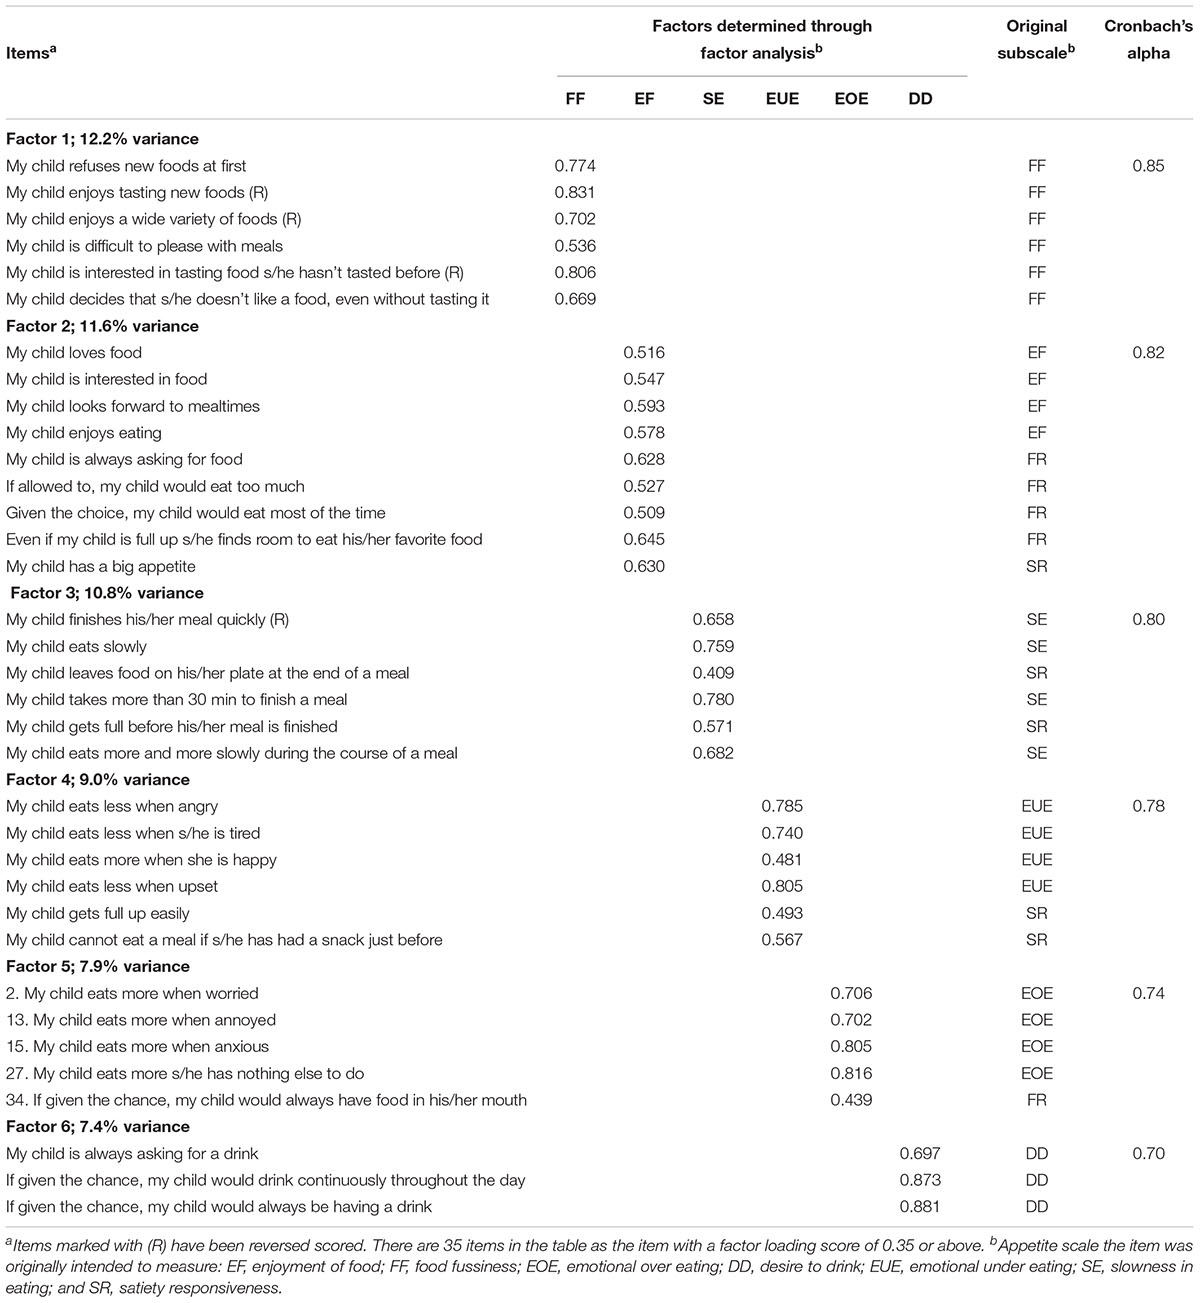
Table 1. Factor loadings for all items of the Children’s Eating Behavior Questionnaire (CEBQ) at 5 years and Cronbach’s alpha scores for each factor structure (n = 653).
The CEBQ at age 6 years was also not a good fit to the original factor structure according to the CFA goodness-of-fit indices; χ2(540) = 2441.6, p < 0.001, RMSEA = 0.086 (PCLOSE < 0.001), SRMR = 0.270, CFI = 0.749, and TLI = 0.742. Similar to year 5, modification indices and freeing up parameters did not improve the model fit. The parallel analysis recommended only 6 factors to be retained from the 7 factors extracted (Table 2). At age 6 years, only two subscales acquired new items: enjoyment of food and emotional overeating. The items loaded onto these two revised subscales were similar to the revised subscales generated at year 5.
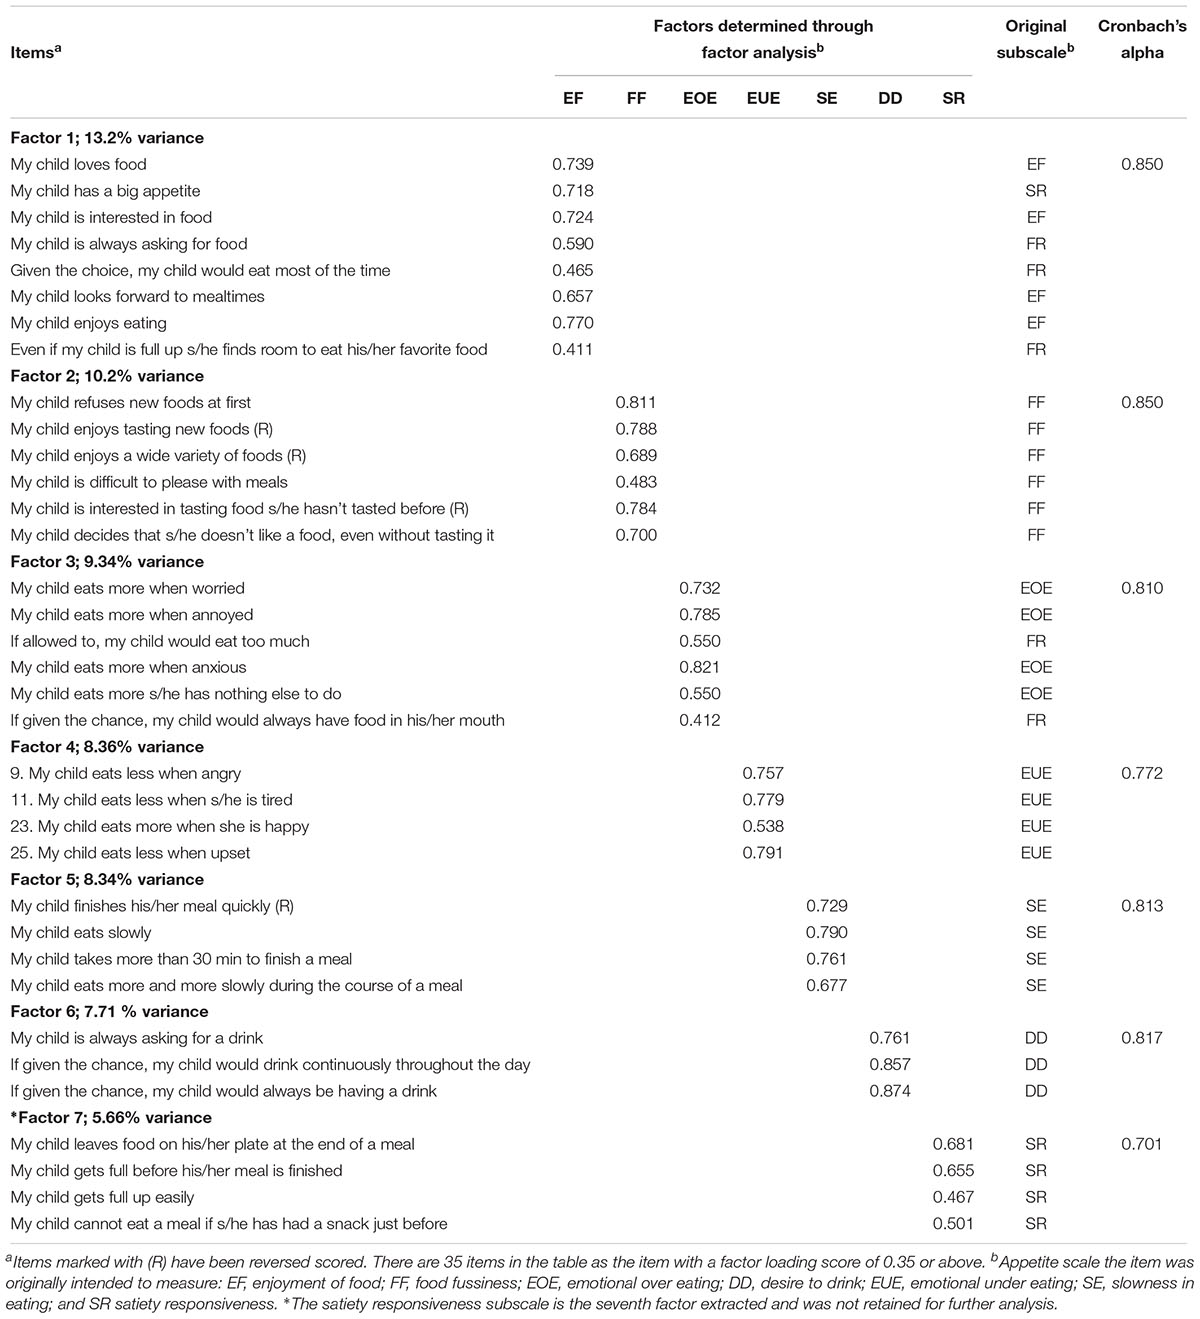
Table 2. Factor loadings for all items of the CEBQ at 6 years and Cronbach’s alpha scores for each factor structure (n = 445).
The revised subscales generated at both time points were mostly similar when the subset of overlapping n = 375 subjects were examined (Supplementary Tables 2, 3). The only differences were seen at year 5, where items from the enjoyment of food subscales loaded together with the food fussiness subscales in this subset but not in the sample of n = 653 subjects.
The extent to which all the items in a subscale measure the same concept or construct was good based on the Cronbach’s α estimates ranging from 0.70 to 0.85. The variances explained by the EFA models at year 5 and 6 were 58.8 and 56.6%, respectively (Tables 1, 2). Table 3 shows the association between the revised subscales at year 5 and 6 with the child weight status (underweight, normal weight and overweight) at 6 years of age, after adjustment for maternal ethnicity. Higher enjoyment of food and lower slowness in eating subscale scores at year 5 and 6 were associated with the child overweight status at year 6. Higher desire to drink subscale scores at year 6 was also associated to child overweight. Sensitivity analysis conducted in the subset of n = 375 subjects show similar significant associations at both 5 and 6 years of age (Supplementary Table 4).
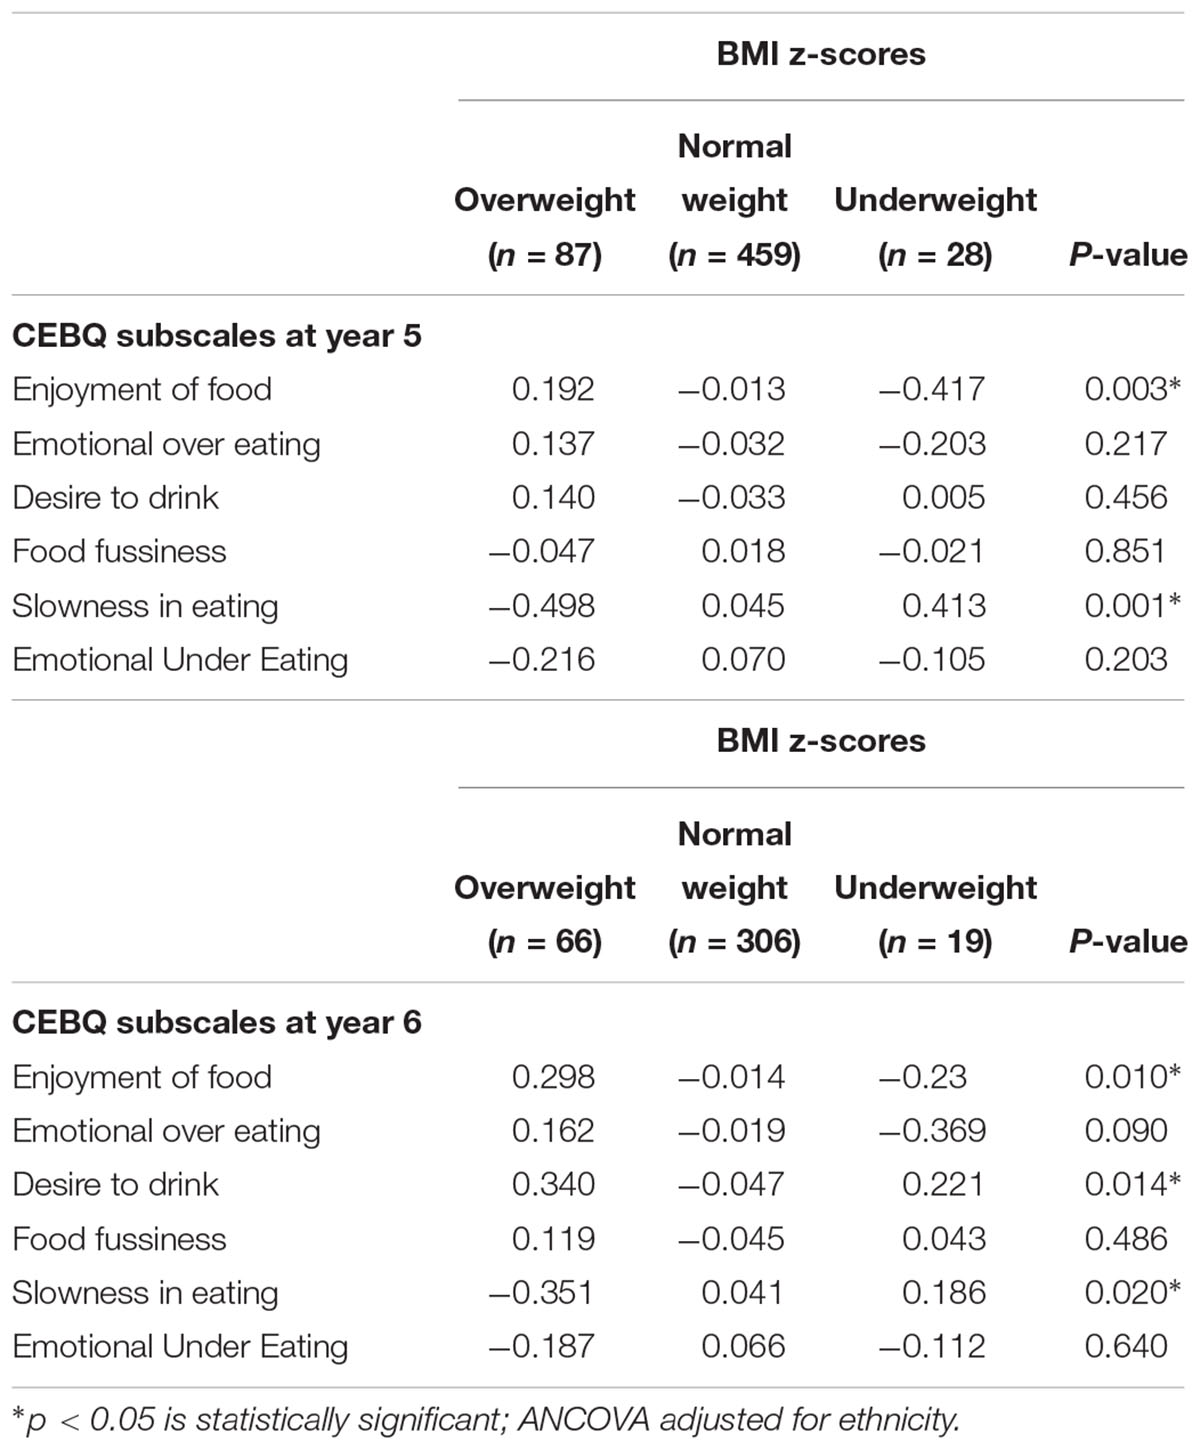
Table 3. Comparison between CEBQ revised subscales scores at ages 5 (n = 653) and 6 (n = 445) years with overweight, normal weight, and underweight status of children at 6 years adjusted for maternal ethnicity using ANCOVA (analysis of covariance).
In this study, we assessed the validity of the original eight-factor structure of the CEBQ (Wardle et al., 2001) in an Asian Singaporean cohort study in mothers of children aged 5 and 6 years old, and found it to be a poor fit. EFA revealed a revised 6-factor structure when the CEBQ was administered to mothers of children aged 5 and 6 years, respectively, which provided a more appropriate solution for our sample. The cumulative variance explained in our cohort was comparable to studies reported previously (Sleddens et al., 2008; Santos et al., 2011; Svensson et al., 2011). At ages 5 and 6 years old, higher scores of enjoyment of food and lower scores of slowness in eating was associated with overweight status in children aged 6, which provide evidence of criterion validity.
In this study, the enjoyment of food subscale captured in children aged 5 and 6 years was positively associated with overweight in children aged 6. At both time points, the enjoyment of food subscales merged with items from the food responsiveness subscale “My child is always asking for food”, “Given the choice, my child would eat most of the time” and “Even if my child is full up she/he finds room to eat his/her favorite food”, and one item from the satiety responsiveness subscales which was “My child has a big appetite” at both ages 5 and 6. These results from the EFA were consistent with our previous findings at age 3 (Quah et al., 2017), suggesting that the parents in our cohort are consistent with their interpretation of these items across the years. Furthermore, enjoyment of food was the only food approach subscale with scores that were consistently associated with higher BMI at all time points studied in children aged 3 (Quah et al., 2017), 5 and 6 years in our cohort. The direction of this association also concurs with previously reported studies (Sleddens et al., 2008; Viana et al., 2008; Webber et al., 2009; Santos et al., 2011). Interestingly, desire to drink which has been associated with consumption of sugar sweetened beverages (Sweetman et al., 2008) was only associated with child overweight at age 6, but not at younger ages (Quah et al., 2017). This observation could reflect the increase in consumption of sugar sweetened beverages in older children (Sweetman et al., 2008) which was subsequently associated with weight gain.
The items from the emotional eating subscale combined with items from the food responsiveness subscale at ages 5 and 6, which is consistent with our observations at age 3 (Quah et al., 2017). The merging of the emotional overeating subscales with items from the food responsiveness subscales has been reported by two other studies (Sleddens et al., 2008; Svensson et al., 2011). Significant positive associations between emotional overeating and BMI were reported in previous studies when the CEBQ was administered in older children with a mean age of 8 (Viana et al., 2008), 9.5 (Webber et al., 2009), and 9–10 years (Santos et al., 2011), but null associations were reported in our study, and previous studies in children close in age to our sample (mean age: 6.5 years) (Sleddens et al., 2008). These findings suggest that eating triggered by emotional stress may not be accurately or consistently perceived by parents in children at younger ages, and associations with weight might only emerge at later time points.
The slowness in eating subscales captured in children aged 5 and 6 were negatively associated with child overweight at ages 6 years. At year 5, items from the satiety responsiveness subscale “My child leaves food on his/her plate at the end of a meal” and “My child gets full before his/her meal is finished” loaded with the slowness in eating subscale at age 5, consistent with the original study by Wardle et al. (2001). Additionally, slowness in eating was the only food avoidance subscale that was significantly associated with lower BMI z-scores at all time points studied in children aged 3 (Quah et al., 2017), 5 and 6 years in our cohort, and the direction of association concurs with previously reported studies (Sleddens et al., 2008; Viana et al., 2008; Webber et al., 2009; Santos et al., 2011). In a separate study within our cohort, we have also shown that the reported slowness in eating scores at ages 5 and 6 captured using the CEBQ had significant negative correlations with measured eating rates (grams/minute) at similar time points (Fogel et al., 2017). This implies that the parental perception of the child’s slowness in eating concurs with actual eating rates measured in the laboratory, at least in terms of identifying slower eaters.
The emotional undereating subscale at age 5 was the other food avoidance subscale combined with items from the satiety responsiveness subscales. We speculate that parents who perceive a child to be eating less when experiencing negative emotions as a child who is just “not hungry” or “full” all the time. Similar to the emotional overeating subscale, emotional undereating was not associated with child weight outcomes, and previous studies have also seen significant associations between this subscale with lower BMI only in older children (Viana et al., 2008; Webber et al., 2009), but not in younger children (Sleddens et al., 2008).
Interestingly, the current study and our previous findings (Quah et al., 2017) have shown that slowness in eating and enjoyment of food were the only two subscales consistently associated with child BMI at ages 3, and overweight status at age 6 years. This highlights that slowness in eating and enjoyment of food subscales could be the most important eating behavior subscales to use for exploring child weight outcomes in our Singaporean cohort.
This study shows that the original 8-factor structure of the CEBQ was not replicated in our population. Instead, at ages 5 and 6 years our study revealed a 6-factor structure that is more valid for use in our population. Our study’s strength lies in the longitudinal collection of the CEBQ from a large multi-ethnic sample, which enabled us to validate the revised CEBQ subscales and compare them across the different time points.
The cultural relevance of the CEBQ for non-western populations have been previously assessed in China (Cao et al., 2012), an ethnically diverse (native Australian, immigrant Chinese, and Indians) setting in Australia (Mallan et al., 2013), and in a multi-ethnic setting of Chinese, Malays, and Indians in Malaysia (Loh et al., 2013). Similar to this study, the CEBQ of these previous studies were shown to be only a moderate or poor fit in the population, and revised factors (Cao et al., 2012; Loh et al., 2013) were also found to be more suitable for use in these populations. Overall, this highlights the value and need for validation studies on eating behavior questionnaires (including assessments of eating self-regulation and eating self-control) in different cultures to provide insight into the complexed influence of culture that may affect the perception of eating behaviors related to overweight/obesity (Ng et al., 2005).
Here, we show that in the multicultural Singaporean context, the CEBQ appears to be a reliable tool for us in different ethnic groups of (predominantly) highly educated mothers.
Our study has limitations which need to be addressed. Firstly, the CEBQ only provides a maternal perception of the child’s eating behavior, so other than the slowness in eating subscale, we still lack objective measures of the other eating behavior subscales. Secondly, the association between the CEBQ subscales with weight status of the children could be confounded by reverse causation (e.g., mothers of heavier children will perceive them as being more food responsive).
A valid and reliable eating behavior construct that is culturally appropriate, and reflects the interpretation by the local population is important for examining hypothesized relationships between eating behaviors and clinical outcomes of interest in our cohort (e.g., child BMI). We also plan to examine modifiable environmental factors (e.g., parenting feeding practices) associated with eating behaviors that might be related to child overweight such as the subscales of enjoyment of food and slowness in eating. These subscales will also be essential for examining associations with subsequent outcomes of child dietary intakes and growth. Our future studies shall also aim to establish the usefulness of the CEBQ across samples that differ by ethnicity.
From our validation study, a revised six factor model may be more relevant in measuring children’s eating behaviors at ages 5 and 6 years in our Singapore population. Furthermore, it supports the use of the revised slowness in eating and the enjoyment of food subscales in this questionnaire for examining relationships with child BMI outcomes. Our future studies shall also aim to establish the usefulness of the CEBQ across samples that differ by ethnicity.
This study was carried out in accordance with the recommendations from the National Healthcare Group Domain Specific Review Board and the SingHealth Centralized Institutional Review Board with written informed consent from all subjects. All subjects gave written informed consent in accordance with the Declaration of Helsinki. The protocol was approved by the National Healthcare Group Domain Specific Review Board and the SingHealth Centralized Institutional Review Board.
All authors were involved in all parts of the study and approved the final manuscript. FY, KMG, LPCS, KHT, and Y-SC designed and led the GUSTO cohort study. PLQ, MFFC, LRF, and CGF designed the study. PLQ contributed to the statistical analysis and writing of the manuscript. IB, AF, KM, and HLW provided intellectual contribution to the write-up of the manuscript and advice on the statistical analysis. MJC, ATG, and WWP were involved in the collection and the processing of the Children’s Eating Behavior Questionnaire. IMA and YSL contributed to the anthropometric data collection and the generation of the BMI z-score. PLQ, CGF, LRF, and MFFC were responsible for finalizing the manuscript.
This research was supported by the Singapore National Research Foundation under its Translational and Clinical Research (TCR) Flagship Program and administered by the Singapore Ministry of Health’s National Medical Research Council (NMRC), Singapore- NMRC/TCR/004-NUS/2008; NMRC/TCR/012-NUHS/2014. Additional funding was provided by the Singapore Institute for Clinical Sciences, Agency for Science, Technology and Research (A∗STAR), Singapore. KMG was supported by the National Institute for Health Research through the NIHR Southampton Biomedical Research Centre and by the European Union’s Seventh Framework Program (FP7/2007–2013), projects Early Nutrition and ODIN under grant agreement numbers 289346 and 613977. Additional funding of the present study was provided by the Singapore Institute for Clinical Sciences, A∗STAR and Nestec. The funders provided support in the form of salaries for authors (PLQ and MJC), but did not have any additional role in data collection in GUSTO or the decision to publish. The co-author (LRF) affiliated with the commercial funder (Nestec) helped to design the study, provided intellectual input on the content of the manuscript, and was involved in finalizing the manuscript. The specific roles of these authors are articulated in the “author contributions” section.
KMG and Y-SC have received reimbursement for speaking at conferences sponsored by companies selling nutritional products. These authors are part of an academic consortium that has received research funding from commercial affiliations such as Abbott Nutrition, Nestec, and Danone. LRF is an employee of Nestec SA, working at the Nestlé Research Center. CGF has received reimbursement for speaking at conferences sponsored by companies selling nutritional products, serves on the scientific advisory council for Kerry Taste and Nutrition, and is part of an academic consortium that has received research funding from Abbott Nutrition, Nestec, and Danone.
The remaining authors declare that the research was conducted in the absence of any commercial or financial relationships that could be construed as a potential conflict of interest.
The GUSTO study group includes Allan Sheppard, Amutha Chinnadurai, Anne Eng Neo Goh, Anqi Qiu, Arijit Biswas, Bee Wah Lee, Birit F. P. Broekman, Boon Long Quah, Borys Shuter, Chai Kiat Chng, Cheryl Ngo, Choon Looi Bong, Christiani Jeyakumar Henry, Cornelia Yin Ing Chee, Yam Thiam Daniel Goh, Doris Fok, George Seow Heong Yeo, Hugo P S van Bever, Iliana Magiati, Inez Bik Yun Wong, Ivy Yee-Man Lau, Jeevesh Kapur, Jenny L. Richmond, Jerry Kok Yen Chan, Joanna D. Holbrook, Joshua J. Gooley, Kenneth Kwek, Kok Hian Tan, Krishnamoorthy Niduvaje, Leher Singh, Lin Lin Su, Lourdes Mary Daniel, Lynette Pei-Chi Shek, Marielle V. Fortier, Mark Hanson, Mary Rauff, Mei Chien Chua, Mya Thway Tint, Neerja Karnani, Ngee Lek, Oon Hoe Teoh, P. C. Wong, Pratibha Agarwal, Rob M. van Dam, Salome A. Rebello, Shang Chee Chong, Shirong Cai, Shu-E Soh, Sok Bee Lim, Chin-Ying Stephen Hsu, Victor Samuel Rajadurai, Walter Stunkel, Wee Meng Han, Wei Wei Pang, Yap-Seng Chong, Yin Bun Cheung, Yiong Huak Chan, and Yung Seng Lee.
The Supplementary Material for this article can be found online at: https://www.frontiersin.org/articles/10.3389/fpsyg.2019.00824/full#supplementary-material
BMI z-score, body mass index z-score; CEBQ, children eating behavior questionnaire; CFA, confirmatory factor analysis; CFI, comparative fit index; EFA, exploratory analysis; RMSEA, root mean square error of approximation; SRMR, standardized root mean square residual; TLI, tucker lewis index.
Ashcroft, J., Semmler, C., Carnell, S., van Jaarsveld, C. H., and Wardle, J. (2008). Continuity and stability of eating behaviour traits in children. Eur. J. Clin. Nutr. 62, 985–990. doi: 10.1038/sj.ejcn.1602855
Cao, Y. T., Svensson, V., Marcus, C., Zhang, J., Zhang, J. D., and Sobko, T. (2012). Eating behaviour patterns in Chinese children aged 12-18 months and association with relative weight–factorial validation of the children’s eating behaviour questionnaire. Int. J. Behav. Nutr. Phys. Activ. 9:5. doi: 10.1186/1479-5868-9-5
Carnell, S., and Wardle, J. (2007). Measuring behavioural susceptibility to obesity: validation of the child eating behaviour questionnaire. Appetite 48, 104–113. doi: 10.1016/j.appet.2006.07.075
Croker, H., Cooke, L., and Wardle, J. (2011). Appetitive behaviours of children attending obesity treatment. Appetite 57, 525–529. doi: 10.1016/j.appet.2011.05.320
Danielsson, P., Svensson, V., Kowalski, J., Nyberg, G., Ekblom, O., and Marcus, C. (2012). Importance of age for 3-year continuous behavioral obesity treatment success and dropout rate. Obesity Facts 5, 34–44. doi: 10.1159/000336060
de Onis, M., Onyango, A. W., Borghi, E., Siyam, A., Nishida, C., and Siekmann, J. (2007). Development of a WHO growth reference for school-aged children and adolescents. Bull. World Health Organ. 85, 660–667. doi: 10.2471/BLT.07.043497
Domoff, S. E., Miller, A. L., Kaciroti, N., and Lumeng, J. C. (2015). Validation of the children’s eating behaviour questionnaire in a low-income preschool-aged sample in the United States. Appetite 95, 415–420. doi: 10.1016/j.appet.2015.08.002
Dovey, T. M., Staples, P. A., Gibson, E. L., and Halford, J. C. (2008). Food neophobia and ’picky/fussy’ eating in children: a review. Appetite 50, 181–193. doi: 10.1016/j.appet.2007.09.009
Fisher, J. O., and Birch, L. L. (2002). Eating in the absence of hunger and overweight in girls from 5 to 7 y of age. Am. J. Clin. Nutr. 76, 226–231. doi: 10.1093/ajcn/76.1.226
Fogel, A., Fries, L. R., McCrickerd, K., Goh, A. T., Quah, P. L., Chan, M. J., et al. (2017). Oral processing behaviours that promote children’s energy intake are associated with parent-reported appetitive traits: Results from the GUSTO cohort. Appetite 126, 8–15. doi: 10.1016/j.appet.2018.03.011
Fuemmeler, B. F., Lovelady, C. A., Zucker, N. L., and Ostbye, T. (2013). Parental obesity moderates the relationship between childhood appetitive traits and weight. Obesity 21, 815–823. doi: 10.1002/oby.20144
Horn, J. L. (1965). A rationale and test for the number of factors in factor analysis. Psychometrica 30, 179–185. doi: 10.1007/BF02289447
Hu, L. T., and Bentler, P. M. (1999). Cutoff criteria for fit indexes in covariance structure analysis: conventional criteria versus new alternatives. Struct. Equat. Model. A Multidiscipl. J. 6, 1–55. doi: 10.1080/10705519909540118
Jansen, A., Theunissen, N., Slechten, K., Nederkoorn, C., Boon, B., Mulkens, S., et al. (2003). Overweight children overeat after exposure to food cues. Eat. Behav. 4, 197–209. doi: 10.1016/S1471-0153(03)00011-4
Kang, H. (2013). The prevention and handling of the missing data. Korean J. Anesthesiol. 64, 402–406. doi: 10.4097/kjae.2013.64.5.402
Kim, J. O., and Mueller, C. W. (1978). Introduction to Factor Analysis: What it is and How to do it. Thousand Oaks, CA: Sage Publications. doi: 10.4135/9781412984652
Kuczmarski, R. J., Ogden, C. L., Guo, S. S., Grummer-Strawn, L. M., Flegal, K. M., Mei, Z., et al. (2000). CDC growth charts for the United States: methods and development. Natl. Center Health Stat. Vital Health Stat. 11:246.
Loh, D. A., Moy, F. M., Zaharan, N. L., and Mohamed, Z. (2013). Eating behaviour among multi-ethnic adolescents in a middle-income country as measured by the self-reported children’s eating behaviour questionnaire. PLoS One 8:e82885. doi: 10.1371/journal.pone.0082885
Mallan, K. M., Liu, W. H., Mehta, R. J., Daniels, L. A., Magarey, A., and Battistutta, D. (2013). Maternal report of young children’s eating styles. Validation of the children’s eating behaviour questionnaire in three ethnically diverse Australian samples. Appetite 64, 48–55. doi: 10.1016/j.appet.2013.01.003
Ng, T. P., Lim, L. C., Jin, A., and Shinfuku, N. (2005). Ethnic differences in quality of life in adolescents among Chinese, Malay and Indians in Singapore. Qual. Life Res. 14, 1755–1768. doi: 10.1007/s11136-005-1741-2
Quah, P. L., Cheung, Y. B., Pang, W. W., Toh, J. Y., Saw, S. M., Godfrey, K. M., et al. (2017). Validation of the Children’s Eating Behavior Questionnaire in 3 year old children of a multi-ethnic Asian population: the GUSTO cohort study. Appetite 113, 100–105. doi: 10.1016/j.appet.2017.02.024
Reinehr, T., Kleber, M., Lass, N., and Toschke, A. M. (2010). Body mass index patterns over 5 y in obese children motivated to participate in a 1-y lifestyle intervention: age as a predictor of long-term success. Am. J. Clin. Nutr. 91, 1165–1171. doi: 10.3945/ajcn.2009.28705
Santos, J. L., Ho-Urriola, J. A., Gonzalez, A., Smalley, S. V., Dominguez-Vasquez, P., Cataldo, R., et al. (2011). Association between eating behavior scores and obesity in Chilean children. Nutr. J. 10:108. doi: 10.1186/1475-2891-10-108
Sleddens, E. F., Kremers, S. P., and Thijs, C. (2008). The children’s eating behaviour questionnaire: factorial validity and association with body mass index in dutch children aged 6-7. Int. J. Behav. Nutr. Phys. Activ. 5:49. doi: 10.1186/1479-5868-5-49
Soh, S. E., Tint, M. T., Gluckman, P. D., Godfrey, K. M., Rifkin-Graboi, A., Chan, Y. H., et al. (2014). Cohort profile: Growing Up in Singapore Towards healthy Outcomes (GUSTO) birth cohort study. Int. J. Epidemiol. 43, 1401–1409. doi: 10.1093/ije/dyt125
Svensson, V., Lundborg, L., Cao, Y., Nowicka, P., Marcus, C., and Sobko, T. (2011). Obesity related eating behaviour patterns in Swedish preschool children and association with age, gender, relative weight and parental weight–factorial validation of the children’s eating behaviour questionnaire. Int. J. Behav. Nutr. Phys. Activ. 8:134. doi: 10.1186/1479-5868-8-134
Sweetman, C., Wardle, J., and Cooke, L. (2008). Soft drinks and ’desire to drink’ in preschoolers. Int. J. Behav. Nutr. Phys. Activ. 5:60. doi: 10.1186/1479-5868-5-60
Tavakol, M., and Dennick, R. (2011). Making sense of cronbach’s alpha. Int J. Med. Educ. 2, 53–55. doi: 10.5116/ijme.4dfb.8dfd
van Jaarsveld, C. H., Llewellyn, C. H., Johnson, L., and Wardle, J. (2011). Prospective associations between appetitive traits and weight gain in infancy. Am. J. Clin. Nutr. 94, 1562–1567. doi: 10.3945/ajcn.111.015818
Viana, V., Sinde, S., and Saxton, J. C. (2008). Children’s eating behaviour questionnaire: associations with BMI in Portuguese children. Br. J. Nutr. 100, 445–450. doi: 10.1017/S0007114508894391
Wardle, J. (2007). Eating behaviour and obesity. Obes. Rev. 8(Suppl. 1), 73–75. doi: 10.1111/j.1467-789X.2007.00322.x
Wardle, J., Guthrie, C. A., Sanderson, S., and Rapoport, L. (2001). Development of the children’s eating behaviour questionnaire. J. Child Psychol. Psychiatry 42, 963–970. doi: 10.1111/1469-7610.00792
Keywords: children’s eating behaviors, BMI z-score, confirmatory factor analysis, exploratory factor analysis, growing up in Singapore toward healthy outcomes
Citation: Quah PL, Fries LR, Chan MJ, Fogel A, McCrickerd K, Goh AT, Aris IM, Lee YS, Pang WW, Basnyat I, Wee HL, Yap F, Godfrey KM, Chong Y-S, Shek LPC, Tan KH, Forde CG and Chong MFF (2019) Validation of the Children’s Eating Behavior Questionnaire in 5 and 6 Year-Old Children: The GUSTO Cohort Study. Front. Psychol. 10:824. doi: 10.3389/fpsyg.2019.00824
Received: 03 January 2019; Accepted: 27 March 2019;
Published: 11 April 2019.
Edited by:
Kelly Costello Allison, University of Pennsylvania, United StatesReviewed by:
Myles S. Faith, University at Buffalo, United StatesCopyright © 2019 Quah, Fries, Chan, Fogel, McCrickerd, Goh, Aris, Lee, Pang, Basnyat, Wee, Yap, Godfrey, Chong, Shek, Tan, Forde and Chong. This is an open-access article distributed under the terms of the Creative Commons Attribution License (CC BY). The use, distribution or reproduction in other forums is permitted, provided the original author(s) and the copyright owner(s) are credited and that the original publication in this journal is cited, in accordance with accepted academic practice. No use, distribution or reproduction is permitted which does not comply with these terms.
*Correspondence: Mary F. F. Chong, ZXBobWNmZkBudXMuZWR1LnNn; bWFyeV9jaG9uZ0BudXMuZWR1LnNn
Disclaimer: All claims expressed in this article are solely those of the authors and do not necessarily represent those of their affiliated organizations, or those of the publisher, the editors and the reviewers. Any product that may be evaluated in this article or claim that may be made by its manufacturer is not guaranteed or endorsed by the publisher.
Research integrity at Frontiers
Learn more about the work of our research integrity team to safeguard the quality of each article we publish.