- Department of Psychology, York University, Toronto, ON, Canada
We provide a basic review of the data screening and assumption testing issues relevant to exploratory and confirmatory factor analysis along with practical advice for conducting analyses that are sensitive to these concerns. Historically, factor analysis was developed for explaining the relationships among many continuous test scores, which led to the expression of the common factor model as a multivariate linear regression model with observed, continuous variables serving as dependent variables, and unobserved factors as the independent, explanatory variables. Thus, we begin our paper with a review of the assumptions for the common factor model and data screening issues as they pertain to the factor analysis of continuous observed variables. In particular, we describe how principles from regression diagnostics also apply to factor analysis. Next, because modern applications of factor analysis frequently involve the analysis of the individual items from a single test or questionnaire, an important focus of this paper is the factor analysis of items. Although the traditional linear factor model is well-suited to the analysis of continuously distributed variables, commonly used item types, including Likert-type items, almost always produce dichotomous or ordered categorical variables. We describe how relationships among such items are often not well described by product-moment correlations, which has clear ramifications for the traditional linear factor analysis. An alternative, non-linear factor analysis using polychoric correlations has become more readily available to applied researchers and thus more popular. Consequently, we also review the assumptions and data-screening issues involved in this method. Throughout the paper, we demonstrate these procedures using an historic data set of nine cognitive ability variables.
Like any statistical modeling procedure, factor analysis carries a set of assumptions and the accuracy of results is vulnerable not only to violation of these assumptions but also to disproportionate influence from unusual observations. Nonetheless, the importance of data screening and assumption testing is often ignored or misconstrued in empirical research articles utilizing factor analysis. Perhaps some researchers have an overly indiscriminate impression that, as a large sample procedure, factor analysis is “robust” to assumption violation and the influence of unusual observations. Or, researchers may simply be unaware of these issues. Thus, with the applied psychology researcher in mind, our primary goal for this paper is to provide a general review of the data screening and assumption testing issues relevant to factor analysis along with practical advice for conducting analyses that are sensitive to these concerns. Although presentation of some matrix-based formulas is necessary, we aim to keep the paper relatively non-technical and didactic. To make the statistical concepts concrete, we provide data analytic demonstrations using different factor analyses based on an historic data set of nine cognitive ability variables.
First, focusing on factor analyses of continuous observed variables, we review the common factor model and its assumptions and show how principles from regression diagnostics can be applied to determine the presence of influential observations. Next, we move to the analysis of categorical observed variables, because treating ordered, categorical variables as continuous variables is an extremely common form of assumption violation involving factor analysis in the substantive research literature. Thus, a key aspect of the paper focuses on how the linear common factor model is not well-suited to the analysis of categorical, ordinally scaled item-level variables, such as Likert-type items. We then describe an alternative approach to item factor analysis based on polychoric correlations along with its assumptions and limitations. We begin with a review the linear common factor model which forms the basis for both exploratory factor analysis (EFA) and confirmatory factor analysis (CFA).
The Common Factor Model
The major goal of both EFA and CFA is to model the relationships among a potentially large number of observed variables using a smaller number of unobserved, or latent, variables. The latent variables are the factors. In EFA, a researcher does not have a strong prior theory about the number of factors or how each observed variable relates to the factors. In CFA, the number of factors is hypothesized a priori along with hypothesized relationships between factors and observed variables. With both EFA and CFA, the factors influence the observed variables to account for their variation and covariation; that is, covariation between any two observed variables is due to them being influenced by the same factor. This idea was introduced by Spearman (1904) and, largely due to Thurstone (1947), evolved into the common factor model, which remains the dominant paradigm for factor analysis today. Factor analysis is traditionally a method for fitting models to the bivariate associations among a set of variables, with EFA most commonly using Pearson product-moment correlations and CFA most commonly using covariances. Use of product-moment correlations or covariances follows from the fact that the common factor model specifies a linear relationship between the factors and the observed variables.
Lawley and Maxwell (1963) showed that the common factor model can be formally expressed as a linear model with observed variables as dependent variables and factors as explanatory or independent variables:

where yj is the jth observed variable from a battery of p observed variables, ηk is the kth of m common factors, λk is the regression coefficient, or factor loading, relating each factor to yj, and εj is the residual, or unique factor, for yj. (Often there are only one or two factors, in which case the right hand side of the equation includes only λ1η1 + εj or only λ1η1 + λ2η2 + εj.) It is convenient to work with the model in matrix form:

where y is a vector of the p observed variables, Λ is a p × m matrix of factor loadings, η is a vector of m common factors, and ε is a vector of p unique factors1. Thus, each common factor may influence more than one observed variable while each unique factor (i.e., residual) influences only one observed variable. As with the standard regression model, the residuals are assumed to be independent of the explanatory variables; that is, all unique factors are uncorrelated with the common factors. Additionally, the unique factors are usually assumed uncorrelated with each other (although this assumption may be tested and relaxed in CFA).
Given Eq. 1, it is straightforward to show that the covariances among the observed variables can be written as a function of model parameters (factor loadings, common factor variances and covariances, and unique factor variances). Thus, in CFA, the parameters are typically estimated from their covariance structure:

where Σ is the p × p population covariance matrix for the observed variables, Ψ is the m × m interfactor covariance matrix, and Θ is the p × p matrix unique factor covariance matrix that often contains only diagonal elements, i.e., the unique factor variances. The covariance structure model shows that the observed covariances are a function of the parameters but not the unobservable scores on the common or unique factors; hence, it is not necessary to observe scores on the latent variables to estimate the model parameters. In EFA, the parameters are most commonly estimated from the correlation structure

where P is the population correlation matrix and, in that P is simply a re-scaled version of Σ, we can view Λ*, Ψ*, and Θ* as re-scaled versions of Λ, Ψ, and Θ, respectively. This tendency to conduct EFA using correlations is mainly a result of historical tradition, and it is possible to conduct EFA using covariances or CFA using correlations. For simplicity, we focus on the analysis of correlations from this point forward, noting that the principles we discuss apply equivalently to the analysis of both correlation and covariance matrices (MacCallum, 2009; but see Cudeck, 1989; Bentler, 2007; Bentler and Savalei, 2010 for discussions of the analysis of correlations vs. covariances). We also drop the asterisks when referring to the parameter matrices in Eq. 3.
Jöreskog (1969) showed how the traditional EFA model, or an “unrestricted solution” for the general factor model described above, can be constrained to produce the “restricted solution” that is commonly understood as today’s CFA model and is well-integrated in the structural equation modeling (SEM) literature. Specifically, in the EFA model, the elements of Λ are all freely estimated; that is, each of the m factors has an estimated relationship (i.e., factor loading) with every observed variable; factor rotation is then used to aid interpretation by making some values in Λ large and others small. But in the CFA model, depending on the researcher’s hypothesized model, many of the elements of Λ are restricted, or constrained, to equal zero, often so that each observed variable is determined by one and only one factor (i.e., so that there are no “cross-loadings”). Because the common factors are unobserved variables and thus have an arbitrary scale, it is conventional to define them as standardized (i.e., with variance equal to one); thus Ψ is the interfactor correlation matrix2. This convention is not a testable assumption of the model, but rather imposes necessary identification restrictions that allow the model parameters to be estimated (although alternative identification constraints are possible, such as the marker variable approach often used with CFA). In addition to constraining the factor variances, EFA requires a diagonal matrix for Θ, with the unique factor variances along the diagonal.
Exploratory factor analysis and CFA therefore share the goal of using the common factor model to represent the relationships among a set of observed variables using a small number of factors. Hence, EFA and CFA should not be viewed as disparate methods, despite that their implementation with conventional software might seem quite different. Instead, they are two approaches to investigating variants of the same general model which differ according to the number of constraints placed on the model, where the constraints are determined by the strength of theoretical expectations (see MacCallum, 2009). Indeed, it is possible to conduct EFA in a confirmatory fashion (e.g., by using “target rotation”) or to conduct CFA in an exploratory fashion (e.g., by comparing a series of models that differ in the number or nature of the factors)3. Given that EFA and CFA are based on the same common factor model, the principles and methods we discuss in this paper largely generalize to both procedures. The example analyses we present below follow traditional EFA procedures; where necessary, we comment on how certain issues may be different for CFA.
In practice, a sample correlation matrix R (or sample covariance matrix S) is analyzed to obtain estimates of the unconstrained parameters given some specified value m of the number of common factors4. The parameter estimates can be plugged into Eq. 3 to derive a model-implied population correlation matrix,  The goal of model estimation is thus to find the parameter estimates that optimize the match of the model-implied correlation matrix to the observed sample correlation matrix. An historically popular method for parameter estimation in EFA is the “principal factors method with prior communality estimates,” or “principal axis factor analysis,” which obtains factor loading estimates from the eigenstructure of a matrix formed by
  (see MacCallum, 2009). But given modern computing capabilities, we agree with MacCallum (2009) that this method should be considered obsolete, and instead factor analysis models should be estimated using an iterative algorithm to minimize a model fitting function, such as the unweighted least-squares (ULS) or maximum likelihood (ML) functions. Although principal axis continues to be used in modern applications of EFA, iterative estimation, usually ML, is almost always used with CFA. In short, ULS is preferable to principal axis because it will better account for the observed correlations in R (specifically, it will produce a smaller squared difference between a given observed correlation and the corresponding model-implied correlation), whereas ML obtains parameter estimates that give the most likely account of the observed data (MacCallum, 2009; see also Briggs and MacCallum, 2003). Below, we discuss how the assumption of normally distributed observed variables comes into play for ULS and ML.
As shown above, given that the parameters (namely, the factor loadings in Λ and interfactor correlations in Ψ) are estimated directly from the observed correlations, R, using an estimator such as ML or ULS, factor analysis as traditionally implemented is essentially an analysis of the correlations among a set of observed variables. In this sense, the correlations are the data. Indeed, any factor analysis software program can proceed if a sample correlation matrix is the only data given; it does not need the complete raw, person by variable (N × p) data set from which the correlations were calculated5. Conversely, when the software is given the complete (N × p) data set, it will first calculate the correlations among the p variables to be analyzed and then fit the model to those correlations using the specified estimation method. Thus, it is imperative that the “data” for factor analysis, the correlations, be appropriate and adequate summaries of the relationships among the observed variables, despite that the common factor model makes no explicit assumptions about the correlations themselves. Thus, if the sample correlations are misrepresentative of the complete raw data, then the parameter estimates (factor loadings and interfactor correlations) will be inaccurate, as will model fit statistics and estimated SEs for the parameter estimates. Of course, more explicit assumption violation also can cause these problems. In these situations, information from the complete data set beyond just the correlations becomes necessary to obtain “robust” results.
Before we discuss these issues further, we first present a data example to illustrate the common factor model and to provide a context for demonstrating the main concepts of this article involving data screening and assumption testing for factor analysis. The purpose of this data example is not to provide a comprehensive simulation study for evaluating the effectiveness of different factor analytic methods; such studies have already been conducted in the literature cited throughout this paper. Rather, we use analyses of this data set to illustrate the statistical concepts discussed below so that they may be more concrete for the applied researcher.
Data Example
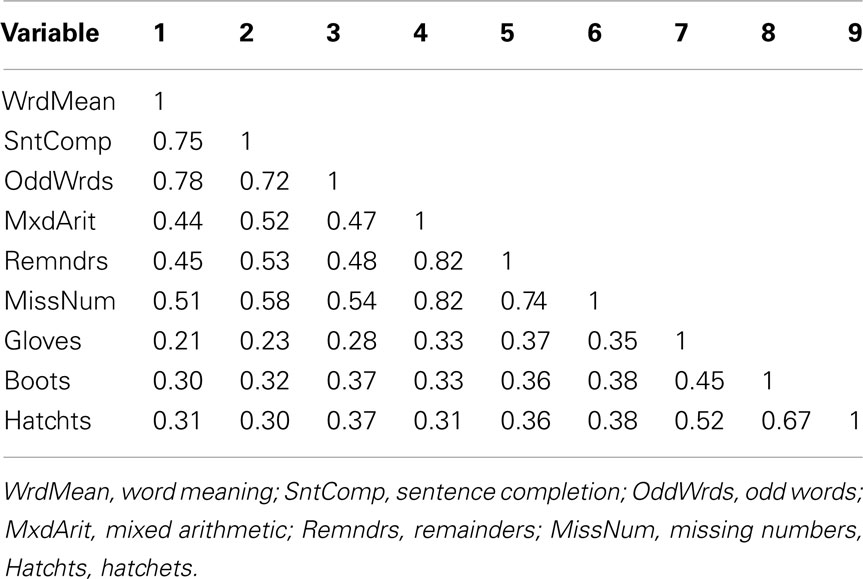
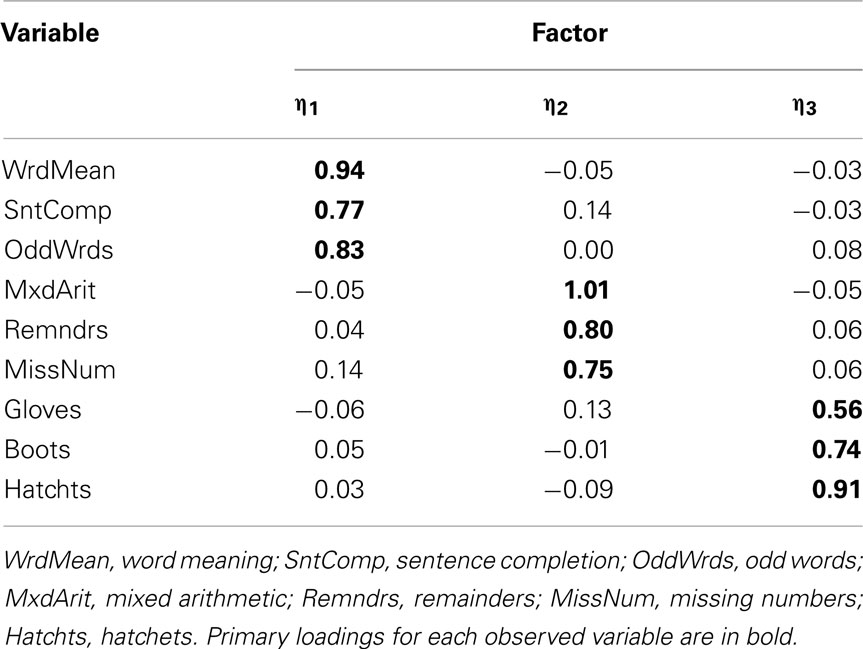
Our example is based on unpublished data reported in Harman (1960); these data and an accompanying factor analysis are described in the user’s guide for the free software package CEFA (Browne et al., 2010). The variables are scores from nine cognitive ability tests. Although the data come from a sample of N = 696 individuals, for our purposes we consider the correlation matrix among the nine variables to be a population correlation matrix (see Table 1) and thus an example of P in Eq. 3. An obliquely rotated (quartimin rotation) factor pattern for a three-factor model is considered the population factor loading matrix (see Table 2) and thus an example of Λ in Eq. 3. Interpretation of the factor loadings indicates that the first factor (η1) has relatively strong effects on the variables Word Meaning, Sentence Completion, and Odd words; thus, η1 is considered a “verbal ability” factor. The second factor (η2) has relatively strong effects on Mixed Arithmetic, Remainders, and Missing numbers; thus, η2 is “math ability.” Finally, the third factor (η3) is “spatial ability” given its strong influences on Gloves, Boots, and Hatchets. The interfactor correlation between η1 and η2 is ψ12 = 0.59, the correlation between η1 and η3 is ψ13 = 0.43, and η2 and η3 are also moderately correlated with ψ23 = 0.48.
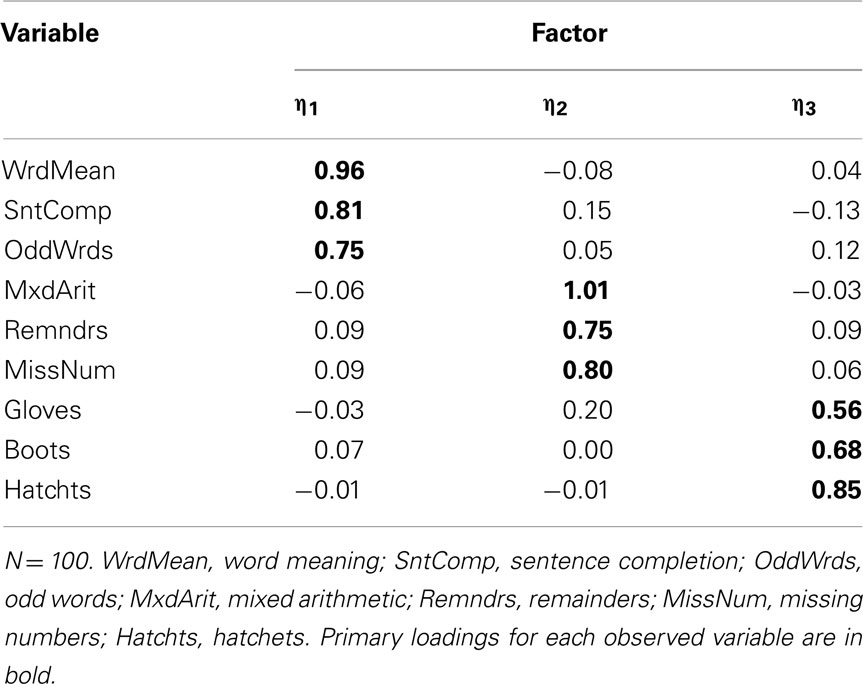
These population parameters give a standard against which to judge sample-based results for the same factor model that we present throughout this paper. To begin, we created a random sample of N = 100 with nine variables from a multivariate standard normal population distribution with a correlation matrix matching that in Table 1. We then estimated a three-factor EFA model using ULS and applied a quartimin rotation. The estimated rotated factor loading matrix,  , is in Table 3. Not surprisingly, these factor loading estimates are similar, but not identical, to the population factor loadings.
Regression Diagnostics for Factor Analysis of Continuous Variables
Because the common factor model is just a linear regression model (Eq. 1), many of the well-known concepts about regression diagnostics generalize to factor analysis. Regression diagnostics are a set of methods that can be used to reveal aspects of the data that are problematic for a model that has been fitted to that data (see Belsley et al., 1980; Fox, 1991, 2008, for thorough treatments). Many data characteristics that are problematic for ordinary multiple regression are also problematic for factor analysis; the trick is that in the common factor model, the explanatory variables (the factors) are unobserved variables whose values cannot be determined precisely. In this section, we illustrate how regression diagnostic principles can be applied to factor analysis using the example data presented above.
But taking a step back, given that factor analysis is basically an analysis of correlations, all of the principles about correlation that are typically covered in introductory statistics courses are also relevant to factor analysis. Foremost is that a product-moment correlation measures the linear relationship between two variables. Two variables may be strongly related to each other, but the actual correlation between them might be close to zero if their relationship is poorly approximated by a straight line (for example, a U-shaped relationship). In other situations, there may be a clear curvilinear relationship between two variables, but a researcher decides that a straight line is still a reasonable model for that relationship. Thus, some amount of subjective judgment may be necessary to decide whether a product-moment correlation is an adequate summary of a given bivariate relationship. If not, variables involved in non-linear relationships may be transformed prior to fitting the factor model or alternative correlations, such as Spearman rank-order correlations, may be factor analyzed (see Gorsuch, 1983, pp. 297–309 for a discussion of these strategies, but see below for methods for item-level categorical variables).
Visual inspection of simple scatterplots (or a scatterplot matrix containing many bivariate scatterplots) is an effective method for assessing linearity, although formal tests of linearity are possible (e.g., the RESET test of Ramsey, 1969). If there is a large number of variables, then it may be overly tedious to inspect every bivariate relationship. In this situation, one might focus on scatterplots involving variables with odd univariate distributions (e.g., strongly skewed or bimodal) or randomly select several scatterplots to scrutinize closely. Note that it is entirely possible for two variables to be linearly related even when one or both of them is non-normal; conversely, if two variables are normally distributed, their bivariate relationship is not necessarily linear. Returning to our data example, the scatterplot matrix in Figure 1 shows that none of the bivariate relationships among these nine variables has any clear departure from linearity.
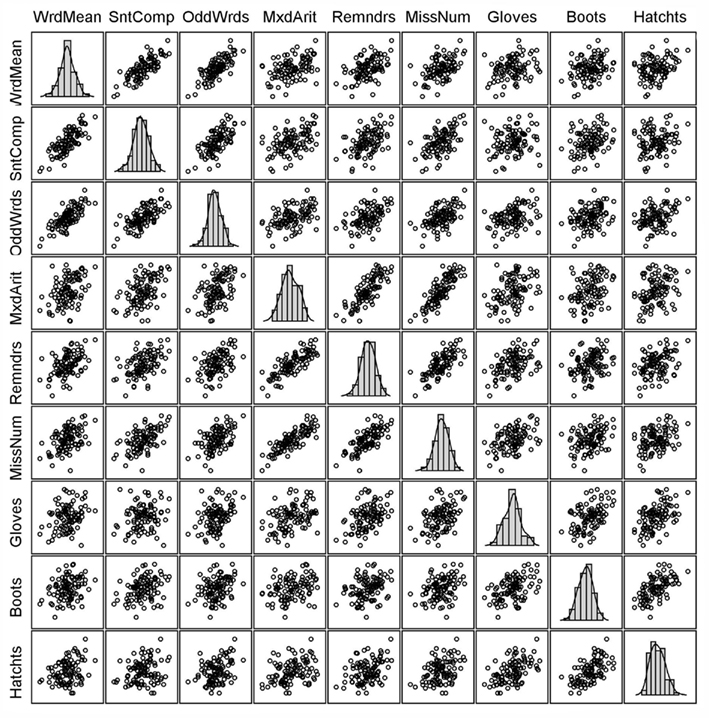
Figure 1. Scatterplot matrix for multivariate normal random sample consistent with Holzinger data (N = 100; no unusual cases).
Scatterplots can also be effective for identifying unusual cases, although relying on scatterplots alone for this purpose is not foolproof. Cases that appear to be outliers in a scatterplot might not actually be influential in that they produce distorted or otherwise misleading factor analysis results; conversely, certain influential cases might not easily reveal themselves in a basic bivariate scatterplot. Here, concepts from regression diagnostics come into play. Given that regression (and hence factor analysis) is a procedure for modeling a dependent variable conditional on one or more explanatory variables, a regression outlier is a case whose dependent variable value is unusual relative to its predicted, or modeled, value given its scores on the explanatory variables (Fox, 2008). In other words, regression outliers are cases with large residuals.
A regression outlier will have an impact on the estimated regression line (i.e., its slope) to the extent that it has high leverage. Leverage refers to the extent that a case has an unusual combination of values on the set of explanatory variables. Thus, if a regression outlier has low leverage (i.e., it is near the center of the multivariate distribution of explanatory variables), it should have relatively little influence on the estimated regression slope; that is, the estimated value of the regression slope should not change substantially if such a case is deleted. Conversely, a case with high leverage but a small residual also has little influence on the estimated slope value. Such a high leverage, small residual case is often called a “good leverage” case because its inclusion in the analysis leads to a more precise estimate of the regression slope (i.e., the SE of the slope is smaller). Visual inspection of a bivariate scatterplot might reveal such a case, and a naïve researcher might be tempted to call it an “outlier” and delete it. But doing so would be unwise because of the loss of statistical precision. Hence, although visual inspection of raw, observed data with univariate plots and bivariate scatterplots is always good practice, more sophisticated procedures are needed to gain a full understanding of whether unusual cases are likely to have detrimental impact on modeling results. Next, we describe how these concepts from regression diagnostics extend to factor analysis.
Factor Model Outliers
The factor analysis analog to a regression outlier is a case whose value for a particular observed variable is extremely different from its predicted value given its scores on the factors. In other words, cases with large (absolute) values for one or more unique factors, that is, scores on residual terms in ε, are factor model outliers. Eq. 1 obviously defines the residuals ε as

But because the factor scores (i.e., scores on latent variables in η) are unobserved and cannot be calculated precisely, so too the residuals cannot be calculated precisely, even with known population factor loadings, Λ. Thus, to obtain estimates of the residuals,  , it is necessary first to estimate the factor scores,
  , which themselves must be based on sample estimates of
  and
and  . Bollen and Arminger (1991) show how two well-known approaches to estimating factor scores, the least-squares regression method and Bartlett’s method, can be applied to obtain
  . As implied by Eq. 4, the estimated residuals
  are unstandardized in that they are in the metric of the observed variables, y. Bollen and Arminger thus present formulas to convert unstandardized residuals into standardized residuals. Simulation results by Bollen and Arminger show good performance of their standardized residuals for revealing outliers, with little difference according to whether they are estimated from regression-based factor scores or Bartlett-based factor scores.
Returning to our example sample data, we estimated the standardized residuals from the three-factor EFA model for each of the N = 100 cases; Figure 2 illustrates these residuals for all nine observed variables (recall that in this example, y consists of nine variables and thus there are nine unique factors in  ). Because the data were drawn from a standard normal distribution conforming to a known population model, these residuals themselves should be approximately normally distributed with no extreme outliers. Any deviation from normality in Figure 2 is thus only due to sampling error and error due to the approximation of factor scores. Later, we introduce an extreme outlier in the data set to illustrate its effects.
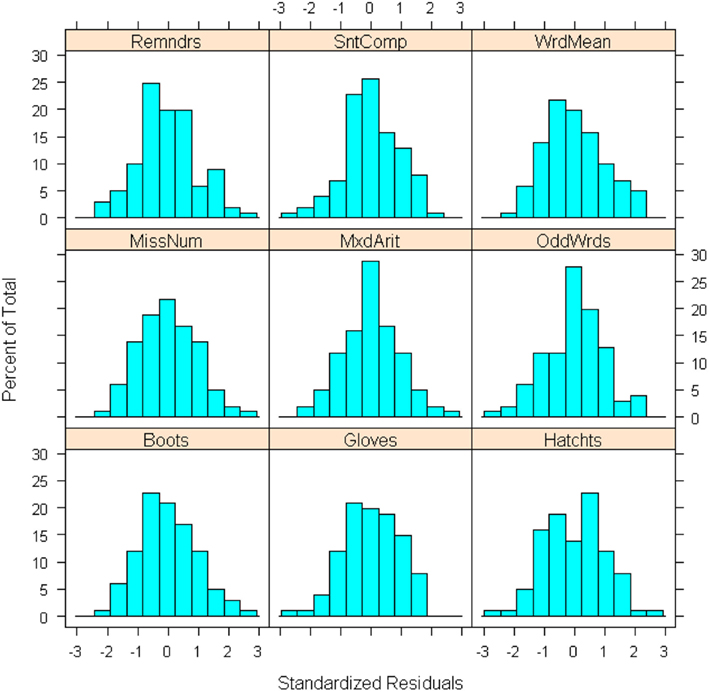
Figure 2. Histograms of standardized residuals for each observed variable from three-factor model fitted to random sample data (N = 100; no unusual cases).
Leverage
As mentioned above, in regression it is important to consider leverage in addition to outlying residuals. The same concept applies in factor analysis (see Yuan and Zhong, 2008, for an extensive discussion). Leverage is most commonly quantified using “hat values” in multiple regression analysis, but a related statistic, Mahalonobis distance (MD), also can be used to measure leverage (e.g., Fox, 2008). MD helps measure the extent to which an observation is a multivariate outlier with respect to the set of explanatory variables6. Here, our use of MD draws from Pek and MacCallum (2011), who recommend its use for uncovering multivariate outliers in the context of SEM. In a factor analysis, the MD for a given observation can be measured for the set of observed variables with

where y i is the vector of observed variable scores for case i,  is the vector of means for the set of observed variables, and S is the sample covariance matrix. Conceptually, MDi is the squared distance between the data for case i and the center of the observed multivariate “data cloud” (or data centroid), standardized with respect to the observed variables’ variances and covariances. Although it is possible to determine critical cut-offs for extreme MDs under certain conditions, we instead advocate graphical methods (shown below) for inspecting MDs because distributional assumptions may be dubious and values just exceeding a cut-off may still be legitimate observations in the tail of the distribution.
A potential source of confusion is that in a regression analysis, MD is defined with respect to the explanatory variables, but for factor analysis MD is defined with respect to the observed variables, which are the dependent variables in the model. But for both multiple regression and factor analysis, MD is a model-free index in that its value is not a function of the estimated parameters (but see Yuan and Zhong, 2008, for model-based MD-type measures). Thus, analogous to multiple regression, we can apply MD to find cases that are far from the center of the observed data centroid to measure their potential impact on results. Additionally, an important property of both MD and model residuals is that they are based on the full multivariate distribution of observed variables, and as such can uncover outlying observations that may not easily appear as outliers in a univariate distribution or bivariate scatterplot.
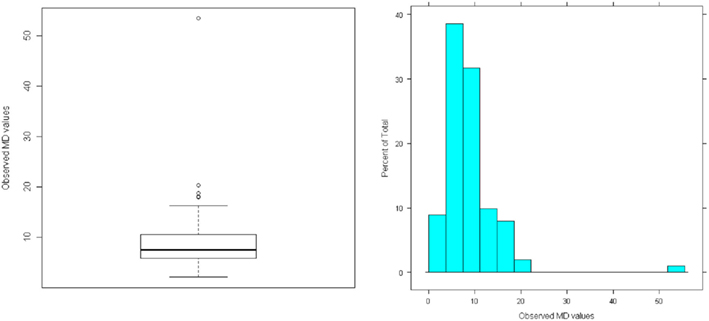
The MD values for our simulated sample data are summarized in Figure 3. The histogram shows that the distribution has a minimum of zero and positive skewness, with no apparent outliers, but the boxplot does reveal potential outlying MDs. Here, these are not extreme outliers but instead represent legitimate values in the tail of the distribution. Because we generated the data from a multivariate normal distribution we do not expect any extreme MDs, but in practice the data generation process is unknown and subjective judgment is needed to determine whether a MD is extreme enough to warrant concern. Assessing influence (see below) can aid that judgment. This example shows that extreme MDs may occur even with simple random sampling from a well-behaved distribution, but such cases are perfectly legitimate and should not be removed from the data set used to estimate factor models.
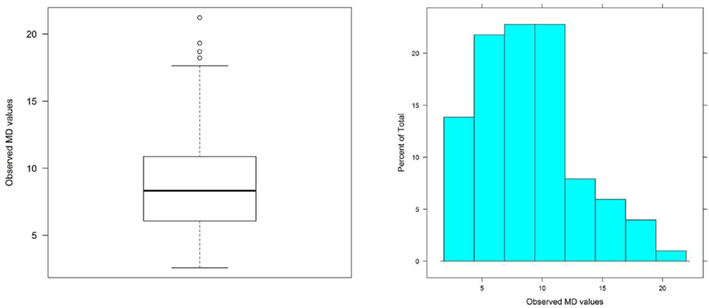
Figure 3. Distribution of Mahalanobis Distance (MD) for multivariate normal random sample data (N = 100; no unusual cases).
Influence
Again, cases with large residuals are not necessarily influential and cases with high MD are not necessarily bad leverage points (Yuan and Zhong, 2008). A key heuristic in regression diagnostics is that case influence is a product of both leverage and the discrepancy of predicted values from observed values as measured by residuals. Influence statistics known as deletion statistics summarize the extent to which parameter estimates (e.g., regression slopes or factor loadings) change when an observation is deleted from a data set.
A common deletion statistic used in multiple regression is Cook’s distance, which can be broadened to generalized Cook’s distance (gCD) to measure the influence of a case on a set of parameter estimates from a factor analysis model (Pek and MacCallum, 2011) such that

where  and
and  are vectors of parameter estimates obtained from the original, full sample and from the sample with case i deleted and
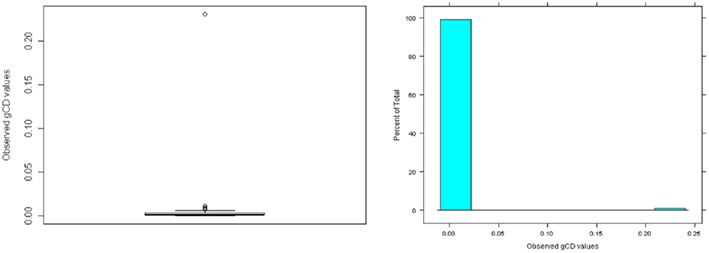
  consists of the estimated asymptotic variances (i.e., squared SEs) and covariances of the parameter estimates obtained with case i deleted. Like MD, gCD is in a squared metric with values close to zero indicating little case influence on parameter estimates and those far from zero indicating strong case influence on the estimates. Figure 4 presents the distribution of gCD values calculated across the set of factor loading estimates from the three-factor EFA model fitted to the example data. Given the squared metric of gCD, the strong positive skewness is expected. The boxplot indicates some potential outlying gCDs, but again these are not extreme outliers and instead are legitimate observations in the long tail of the distribution.
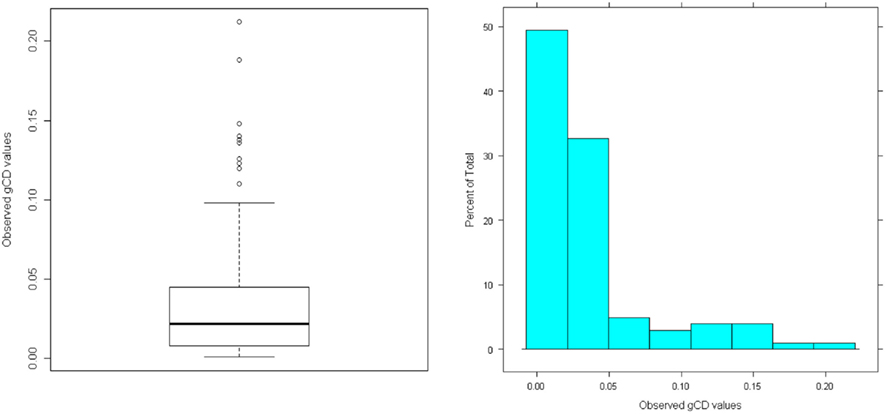
Figure 4. Distribution of generalized Cook’s distance (gCD) for multivariate normal random sample data (N = 100; no unusual cases).
Because gCD is calculated by deleting only a single case i from the complete data set, it is susceptible to masking errors, which occur when an influential case is not identified as such because it is located in the multivariate space close to one or more similarly influential cases. Instead, a local influence (Cadigan, 1995; Lee and Wang, 1996) or forward search (Poon and Wong, 2004; Mavridis and Moustaki, 2008) approach can be used to identify groups of influential cases. It is important to recognize that when a model is poorly specified (e.g., the wrong number of factors has been extracted), it is likely that many cases in a sample would be flagged as influential, but when there are only a few bad cases, the model may be consistent with the major regularities in the data except for these cases (Pek and MacCallum, 2011).
Example Demonstration
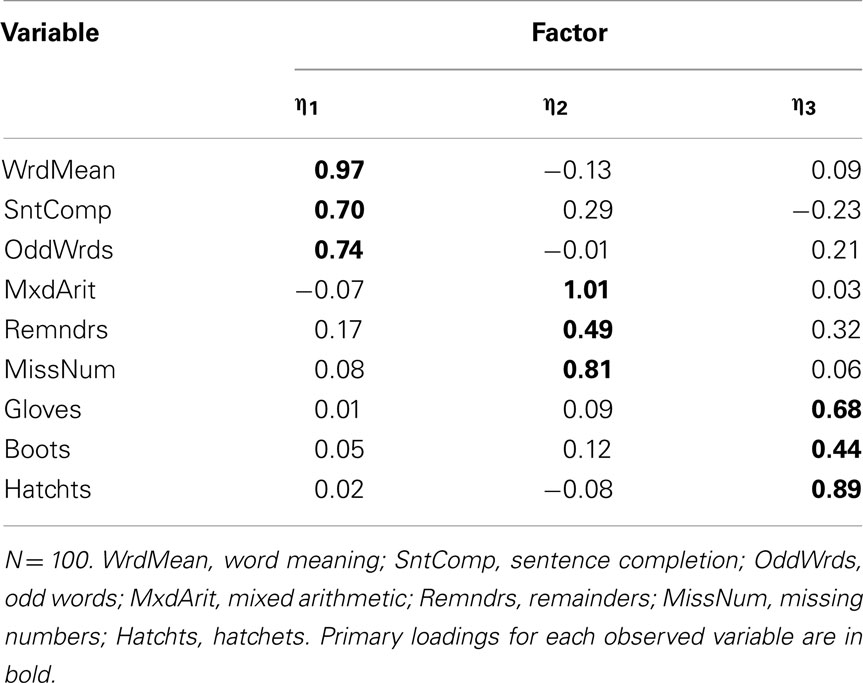
To give one demonstration of the potential effects of an influential case, we replaced one of the randomly sampled cases from the example data with a non-random case that equaled the original case with Z = 2 added to its values for five of the observed variables (odd-numbered items) and Z = 2 subtracted from the other four observed variables (even-numbered items). Figure 5 indicates the clear presence of this case in the scatterplot of Remainders by Mixed Arithmetic. When we conducted EFA with this perturbed data set, the scree plot was ambiguous as to the optimal number of factors, although other model fit information, such as the root mean square residual (RMSR) statistic (see MacCallum, 2009), more clearly suggested a three-factor solution. Importantly, the quartimin-rotated three-factor solution (see Table 4) has some strong differences from both the known population factor structure (Table 2) and the factor structure obtained with the original random sample (Table 3). In particular, while Remainders still has its strongest association with η2, its loading on this factor has dropped to 0.49 from 0.75 with the original sample (0.80 in the population). Additionally, Remainders now has a noticeable cross-loading on η3 equaling 0.32, whereas this loading had been 0.09 with the original sample (0.06 in the population). Finally, the loading for Boots on η3 has dropped substantially to 0.44 from 0.68 with the original sample (0.74 in the population).
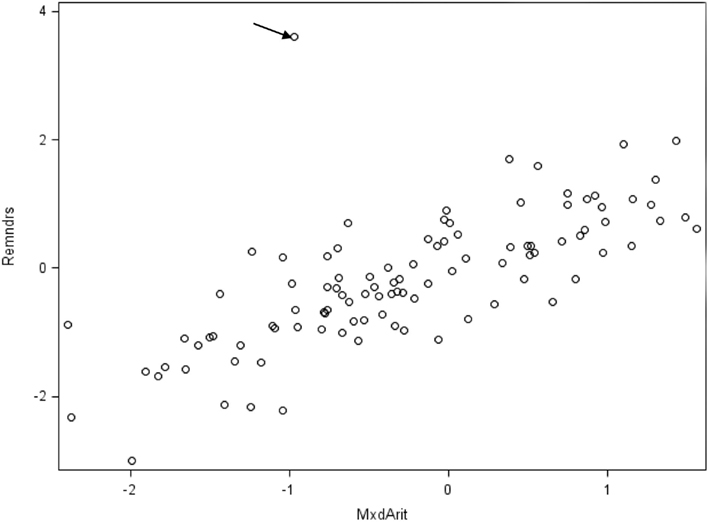
Figure 5. Scatterplot of “Remainders” by “Mixed Arithmetic” for perturbed sample with influential case indicated.
Having estimated a three-factor model with the perturbed data set, we then calculated the associated residuals  , the sample MD values, and the gCD values. Figure 6 gives histograms of the residuals, where it is clear that there is an outlying case for Mixed Arithmetic in particular. In Figure 7, the distribution of MD also indicates the presence of a case that falls particularly far from the centroid of the observed data; here the outlying observation has MD = 53.39, whereas the maximum MD value in the original data set was only 21.22. Given that the outlying case has both large residuals and large leverage, we expect it to have a strong influence on the set of model estimates. Hence, Figure 8 reveals that in the perturbed data set, all observations have gCD values very close to 0, but the outlying case has a much larger gCD reflecting its strong influence on the parameter estimates.
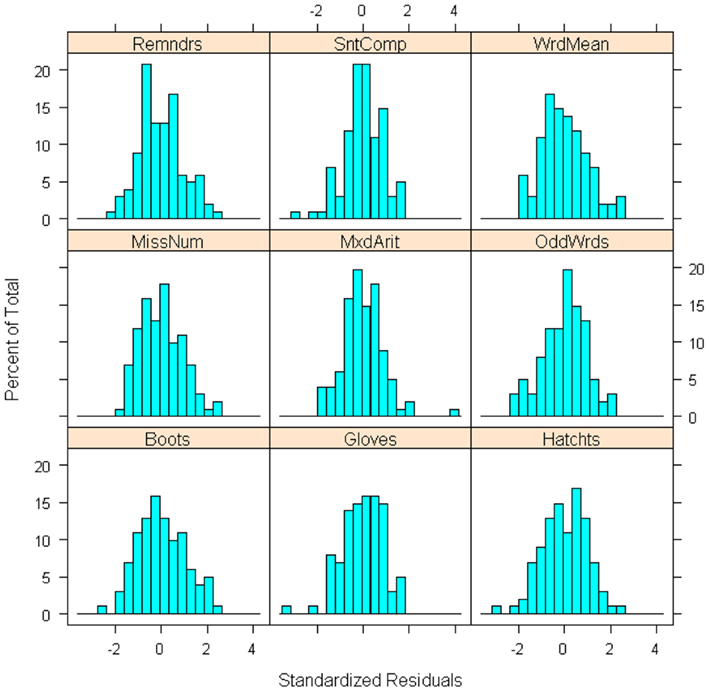
Figure 6. Histograms of standardized residuals for each observed variable from three-factor model fitted to perturbed sample data (N = 100).
The demonstration above shows how the presence of even one unusual case can have a drastic effect on a model’s parameter estimates; one can imagine how such an effect can produce a radically different substantive interpretation for a given variable within a factor model or even for the entire set of observed variables, especially if the unusual case leads to a different conclusion regarding the number of common factors. Improper solutions (e.g., a model solution with at least one negative estimated residual variance term, or “Heywood case”) are also likely to occur in the presence of one or more unusual cases (Bollen, 1987), which can lead to a researcher unwittingly revising a model or removing an observed variable from the analysis. Another potential effect of unusual cases is that they can make an otherwise approximately normal distribution appear non-normal by creating heavy tails in the distribution, that is, excess kurtosis (Yuan et al., 2002). As we discuss below, excess kurtosis can produce biased model fit statistics and SE estimates. Even if they do not introduce excess kurtosis, unusual cases can still impact overall model fit. The effect of an individual case on model fit with ML estimation can be formally measured with an influence statistic known as likelihood distance, which measures the difference in the likelihood of the model when a potentially influential case is deleted (Pek and MacCallum, 2011).
Upon discovering unusual cases, it is important to determine their likely source. Often, outliers and influential cases arise from either researcher error (e.g., data entry error or faulty administration of study procedures) or participant error (e.g., misunderstanding of study instructions or non-compliance with random responding) or they may be observations from a population other than the population of interest (e.g., a participant with no history of depression included in a study of depressed individuals). In these situations, it is best to remove such cases from the data set. Conversely, if unusual cases are simply extreme cases with otherwise legitimate values, most methodologists recommend that they not be deleted from the data set prior to model fitting (e.g., Bollen and Arminger, 1991; Yuan and Zhong, 2008; Pek and MacCallum, 2011). Instead, robust procedures that minimize the excessive influence of extreme cases are recommended; in particular, case-robust methods developed by Yuan and Bentler (1998) are implemented in the EQS software package (Bentler, 2004) or one can factor analyze a minimum covariance determinant (MCD) estimated covariance matrix (Pison et al., 2003), which can be calculated with SAS or the R package “MASS.”
Collinearity
Another potential concern for both multiple regression analysis and factor analysis is collinearity, which refers to perfect or near-perfect linear relationships among observed variables. With multiple regression, the focus is on collinearity among explanatory variables, but with factor analysis, the concern is collinearity among dependent variables, that is, the set of variables being factor analyzed. When collinear variables are included, the product-moment correlation matrix R will be singular, or non-positive definite. ML estimation cannot be used with a singular R, and although ULS is possible, collinearity is still indicative of conceptual issues with variable selection. Collinearity in factor analysis is relatively simple to diagnose: if any eigenvalues of a product-moment R equal zero or are negative, then R is non-positive definite and collinearity is present (and software will likely produce a warning message)7. Eigenvalues extremely close to zero may also be suggestive of near-collinearity8. A commonly used statistic for evaluating near-collinearity in ordinary regression is the condition index, which equals the square root of the ratio of the largest to smallest eigenvalue, with larger values more strongly indicative of near-collinearity. For the current example, the condition index equals 6.34, which is well below the value of 30 suggested by Belsley et al. (1980) as indicative of problematic near-collinearity.
In the context of factor analysis, collinearity often implies an ill-conceived selection of variables for the analysis. For example, if both total scores and sub-scale scores (or just one sub-scale) from the same instrument are included in a factor analysis, the total score is linearly dependent on, or collinear with, the sub-scale score. A more subtle example may be the inclusion of both a “positive mood” scale and a “negative mood” scale; although scores from these two scales may not be perfectly related, they will likely have a very strong (negative) correlation, which can be problematic for factor analysis. In these situations, researchers should carefully reconsider their choice of variables for the analysis and remove any that is collinear with one or more of the other observed variables, which in turn redefines the overall research question addressed by the analysis (see Fox, 2008, p. 342).
Non-Normality
In terms of obtaining accurate parameter estimates, the ULS estimation method mentioned above makes no assumption regarding observed variable distributions whereas ML estimation is based on the multivariate normal distribution (MacCallum, 2009). Specifically, for both estimators, parameter estimates are trustworthy as long as the sample size is large and the model is properly specified (i.e., the estimator is consistent), even when the normality assumption for ML is violated (Bollen, 1989). However, SE estimates and certain model fit statistics (i.e., the χ2 fit statistic and statistics based on χ2 such as CFI and RMSEA) are adversely affected by non-normality, particularly excess multivariate kurtosis. Although they are less commonly used with EFA, SEs and model fit statistics are equally applicable with EFA as with CFA and are easily obtained with modern software (but see Cudeck and O’Dell, 1994, for cautions and recommendations regarding SEs with EFA). With both approaches, SEs convey information about the sampling variability of the parameter estimates (i.e., they are needed for significance tests and forming confidence intervals) while model fit statistics can aid decisions about the number of common factors in EFA or more subtle model misspecification in CFA.
There is a large literature on ramifications of non-normality for SEM (in which the common factor model is imbedded), and procedures for handling non-normal data (for reviews see Bollen, 1989; West et al., 1995; Finney and DiStefano, 2006). In particular, for CFA we recommend using the Satorra–Bentler scaled χ2 and robust SEs with non-normal continuous variables (Satorra and Bentler, 1994), which is available in most SEM software. Although these Satorra–Bentler procedures for non-normal data have seen little application in EFA, they can be obtained for EFA models using Mplus software (Muthén and Muthén, 2010; i.e., using the SE estimation procedure outlined in Asparouhov and Muthén, 2009). Alternatively, one might factor analyze transformed observed variables that more closely approximate normal distributions (e.g., Gorsuch, 1983, pp. 297–309).
Factor Analysis of Item-Level Observed Variables
Through its history in psychometrics, factor analysis developed primarily in the sub-field of cognitive ability testing, where researchers sought to refine theories of intelligence using factor analysis to understand patterns of covariation among different ability tests. Scores from these tests typically elicited continuously distributed observed variables, and thus it was natural for factor analysis to develop as a method for analyzing Pearson product-moment correlations and eventually to be recognized as a linear model for continuous observed variables (Bartholomew, 2007). However, modern applications of factor analysis usually use individual test items rather than sets of total test scores as observed variables. Yet, because the most common kinds of test items, such as Likert-type items, produce categorical (dichotomous or ordinal) rather than continuous distributions, a linear factor analysis model using product-moment R is suboptimal, as we illustrate below.
As early as Ferguson (1941), methodologists have shown that factor analysis of product-moment R among dichotomous variables can produce misleading results. Subsequent research has further established that treating categorical items as continuous variables by factor analyzing product-moment R can lead to incorrect decisions about the number of common factors or overall model fit, biased parameter estimates, and biased SE estimates (Muthén and Kaplan, 1985, 1992; Babakus et al., 1987; Bernstein and Teng, 1989; Dolan, 1994; Green et al., 1997). Despite these issues, item-level factor analysis using product-moment R persists in the substantive literature likely because of either naiveté about the categorical nature of items or misinformed belief that linear factor analysis is “robust” to the analysis of categorical items.
Example Demonstration
To illustrate these potential problems using our running example, we categorized random samples of continuous variables with N = 100 and N = 200 that conform to the three-factor population model presented in Table 2 according to four separate cases of categorization. In Case 1, all observed variables were dichotomized so that each univariate population distribution had a proportion = 0.5 in both categories. In Case 2, five-category items were created so that each univariate population distribution was symmetric with proportions of 0.10, 0.20, 0.40, 0.20, and 0.10 for the lowest to highest categorical levels, or item-response categories. Next, Case 3 items were dichotomous with five variables (odd-numbered items) having univariate response proportions of 0.80 and 0.20 for the first and second categories and the other four variables (even-numbered items) having proportions of 0.20 and 0.80 for the first and second categories. Finally, five-category items were created for Case 4 with odd-numbered items having positive skewness (response proportions of 0.51, 0.30, 0.11, 0.05, and 0.03 for the lowest to highest categories) and even-numbered items having negative skewness (response proportions of 0.03, 0.05, 0.11, 0.30, and 0.51). For each of the four cases at both sample sizes, we conducted EFA using the product-moment R among the categorical variables and applied quartimin rotation after determining the optimal number of common factors suggested by the sample data. If product-moment correlations are adequate representations of the true relationships among these items, then three-factor models should be supported and the rotated factor pattern should approximate the population factor loadings in Table 2. We describe analyses for Cases 1 and 2 first, as both of these cases consisted of items with approximately symmetric univariate distributions.
First, Figure 9 shows the simple bivariate scatterplot for the dichotomized versions of the Word Meaning and Sentence Completion items from Case 1 (N = 100). We readily admit that this figure is not a good display for these data; instead, its crudeness is intended to help illustrate that it is often not appropriate to pretend that categorical variables are continuous. When variables are continuous, bivariate scatterplots (such as those in Figure 1) are very useful, but Figure 9 shows that they are not particularly useful for dichotomous variables, which in turn should cast doubt on the usefulness of a product-moment correlation for such data. More specifically, because these two items are dichotomized (i.e., 0, 1), there are only four possible observed data patterns, or response patterns, for their bivariate distribution (i.e., 0, 0; 0, 1; 1, 0; and 1, 1). These response patterns represent the only possible points in the scatterplot. Yet, depending on the strength of relationship between the two variables, there is some frequency of observations associated with each point, as each represents potentially many observations with the same response pattern. Conversely, the response pattern (0, 1) does not appear as a point in Figure 9 because there were zero observations with a value of 0 on the Sentence Completion item and a value of 1 on Word Meaning. As emphasized above, a product-moment correlation measures the strength of linear association between two variables; given the appearance of the scatterplot, use and interpretation of such a correlation here is clearly dubious, which then has ramifications for a factor analysis of these variables based on product-moment R (or covariances).
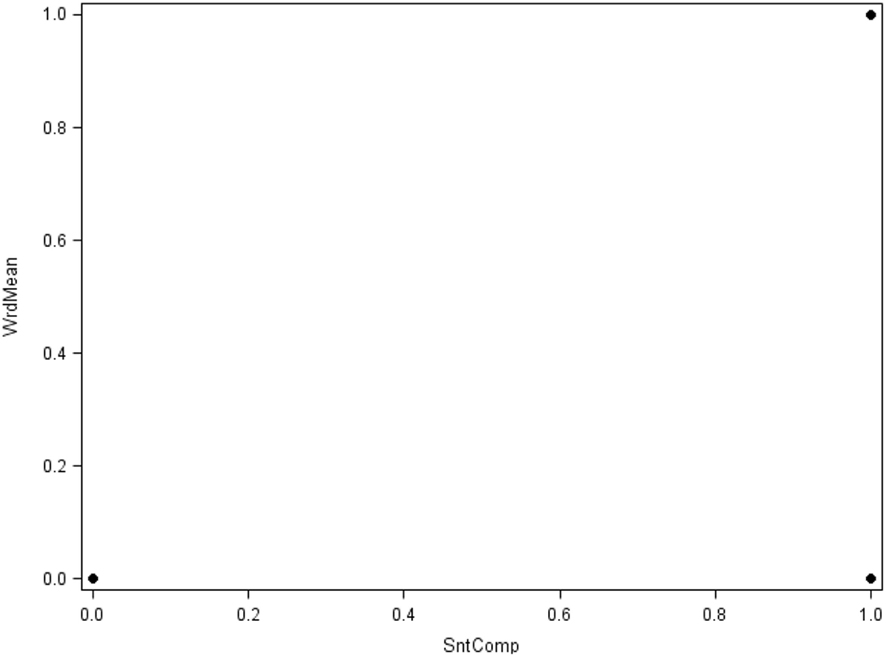
Figure 9. Scatterplot of Case 1 items Word Meaning (WrdMean) by Sentence Completion (SntComp; N = 100).
Next, Figure 10 shows the bivariate scatterplot for the five-category versions of the Word Meaning and Sentence Completion variables from Case 2 (N = 100). Now there are 5 × 5 = 25 potential response patterns, but again, not all appear as points in the plot because not all had a non-zero sample frequency. With more item-response categories, a linear model for the bivariate association between these variables may seem more reasonable but is still less than ideal, which again has implications for factor analysis of product-moment R among these items9.
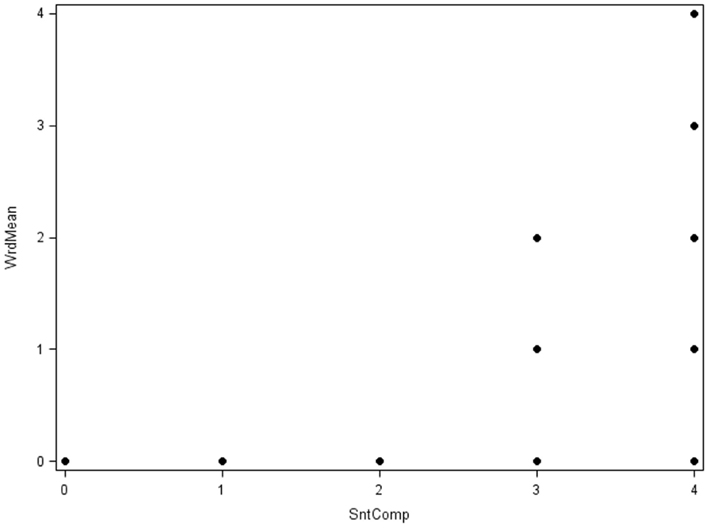
Figure 10. Scatterplot of Case 2 items Word Meaning (WrdMean) by Sentence Completion (SntComp; N = 100).
One consequence of categorization is that product-moment correlations are attenuated (see Table 5 for correlations among Case 1 items). For example, the population correlation between Word Meaning and Sentence Completion is 0.75, but the sample product-moment correlation between these two Case 1 items is 0.60 (with N = 100). But if all correlations among items are attenuated to a similar degree, then the overall pattern of correlations in R should be very similar under categorization, and thus factor analysis results may not be strongly affected (although certain model fit indices may be affected, adversely impacting decisions about the number of factors). Indeed, in the EFA of the Case 1 items it was evident that a three-factor model was ideal (based on numerous criteria) and the set of rotated factor loadings (see Table 6) led to essentially the same interpretations of the three factors as for the population model. Nonetheless, the magnitude of each primary factor loading was considerably smaller compared to the population model, reflecting that attenuation of correlations due to categorization leads to biased parameter estimates. Note also that factor loading bias was no better with N = 200 compared to N = 100, because having a larger sample size does not make the observed bivariate relationships stronger or “more linear.” However, attenuation of correlation is less severe with a larger number of response categories (see Table 7). In Case 2, the sample product-moment correlation between the Word Meaning and Sentence Completion items is 0.68, which is still attenuated relative to the population value 0.75, but less so than in Case 1. And when the EFA was conducted with the Case 2 variables, a similar three-factor model was obtained, but with factor loading estimates (see Table 8) that were less biased than those from Case 1.
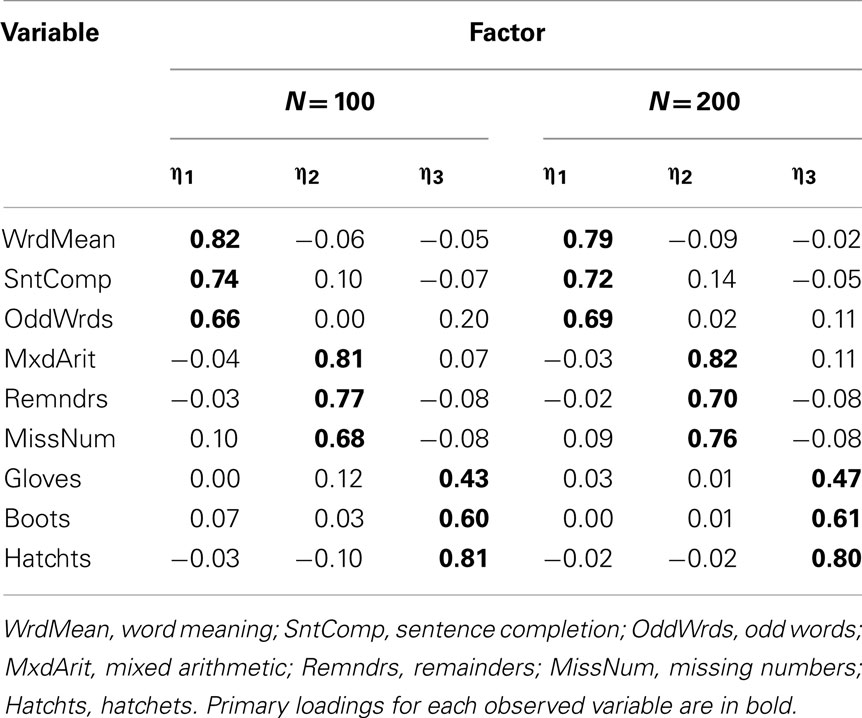
Table 6. Factor loading matrix obtained with EFA of product-moment R among Case 1 item-level variables.
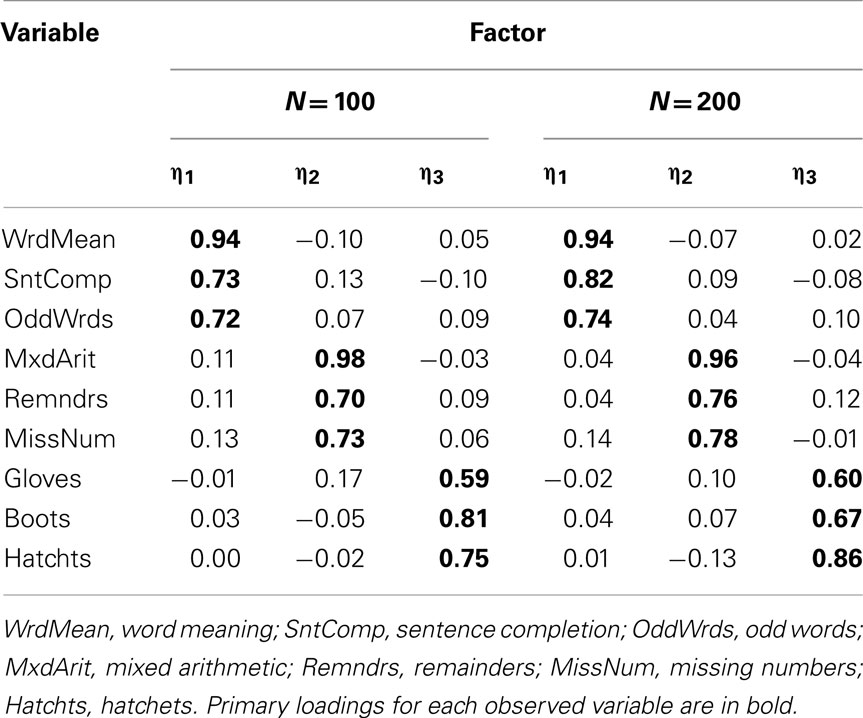
Table 8. Factor loading matrix obtained with EFA of product-moment R among Case 2 item-level variables.
Now consider Cases 3 and 4, which had a mix of positively and negatively skewed univariate item distributions. Any simple scatterplot of two items from Case 3 will look very similar to Figure 9 for the dichotomized versions of Word Meaning and Sentence Completion from Case 1 because the Case 3 items are also dichotomized, again leading to only four possible bivariate response patterns10. Likewise, any simple scatterplot of two items from Case 4 will look similar to Figure 10 for the five-category items from Case 2 because any bivariate distribution from Case 4 also has 25 possible response patterns. Yet, it is well-known that the product-moment correlation between two dichotomous or ordered categorical variables is strongly determined by the shape of their univariate distributions (e.g., Nunnally and Bernstein, 1994). For example, in Case 3, because the dichotomized Word Meaning and Sentence Completion items had opposite skewness, the sample correlation between them is only 0.24 (with N = 100) compared to the population correlation = 0.75 (see Table 9 for correlations among Case 3 items). In Case 4, these two items also had opposite skewness, but the sample correlation = 0.52 (with N = 100) is less severely biased because Case 4 items have five categories rather than two (see Table 10 for correlations among Case 4 items). Conversely, the Word Meaning and Hatchets items were both positively skewed; in Case 3, the correlation between these two items is 0.37 (with N = 100), which is greater than the population correlation = 0.31, whereas this correlation is 0.29 (with N = 100) for Case 4 items.
When we conducted EFA with the Case 3 and Case 4 items, scree plots suggested the estimation of two-, rather than three-factor models, and RMSR was sufficiently low to support the adequacy of a two-factor solution (RMSR = 0.056 for Case 3 and = 0.077 for Case 4). In practice, it is wise to compare results for models with varying numbers of factors, and here we know that the population model has three factors. Thus, we estimated both two- and three-factor models for the Case 3 and Case 4 items. In Case 3, the estimated three-factor models obtained with both N = 100 and N = 200 were improper in that there were variables with negative estimated residual variance (Heywood cases); thus, in practice a researcher would typically reject the three-factor model and interpret the two-factor model. Table 11 gives the rotated factor pattern for the two-factor models estimated with Case 3 items. Here, the two factors are essentially defined by the skewness direction of the observed variables: odd-numbered items, which are all positively skewed, are predominately determined by η1 while the negatively skewed even-numbered items are determined by η2 (with the exception of the Boots variable). A similar factor pattern emerges for the two-factor model estimated with N = 100 for the Case 4 items, but not with N = 200 (see Table 12). Finally, the factor pattern for the three-factor model estimated with Case 4 items is in Table 13. Here, the factors have the same basic interpretation as with the population model, but some of the individual factor loadings are quite different. For example, at both sample sizes, the estimated primary factor loadings for Sentence Completion (0.43 with N = 100) and Remainders (0.40 with N = 100) are much smaller than their population values of 0.77 and 0.80.
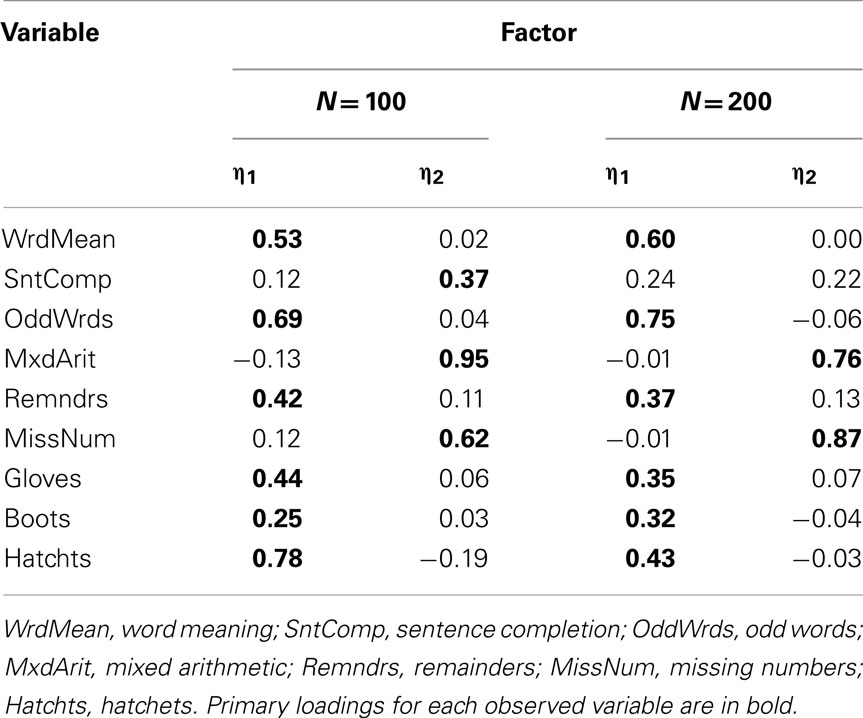
Table 11. Two-factor model loading matrix obtained with EFA of product-moment R among Case 3 item-level variables.
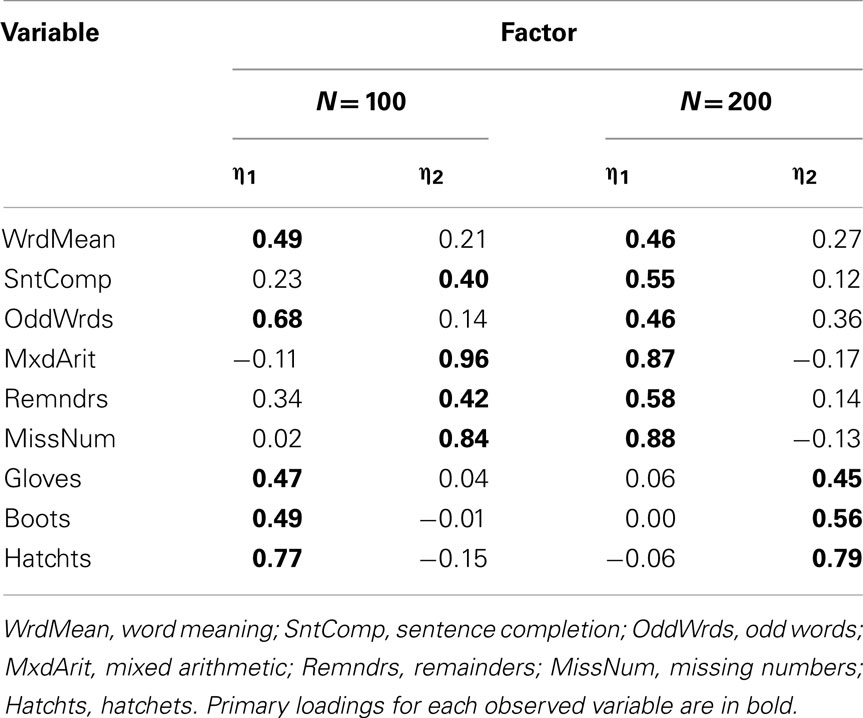
Table 12. Two-factor model loading matrix obtained with EFA of product-moment R among Case 4 item-level variables.
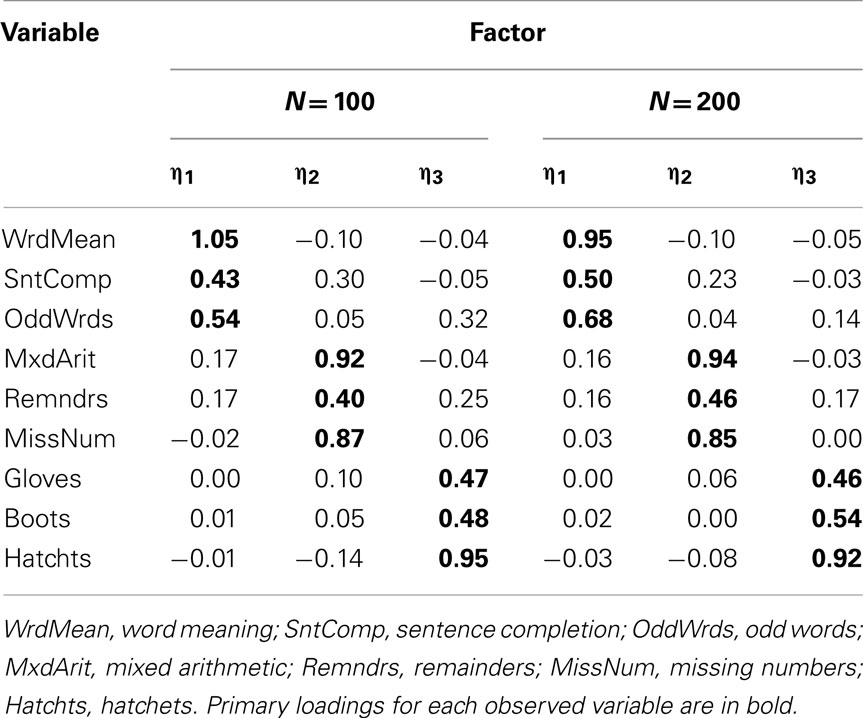
Table 13. Three-factor model loading matrix obtained with EFA of product-moment R among Case 4 item-level variables.
In general, the problems with factoring product-moment R among item-level variables are less severe when there are more response categories (e.g., more than five) and the observed univariate item distributions are symmetric (Finney and DiStefano, 2006). Our demonstration above is consistent with this statement. Yet, although there are situations where ordinary linear regression of a categorical dependent variable can potentially produce useful results, the field still universally accepts non-linear modeling methods such as logistic regression as standard for limited dependent variables. Similarly, although there may be situations where factoring product-moment R (and hence adapting a linear factor model) produces reasonably accurate results, the field should accept alternative, non-linear factor models as standard for categorical, item-level observed variables.
Alternative Methods for Item-Level Observed Variables
Wirth and Edwards (2007) give a comprehensive review of methods for factor analyzing categorical item-level variables. In general, these methods can be classified as either limited-information or full-information. The complete data for N participants on p categorical, item-level variables form a multi-way frequency table with  cells (i.e., C1 × C2 × … × Cp), or potential response patterns, where Cj is the number of categories for item j. Full-information factor models draw from multidimensional item-response theory (IRT) to predict directly the probability that a given individual’s response pattern falls into a particular cell of this multi-way frequency table (Bock et al., 1988). Limited-information methods instead fit the factor model to a set of intermediate summary statistics which are calculated from the observed frequency table. These summary statistics include the univariate response proportions for each item and the bivariate polychoric correlations among items. Hence, these methods are referred to as “limited-information” because they collapse the complete multi-way frequency data into univariate and bivariate marginal information. Full-information factor analysis is an active area of methodological research, but the limited-information method has become quite popular in applied settings and simulation studies indicate that it performs well across a range of situations (e.g., Flora and Curran, 2004; Forero et al., 2009; also see Forero and Maydeu-Olivares, 2009, for a study comparing full- and limited-information modeling). Thus, our remaining presentation focuses on the limited-information, polychoric correlation approach.
The key idea to this approach is the assumption that an unobserved, normally distributed continuous variable, y*, underlies each categorical, ordinally scaled observed variable, y with response categories c = 0, 1,…, C. The latent y* links to the observed y according to

where each τ is a threshold parameter (i.e., a Z-score) determined from the univariate proportions of y with τ0 = −∞ and τC = ∞. Adopting Eq. 1, the common factor model is then a model for the y* variables themselves11,

Like factor analysis of continuous variables, the model parameters are actually estimated from the correlation structure, where the correlations among the y* variables are polychoric correlations12. Thus, the polychoric correlation between two observed, ordinal y variables is an estimate of the correlation between two unobserved, continuous y* variables (Olsson, 1979)13. Adopting Eq. 3 leads to

where P* is the population correlation matrix among y*, which is estimated with the polychoric correlations. Next, because ML estimation provides model estimates that most likely would have produced observed multivariate normal data, methodologists do not recommend simply substituting polychoric R for product-moment R and proceed with ML estimation (e.g., Yang-Wallentin et al., 2010). Instead, we recommend ULS estimation, where the purpose is to minimize squared residual polychoric correlations (Muthén, 1978)14. The normality assumption for each unobserved y* is a mathematical convenience that allows estimation of P*; Flora and Curran (2004) showed that polychoric correlations remain reasonably accurate under moderate violation of this assumption, which then has only a very small effect on factor analysis results. Finally, this polychoric approach is implemented in several popular SEM software packages (as well as R, SAS, and Stata), each of which is capable of both EFA and CFA.
Example Demonstration Continued
To demonstrate limited-information item factor analysis, we conducted EFA of polychoric correlation matrices among the same categorized variables for Cases 1–4 presented above, again using ULS estimation and quartimin rotation. We begin with analyses of the approximately symmetric Case 1 and Case 2 items. First, the sample polychoric correlations are closer to the known population correlations than were the product-moment correlations among these categorical variables (see Tables 5 and 7). For example, the population correlation between Word Meaning and Sentence Completion is 0.75 and the sample polychoric correlation between these two Case 1 items is 0.81, but the product-moment correlation was only 0.60 (both with N = 100). As with product-moment R, the EFA of polychoric R among Case 1 variables also strongly suggested retaining a three-factor model at both N = 100 and N = 200; the rotated factor-loading matrices are in Table 14. Here, the loading of each observed variable on its primary factor is consistently larger than that obtained with the EFA of product-moment R (compare to Table 6) and much closer to the population factor loadings in Table 2. Next, with Case 2 variables, the EFA of polychoric R again led to a three-factor model at both N = 100 and N = 200. The primary factor loadings in Table 15 were only slightly larger than those obtained with product-moment R (in Table 8), which were themselves reasonably close to the population factor loadings. Thus, in a situation where strong attenuation of product-moment correlations led to strong underestimation of factor loadings obtained from EFA of product-moment R (i.e., Case 1), an alternate EFA of polychoric R produced relatively accurate factor loadings. Yet, when attenuation of product-moment correlations is less severe (i.e., Case 2), EFA of polychoric R was still just as accurate.
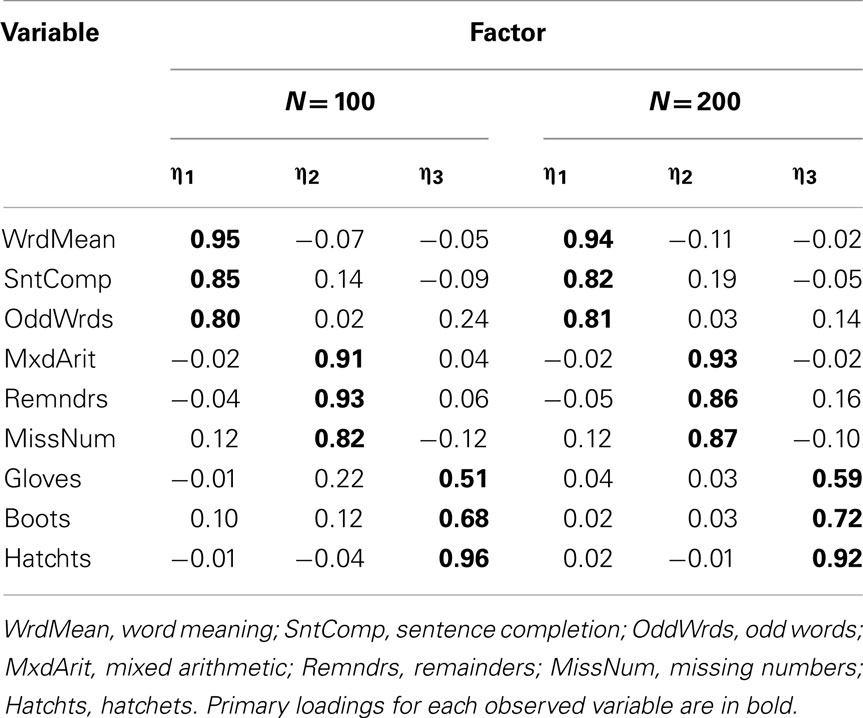
Table 14. Three-factor model loading matrix obtained with EFA of polychoric R among Case 1 item-level variables.
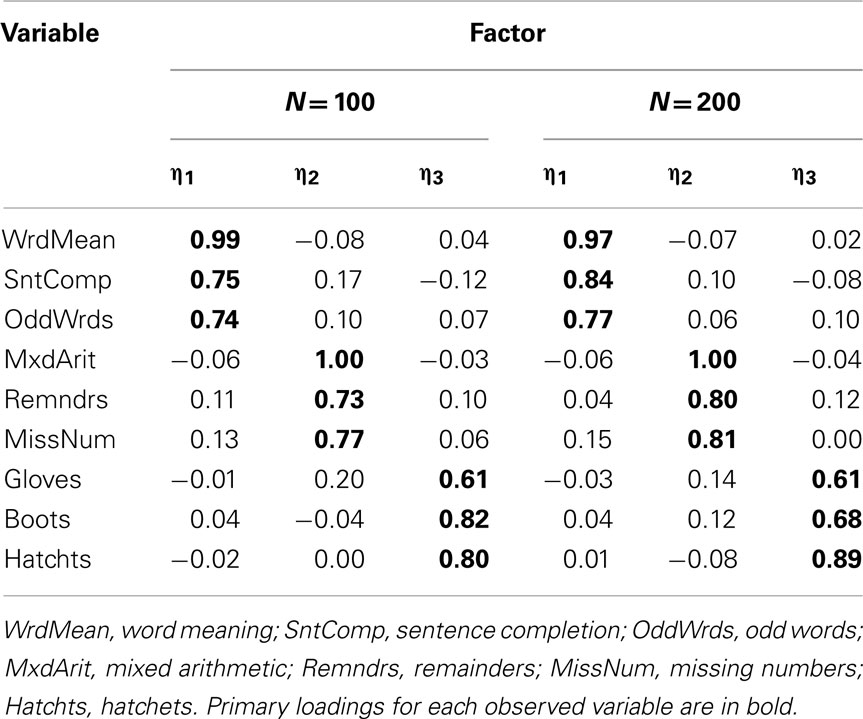
Table 15. Three-factor model loading matrix obtained with EFA of polychoric R among Case 2 item-level variables.
Recall that in Case 3 and 4, some items were positively skewed and some were negatively skewed. First, the polychoric correlations among Case 3 and 4 items are generally closer to the population correlations than were the product-moment correlations, although many of the polychoric correlations among Case 3 dichotomous items are quite inaccurate (see Tables 9 and 10). For example, the population correlation between Word Meaning and Sentence Completion was 0.75 while the sample polychoric correlation between these oppositely skewed Case 3 items was 0.57 with N = 100 and improved to 0.67 with N = 200; but the product-moment correlation between these two items was only 0.24 with N = 100 and 0.25 with N = 200. With five-category Case 4 items, the polychoric correlation between Word Meaning and Sentence Completion is 0.81 with both sample sizes, but the product-moment correlations were only 0.52 with N = 100 and 0.51 with N = 200.
Given that the polychoric correlations were generally more resistant to skewness in observed items than product-moment correlations, factor analyses of Case 3 and 4 items should also be improved. With the dichotomous Case 3 variables and N = 100, the scree plot suggested retaining a one-factor model, but other fit statistics did not support a one-factor model (e.g., RMSR = 0.14). Yet, the estimated two- and three-factor models were improper with negative residual variance estimates. This outcome likely occurred because many of the bivariate frequency tables for item pairs had cells with zero frequency. This outcome highlights the general concern of sparseness, or the tendency of highly skewed items to produce observed bivariate distributions with cell frequencies equaling zero or close to zero, especially with relatively small overall sample size. Sparseness can cause biased polychoric correlation estimates, which in turn leads to inaccurate factor analysis results (Olsson, 1979; Savalei, 2011). With N = 200, a three-factor model for Case 3 variables was strongly supported; the rotated factor loading matrix is in Table 16. Excluding Gloves, each item has its strongest loading on the same factor as indicated in the population (see Table 2), but many of these primary factor loadings are strongly biased and many items have moderate cross-loadings. Thus, we see an example of the tendency for EFA of polychoric R to produce inaccurate results with skewed dichotomous items. Nonetheless, recall that EFA of product-moment R for Case 3 items did not even lead to a model with the correct number of factors.
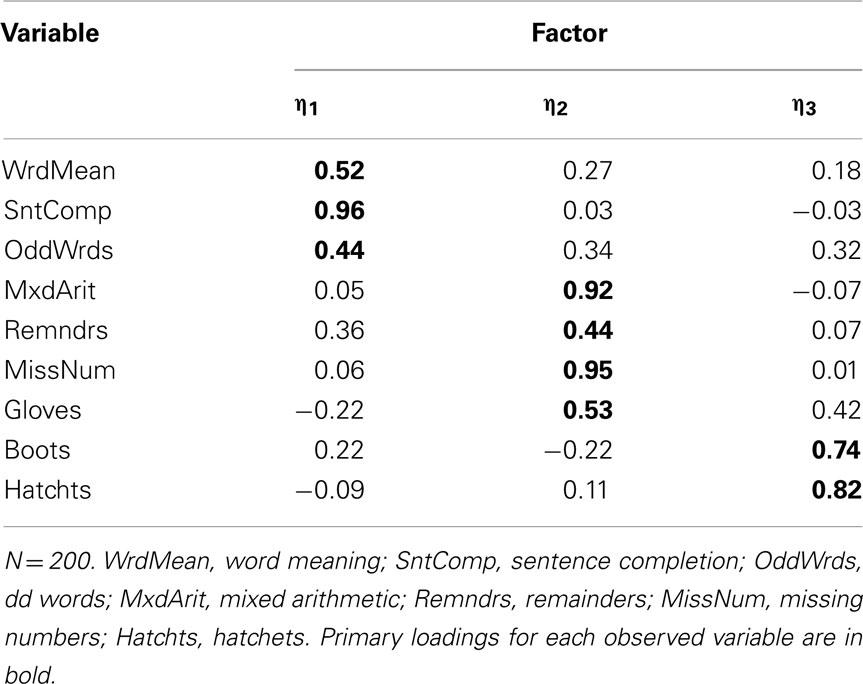
Table 16. Three-factor model loading matrix obtained with EFA of polychoric R among Case 3 item-level variables.
With the five-category Case 4 items, retention of a three-factor model was supported at both sample sizes. However, with N = 100, we again obtained improper estimates. But with N = 200, the rotated factor loading matrix (Table 17) is quite accurate relative to the population factor loadings, and certainly improved over that obtained with EFA of product-moment R among these items. Thus, even though there was a mix of positively and negatively skewed items, having a larger sample size and more item-response categories mitigated the potential for sparseness to produce inaccurate results from the polychoric EFA.
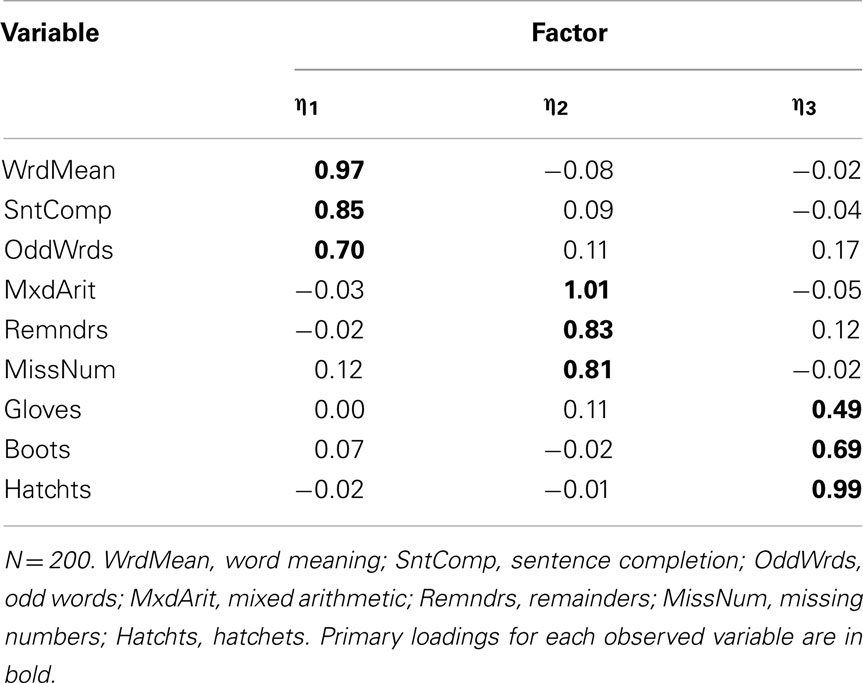
Table 17. Three-factor model loading matrix obtained with EFA of polychoric R among Case 4 item-level variables.
In sum, our demonstration illustrated that factor analyses of polychoric R among categorized variables consistently outperformed analyses of product-moment R for the same variables. In particular, with symmetric items (Cases 1 and 2), product-moment correlations were attenuated which led to negatively biased factor loading estimates (especially with fewer response categories), whereas polychoric correlations remained accurate and produced accurate factor loadings. When the observed variable set contained a mix of positively and negatively skewed items (Cases 3 and 4), product-moment correlations were strongly affected by the direction of skewness (especially with fewer response categories), which can lead to dramatically misleading factor analysis results. Unfortunately, strongly skewed items can also be problematic for factor analyses of polychoric R in part because they produce sparse observed frequency tables, which leads to higher rates of improper solutions and inaccurate results (e.g., Flora and Curran, 2004; Forero et al., 2009). Yet this difficulty is alleviated with larger sample size and more item-response categories; if a proper solution is obtained, then the results of a factor analysis of polychoric R are more trustworthy than those obtained with product-moment R.
General Discussion and Conclusion
Factor analysis is traditionally and most commonly an analysis of the correlations (or covariances) among a set of observed variables. A unifying theme of this paper is that if the correlations being analyzed are misrepresentative or inappropriate summaries of the relationships among the variables, then the factor analysis is compromised. Thus, the process of data screening and assumption testing for factor analysis should begin with a focus on the adequacy of the correlation matrix among the observed variables. In particular, analysis of product-moment correlations or covariances implies that the bivariate association between two observed variables can be adequately modeled with a straight line, which in turn leads to the expression of the common factor model as a linear regression model. This crucial linearity assumption takes precedence over any concerns about having normally distributed variables, although normality is important for certain model fit statistics and estimating parameter SEs. Other concerns about the appropriateness of the correlation matrix involve collinearity and potential influence of unusual cases. Once one accepts the sufficiency of a given correlation matrix as a representation of the observed data, the actual formal assumptions of the common factor model are relatively mild. These assumptions are that the unique factors (i.e., the residuals, ε, in Eq. 1) are uncorrelated with each other and are uncorrelated with the common factors (i.e., η in Eq. 1). Substantial violation of these assumptions typically manifests as poor model-data fit, and is otherwise difficult to assess with a priori data-screening procedures based on descriptive statistics or graphs.
After reviewing the common factor model, we gave separate presentations of issues concerning factor analysis of continuous observed variables and issues concerning factor analysis of categorical, item-level observed variables. For the former, we showed how concepts from regression diagnostics apply to factor analysis, given that the common factor model is itself a multivariate multiple regression model with unobserved explanatory variables. An important point was that cases that appear as outliers in univariate or bivariate plots are not necessarily influential and conversely that influential cases may not appear as outliers in univariate or bivariate plots (though they often do). If one can determine that unusual observations are not a result of researcher or participant error, then we recommend the use of robust estimation procedures instead of deleting the unusual observation. Likewise, we also recommend the use of robust procedures for calculating model fit statistics and SEs when observed, continuous variables are non-normal.
Next, a crucial message was that the linearity assumption is necessarily violated when the common factor model is fitted to product-moment correlations among categorical, ordinally scaled items, including the ubiquitous Likert-type items. At worst (e.g., with a mix of positively and negatively skewed dichotomous items), this assumption violation has severe consequences for factor analysis results. At best (e.g., with symmetric items with five response categories), this assumption violation still produces biased factor-loading estimates. Alternatively, factor analysis of polychoric R among item-level variables explicitly specifies a non-linear link between the common factors and the observed variables, and as such is theoretically well-suited to the analysis of item-level variables. However, this method is also vulnerable to certain data characteristics, particularly sparseness in the bivariate frequency tables for item pairs, which occurs when strongly skewed items are analyzed with a relatively small sample. Yet, factor analysis of polychoric R among items generally produces superior results compared to those obtained with product-moment R, especially if there are five or fewer item-response categories.
We have not yet directly addressed the role of sample size. In short, no simple rule-of-thumb regarding sample size is reasonably generalizable across factor analysis applications. Instead, adequate sample size depends on many features of the research, such as the major substantive goals of the analysis, the number of observed variables per factor, closeness to simple structure, and the strength of the factor loadings (MacCallum et al., 1999, 2001). Beyond these considerations, having a larger sample size can guard against some of the harmful consequences of unusual cases and assumption violation. For example, unusual cases are less likely to exert strong influence on model estimates as overall sample size increases. Conversely, removing unusual cases decreases the sample size, which reduces the precision of parameter estimation and statistical power for hypothesis tests about model fit or parameter estimates. Yet, having a larger sample size does not protect against the negative consequences of treating categorical item-level variables as continuous by factor analyzing product-moment R. But we did illustrate that larger sample size produces better results for factor analysis of polychoric R among strongly skewed items, in part because larger sample size reduces the occurrence of sparseness.
In closing, we emphasize that factor analysis, whether EFA or CFA, is a method for modeling relationships among observed variables. It is important for researchers to recognize that it is impossible for a statistical model to be perfect; assumptions will always be violated to some extent in that no model can ever exactly capture the intricacies of nature. Instead, researchers should strive to find models that have an approximate fit to data such that the inevitable assumption violations are trivial, but the models can still provide useful results that help answer important substantive research questions (see MacCallum, 2003, and Rodgers, 2010, for discussions of this principle). We recommend extensive use of sensitivity analyses and cross-validation to aid in this endeavor. For example, researchers should compare results obtained from the same data using different estimation procedures, such as comparing traditional ULS or ML estimation with robust procedures with continuous variables or comparing full-information factor analysis results with limited-information results with item-level variables. Additionally, as even CFA analyses may become exploratory through model modification, it is important to cross-validate models across independent data sets. Because different modeling procedures place different demands on data, comparing results obtained with different methods and samples can help researchers gain a fuller, richer understanding of the usefulness of their statistical models given the natural complexity of real data.
Conflict of Interest Statement
The authors declare that the research was conducted in the absence of any commercial or financial relationships that could be construed as a potential conflict of interest.
Footnotes
- ^For traditional factor analysis models, the means of the observed variables are arbitrary and unstructured by the model, which allows omission of an intercept term in Eq. 1 by assuming the observed variables are mean-deviated, or centered (MacCallum, 2009).
- ^In EFA, the model is typically estimated by first setting Ψ to be an identity matrix, which implies that the factors are uncorrelated, or orthogonal, leading to the initial unrotated factor loadings in Λ. Applying an oblique factor rotation obtains a new set of factor loadings along with non-zero interfactor correlations. Although rotation is not a focus of the current paper, we recommend that researchers always use an oblique rotation.
- ^Asparouhov and Muthén (2009) further show how an unrestricted EFA solution can be used in place of a restricted CFA-type measurement model within a larger SEM.
- ^We will not extensively discuss EFA methods for determining the number of factors except to note where assumption violation or inaccurate correlations may affect decisions about the optimal number of common factors. See MacCallum (2009) for a brief review of methods for determining the number of common factors in EFA.
- ^Certain models, such as multiple-group measurement models, may also include a mean structure, in which case the means of the observed variables also serve as data for the complete model estimation.
- ^Weisberg (1985) showed that (n − 1)h* is the MD for a given case from the centroid of the explanatory variables, where h* is the regression hat value calculated using mean-deviated independent variables.
- ^Polychoric correlation matrices (defined below) are often non-positive definite. Unlike a product-moment R, a non-positive definite polychoric correlation matrix is not necessarily problematic.
- ^Most EFA software includes eigenvalues of R as default output. However, it is important not to confuse the eigenvalues of R with the eigenvalues of the “reduced” correlation matrix,
 . The reduced correlation matrix often has negative eigenvalues when R does not.
 - ^It is possible (and advisable) to make enhanced scatterplots in which each point has a different size (or color or symbol) according to the frequency or relative frequency of observations at each point.
- ^An enhanced scatterplot that gives information about the frequency of each cell for Case 3 would look quite different than that for Case 1 because the categorizations we applied lead to different frequency tables for each data set.
- ^The factor model can be equivalently conceptualized as a probit regression for the categorical dependent variables. Probit regression is nearly identical to logistic regression, but the normal cumulative distribution function is used in place of the logistic distribution (see Fox, 2008).
- ^Analogous to the incorporation of mean structure among continuous variables, advanced models such as multiple-group measurement models are fitted to the set of both estimated thresholds and polychoric correlations.
- ^The tetrachoric correlation is a specific type of polychoric correlation that obtains when both observed variables are dichotomous.
- ^Alternatively, “robust weighted least-squares,” also known as “diagonally weighted least-squares” (DWLS or WLSMV), is also commonly recommended. Simulation studies suggest that ULS and DWLS produce very similar results, with slightly more accurate estimates obtained with ULS (Forero et al., 2009; Yang-Wallentin et al., 2010).
References
Asparouhov, T., and Muthén, B. (2009). Exploratory structural equation modeling. Struct. Equ. Modeling 16, 397–438.
Babakus, E., Ferguson, C. E., and Joreskög, K. G. (1987). The sensitivity of confirmatory maximum likelihood factor analysis to violations of measurement scale and distributional assumptions. J. Mark. Res. 37, 72–141.
Bartholomew, D. J. (2007). “Three faces of factor analysis,” in Factor Analysis at 100: Historical Developments and Future Directions, eds R. Cudeck, and R. C. MacCallum (Mahwah, NJ: Lawrence Erlbaum Associates), 9–21.
Belsley, D. A., Kuh, E., and Welsch, R. E. (1980). Regression Diagnostics: Identifying Influential Data and Sources of Collinearity. New York: Wiley.
Bentler, P. M. (2004). EQS 6 Structural Equations Program Manual. Encino, CA: Multivariate Software, Inc.
Bentler, P. M. (2007). Can scientifically useful hypotheses be tested with correlations? Am. Psychol. 62, 772–782.
Bentler, P. M., and Savalei, V. (2010). “Analysis of correlation structures: current status and open problems,” in Statistics in the Social Sciences: Current Methodological Developments, eds S. Kolenikov, D. Steinley, and L. Thombs (Hoboken, NJ: Wiley), 1–36.
Bernstein, I. H., and Teng, G. (1989). Factoring items and factoring scales are different: spurious evidence for multidimensionality due to item categorization. Psychol. Bull. 105, 467–477.
Bock, R. D., Gibbons, R., and Muraki, E. (1988). Full-information item factor analysis. Appl. Psychol. Meas. 12, 261–280.
Bollen, K. A. (1987). Outliers and improper solutions: a confirmatory factor analysis example. Sociol. Methods Res. 15, 375–384.
Bollen, K. A., and Arminger, G. (1991). Observational residuals in factor analysis and structural equation models. Sociol. Methodol. 21, 235–262.
Briggs, N. E., and MacCallum, R. C. (2003). Recovery of weak common factors by maximum likelihood and ordinary least squares estimation. Multivariate Behav. Res. 38, 25–56.
Browne, M. W., Cudeck, R., Tateneni, K., and Mels, G. (2010). CEFA: Comprehensive Exploratory Factor Analysis, Version 3. 03 [Computer Software, and Manual]. Available at: http://faculty.psy.ohio-state.edu/browne/
Cadigan, N. G. (1995). Local influence in structural equation models. Struct. Equ. Modeling 2, 13–30.
Cudeck, R. (1989). Analysis of correlation matrices using covariance structure models. Psychol. Bull. 105, 317–327.
Cudeck, R., and O’Dell, L. L. (1994). Applications of standard error estimates in unrestricted factor analysis: significance tests for factor loadings and correlations. Psychol. Bull. 115, 475–487.
Dolan, C. V. (1994). Factor analysis of variables with 2, 3, 5 and 7 response categories: a comparison of categorical variable estimators using simulated data. Br. J. Math. Stat. Psychol. 47, 309–326.
Finney, S. J., and DiStefano, C. (2006). “Non-normal and categorical data in structural equation modeling,” in Structural Equation Modeling: A Second Course, eds G. R. Hancock, and R. O. Mueller (Greenwich, CT: Information Age Publishing), 269–314.
Flora, D. B., and Curran, P. J. (2004). An empirical evaluation of alternative methods of estimation for confirmatory factor analysis with ordinal data. Psychol. Methods 9, 466–491.
Forero, C. G., and Maydeu-Olivares, A. (2009). Estimation of IRT graded models for rating data: limited vs. full information methods. Psychol. Methods 14, 275–299.
Forero, C. G., Maydeu-Olivares, A., and Gallardo-Pujol, D. (2009). Factor analysis with ordinal indicators: a Monte Carlo study comparing DWLS and ULS estimation. Struct. Equ. Modeling 16, 625–641.
Fox, J. (2008). Applied Regression Analysis and Generalized Linear Models, 2nd Edn. Thousand Oaks, CA: SAGE Publications.
Green, S. B., Akey, T. M., Fleming, K. K., Hershberger, S. L., and Marquis, J. G. (1997). Effect of the number of scale points on chi-square fit indices in confirmatory factor analysis. Struct. Equ. Modeling 4, 108–120.
Jöreskog, K. G. (1969). A general approach to confirmatory maximum likelihood factor analysis. Psychometrika 34, 183–202.
Lawley, D. N., and Maxwell, A. E. (1963). Factor Analysis as a Statistical Method. London: Butterworth.
Lee, S.-Y., and Wang, S. J. (1996). Sensitivity analysis of structural equation models. Psychometrika 61, 93–108.
MacCallum, R. C. (2009). “Factor analysis,” in The SAGE Handbook of Quantitative Methods in Psychology, eds R. E. Millsap, and A. Maydeu-Olivares (Thousand Oaks, CA: SAGE Publications), 123–147.
MacCallum, R. C., Widaman, K. F., Preacher, K., and Hong, S. (2001). Sample size in factor analysis: the role of model error. Multivariate Behav. Res. 36, 611–637.
MacCallum, R. C., Widaman, K. F., Zhang, S., and Hong, S. (1999). Sample size in factor analysis. Psychol. Methods 4, 84–99.
Mavridis, D., and Moustaki, I. (2008). Detecting outliers in factor analysis using the forward search algorithm. Multivariate Behav. Res. 43, 453–475.
Muthén, B. (1978). Contributions to factor analysis of dichotomous variables. Psychometrika 43, 551–560.
Muthén, B., and Kaplan, D. (1985). A comparison of some methodologies for the factor-analysis of non-normal Likert variables. Br. J. Math. Stat. Psychol. 38, 171–180.
Muthén, B., and Kaplan, D. (1992). A comparison of some methodologies for the factor-analysis of non-normal Likert variables: a note on the size of the model. Br. J. Math. Stat. Psychol. 45, 19–30.
Olsson, U. (1979). Maximum likelihood estimation of the polychoric correlation coefficient. Psychometrika 44, 443–460.
Pek, J., and MacCallum, R. C. (2011). Sensitivity analysis in structural equation models: cases and their influence. Multivariate Behav. Res. 46, 202–228.
Pison, G., Rousseeuw, P. J., Filzmoser, P., and Croux, C. (2003). Robust factor analysis. J. Multivar. Anal. 84, 145–172.
Poon, W.-Y., and Wong, Y.-K. (2004). A forward search procedure for identifying influential observations in the estimation of a covariance matrix. Struct. Equ. Modeling 11, 357–374.
Ramsey, J. B. (1969). Tests for specification errors in classical linear least squares regression analysis. J. R. Stat. Soc. Series B 31, 350–371.
Rodgers, J. L. (2010). The epistemology of mathematical and statistical modeling: a quiet methodological revolution. Am. Psychol. 65, 1–12.
Satorra, A., and Bentler, P. M. (1994). “Corrections to test statistics and standard errors in covariance structure analysis,” in Latent Variables Analysis: Applications for Developmental Research, eds A. von Eye, and C. C. Clogg (Thousand Oaks, CA: SAGE Publications), 399–419.
Savalei, V. (2011). What to do about zero frequency cells when estimating polychoric correlations. Struct. Equ. Modeling 18, 253–273.
Spearman, C. (1904). General intelligence objectively determined and measured. Am. J. Psychol. 5, 201–293.
West, S. G., Finch, J. F., and Curran, P. J. (1995). “Structural equation models with non-normal variables: problems and remedies,” in Structural Equation Modeling: Concepts, Issues, and Applications, ed. R. H. Hoyle (Thousand Oaks, CA: SAGE Publications), 56–75.
Wirth, R. J., and Edwards, M. C. (2007). Item factor analysis: current approaches and future directions. Psychol. Methods 12, 58–79.
Yang-Wallentin, F., Jöreskog, K. G., and Luo, H. (2010). Confirmatory factor analysis of ordinal variables with misspecified models. Struct. Equ. Modeling 17, 392–423.
Yuan, K.-H., and Bentler, P. M. (1998). Structural equation modeling with robust covariances. Sociol. Methodol. 28, 363–396.
Yuan, K.-H., Marshall, L. L., and Bentler, P. M. (2002). A unified approach to exploratory factor analysis with missing data, nonnormal data, and in the presence of outliers. Psychometrika 67, 95–122.
Keywords: exploratory factor analysis, confirmatory factor analysis, item factor analysis, structural equation modeling, regression diagnostics, data screening, assumption testing
Citation: Flora DB, LaBrish C and Chalmers RP (2012) Old and new ideas for data screening and assumption testing for exploratory and confirmatory factor analysis. Front. Psychology 3:55. doi: 10.3389/fpsyg.2012.00055
Received: 27 October 2011; Paper pending published: 21 November 2011;
Accepted: 13 February 2012; Published online: 01 March 2012.
Edited by:
Jason W. Osborne, Old Dominion University, USAReviewed by:
Stanislav Kolenikov, University of Missouri, USACam L. Huynh, University of Manitoba, Canada
Copyright: © 2012 Flora, LaBrish and Chalmers. This is an open-access article distributed under the terms of the Creative Commons Attribution Non Commercial License, which permits non-commercial use, distribution, and reproduction in other forums, provided the original authors and source are credited.
*Correspondence: David B. Flora, Department of Psychology, York University, 101 BSB, 4700 Keele Street, Toronto, ON M3J 1P3, Canada. e-mail:ZGZsb3JhQHlvcmt1LmNh


