
94% of researchers rate our articles as excellent or good
Learn more about the work of our research integrity team to safeguard the quality of each article we publish.
Find out more
ORIGINAL RESEARCH article
Front. Psychol., 28 February 2011
Sec. Perception Science
volume 2 - 2011 | https://doi.org/10.3389/fpsyg.2011.00030
This article is part of the Research TopicSingle-trial analyses of behavioural and neuroimaging data in perception and decision-makingView all 11 articles
In most cognitive neuroscience experiments there are many behavioral and experimental dynamics, and many indices of brain activity, that vary from trial to trial. For example, in studies of response conflict, conflict is usually treated as a binary variable (i.e., response conflict exists or does not in any given trial), whereas some evidence and intuition suggests that conflict may vary in intensity from trial to trial. Here we demonstrate that single-trial multiple regression of time–frequency electrophysiological activity reveals neural mechanisms of cognitive control that are not apparent in cross-trial averages. We also introduce a novel extension to oscillation phase coherence and synchronization analyses, based on “weighted” phase modulation, that has advantages over standard coherence measures in terms of linking electrophysiological dynamics to trial-varying behavior and experimental variables. After replicating previous response conflict findings using trial-averaged data, we extend these findings using single-trial analytic methods to provide novel evidence for the role of medial frontal–lateral prefrontal theta-band synchronization in conflict-induced response time dynamics, including a role for lateral prefrontal theta-band activity in biasing response times according to perceptual conflict. Given that these methods shed new light on the prefrontal mechanisms of response conflict, they are also likely to be useful for investigating other neurocognitive processes.
In this report, we demonstrate how single-trial multiple regression analyses can help elucidate brain-behavior relationships, specifically linking cortical electrophysiological oscillatory dynamics to cognitive control processes. The heart of the issue is attempting to resolve the “many-to-many” mapping problem: in many cognitive neuroscience experiments, there are many behavioral and many experimental dynamics, and many indices of electrophysiological brain activity (e.g., over time, space, frequency), that vary from trial to trial. Determining which measurements of behavioral dynamics correspond to which measurements of brain activity is difficult but of central importance to cognitive neuroscience.
Experimental or behavioral variables that vary from trial to trial are often ignored or amalgamated, thereby reducing “many” to “few.” The logic behind trial averaging is that, at the single-trial level, brain measurement tools (EEG, MEG, fMRI) and the neurocognitive systems they measure contain more noise than signal; thus, by averaging data over many trials of the same or similar experiment condition, signal-to-noise ratio increases and randomly distributed variance averages out. This reasoning is irrefutable – the influence of noise decreases as a function of the number of trials  and some cross-trial variance is unrelated to the hypotheses under investigation. In other situations, however, hypotheses must or should be tested using data from single trials within subjects, for example when linking neural dynamics to response time (Weissman et al., 2006; Yarkoni et al., 2009), visual stimulus parameters (Rousselet et al., 2008; Scholte et al., 2009), decision-making (Philiastides and Sajda, 2007; Ratcliff et al., 2009), or other parameters that vary from trial to trial.
Although most cognitive neuroscience studies use cross-trial averaging, there are many examples of how single-trial analyses have yielded important insights into neurocognitive function. Single-trial analyses have the obvious advantage of finding linear relationships between brain activity and trial-varying behavior or experimental manipulations. Within the field of cognitive control, for example, single-trial analyses have linked online and reactive behavior adaptations to medial frontal EEG and fMRI responses (Debener et al., 2005; Mars et al., 2008; Boehler et al., 2010; Cavanagh et al., 2010). One limitation, however, is that with simple correlations, only one variable should be tested. Multiple simple correlations may be suboptimal because shared variance among variables can bias correlation coefficients.
The approach we advocate here is an extension of the single-trial correlation approach. Multiple regression has several important advantages over correlation. First, many independent variables can be entered into the regression, and variance due to different variables can be parceled out. Second, interaction terms between variables can be constructed to estimate possible non-linear effects of combinations of experimental and behavior variables. Third, with multiple regression one can examine not only the slopes (i.e., linear relationship between two variables) but also the intercept of the model (“DC” or mean-offset of the relationship), which may be useful for dissociating random (i.e., idiosyncratic relationships with an independent variable) versus fixed (i.e., all subjects show a general increase in brain activity as a function of condition) effects. Forth, related extensions to multiple regression such as hierarchical linear modeling are amenable for more in-depth analyses into differences across groups of subjects.
Single-trial multiple regression has been applied to EEG data. For example, multiple regression of visual stimulus properties demonstrated early responses to noise and feature processing during face viewing (Rousselet et al., 2008), which is affected by aging (Rousselet et al., 2009). Eichele et al. (2010) recently used single-trial multiple regression to remove variance due to factors less relevant to the hypotheses (e.g., P300 modulation). Regression is also one method for removing blink and other artifacts (Schwind and Dormann, 1986). In these studies, regressions were performed on time-domain EEG data. However, because EEG data are driven largely by oscillatory cortical processes, considerable information in EEG may be contained in the frequency domain and therefore lost in the time domain (Cohen, 2011b). Therefore, in this study we conducted single-trial multiple regression over time–frequency estimates of power, and we introduce a method to link non-linear phase distributions to trial-varying behavioral and experimental variables.
Response conflict occurs when multiple response options are activated, but only one should be selected according to task demands. Response conflict activates the cognitive control system, a set of high-level neurocognitive processes that monitor behavior and the environment for errors, potential errors, and negative performance feedback, and facilitate flexible and adaptive adjustments in behavior to improve future performance. It is thought that structures in the medial frontal cortex are a fulcrum for the cognitive control system, and work with other prefrontal and task-specific sensory and motor regions to support flexible behavior adaptation (Ridderinkhof et al., 2004). The cognitive control system is thought to wane when no response conflict is detected, and to wax when response conflict is detected. Consequently, a trial containing response conflict elicits a reactive activation of the cognitive control system only when the preceding trial contained no response conflict. This phenomenon is termed the “Gratton effect” (Gratton et al., 1992), has been observed in a variety of empirical studies (Egner, 2007), and can be captured by mathematical models (Botvinick et al., 2001). For this reason, researchers often separate trials according to the response conflict on the previous as well as on the current trial.
Activation of the cognitive control system (e.g., during response conflict) can be measured through a variety of dependent variables, including behavioral (reaction time and accuracy), hemodynamic, and electrophysiological. Relevant for the present study, response conflict (and other cognitive control situations such as errors or negative performance feedback) increases theta-band oscillatory activity over medial frontal cortex (Luu and Tucker, 2001; Cohen et al., 2008; Hanslmayr et al., 2008; Cavanagh et al., 2009; Cohen et al., 2009). This medial frontal theta has been proposed to reflect an electrophysiological mechanism for coordinating neural networks involved in monitoring behavior and the environment as well as facilitating task-specific adaptive changes in performance in conjunction with lateral prefrontal cortex and sensory-motor areas.
In typical cognitive control experiments, response conflict is induced either at the response, the perceptual, or the semantic level. Conflict at the response level is elicited by priming two competing responses when only one is correct. At the stimulus-level, conflict can be induced by making the stimuli ambiguous (Szmalec et al., 2008) or low in luminance (Yeung et al., 2007). These examples reflect the common treatment of conflict as a discrete variable, such that conflict is assumed to be present or absent on any given trial. For example, these stimulus-level conflict studies used dim vs. bright stimuli, or high vs. low ambiguous stimuli (Yeung et al., 2007; Szmalec et al., 2008). Although these experimental manipulations are categorical (i.e., trials either contain or do not contain response conflict), the effects of these manipulations on internally experienced conflict may not be discrete, but rather may vary from trial to trial (e.g., the Gratton effect).
It is clear that response conflict is not an all-or-none phenomenon in the brain. Given that the strength of conflict elicited by exogenous (i.e., parametric experimental manipulations not under subjects’ control) and endogenous (i.e., fluctuations in internal cognitive processes) factors may vary from trial to trial, it is apparent that trial averaging provides a limited characterization of the neural mechanisms underlying cognitive control processes. Therefore, alternative analytical techniques are needed to link trial-varying behavioral dynamics to corresponding trial-varying neural dynamics. Thus, the purposes of this experiment were to use single-trial regression to isolate spatial–temporal–frequency characteristics predicted by (1) exogenously induced conflict via continuous (trial-varying luminance) and discrete (trial type) manipulations, and (2) endogenously experienced conflict, as measured through reaction time. Reaction times are often used as a dependent measure to quantify the behavioral effects of conflict (Gratton et al., 1992; Egner, 2007), but to the extent that they reflect internally experience conflict, reaction times can be used as an independent variable (Weissman et al., 2006; Forstmann et al., 2008). Here, EEG data were transformed into their time–frequency representation, and these estimates of time-, space-, and frequency-specific power were regressed against reaction time, stimulus luminance, and the interaction between the two. We also introduce a method to link these single-trial experimental dynamics to oscillation phase angle (“weighted” phase modulation), which has advantages over standard inter-trial phase coherence measures.
Seventeen subjects from the University of Amsterdam community (aged: 18–31, two male) participated in exchange for course credit or 14 Euros. Subjects were self-reported free of neurological diseases and signed informed consent documents that were approved by the local ethics committee. Data from two subjects were removed because one subject had excessive noise and EMG artifacts (over 30% of trials were rejected) and one subject did not complete the experiment because he felt ill. Thus, data from 15 subjects were included in the final analyses.
A modified flankers task was used, in which subjects responded to a central target letter while ignoring flanking letters. There were 1200 trials in three blocks. Each block contained two letters (M and N, E and F, and X and Y, counter-balanced across subjects); one letter required a left-hand response and the other required a right-hand response. “Congruent” trials contained the same flanking and target letter (e.g., XXXXX); “incongruent” trials contained different target and flanking letters (e.g., XXYXX). Thus, conflict was induced when the flanking letters were associated with a different response compared to the target letter. Subjects’ eyes were approximately 90 cm from the monitor, making the letters 0.382° high and 0.2546° wide, with a 0.2546° blank space separating each letter. The target and flankers were presented for 100 ms on a white background. A 1200-ms inter-trial-interval separated trials. Luminance was randomly selected on each trial to be between 0 and 200 (RGB values that vary between 0 and 255). Thus, higher luminance values mean the stimuli were closer to the background color and therefore more difficult to see. Luminance was applied equally to target and flankers. This was done, rather than, e.g., manipulating luminance only of the flankers, for two reasons: (1) This manipulation is experimentally orthogonal to the conflict conditions and therefore is appropriate for multiple regression with interaction terms; (2) manipulating the luminance of all stimuli is more experimentally tractable because differential luminance might produce non-linear net luminance effects on striate cortex at the level measured by EEG. There are many ways to modulate stimulus-level conflict in such tasks, including luminance, size, eccentricity, onset times, etc.; we would expect to find overall similar patterns of results when using different stimulus-level manipulations.
As discussed in the Section “Introduction,” response conflict effects depend on whether conflict was present in the previous trial. Therefore, trials were discretized into four conditions: cC, cI, iC, and iI (“cI” means that the previous trial was congruent and the current trial was incongruent). Trials containing errors, and the trials thereafter, were removed prior to analyses, as were the first trials following each rest break. After EEG trial rejection (described below), there were on average, respectively, 213, 307, 307, and 177 trials per condition (minimum/maximum across subjects, respectively: 185/244, 241/358, 240/357, 84/206).
EEG data were acquired at 512 Hz from 64 channels placed according to the international 10–20 system and from both earlobes (used as reference). Offline, EEG data were high-pass filtered at 0.5 Hz and then epoched from −1.5 to +2 s surrounding each trial (to avoid edge artifacts resulting from wavelet filtering). All trials were visually inspected and those containing EMG or other artifacts not related to blinks were manually removed. Independent components analysis was computed using EEGLAB software (Delorme and Makeig, 2004), and components containing blink/oculomotor artifacts or other artifacts that could be clearly distinguished from brain-driven EEG signals were subtracted from the data.
All analyses were performed in matlab. Single-trial data were first decomposed into their time–frequency representation by multiplying the power spectrum of the EEG (obtained from the fast-Fourier-transform) by the power spectrum of complex Morlet wavelets [ where t is time, f is frequency, which increased from 1 to 40 Hz in 30 logarithmically spaced steps, and σ defines the width of each frequency band, set according to 4/(2πf)], and then taking the inverse fast-Fourier-transform. From the resulting complex signal, an estimate of frequency band-specific power at each time point was defined as the squared magnitude of the result of the convolution Z (real[z(t)]2 + imag[z(t)]2), and an estimate of frequency band-specific phase at each time point was taken as the angle of the convolution result. Relatively long epochs were cut from the continuous EEG data (−1.5 to 2 s) to allow edge artifacts due to sudden transitions in signal values between trials to subside outside the window of interest. Taking long epochs and trimming edge artifacts is preferred over windowing, because the latter method attenuates real signal whereas the former does not. Power was normalized using a decibel (dB) transform (dB power = 10 × log 10[power/baseline]), where the baseline activity was taken as the average power at each frequency band, averaged across conditions, from −300 to −100 ms pre-stimulus. Conversion to a dB scale ensures that data across all frequencies, time points, electrodes, conditions, and subjects are in the same scale and thus comparable. Inter-trial phase coherence (the consistency of frequency band-specific phase angles over trials time-locked to the response) was computed according to
  where n is the number of trials, and φj are the phase angles of electrode j. Phase coherence varies from 0 (no phase consistency across trials) to 1 (oscillations take on identical phase values across trials; Lachaux et al., 1999; Delorme and Makeig, 2004). Frequency band-specific phase synchronization (functional connectivity) was computed according to
  where n is the number of trials, and φj and φk are the phase angles of electrodes j and k. In all analyses and plots, data are time-locked to the response; thus time 0 in the figures corresponds to the button press.
Single-trial analyses were conducted separately for power and phase. For power analyses, a robust regression was computed that estimated parameters at each time–frequency–space point for the following linear equation: Y = INT + b1RT + b2LUM + b3RT × LUM + E. Y is the data vector (power values at each time–frequency point across trials), INT is the intercept, b1–3 are regression coefficients, E is unexplained variance, and RT and LUM are trial vectors of the subject’s reaction time and the stimulus luminance on each trial. Reaction time and luminance data were z-scored so that the interaction term was not dominated by reaction time, which has values an order of magnitude larger than luminance (note that this means the intercept simply accounts for Power Law scaling across frequencies and therefore is not of interest here). Robust regression was used to minimize the contribution of potential outliers via iterative reweighted least squares that minimizes the impact of outliers with large leverage (O’Leary, 1990). In this regard, robust regression has a significant advantage over trial averaging. Specifically, during standard trial-averaging, outliers may affect the averaged data. However, with robust regression, outliers are de-weighted and therefore have minimal effect on the overall result. Ultimately, this procedure resulted in a time × frequency × space (electrodes) × condition matrix of b values for each subject. The regression was conducted separately for each condition rather than including condition as a covariate because the four conditions are categorical. Because these b values are normally distributed under the null hypothesis, they can be entered into standard parametric statistics such as t-tests and repeated-measures ANOVA. Before averaging across subjects, b values were standardized by scaling the coefficients by their SDs; this ensured that the coefficients were in the same scale and thus directly comparable across time, frequency, electrodes, and subjects.
Single-trial phase values, however, cannot be entered into regression because the data are circular (e.g., radian phase values of −3.1 and 3.1 are closer to each other than are 0.1 and 1.0). Therefore, we used an alternative approach, based on the idea that under the null hypothesis of no relationship between, e.g., reaction time and phase values, reaction times across trials should be uniformly distributed across phase. The less uniform this distribution, the more evidence accumulates to reject the null hypothesis. Taking each reaction time–phase pair as a vector with the phase as the angle and reaction time as the length, the magnitude of the average vector can be taken as a modulation of reaction time by phase angle (under the null hypothesis of no relationship, the average vector length would be close to zero). Here, reaction time and luminance data were rank-transformed because this method cannot be used with negative-valued data. Two issues inherent in magnitude scaling and phase distribution require a non-parametric intervention prior to group-level statistical analyses. The first issue is that non-transformed magnitudes are difficult to interpret because they scale with the data (reaction time or luminance values), which was different across subjects (this can be contrasted with inter-trial phase coherence, described above, for which the average vector magnitudes have a maximum of 1.0 and are inherently interpretable). The second issue is that if phase values are non-uniformly distributed across trials (as would be expected if there is, e.g., stimulus-induced phase reset), the distribution of reaction time would be artificially non-uniformly distributed. To counteract both of these issues, we applied permutation testing, in which the observed reaction time and phase values were shuffled with respect to each other. This provides a data-driven test of the null hypothesis that there is no consistent relationship between reaction time and phase angle. Five hundred iterations with shuffled reaction time–phase pairings were performed at each point in time–frequency–electrode–condition space, thus creating a distribution of reaction time–phase modulations under the null hypothesis. Finally, the standardized distance between the observed modulation and the null distribution was taken as a z value corresponding to the probability of finding the observed reaction time–phase modulation by chance, given the measured data. These processing steps resulted in a time × frequency × space (electrodes) × condition matrix of z values for each subject, which, like the b values described for the power regression, can be tested using parametric statistics. This entire procedure was then redone for luminance and the reaction time–luminance interaction. Note that this method, like robust regression, minimizes the impact of outliers because the results are based on within-subject permutation testing of observed data.
In order to compare our results (using data recorded from the electrodes) with another approach often used for single-trial analyses (independent components that estimate temporally dissociable sources of variance), independent components were selected and their time courses were subjected to the same analyses described above. We selected three components for each subject, one representing medial frontal dynamics and two representing lateral prefrontal dynamics (centered on FCz, F5, and F6, which were previously used in cognitive control studies; Cavanagh et al., 2009, 2010). Component selection was done automatically based on maximal spatial correlation between the components and templates. The templates were Gaussians surrounding electrodes of interest. For two subjects, right prefrontal components were manually re-selected because the time course of the automatically selected component resembled blinks.
Group-level statistics were performed using ANOVAs. Data from each subject were taken from a 100-ms, 4-Hz window surrounding the condition-averaged peak time–frequency point. This provides a compromise between a subject-specific data-driven approach (each subject retains his or her unique time–frequency maxima) while addressing the large multiple comparison problem (there are 155,520 time–frequency–space pixels that could possibly be tested). In order to facilitate visualization of spatial topographies, t-tests at each electrode were performed and electrodes with non-significant results at an uncorrected two-tailed p < 0.01 were set to zero (green color). Similarly, black contour lines on the time–frequency plots indicate continuous significance at two-tailed p < 0.01, with a minimum of 300 ms and three frequency bands.
As expected based on the Gratton effect, there was a significant previous × current conflict interaction (repeated-measures ANOVA, F1,14 = 14.29, p = 0.002). Reaction times were longest on cI trials, shortest on cC trials, and in between during iI and iC trials (Figure 1A). To examine the effects of stimulus luminance on reaction times, we correlated, for each subject, luminance and reaction time separately for each condition (Figure 1B), and then tested those correlation coefficients across subjects. Correlation coefficients were significantly greater than zero in all conditions except for cC (p-values: 0.53, <0.001, 0.002, 0.033 for cC, cI, iC, and iI conditions), although the interaction term in a previous × current conflict repeated-measures ANOVA was not significant (F1,14 = 0.59). These results indicate that stimulus luminance affected subjects’ performance only when the current or previous trial contained conflict.
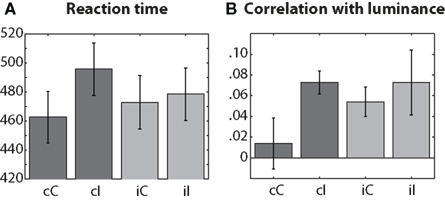
Figure 1. Conditions (x-axis) are labeled according to previous (first, lowercase letter) and current trial (second, uppercase letter) conflict: C = congruent, I = incongruent. (A) Reaction times in ms. (B) Spearman’s rank correlation coefficients. Error bars denote SEM.
The trial-averaged time–frequency–space characteristics of the data provide a useful comparison for the results from the single-trial analyses. In general, the task elicited increased theta-band activity over medial frontal electrodes, centered around FCz, and maximal just prior to the response (Figure 2A). Although theta and delta power were significantly increased during all trials compared to baseline (Figure 2C), there was no significant main effect of current trial conflict, nor was there a significant previous × current trial conflict interaction (2 × 2 repeated-measures ANOVA: all p’s > 0.05). Inter-trial phase coherence (the consistency of frequency band-specific phase angles across trials) showed low-frequency phase coherence and no clear medial frontal spatial focus (Figures 2B,D).

Figure 2. Trial-averaged results, separated according to condition. (A,B) Condition-averaged topographical maps of power and phase coherence, which are the average of 150 ms surrounding the time point indicated below the maps. (C,D) Time–frequency plots of peri-response power and inter-trial phase coherence. Black areas enclose regions in which contiguous pixels were significantly different from inter-trial-interval baseline at p < 0.01 (two-tailed) for at least 300 ms and at least three consecutive frequencies.
Figure 3 shows standardized regression coefficients from the single-trial multiple regression of reaction time (Figure 3A), luminance (Figure 3B), and their interaction (Figure 3C). A robust main effect of reaction time can be seen in the theta range prior to the response, centered around frontal sites. These coefficients were significantly greater than zero in all conditions (Figure 3A), and there was a significant interaction between previous and current conflict (F1,14 = 11.67, p = 0.004), which was driven by significantly larger coefficients in cI compared to cC trials (t14 = 3.48, p = 0.0037), and no significant difference between iI and iC trials (t14 = 1.19, p = 0.187). The relationship between brain activity and RT may reflect conflict and also other response-related processes; however, because basic motoric response-related processes are present during all responses, the difference between regression coefficients in cC and cI trials reflects conflict processing.
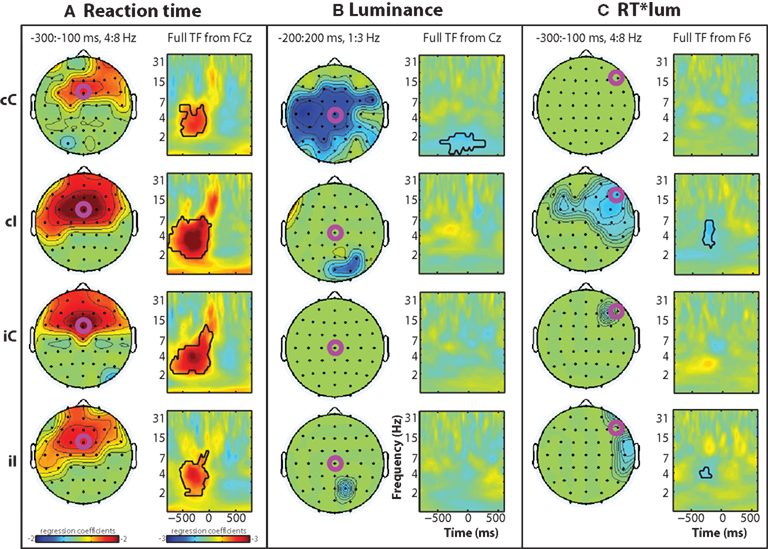
Figure 3. Time–frequency plots of peri-response (time = 0) single-trial multiple regression coefficients, separated by condition (rows) and regression term (A–C). Black lines enclose significant regions, as in Figure 2. Time–frequency (TF) regression coefficient plots are taken from electrodes indicated by fuchsia circles.
There was a main effect of luminance in low frequencies (delta range, ∼1–3 Hz) at central electrodes, mainly in cC trials (Figure 3B).
There was an interaction between reaction time and luminance in the theta band over lateral prefrontal sites, mainly in cI trials (interaction at electrode F6: F1,14 = 6.76, p = 0.021; Figure 3C). Consistent with the lack of behavior effect of luminance on reaction time during cC trials, there was no corresponding reaction time × luminance interaction on theta-band activity.
To illustrate the theta-RT relationship at the individual subject level, Figure 4 shows scatterplots from each individual subject. In these plots, the time–frequency point with the maximum pre-stimulus theta power-RT slope (averaged across all four conditions) was selected.
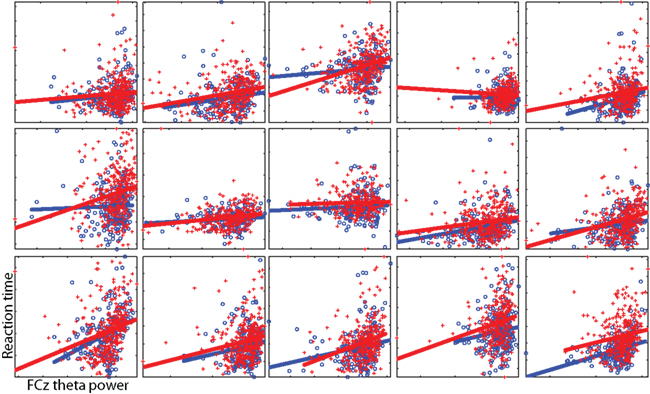
Figure 4. Individual subject single-trial data illustrating the relationship between theta power (x-axis) and RT (y-axis). Axes differ per subject and are unlabeled. Each point is a single trial; lines reflect the best linear fit. Red pluses and lines are taken from cI trials, blue circles and lines from cC trials. These data correspond to the regression from a single time–frequency point for each subject. To select this subject-specific time–frequency point, we averaged the RT regression coefficients from all conditions and selected the point with the largest coefficient within the range of 1–12 Hz, −400 to 200 ms (the average across subjects was −233 ms and 5.1 Hz). Note that this selection procedure is not based on maximizing differences between cI and cC trials.
In the next set of analyses, we examined how frequency band-specific phases might be modulated by reaction time, luminance, and their interaction. This is different from cross-trial phase coherence (plotted in Figures 2B,D) because this analysis tests the reliability of the relationship between phase angles and reaction time across trials, rather than the consistency of phase angles across trials. As seen in Figure 5, there was a robust main effect of reaction time in the pre-response theta range in all conditions. Similar to the effects observed in the power regressions, there was an interaction between current and previous conflict (at FCz: F1,14 = 6.56, p = 0.023) which was driven by significantly larger coefficients in cI compared to cC trials (t14 = 5.36, p < 0.001), and no significant difference between iI and iC trials (t14 = 0.66, p = 0.516). There were no significant effects of luminance or reaction time–luminance interaction.
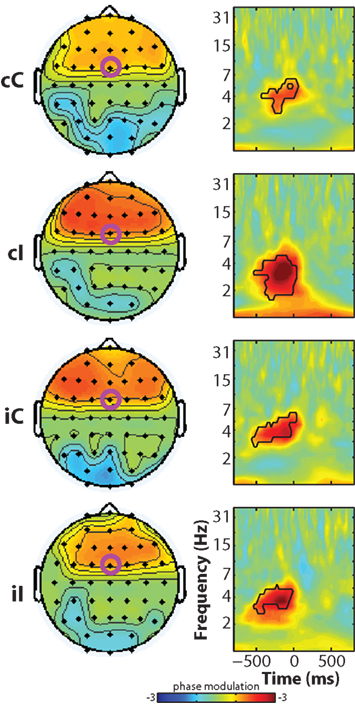
Figure 5. Time–frequency plots of peri-response single-trial phase modulation, separated by condition. Black lines enclose significant regions, as in Figure 2. Note the differences between these phase modulation plots – where the dominant effects occur in the theta band over frontal regions – and the trial-averaged phase coherence in Figure 2, which shows a dominant delta-band effect without a medial frontal focus.
We (Cavanagh et al., 2009) and others (Hanslmayr et al., 2008) have suggested that electrophysiological oscillatory synchronization between MFC and lateral prefrontal cortex may be a substrate of communication that supports cognitive control processes. Although inter-site synchronization increases most strongly during errors, synchronization is also observed immediately prior to correct responses. Consistent with previous results, here we found increased theta-band synchronization between FCz and lateral frontal sites including F6 (this is the electrode pair analyzed in Cavanagh et al., 2009, 2010) prior to the response. The left-most column of Figure 6A shows that pre-response synchronization was significantly greater than that during the inter-trial interval (used here as a baseline), but was not different among conditions (all p’s > 0.175).
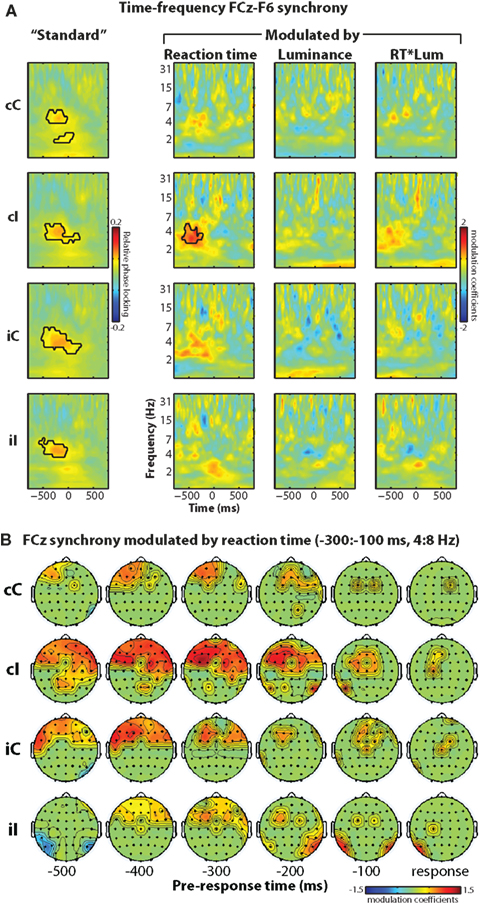
Figure 6. Phase synchronization between electrode FCz (over MFC) and lateral prefrontal sites including F6 is present generally prior to the response, and, during high conflict situations, increases in strength with increasing reaction time. (A) Time–frequency plots of FCz–F6 “standard” (no modulation) phase synchronization (left column) and synchronization modulated by reaction time, luminance, and their interaction (right three columns). (B) Topographical maps of reaction time-modulated synchronization with FCz over time (columns) and condition (rows). Statistical thresholding is the same as in previous figures.
This standard measure of functional connectivity, however, may be difficult to link to precise cognitive dynamics, because the connectivity may reflect a combination of several processes including response preparation, stimulus evaluation, attention, orientation, etc. Thus, we extend this connectivity measure to examine whether synchronization is modulated by an experimental variable (e.g., reaction time). The idea is that process-specific connectivity should be modulated by reaction time, whereas more general inducers of connectivity (e.g., orienting attention, general response preparation) should not be. Similar to the phase analysis above, this method tests the relationship between relative phase angles between seed (FCz) and target (F6 or other) electrode pairs and reaction time. The right three columns in Figure 6A show time–frequency plots of modulated phase synchronization between FCz (MFC) and F6 (lateral prefrontal cortex). This “response-modulated” functional connectivity increased prior to the response, and was strongest during cI trials (interaction term: F1,14 = 5.48, p = 0.035). This indicates that on a trial-by-trial basis, longer reaction times during high conflict situations were preceded by enhanced electrophysiological connectivity between medial frontal and lateral prefrontal regions. Topographical maps in Figure 6B show that this effect was localized primarily to anterior and lateral prefrontal sites.
Previous reports suggest advantages to conducting single-trial analyses using data from independent components (Debener et al., 2005, 2007; Eichele et al., 2009). In some cases, independent components and other methods (e.g., stable topographical maps based on clustering) provide converging results (De Lucia et al., 2010). Because independent components analysis results in a set of electrode weights that maximize temporally independent processes, this analysis might improve signal-to-noise. However, because each component is a weighting of all electrodes, specific maps must be selected for each subject. For example, in cognitive control experiments, maps are often selected based on a medial frontal topographical distribution (Debener et al., 2005; Eichele et al., 2010; Wessel and Ullsperger, 2010), although more sophisticated approaches are available based on higher-dimensional clustering (Onton et al., 2005). Therefore, in the interest of comparison with other approaches for analyzing single-trial data, we performed robust regression on the time–frequency representation of independent components. As described in the methods, components for each subject were selected according to a medial frontal and left/right lateral frontal topography (Figure 7).
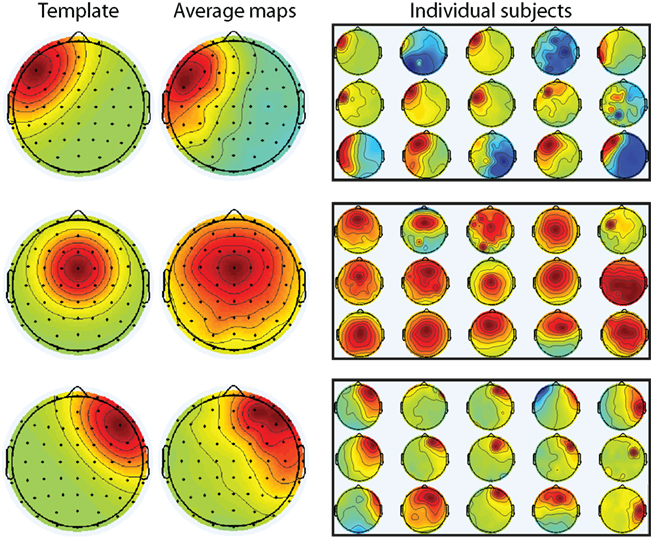
Figure 7. Selection of independent components for all subjects. Components were selected based on spatial correlation with a priori specified templates (left column). The average component across subjects was similar to the templates (middle column). Individual maps from all 15 subjects are shown in the right-most column.
The trial-averaged time–frequency representation of the components time courses are shown in Figure 8. The medial frontal component showed an increase in theta power that peaked just prior to the response, similar to results from electrode FCz (Figure 2).
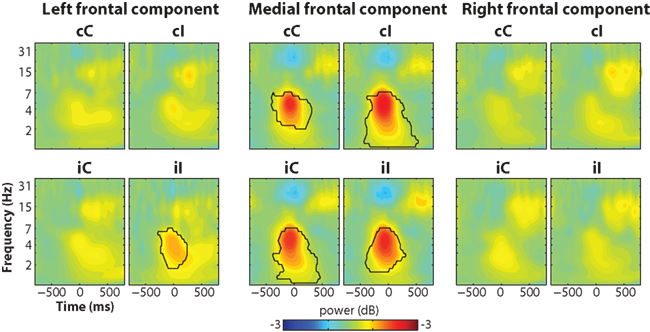
Figure 8. Trial-averaged power results from the independent components (same as Figure 2C but using components instead of electrode-specific data).
Single-trial power regression analyses revealed similar effects as with data from FCz for reaction time (Figure 9), though generally less robust (compare to Figure 3A). A more striking difference was the lack of luminance × reaction time interaction at the right frontal component.
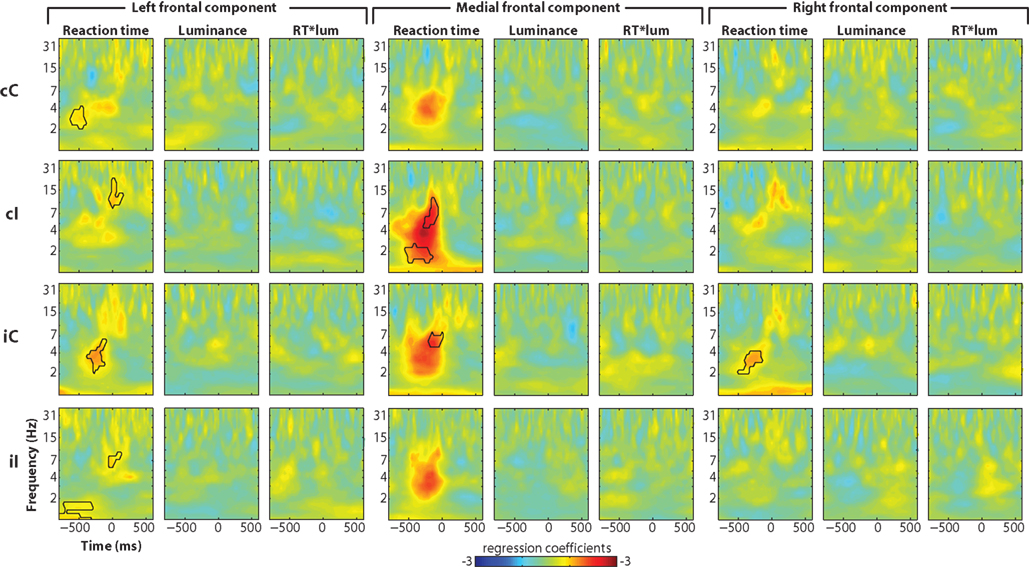
Figure 9. Single-trial multiple regression analyses from independent components. The analysis was identical to that presented in Figure 3 but using components time courses instead of electrode-specific data.
The trial-average results presented in Figure 2 add to a growing body of work linking theta-band oscillatory dynamics recorded over medial frontal sites to action monitoring, cognitive control, and reinforcement learning (Trujillo and Allen, 2007; Hanslmayr et al., 2008; Marco-Pallares et al., 2008; Cavanagh et al., 2009; Christie and Tata, 2009; Mazaheri et al., 2009). Together, these findings suggest that medial frontal theta is a candidate mechanism for information processing and transfer during conflict, error, and negative performance feedback. Spatial filtering methods such as current source density, independent components analysis, and dipole modeling suggest that these theta dynamics originate in the pre-supplementary motor area or anterior cingulate cortex (Miltner et al., 2003; Debener et al., 2005; Vocat et al., 2008). This is confirmed by direct recordings in humans (Wang et al., 2005; Cohen et al., 2008) and functional MRI studies (van Veen et al., 2001; Mathalon et al., 2003).
Although results of these cross-trial averaging analyses generally link medial frontal theta to response conflict, the single-trial regression analyses provide more behaviorally relevant insights into the theta dynamics that may support cognitive control. Indeed, several findings emerged only in the single-trial analyses (discussed in more detail below): (1) single-trial regression demonstrated that pre-response theta is involved in conflict-modulated response selection over a longer time period than is apparent in trial-averaged theta; (2) single-trial “weighted” phase modulation demonstrated that pre-response theta phase predicted endogenous conflict as reflected by reaction time, whereas trial-averaged phase coherence showed only a low-frequency general phase alignment; (3) single-trial phase synchrony modulation demonstrated that medial–lateral prefrontal phase synchronization was significantly modulated by upcoming reaction time in situations of high response conflict, whereas trial-averaged phase synchronization suggested that connectivity was unrelated to conflict.
The dissociation in timing between trial-averaged theta – which had a narrow peak 100 ms (power) and 122 ms (cross-trial phase coherence) prior to the response – and the single-trial theta response time regression coefficients – which started earlier and peaked 176 ms before the response (see Figure 9), suggests two distinct but nearly temporally overlapping roles of medial frontal theta dynamics. On the one hand, peri-response theta is involved in general response-locked dynamics; on the other hand, it is the pre-response theta that is tightly coupled to response time. Indeed, medial frontal activity correlating with trial-to-trial RT has been reported previously with EEG independent components analysis (Delorme et al., 2007), and with a re-analysis of five fMRI datasets (Yarkoni et al., 2009). Further, the dissociation between the extended pre-response time course of the theta power regression and the theta phase modulation analysis (compare red and black lines in Figure 10), in combination with the weak pre-response phase coherence (Figure 2D), suggests that reaction time dynamics are more closely associated with non-phase-locked oscillatory activity compared to phase-locked transients. In other words, the neural processes within the medial frontal cortex that influence reaction time during conflict might reflect amplitude modulations of ongoing oscillations, rather than a sudden resetting of activity.
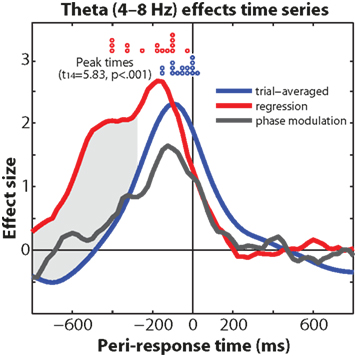
Figure 10. Comparison of theta-band effects (trial-averaged power, power regression with reaction time, phase modulation by reaction time). Gray shading indicates that the regression coefficients are significantly greater than trial-averaged power at p < 0.01, minimum 300 ms continuous cluster threshold. Red and blue circles indicate subject-specific waveform peak times.
The interaction of luminance and reaction time predicting theta dynamics over lateral prefrontal cortex implicates this region in mediating stimulus-induced conflict. This is consistent with previous findings linking top–down control over visual information to lateral prefrontal functioning (Zanto et al., 2010), and in perceptual conflict (van Veen et al., 2001). Further, right lateral prefrontal cortex has been suggested to play a particularly prominent role in top–down control (Aron et al., 2004). More generally, this highlights two strengths of the single-trial multiple regression approach: (1) Trial-varying stimulus luminance drawn from a random distribution would normally be considered an experimental confound; here, this confound becomes an asset that reveals the involvement of the lateral prefrontal cortex in regulating decision time according to stimulus difficulty. (2) Theta activity is not often localized over lateral prefrontal sites in trial averages (Figure 2A, and also Cavanagh et al., 2009; Cohen, 2011a; Nigbur et al., under review), but shows robust trial-by-trial modulations with experiment dynamics. This finding, together with increased conflict-related synchronization with medial frontal sites, demonstrates that lateral prefrontal theta is indeed involved in cognitive control processes, but this is difficult to infer because trial-averaged theta may not increase significantly compared to pre-stimulus baseline activity.
It is not clear why stimulus luminance had a main effect on low-frequency oscillations only during cC trials. We speculate that because these were the easiest trials, subjects may have had more cognitive resources to devote to low-level stimulus properties. However, this was not explicitly tested, nor did subjects spontaneously mention this.
“Standard” inter-trial phase coherence (also called cross-trial phase-locking) assumes that oscillation phase is relevant when the oscillation has a similar phase value across trials at each time–frequency point. Therefore, this approach mixes a number of potential causes of phase coherence, including stimulus-evoked responses, general orienting or attention responses, and task-specific dynamics. This approach precludes discovery of phase dynamics that are related to the task but are not consistent across trials. In contrast, the single-trial “weighted” phase modulation analysis performed here does not require phase values to be similar across trials; rather, this analysis is sensitive to modulations of phase values even if those phases are randomly distributed across trials. Indeed, an absence of pre-response cross-trial phase coherence would be expected if pre-response theta phase were modulated by reaction time (which differs from trial to trial).
Similarly, phase synchronization modulation has advantages over standard phase synchronization because, as described above, inter-site phase synchronization may result from a combination of specific task-related parameters and also more general cognitive/orienting processes. In contrast, the specific modulation of phase synchronization by reaction time provides a more focal interpretation of synchronization vis-à-vis conflict dynamics: phase angle differences do not need to be consistent over trials at each time–frequency point; rather, they need only to be consistently related to behavioral or experimental variables.
These two analytic approaches are complementary. Inter-trial phase coherence provides insights into the overall stimulus- or response-related phase consistencies, whereas phase modulation is process-specific. Note, however, that this specificity should be taken into consideration when interpreting results. For example, the phase modulation analyses in Figure 6 do not indicate that delta-band phase is irrelevant for the task; rather, they show that only theta-band phase is modulated by reaction time, whereas delta-band phase coherence may support a more general cognitive function that is time-locked to the response but unrelated to variations in response time. Similarly, comparing the inter-electrode phase synchronization with the phase synchronization modulation (Figure 6) suggests that the MFC-lateral prefrontal theta-band synchronization reflects both general response initiation processes, and, particularly during conflict, reaction time-specific processes.
Based on these findings, it seems that (1) medial frontal cortex has both a general role in generating responses, as well as a specific role in conflict-modulated decision time; (2) lateral prefrontal cortex is recruited by the medial frontal cortex during situations of conflict, and synchronized theta-band activity may be the substrate of their communication; (3) lateral prefrontal cortex is additionally involved in influencing reaction time according to modulations of conflict (stimulus luminance).
Results from the independent components analyses were generally less robust compared to those based on electrode time courses. It is possible that more sophisticated component clustering techniques would reveal the findings to a similar magnitude as with the electrode-based analyses. However, in this case, it seems that independent components analysis may not necessarily be an optimal approach for single-trial analyses.
Another significant advantage of the methods used here is that they are robust to potential outliers at the single-trial level. During standard trial averaging, trials are not typically inspected for outliers, and it is thus possible that a minority of trials with large oscillation power values bias the average activity levels. In contrast, robust regression minimizes the contribution of outliers, and the phase modulation analyses are based on permutation testing, therefore minimizing the danger of outliers biasing estimates of trial-averaged results.
One could extend this framework to apply hierarchical regression models in which the variance from the single-subject trial-level data is used to inform group-level results. This might be particularly useful when comparing groups, e.g., if patients and control subjects have similar average effects but patients have more variable responses. This approach could also be applied to fMRI data, for example using as the dependent measure the observed data from ∼6 s post-stimulus (when the hemodynamic response is expected to peak) or a beta parameter corresponding to the fit of the post-stimulus data to a canonical hemodynamic response. Although single-trial correlations have been performed with the hemodynamic response (e.g., Rissman et al., 2004; Weissman et al., 2006), multiple regression may prove more powerful for reasons highlighted in the Section “Introduction.” Finally, the regressions could be turned around, such that behavior or experimental condition is predicted from brain activity, rather than predicting brain activity from behavior and experimental condition. In this case, logistic regression should be used if predicting binary outcomes (e.g., accuracy or condition; Dixon, 2008; Jaeger, 2008).
Cross-trial averaging has advantages, but in many cases should be only the first step of a data analysis protocol. Many experiments contain rich and untapped experimental, behavioral, and neural dynamics that remain to be explored and tested. In this study, for example, single-trial multiple regression (and corresponding phase modulation analyses) revealed complementary and interactive roles of the medial and lateral prefrontal cortex during response conflict. The methods used here, of course, are general and could be applied to any design or topic within human neuroscience.
The authors declare that the research was conducted in the absence of any commercial or financial relationships that could be construed as a potential conflict of interest.
We thank Claudia Arena for assistance with data collection. Michael X Cohen is, and the present experiment was, funded by a VIDI grant from the Dutch Organization for Scientific Research (NWO).
Aron, A. R., Robbins, T. W., and Poldrack, R. A. (2004). Inhibition and the right inferior frontal cortex. Trends Cogn. Sci. 8, 170–177.
Boehler, C. N., Bunzeck, N., Krebs, R. M., Noesselt, T., Schoenfeld, M. A., Heinze, H. J., Munte, T. F., Woldorff, M. G., and Hopf, J. M. (2010). Substantia nigra activity level predicts trial-to-trial adjustments in cognitive control. J. Cogn. Neurosci. 23, 362–373.
Botvinick, M. M., Braver, T. S., Barch, D. M., Carter, C. S., and Cohen, J. D. (2001). Conflict monitoring and cognitive control. Psychol. Rev. 108, 624–652.
Cavanagh, J. F., Cohen, M. X., and Allen, J. J. (2009). Prelude to and resolution of an error: EEG phase synchrony reveals cognitive control dynamics during action monitoring. J. Neurosci. 29, 98–105.
Cavanagh, J. F., Frank, M. J., Klein, T. J., and Allen, J. J. B. (2010). Frontal theta links prediction errors to behavioral adaptation in reinforcement learning. Neuroimage 49, 3198–3209.
Christie, G. J., and Tata, M. S. (2009). Right frontal cortex generates reward-related theta-band oscillatory activity. Neuroimage 48, 415–422.
Cohen, M. X. (2011a). Error-related medial frontal theta activity predicts cingulate-related structural connectivity. Neuroimage 2010, 30.
Cohen, M. X., Ridderinkhof, K. R., Haupt, S., Elger, C. E., and Fell, J. (2008). Medial frontal cortex and response conflict: evidence from human intracranial EEG and medial frontal cortex lesion. Brain Res. 1238, 127–142.
Cohen, M. X., van Gaal, S., Ridderinkhof, K. R., and Lamme, V. A. (2009). Unconscious errors enhance prefrontal-occipital oscillatory synchrony. Front. Hum. Neurosci. 3:54. doi: 10.3389/neuro.09.054.2009
De Lucia, M., Michel, C. M., and Murray, M. M. (2010). Comparing ICA-based and single-trial topographic ERP analyses. Brain Topogr. 23, 119–127.
Debener, S., Ullsperger, M., Siegel, M., and Engel, A. K. (2007). Towards single-trial analysis in cognitive brain research. Trends Cogn. Sci. 11, 502–503.
Debener, S., Ullsperger, M., Siegel, M., Fiehler, K., von Cramon, D. Y., and Engel, A. K. (2005). Trial-by-trial coupling of concurrent electroencephalogram and functional magnetic resonance imaging identifies the dynamics of performance monitoring. J. Neurosci. 25, 11730–11737.
Delorme, A., and Makeig, S. (2004). EEGLAB: an open source toolbox for analysis of single-trial EEG dynamics including independent component analysis. J. Neurosci. Methods 134, 9–21.
Delorme, A., Westerfield, M., and Makeig, S. (2007). Medial prefrontal theta bursts precede rapid motor responses during visual selective attention. J. Neurosci. 27, 11949–11959.
Egner, T. (2007). Congruency sequence effects and cognitive control. Cogn. Affect. Behav. Neurosci. 7, 380–390.
Eichele, H., Juvodden, H. T., Ullsperger, M., and Eichele, T. (2010). Mal-adaptation of event-related EEG responses preceding performance errors. Front. Hum. Neurosci. 4:65. doi: 10.3389/fnhum.2010.00065
Eichele, T., Calhoun, V. D., and Debener, S. (2009). Mining EEG-fMRI using independent component analysis. Int. J. Psychophysiol. 73, 53–61.
Forstmann, B. U., Jahfari, S., Scholte, H. S., Wolfensteller, U., van den Wildenberg, W. P., and Ridderinkhof, K. R. (2008). Function and structure of the right inferior frontal cortex predict individual differences in response inhibition: a model-based approach. J. Neurosci. 28, 9790–9796.
Gratton, G., Coles, M. G., and Donchin, E. (1992). Optimizing the use of information: strategic control of activation of responses. J. Exp. Psychol. Gen. 121, 480–506.
Hanslmayr, S., Pastotter, B., Bauml, K. H., Gruber, S., Wimber, M., and Klimesch, W. (2008). The electrophysiological dynamics of interference during the Stroop task. J. Cogn. Neurosci. 20, 215–225.
Jaeger, T. F. (2008). Categorical Data Analysis: away from ANOVAs (transformation or not) and towards Logit Mixed Models. J. Mem. Lang. 59, 434–446.
Lachaux, J. P., Rodriguez, E., Martinerie, J., and Varela, F. J. (1999). Measuring phase synchrony in brain signals. Hum. Brain Mapp. 8, 194–208.
Luu, P., and Tucker, D. M. (2001). Regulating action: alternating activation of midline frontal and motor cortical networks. Clin. Neurophysiol. 112, 1295–1306.
Marco-Pallares, J., Cucurell, D., Cunillera, T., Garcia, R., Andres-Pueyo, A., Münte, T. F., and Rodriguez-Fornells, A. (2008). Human oscillatory activity associated to reward processing in a gambling task. Neuropsychologia 46, 241–248.
Mars, R. B., Debener, S., Gladwin, T. E., Harrison, L. M., Haggard, P., Rothwell, J. C., and Bestmann, S. (2008). Trial-by-trial fluctuations in the event-related electroencephalogram reflect dynamic changes in the degree of surprise. J. Neurosci. 28, 12539–12545.
Mathalon, D. H., Whitfield, S. L., and Ford, J. M. (2003). Anatomy of an error: ERP and fMRI. Biol. Psychol. 64, 119–141.
Mazaheri, A., Nieuwenhuis, I. L., van Dijk, H., and Jensen, O. (2009). Prestimulus alpha and mu activity predicts failure to inhibit motor responses. Hum. Brain Mapp. 30, 1791–1800.
Miltner, W. H., Lemke, U., Weiss, T., Holroyd, C., Scheffers, M. K., and Coles, M. G. (2003). Implementation of error-processing in the human anterior cingulate cortex: a source analysis of the magnetic equivalent of the error-related negativity. Biol. Psychol. 64, 157–166.
O’Leary, D. P. (1990). Robust regression computation using iteratively reweighted least squares. J. Matrix Anal. Appl. 11, 466–480.
Onton, J., Delorme, A., and Makeig, S. (2005). Frontal midline EEG dynamics during working memory. Neuroimage 27, 341–356.
Philiastides, M. G., and Sajda, P. (2007). EEG-informed fMRI reveals spatiotemporal characteristics of perceptual decision making. J. Neurosci. 27, 13082–13091.
Ratcliff, R., Philiastides, M. G., and Sajda, P. (2009). Quality of evidence for perceptual decision making is indexed by trial-to-trial variability of the EEG. Proc. Natl. Acad. Sci. U.S.A. 106, 6539–6544.
Ridderinkhof, K. R., Ullsperger, M., Crone, E. A., and Nieuwenhuis, S. (2004). The role of the medial frontal cortex in cognitive control. Science 306, 443–447.
Rissman, J., Gazzaley, A., and D’Esposito, M. (2004). Measuring functional connectivity during distinct stages of a cognitive task. Neuroimage 23, 752–763.
Rousselet, G. A., Husk, J. S., Pernet, C. R., Gaspar, C. M., Bennett, P. J., and Sekuler, A. B. (2009). Age-related delay in information accrual for faces: evidence from a parametric, single-trial EEG approach. BMC Neurosci. 10, 114. doi: 10.1186/1471-2202-10-114
Rousselet, G. A., Pernet, C. R., Bennett, P. J., and Sekuler, A. B. (2008). Parametric study of EEG sensitivity to phase noise during face processing. BMC Neurosci. 9, 98. doi: 10.1186/1471-2202-9-98
Scholte, H. S., Ghebreab, S., Waldorp, L., Smeulders, A. W., and Lamme, V. A. (2009). Brain responses strongly correlate with Weibull image statistics when processing natural images. J. Vis. 9, 1–15.
Schwind, J., and Dormann, W. U. (1986). Off-line removal of ocular artifacts from event-related potentials using a multiple linear regression model. Int. J. Psychophysiol. 4, 203–208.
Szmalec, A., Verbruggen, F., Vandierendonck, A., De Baene, W., Verguts, T., and Notebaert, W. (2008). Stimulus ambiguity elicits response conflict. Neurosci. Lett. 435, 158–162.
Trujillo, L. T., and Allen, J. J. (2007). Theta EEG dynamics of the error-related negativity. Clin. Neurophysiol. 118, 645–668.
van Veen, V., Cohen, J. D., Botvinick, M. M., Stenger, V. A., and Carter, C. S. (2001). Anterior cingulate cortex, conflict monitoring, and levels of processing. Neuroimage 14, 1302–1308.
Vocat, R., Pourtois, G., and Vuilleumier, P. (2008). Unavoidable errors: a spatio-temporal analysis of time-course and neural sources of evoked potentials associated with error processing in a speeded task. Neuropsychologia 46, 2545–2555.
Wang, C., Ulbert, I., Schomer, D. L., Marinkovic, K., and Halgren, E. (2005). Responses of human anterior cingulate cortex microdomains to error detection, conflict monitoring, stimulus-response mapping, familiarity, and orienting. J. Neurosci. 25, 604–613.
Weissman, D. H., Roberts, K. C., Visscher, K. M., and Woldorff, M. G. (2006). The neural bases of momentary lapses in attention. Nat. Neurosci. 9, 971–978.
Wessel, J. R., and Ullsperger, M. (2010). Selection of independent components representing event-related brain potentials: a data-driven approach for greater objectivity. Neuroimage 54, 2105–2115.
Yarkoni, T., Barch, D. M., Gray, J. R., Conturo, T. E., and Braver, T. S. (2009). BOLD correlates of trial-by-trial reaction time variability in gray and white matter: a multi-study fMRI analysis. PLoS ONE 4, e4257. doi: 10.1371/journal.pone.0004257
Yeung, N., Ralph, J., and Nieuwenhuis, S. (2007). Drink alcohol and dim the lights: the impact of cognitive deficits on medial frontal cortex function. Cogn. Affect. Behav. Neurosci. 7, 347–355.
Keywords: EEG, oscillations, response conflict, cognitive control, single trial, regression, theta, medial frontal cortex
Citation: Cohen MX and Cavanagh JF (2011) Single-trial regression elucidates the role of prefrontal theta oscillations in response conflict. Front. Psychology 2:30. doi: 10.3389/fpsyg.2011.00030
Received: 07 January 2011;
Paper pending published: 04 February 2011;
Accepted: 14 February 2011;
Published online: 28 February 2011.
Edited by:
Guillaume A. Rousselet, University of Glasgow, UKCopyright: © 2011 Cohen and Cavanagh. This is an open-access article subject to an exclusive license agreement between the authors and Frontiers Media SA, which permits unrestricted use, distribution, and reproduction in any medium, provided the original authors and source are credited.
*Correspondence: Michael X Cohen, Department of Psychology, University of Amsterdam, Roetersstraat 15, 6th Floor, 1018 WB Amsterdam, Netherlands e-mail:bWlrZXhjb2hlbkBnbWFpbC5jb20=
Disclaimer: All claims expressed in this article are solely those of the authors and do not necessarily represent those of their affiliated organizations, or those of the publisher, the editors and the reviewers. Any product that may be evaluated in this article or claim that may be made by its manufacturer is not guaranteed or endorsed by the publisher.
Research integrity at Frontiers

Learn more about the work of our research integrity team to safeguard the quality of each article we publish.