- 1School of Environment, Liaoning University, Shenyang, China
- 2CAS Key Laboratory of Forest Ecology and Silviculture, Institute of Applied Ecology, Chinese Academy of Sciences, Shenyang, China
Habitat quality (HQ) has been progressively degrading worldwide in recent decades due to rapid climate change and intensive human activities. These changes not only threaten biodiversity and ecosystem functions, but also impact socio-economic development. Therefore, a few studies have focused on the dynamics of HQ and its natural and anthropogenic drivers. However, many contributions have failed to reveal how these factors interact to impact HQ, especially in ecologically fragile areas. We estimated HQ in the Songnen Plain of Northeast China, an ecologically fragile area, from 2000 to 2020 using the InVEST model and explored the response of HQ to the interactions of natural factors (topography, climate, NDVI) and anthropogenic factors (nighttime light index, population density) influencing HQ using Structural Equation Modelling (SEM). The results showed that 1) HQ decreased constantly from 2000 to 2018, and then increased slightly from 2018 to 2020. 2) In terms of spatial distribution, HQ appeared to be highly heterogeneous with a pattern of ‘high HQ in the east – low HQ in the center – high HQ in the west’ at each time point. The high-HQ areas were significantly clustered in the eastern parts with dense forests, while the low-HQ areas in the central parts were dominated by a large number of man-made patches of agriculture and towns or cities. 3) The spatial patterns of HQ are mainly affected by the interactions of factors including the natural environment and human disturbance. Natural factors had a greater impact on HQ than human disturbance, and human disturbance factors had significant negative impact among all these factors at 4 time points. Furthermore, the intensity of the impact of various influencing factors on habitat quality, as well as the positive or negative effects of these drivers on habitat quality, changed over time. The most important influencing factor was temperature in 2000 and topography in 2010, 2018, and 2020. This study can provide important suggestions for future ecological protection and restoration in similar ecologically fragile areas.
1 Introduction
Habitat quality (HQ) refers to the ability of ecosystems to provide suitable living conditions for species to survive and reproduce (Bai et al., 2019; Wu et al., 2022; Zhao et al., 2022c),which reflects the level of biodiversity, services and health of ecosystems (Zhu et al., 2020; Li et al., 2022). However, multiple disturbances such as climate change, high population growth and rapid economic development have increasingly degraded the natural environment worldwide, leading to a decline in biodiversity and subsequent degradation of habitat quality (Yohannes et al., 2021; Ti et al., 2023). Therefore, it is essential and urgent to make appropriate decisions to improve habitat quality and ultimately promote sustainable development. To achieve this goal, it is crucial to assess the spatial and temporal changes in HQ, identify the driving factors behind the changes, and detect the interactions among these factors in these degraded areas at the regional scale (Wang et al., 2011; Miguel et al., 2018).
Existing studies assessing HQ and investigating its drivers have mostly focused on mountainous areas (Huang et al., 2023), urban agglomerations (Wang et al., 2023a), river basins (Sun et al., 2019), and nature reserves (Sallustio et al., 2017), but have ignored ecologically fragile areas which are vulnerable to degradation but difficult to restore, and are largely located in transitional ecotones between two different types of ecosystems (Nguyen and Liou, 2019). Compared to on-fragile areas, these areas are exposed to more pressures from natural and anthropogenic disturbances due to their characteristics of high landscape heterogeneity, large edge-influenced habitats, high sensitivity and low resistance to disturbance (Liu et al., 2021b; Wang et al., 2021b; Shi et al., 2023b). Generally, HQ problems have become increasingly severe in these areas (Zhang et al., 2017; Lv et al., 2019; Wang et al., 2021a). For example, in Alappuzha District, an ecologically fragile area in southern India, a series of environmental problems such as geomorphological degradation, sea level rise, population growth, and anthropogenic damage have been commonly observed (Prasad and Ramesh, 2018). Besides, fragile areas cover more than half of the world’s total land area, playing an important role in ecological security. Thus, these large areas of low habitat quality urgently require restoration of production and function. Therefore, it is of great importance to assess HQ and investigate the driving factors in order to provide a scientific basis for improving HQ in these fragile areas.
Previous HQ assessment methods can be roughly divided into two categories. One was to use data from field surveys and establish an evaluation framework with selected indicators and evaluation standards to assess HQ. This method can directly reflect the ecological conditions of specific sites, but it is time-consuming, labor-intensive, and often fails to consider the spatial interactions among selected ecological features (Goertz, 1964; Ouyang et al., 2001; Xiao et al., 2022). Another one has been to use ecological models to quantitatively assess HQ, such as the MaxEnt (Qi et al., 2011), SoIVES (Wang et al., 2016), HSI (Wang et al., 2009a), InVEST model (Wang et al., 2024a) etc. InVEST model futures the ability to systematically assess ecological and environmental conditions by integrating the impact of threat sources on habitats, allowing it to be applied at multiple scales in various locations all over the world to help solve current and future environmental problems (Pu et al., 2024). Also, it has been proved to be a promising model for HQ assessment in fragile areas.
It is a complex ecological process that spatial HQ patterns and their dynamics have been affected by a combination of natural factors and human activities (Jin et al., 2022). Many studies have shown that natural geographic factors such as soil or topography significantly affected HQ patterns. For example, areas with poor soils tended to have lower HQ (Sun et al., 2019; Jin et al., 2022). Meanwhile, human activities such as population growth, urban expansion and land use change have also been found to significantly affect HQ change, and in some cases become the dominant driver (Bai et al., 2019; Wu et al., 2022; Zhao et al., 2022c). Moreover, these factors of natural disturbance and human activities interact with each other to determine HQ (Li et al., 2019). For example, terrain can not only alter the distribution of temperature and precipitation (Zhao et al., 2023), but also shape human activities to occur mostly at low altitudes (Xu et al., 2020). However, the relative contributions and interactions of different natural and human activity factors to patterns of habitat quality remain unclear, especially in ecologically fragile areas.
The commonly-used methods, such as multiple regression analysis (Yan et al., 2018), correlation analysis (Zhao et al., 2022b) and Geogdetector (Luo et al., 2024), are capable of analyzing the relative contribution of multiple influencing factors to habitat quality, but fail to qualify the interactions among influencing factors. In contrast, Structural Equation Model (SEM) is designed to deal with multiple causal relationships among all variables including explanatory and response variables, and also examine the direct or indirect impacts of explanatory variables on response variables (Grace et al., 2010). As a result, SEM has been widely used to be address multifactor-driven social problems. Recently, it has also been found to be an effective way to quantify interactions among multiple biotic and abiotic factors driving ecological processes (Grace et al., 2016). Therefore, it is essential that SEM be used to explore the combined effects of influencing factors on habitat quality, which will contribute to a better understand of the mechanisms underlying HQ dynamics and ultimately provide valuable information for making policies to improve habitat quality in fragile areas.
The Songnen Plain, located in the temperate semi-humid and semi-arid transitional zone in northeastern China, is an ecologically fragile and intact geographical unit (Wang et al., 2022a). It is a crucial area for China’s grain and livestock production, playing an important role in ensuring national food security and resource supply. Additionally, as an important stopover for migratory birds in Northeast Asia, it is vital for maintaining biodiversity and ecological security within and beyond the region (Yu et al., 2023). In recent decades, the Songnen Plain has faced environmental challenges such as wetland loss, soil salinization, and grassland degradation (Wang et al., 2011). Therefore, it is of great practical importance to systematically study the spatiotemporal changes in habitat quality and identify the driving factors in this region. We performed both the InVEST model and the structural equation model in the Songnen Plain, to (1) assess HQ and analyze the temporal and spatial dynamics in 2000, 2005, 2010, 2015, 2018, and 2020; (2) reveal the impacts of natural and anthropogenic factors and their interactions on the spatial and temporal dynamics of HQ.
2 Materials and methods
2.1 Study area
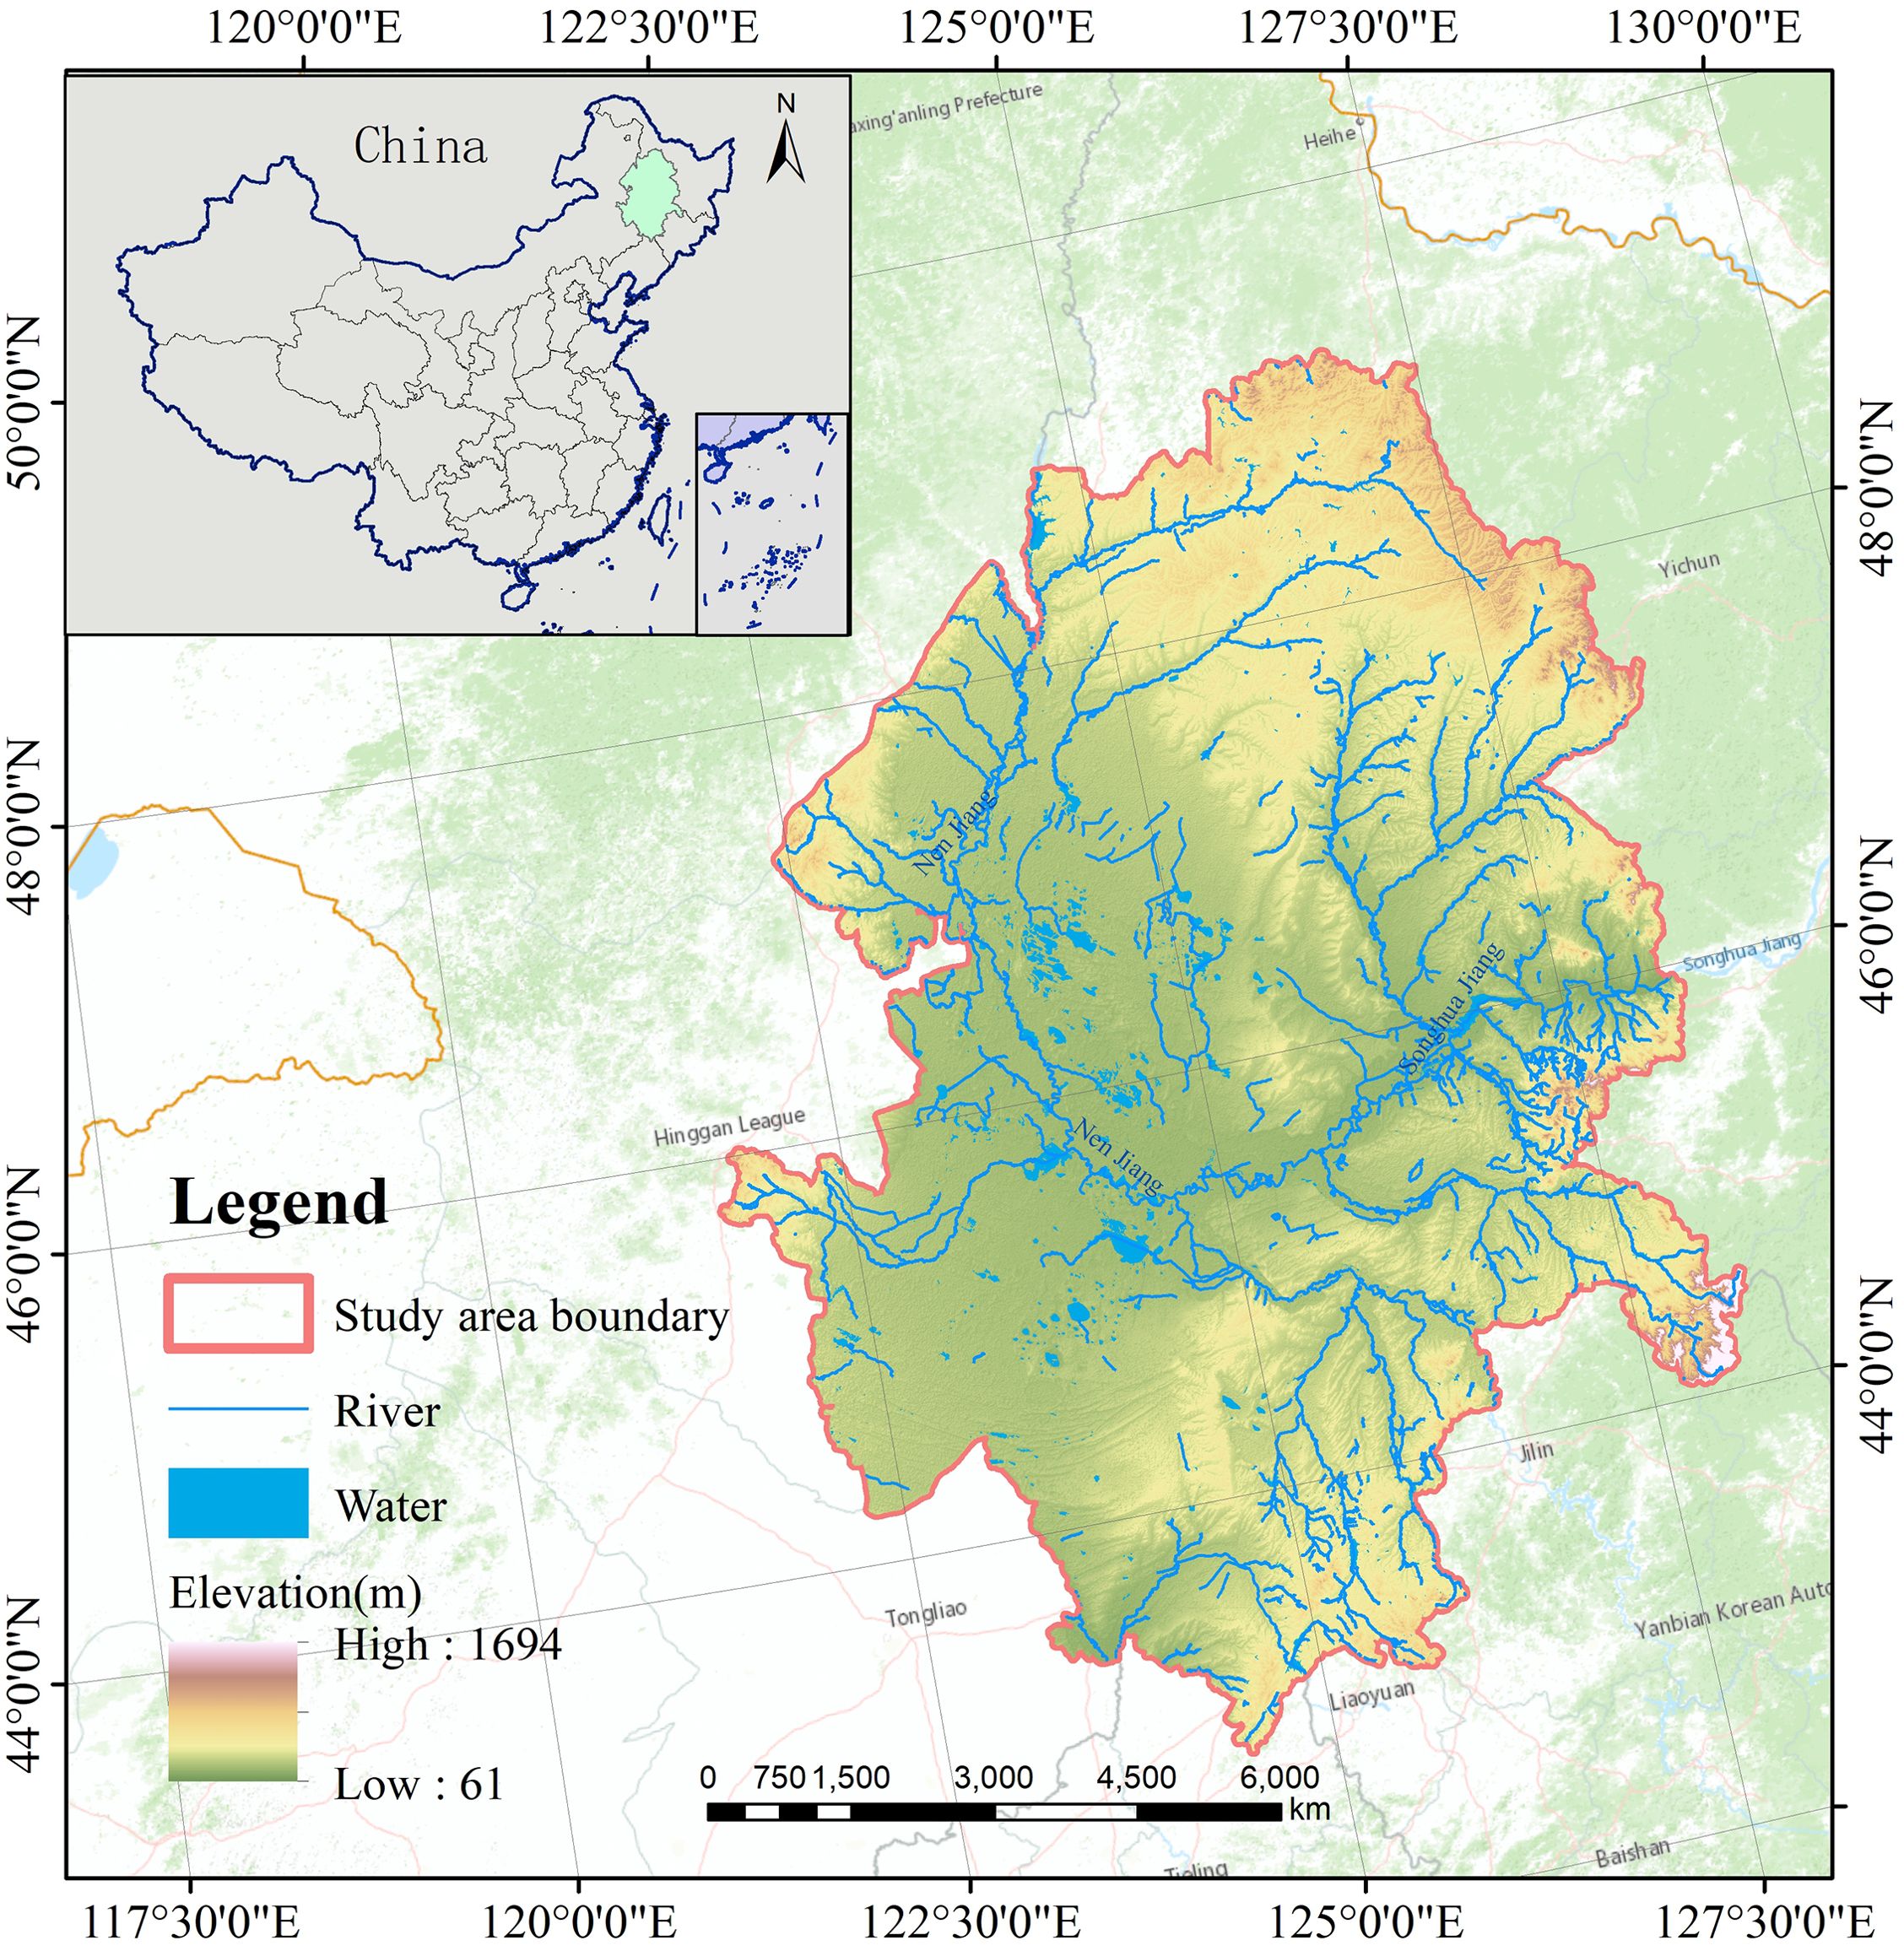
The Songnen Plain (E121°38’–128°33’, N 42°49’–49°12’)(Figure 1), one of the three major areas with saline-alkaline soils in the world, is situated at the convergence of three transition zones: the Northeast Plain and the Mongolian Plateau, the Semi-Humid Zone and the Semi-Arid Zone, and the Modern Agricultural Zone and the Traditional Animal Husbandry Zone, indicating its fragility in ecological environment (Zhu et al., 2020; Wang et al., 2024b). The study area is characterized by a relatively flat terrain with an average altitude of 180–200 meters. It has a monsoon-influenced temperate continental semi-humid and semi-arid climate with a long cold winter and a short hot summer, and an average annual temperature ranging from 1.6 to 5.0°C. The annual precipitation, ranging from 400 to 600 mm, is concentrated in the summer and decreases from southeast to northwest, while evaporation increases in this direction. This area is abundant in water resources, with the Songhua River, Nen River, Taoer River, Chagan Lake, Dabusu Lake, etc flowing through it. Most parts of this area are covered by black soil and chernozem which are highly suitable for growing crops, making it an important agricultural region in Northeast China. Since the reform and opening up, the Songnen Plain has experienced rapid economic and social development. As of 2018, the total population of the Songnen Plain reached up to approximately 30.5052 million people, with a total GDP of 2,387.826 billion Yuan (Yang and Song, 2021).
2.2 Data sources
Land use data: we selected land use data for the years 2000, 2005, 2010, 2015, 2018 and 2020, with a spatial resolution of 30m. We chose this 20-year time scale because it is sufficient to capture the dynamics of the broader-scale system, but land use there changed rapidly and substantially from 2015 to 2020 (Tang et al., 2019). This data set was provided by the Data Center for Resources and Environmental Sciences, Chinese Academy of Sciences (RESDC) (http://www.resdc.cn).
Topographic data: The digital elevation model (DEM) data were derived from the ASTER GDEM 30m digital elevation data product provided by the Geospatial Data Cloud (https://www.gscloud.cn/). We used ArcGIS software to extract two topographic factors of elevation and slope.
Climate data: The High-resolution meteorological raster dataset including “1-km monthly mean temperature dataset for China (1901–2022) (Peng, 2020a)” and “1-km monthly precipitation dataset for China (1901–2022) (Peng, 2020b)” were utilized. These datasets were provided by the National Tibetan Plateau Data Center (http://data.tpdc.ac.cn/) and published by Peng et al (Peng et al., 2017a, b, 2019; Ding and Peng, 2020). Then the average temperature data and annual precipitation data for 2000, 2010, 2018 and 2020 with a spatial resolution of 1km were obtained through preprocessing such as image metric statistics.
Population density data: Population density data for 2000, 2010, 2018 and 2020 were obtained from the World Population Density Map dataset published by WorldPop (https://hub.worldpop.org/) which is the most accurate and reliable long-term series of data available with a spatial resolution of l km.
Nighttime Light: Nighttime light data with a spatial resolution of 1km for 2000, 2010, 2018 and 2020 were obtained from the HARVARD Dataverse (Wu et al., 2021).
Normalized Difference Vegetative Index (NDVI): We utilized NDVI data from the MOD13Q1 product, with a spatial resolution of 250m. We used the Maximum Value Composition to obtain NDVI maximum images for the years 2000, 2010, 2018, and 2020.
Finally, we used resampling techniques to resample all data to a uniform spatial resolution of 1 km.
2.3 Methods
2.3.1 Changes in land use
We employed the land use data of Songnen Plain in 2000, 2005, 2010, 2015, 2018 and 2020 to reveal the area changes of each land use type, and then used the land use transfer matrix to quantitatively represent the conversions between various land use types for each decade from 2000 to 2020 (Yang et al., 2023b). The calculation formula for the land use transition matrix is as follows:
Where Tij represents the area that has transitioned from land use type i to land use type j. n is the number of land use types.
2.3.2 Evaluation of habitat quality
We used the HQ module in InVEST to simulate HQ in the years 2000, 2005, 2010, 2015, 2018, and 2020. The InVEST model was developed by Stanford University in collaboration with the World Wide Fund for Nature and other organizations. This model is a modeling system for assessing ecological and economic services of ecosystems to support decision-making for ecosystem management (Wang et al., 2016; Alexander et al., 2018). Based on land use data, the ‘HQ’ module of the InVEST model combines the maximum impact distance, the relative weight of threat factors on habitats, the habitat suitability of each land use type and its sensitivity to threat factors to assess habitat quality at a regional scale. The calculation formula for habitat quality is as follows:
Where Qxj represents the habitat quality of grid x within habitat type j; Hj is the habitat suitability of habitat type j; z is a normalization constant; k is the half-saturation constant. represents the habitat degradation of grid x within habitat type j, and its calculation formula is as follows:
Where y refers to all grids on the threat grid map for x; Yr refers to a specific set of grids on the threat grid map where the threat factor is r; x represents the weight of the threat factor; indicates the accessibility level of grid x, with values closer to 1 signifying higher accessibility; is the sensitivity of land cover type j to threat factor r, with values closer to 1 indicating higher sensitivity. The stress exerted by threat factor r in grid y on the habitat in grid x is represented as .
When the distance decay effect of threat factor r on grid x is represented as a linear function, the formula is as follows:
When the distance decay effect of threat factor r on grid x is represented as an exponential function, the formula is as follows:
Where irxy represents the impact of grid y, where the threat source is r, on grid x; dxy is the distance between grid x and grid y; drmax is the maximum range of influence of the threat factor.
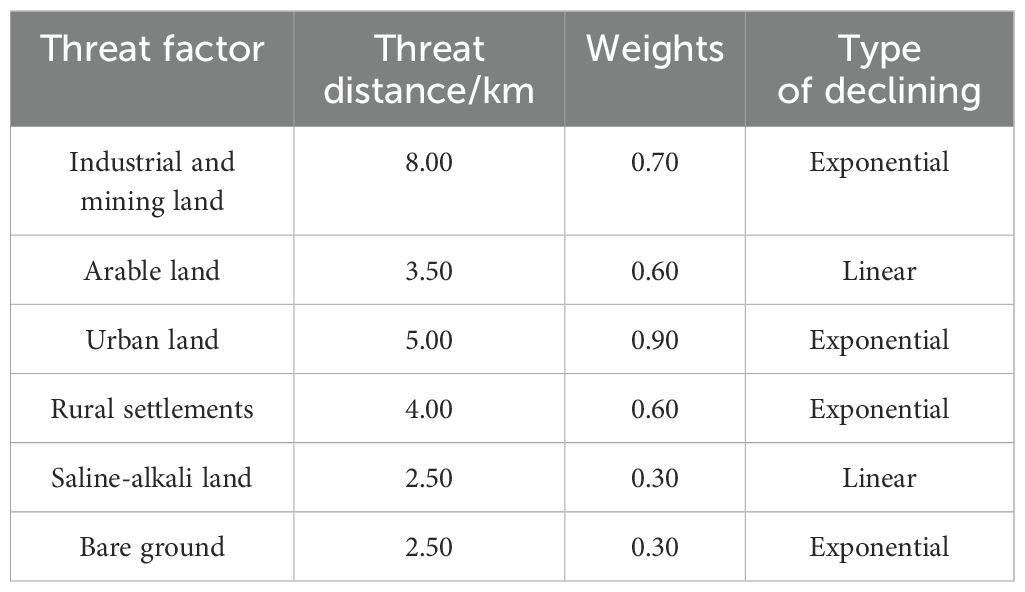
First, taking account of knowledge from previous research (Zhao et al., 2022a; Wang et al., 2022b), model guidelines and expert guidance, we determined the model parameters, selected industrial and mining land, arable land, urban land, rural settlements, saline-alkali land and bare land as threat factors (Table 1), and identified the maximum impacting distance and relative weight of these 6 threat factors. Then, we identified the habitat suitability and sensitivity of land use types to threat factors (Table 2). Second, we ran the HQ module with the above input parameters, producing the simulated maps with HQ value ranging [0,1]. The HQ value closer to 1 represents higher HQ while the HQ value closer to 0 represents lower HQ (Liang et al., 2020; Shi et al., 2023a). Finally, the HQ map was classified into five classes: lowest class [HQ value ∈ (0,0.2)], lower class [HQ value ∈ (0.2,0.4)], medium class [HQ value ∈ (0.4,0.6)], higher class [HQ value ∈ (0.6,0.8)], highest class [HQ value ∈ (0.8,1)].
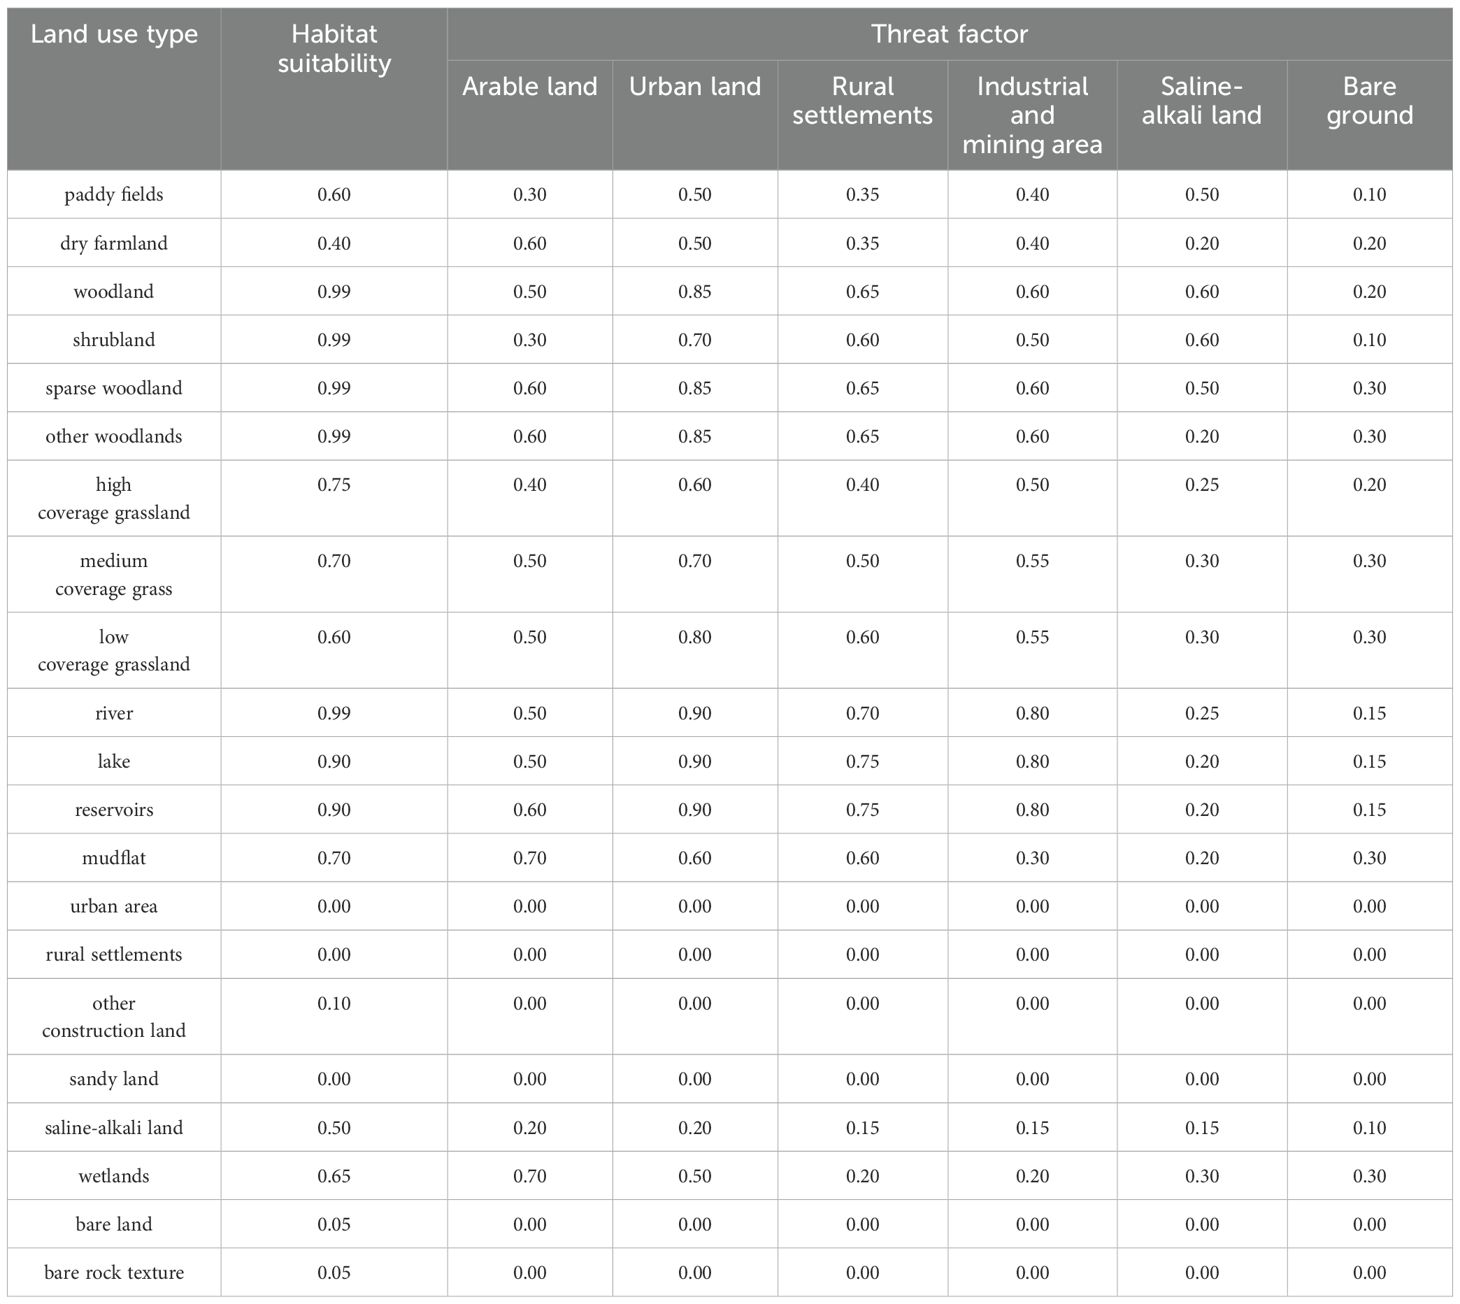
Table 2. Habitat suitability of land use types and sensitivity to threat factors in the Songnen Plain.
Spatial autocorrelation including global autocorrelation and local autocorrelation is used to measure the degree of spatial autocorrelation of geographic object attributes such as HQ value (Choudhary et al., 2020; Huang et al., 2023; Chen et al., 2023a). In this study, the global autocorrelation Moran’s I ranging from -1 to 1 was used to determine the spatial aggregation of HQ value. Moran’s I less than 0, greater than 0, or equal to 0 indicates negative autocorrelation, positive autocorrelation, or no autocorrelation in the spatial distribution, respectively (Sharafatmandrad and Khosravi Mashizi, 2023).
Hotspot analysis is often used to determine, whether,for a geographic feature, there are statistically hotspot areas where grids with high values are significantly clustered or coldspot areas where grids with low values are significantly clustered (Li et al., 2021) (Lane et al., 2018). We used the Getis-Ord Gi* index to identify hot/cold spot areas of HQ.
2.3.3 Impacts of influencing factors on habitat quality
We used structural equation modelling (SEM) to simulate the relationships between HQ and the influencing factors. As a powerful statistical method for multivariate analysis, SEM is distinctive by the combination of causal and measurement models, the consideration of interactions among multiple influencing variables, and the assessment of the impact of potential variables (He et al., 2020). It can be tested by fitness to improve its reliability and stability (Ye et al., 2022; Wang et al., 2023b). In the SEM simulation, a conceptual model was first constructed, considering both observed variables and latent variables. The observed variables can be directly observed or measured, while latent variables cannot be directly observed. We tested and optimized the constructed concept model according to the fitness, and then obtained an optimized concept model map explaining the relationships among all explanatory and response variables (Jöreskog, 1970). The formula for the Structural Equation Model (SEM) is as follows:
Where Y represents the observed variable; η represents the latent variable; is the factor loading matrix; and epsilonϵ represents the measurement error.
Where B is the path coefficient matrix between endogenous latent variables; is the path coefficient matrix from exogenous latent variables to endogenous latent variables; and ζ represents the structural error.
HQ is usually influenced by natural and anthropogenic factors (Fritz et al., 2018). Taking into account the natural ecological environment and the demands of socio-economic development of the Songnen Plain (Jasperson et al., 2018), according to previous studies, data availability, and consideration of the regional characteristics of the Songnen Plain (Rahimi et al., 2020), we selected a total of five natural elements and two social factors as factors influencing HQ, including elevation, slope, annual precipitation, average annual temperature, Normalized Difference Vegetative Index(NDVI), population density and nighttime lighting, and established a conceptual model of the spatial-temporal distribution factors influencing HQ (Figure 2). NDVI is widely used as a measure of vegetation health, and nighttime light intensity is a common indicator of the intensity of human activity. Topography, human disturbance and climatic conditions were the latent variables, and each kind of latent variable consisted of two observational variables. Topography included elevation and slope, human disturbance included night-time lighting and population density, and climatic conditions included annual precipitation and annual mean temperature.
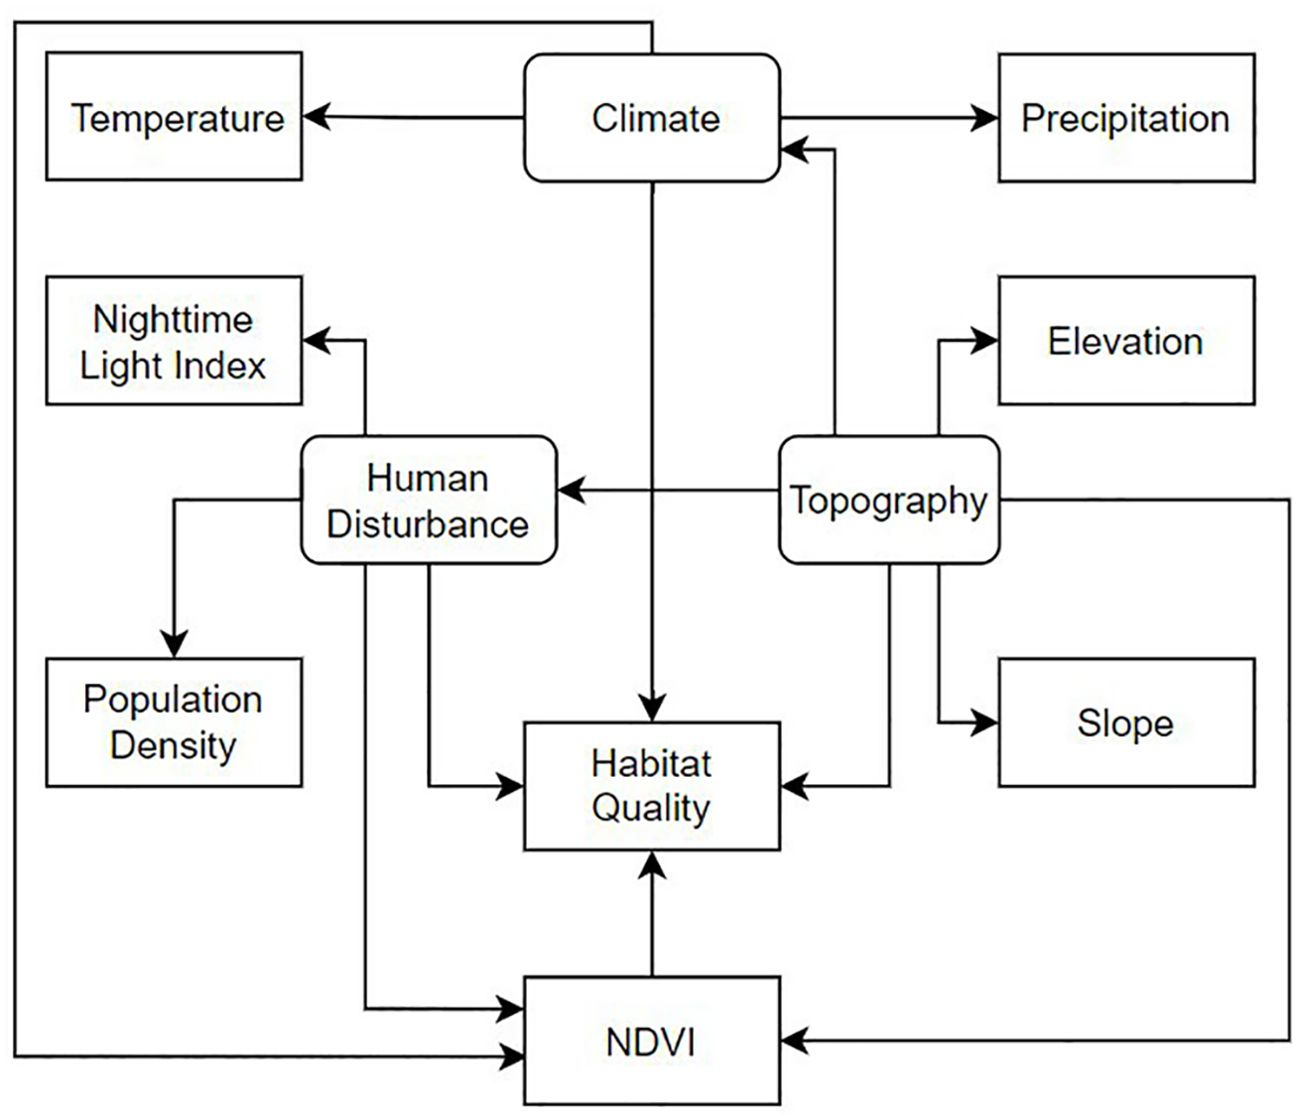
Figure 2. Conceptual model of influencing factors of HQ in the Songnen Plain, 2000–2020. Rounded rectangles are latent variables; rectangles are observed variables; Directional paths (one-way arrows) indicate causal relationships between two variables.
First, we tested eight variables (seven explanatory variables and one response variable) for normality. To satisfy the normality assumption, we performed Johnson transformations on the variables that did not meet the normality criteria and then standardized the variables. Second, to identify the best fitting model, four indicators were selected to analyze the effectiveness of model fitting, including Comparative Fit Index (CFI), Goodness of Fit Index (GFI), Root Mean Square Error of Approximation (RMSEA), and Standardized Residual Mean Root (SRMR). Generally, If the model fitness meets the requirements of CFI > 0.90, GFI > 0.90, RMSEA < 0.06 and SRMR < 0.05 (Team, 2013), the model results were expected to be presented in a path diagram with paths marked by a corresponding standardized Regression Coefficient (r) indicating the strength of the causal effect between the variables at the two ends of that path. The path with a larger coefficient means a stronger effect. If a variable points directly to the HQ, the effect of that variable was direct, while, if a variable does not point directly to the HQ, the effect of that variable was indirect. The product of the coefficients of all paths from that variable to the response variable indicated the magnitude of that effect. The magnitude of direct and indirect impacts of the variables was the total impact.
3 Result
3.1 Changes in land use
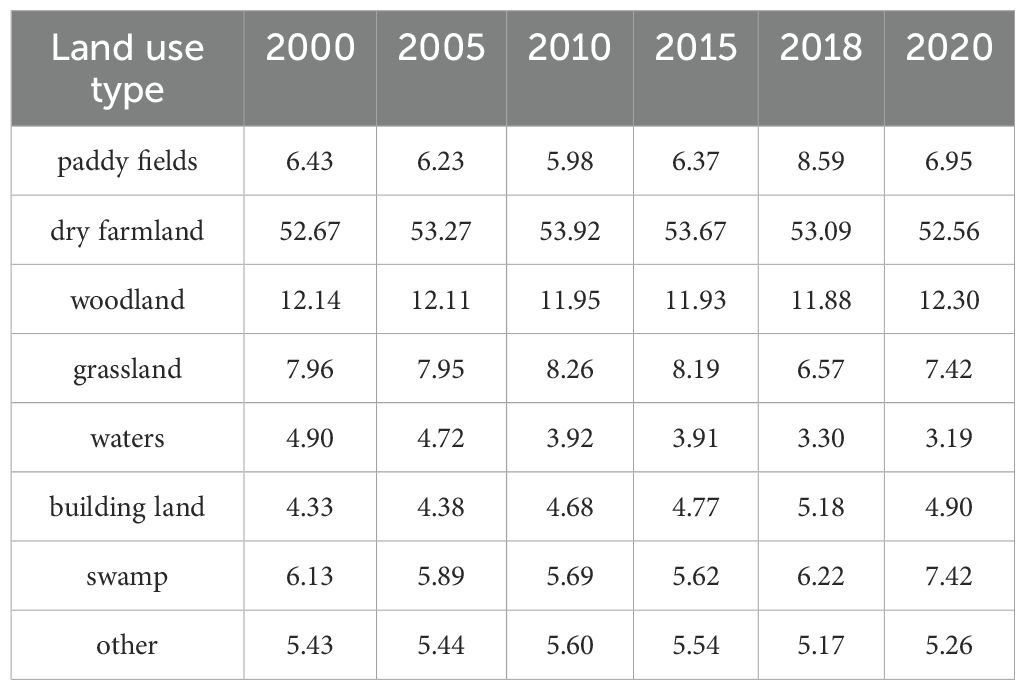
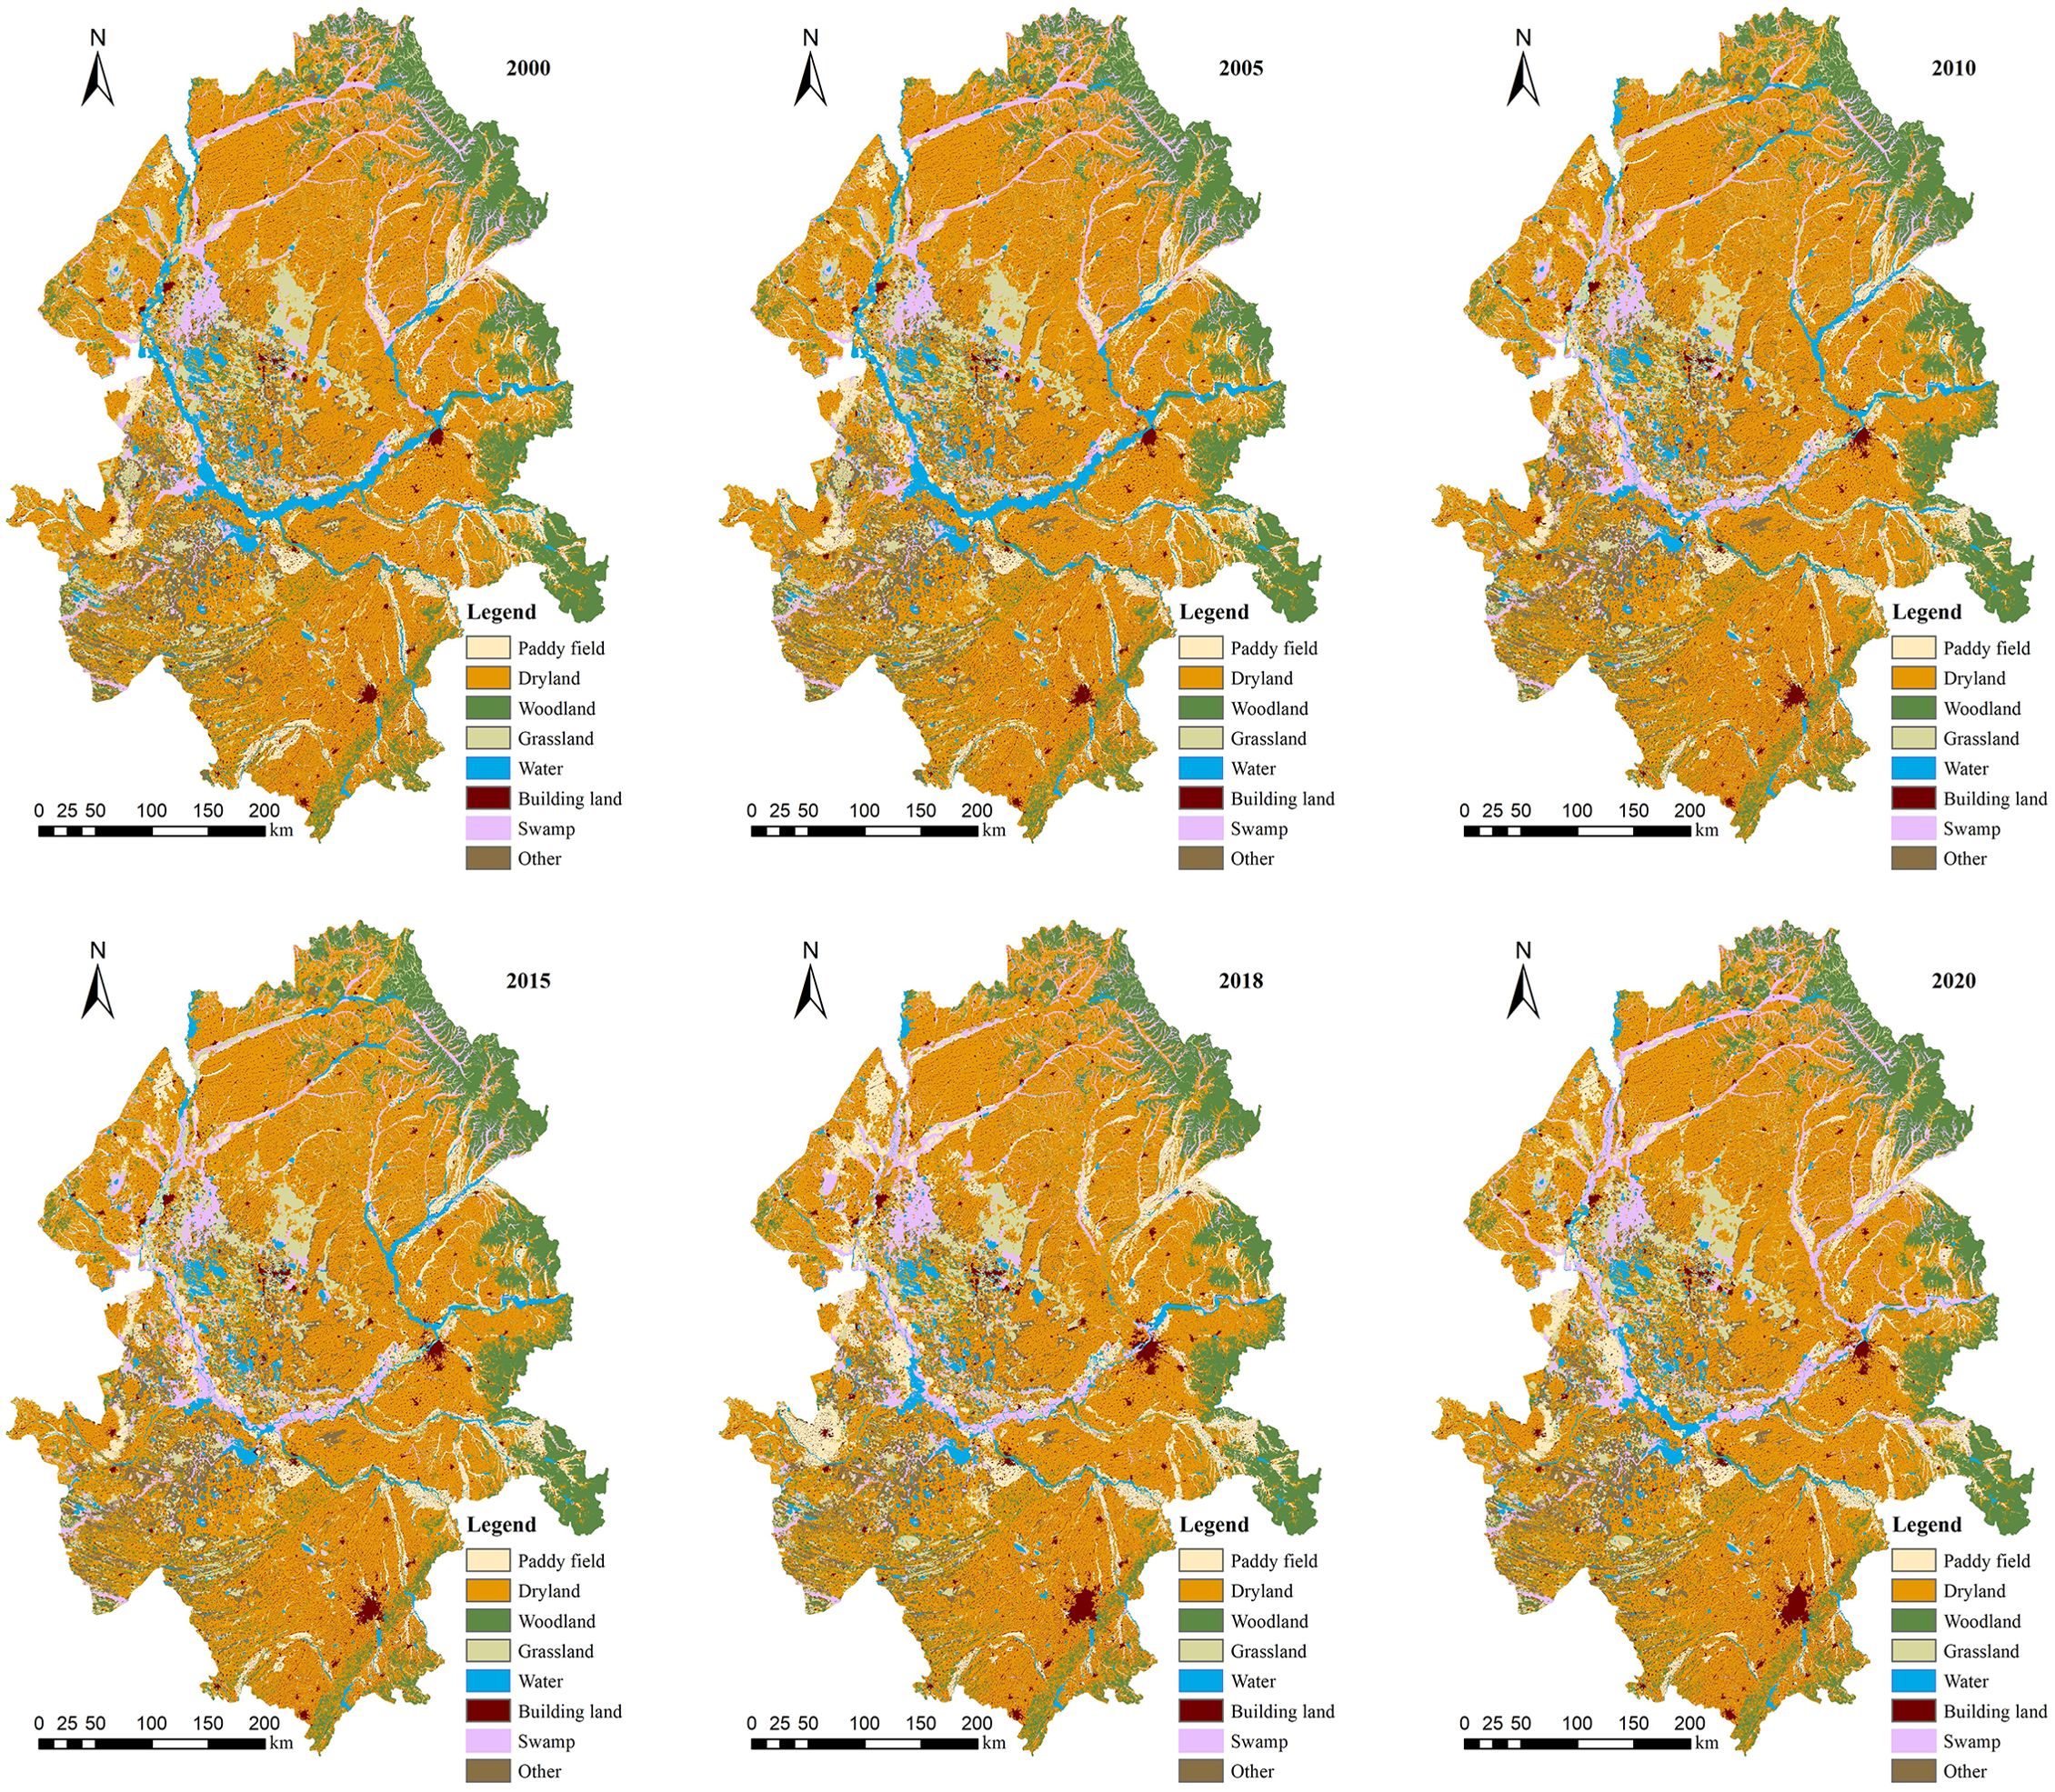
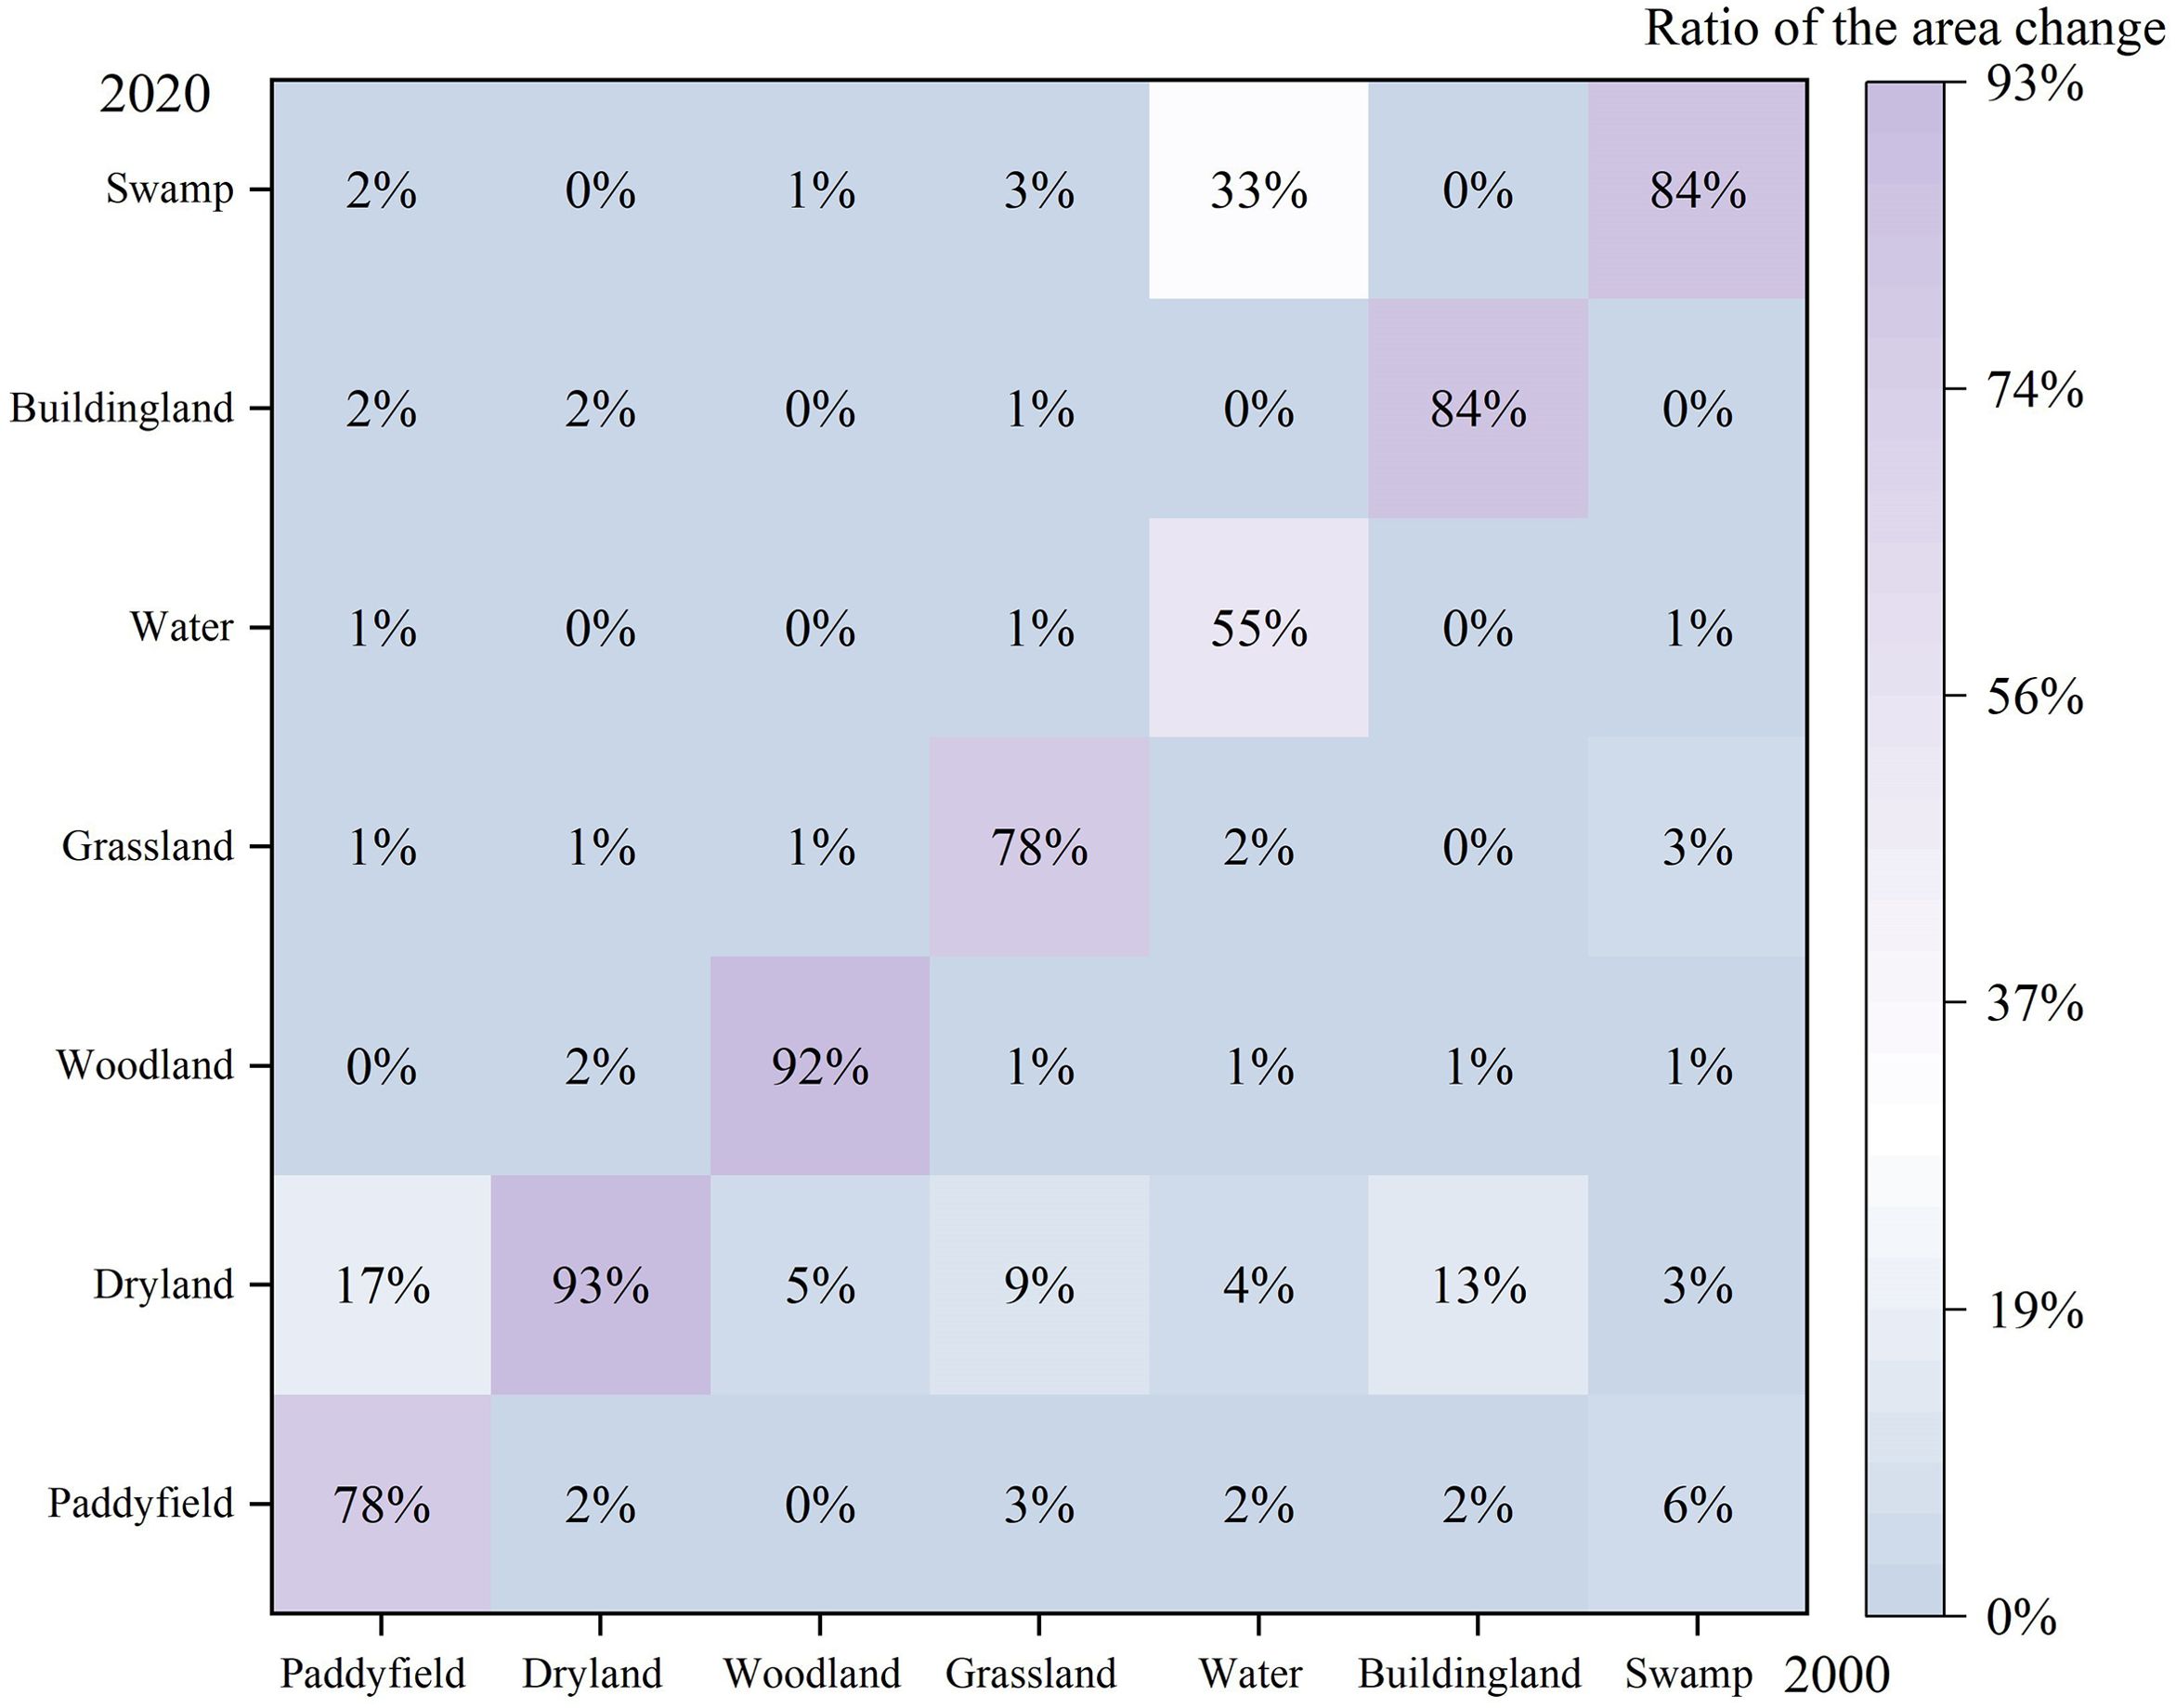
In the six periods of 2000, 2005, 2010, 2015, 2018, and 2020, land use type with the largest area percentage in the Songnen Plain was arable land, followed by woodland (Table 3). Arable land was mainly concentrated in the central and western parts, while woodland was in the mountainous and hilly areas in the eastern part (Figure 3). During 2000–2018 (Table 3), the arable land dominating the Songnen Plain gradually increased in size from 59.10% to 61.68%. In particular, paddy land increased from 6.43% in 2000 to 8.59% in 2018, and dry farmland increased from 52.67% in 2000 to 53.09% in 2018. The percentage of forested land decreased from 12.14% to 11.88%. Grasslands, swamps and waters had also decreased gradually. During the period 2018–2020, the area of arable land decreased by 1.78%, the area of woodland increased from 11.88% to 12.3%, and the area of grassland and swamps also increases to 7.42%. The area of building land was reduced to 4.9%. The transformation matrix (Figure 4) showed that during the period 2000–2020, the most obvious change in paddy land was the conversion to dry farmland with a conversion rate of 17%, followed by the conversion to building land, with a conversion rate of 2%. The largest change was from woodland to dry farmland, with a conversion rate of 5%. Grasslands and swamps were also converted mainly to dry farmland, with conversion rates of 9% and 3%. Overall, land-use change in 2000–2020 was characterized by a continuous conversion of woodland, grassland and swamp to arable land.
3.2 Changes in habitat quality
3.2.1 Changes in habitat quality pattern
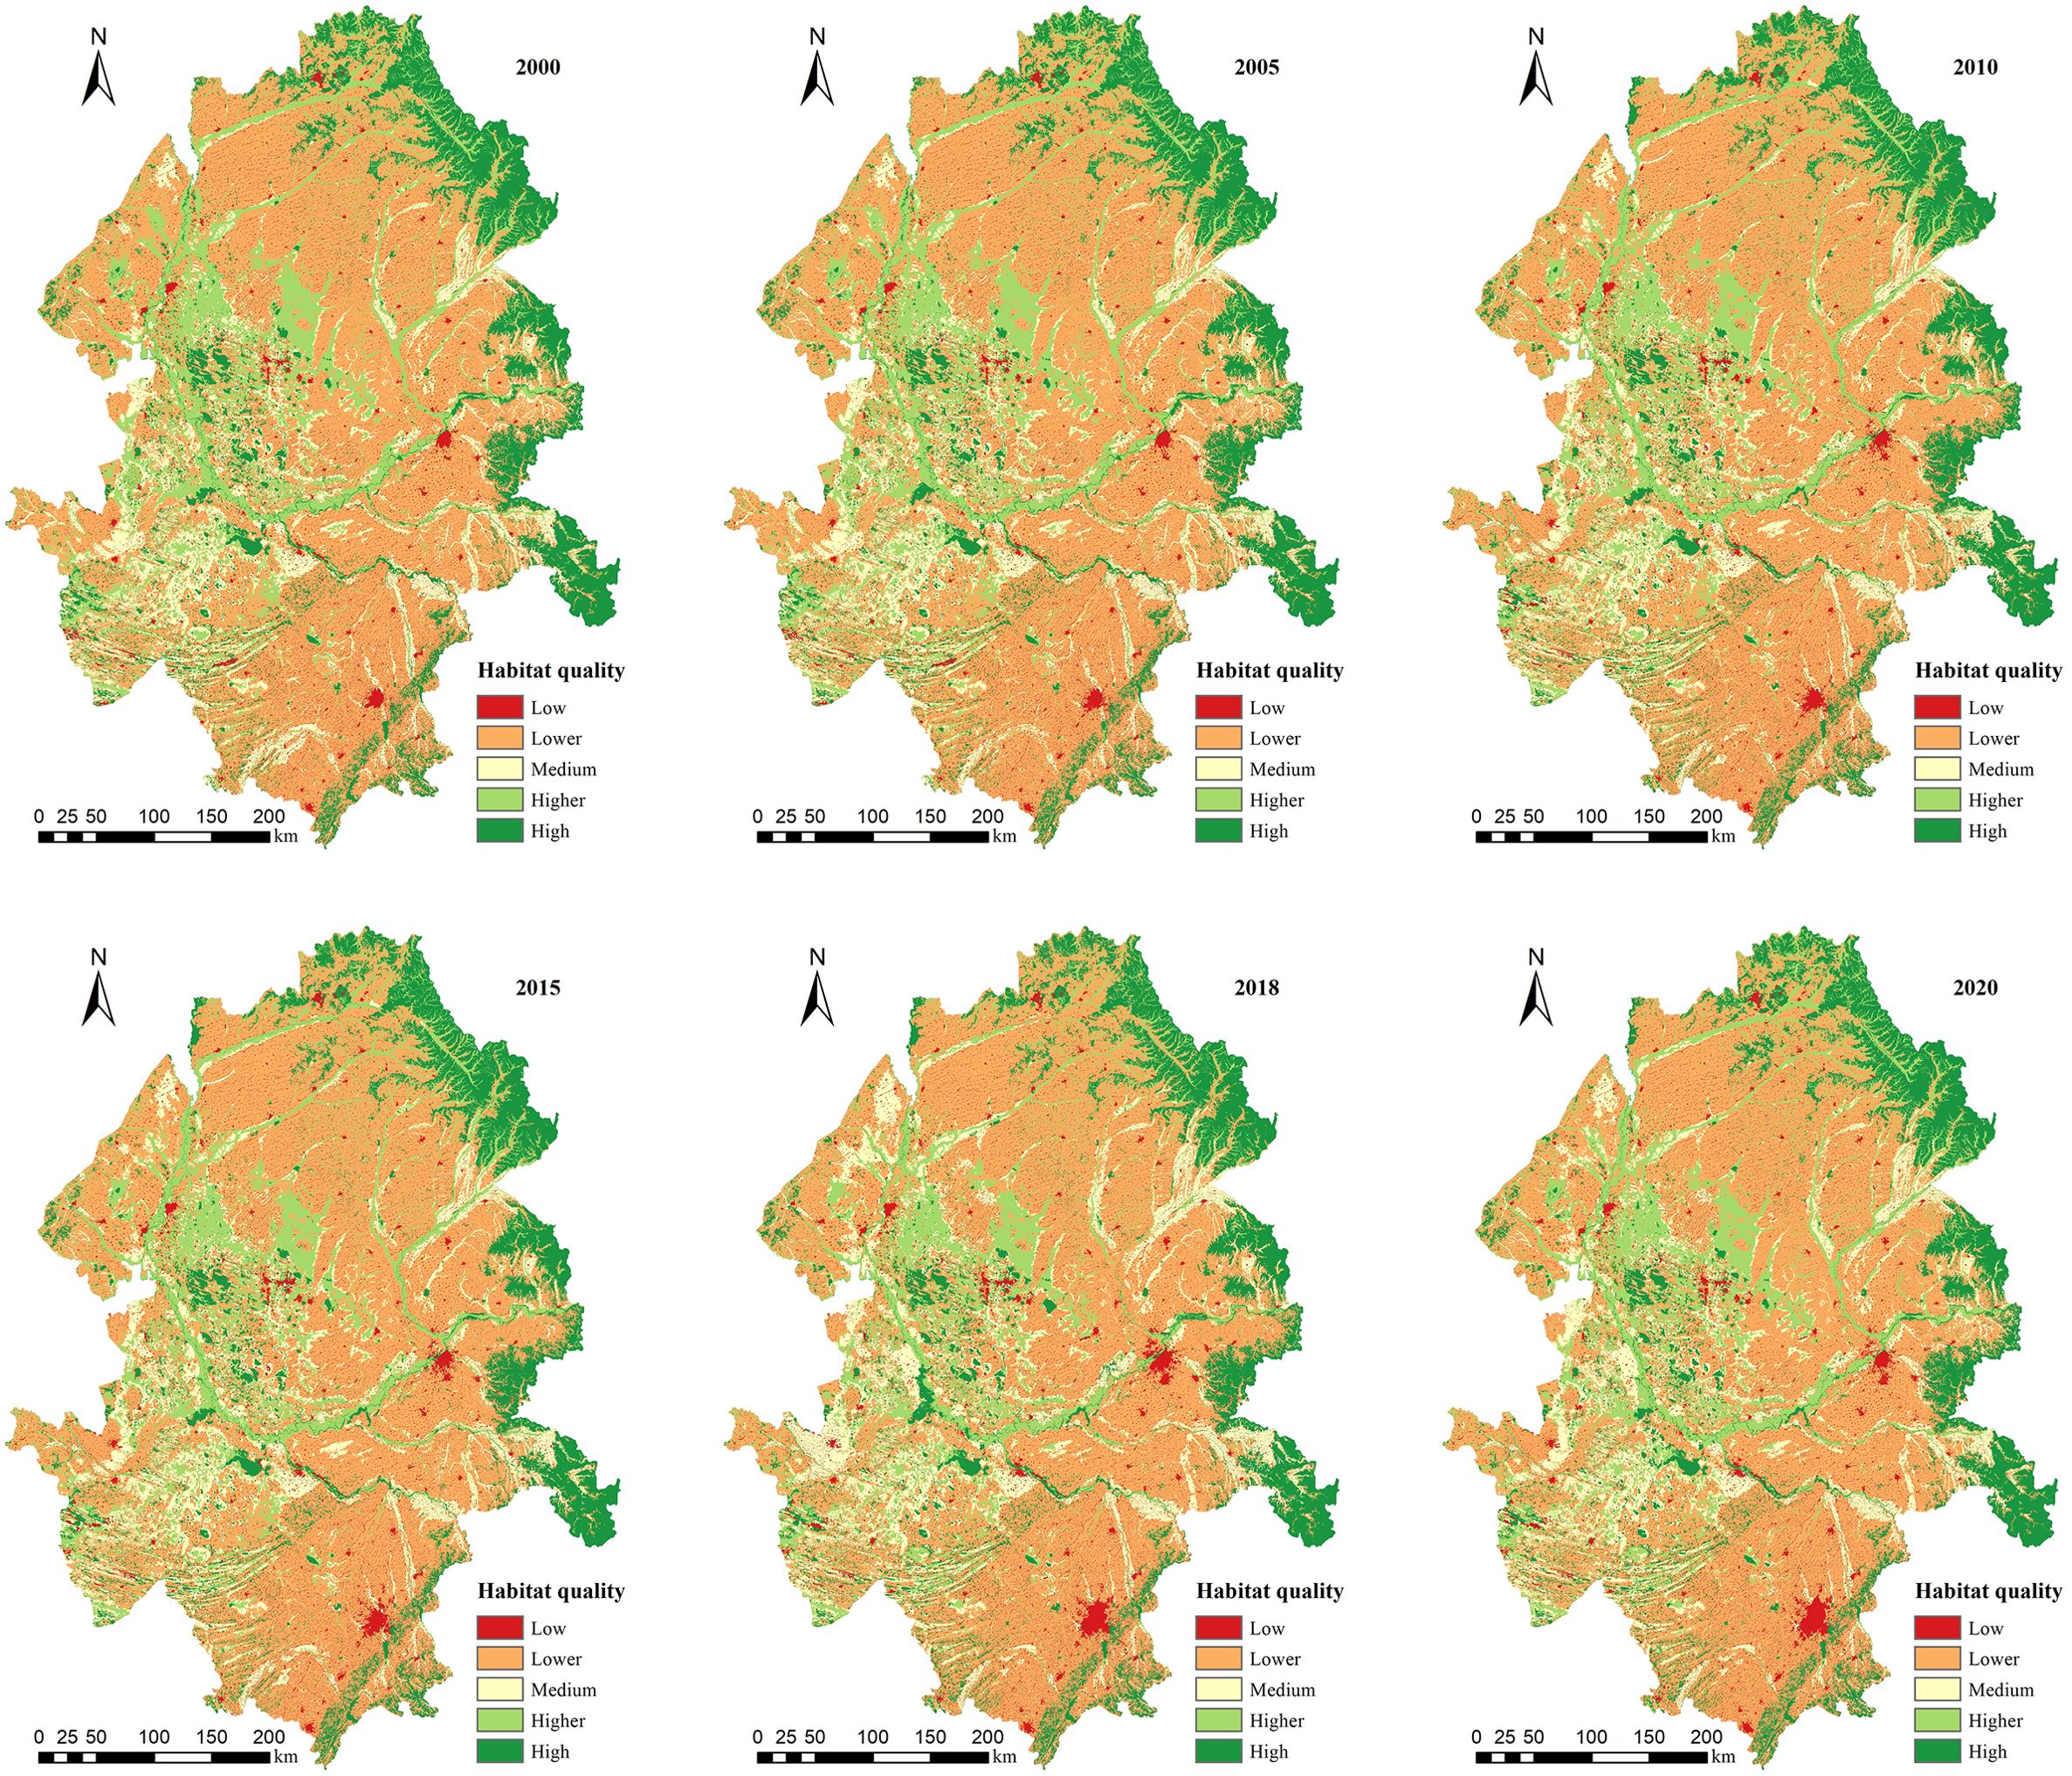
The results of the InVEST model showed that the overall level of HQ was lower in all six periods (Figure 5). Meanwhile, the spatial patterns of HQ were highly heterogeneous, as indicated by the trend of ‘high HQ in the east – low HQ in the center – high HQ in the west’. Areas of high HQ were concentrated along the eastern edge and scattered in small patches in the center. These highest-value areas mainly fall in ecological lands with high vegetation cover, rich biodiversity and less human activities, such as woodlands and swamps. The lower HQ areas were mainly located in the central farmland areas with intensive agricultural activity. The lowest HQ areas were concentrated in these middle areas which are densely populated and highly industrialized, leading to more fragile ecological environments.
The average values of HQ index of Songnen Plain in 2000, 2005, 2008, 2010, 2015, 2018 and 2020 were 0.534, 0.532, 0.532, 0.528, 0.527, 0.52 and 0.530, respectively. HQ showed a strong continuous downward trend due to the obvious expansion of arable land and building land during 2000–2018 and appeared to improve after 2018.
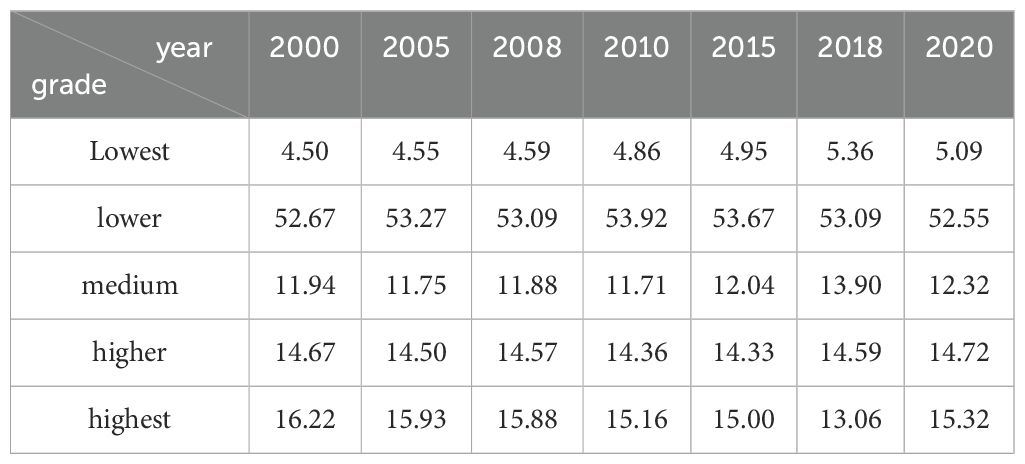
Table 4 showed that more than 50% of the area in the Songnen Plain had lower HQ in all six periods. The percentage of the lowest-grade HQ area gradually increased from 4.50% to 5.36% and the lower-grade HQ area increased from 52.67% to 53.92% during 2000–2018. The percentage of the highest-grade HQ area decreased, with the percentage of the highest-grade area decreasing from 16.22% to 15.00% and the percentage of the higher-grade area decreasing from 14.67% to 14.59%. The expansion of lowest and lower HQ areas and the contraction of the high and higher HQ areas indicated a decrease in HQ and gradual ecological degradation. During 2018–2020, HQ improved, with the percentage of the highest-grade area increasing to 15.32% and the percentage of the higher-grade area increasing to 14.72%. This positive trend in HQ illustrated that the ecological environment of the Songnen Plain has improved significantly in recent years.
3.2.2 Changes in hotspot pattern of habitat quality
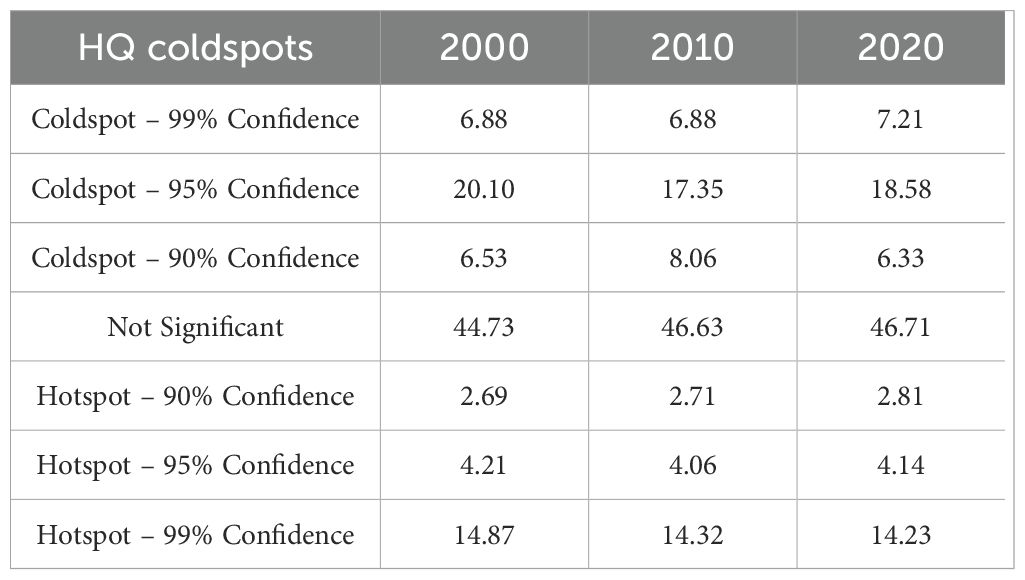
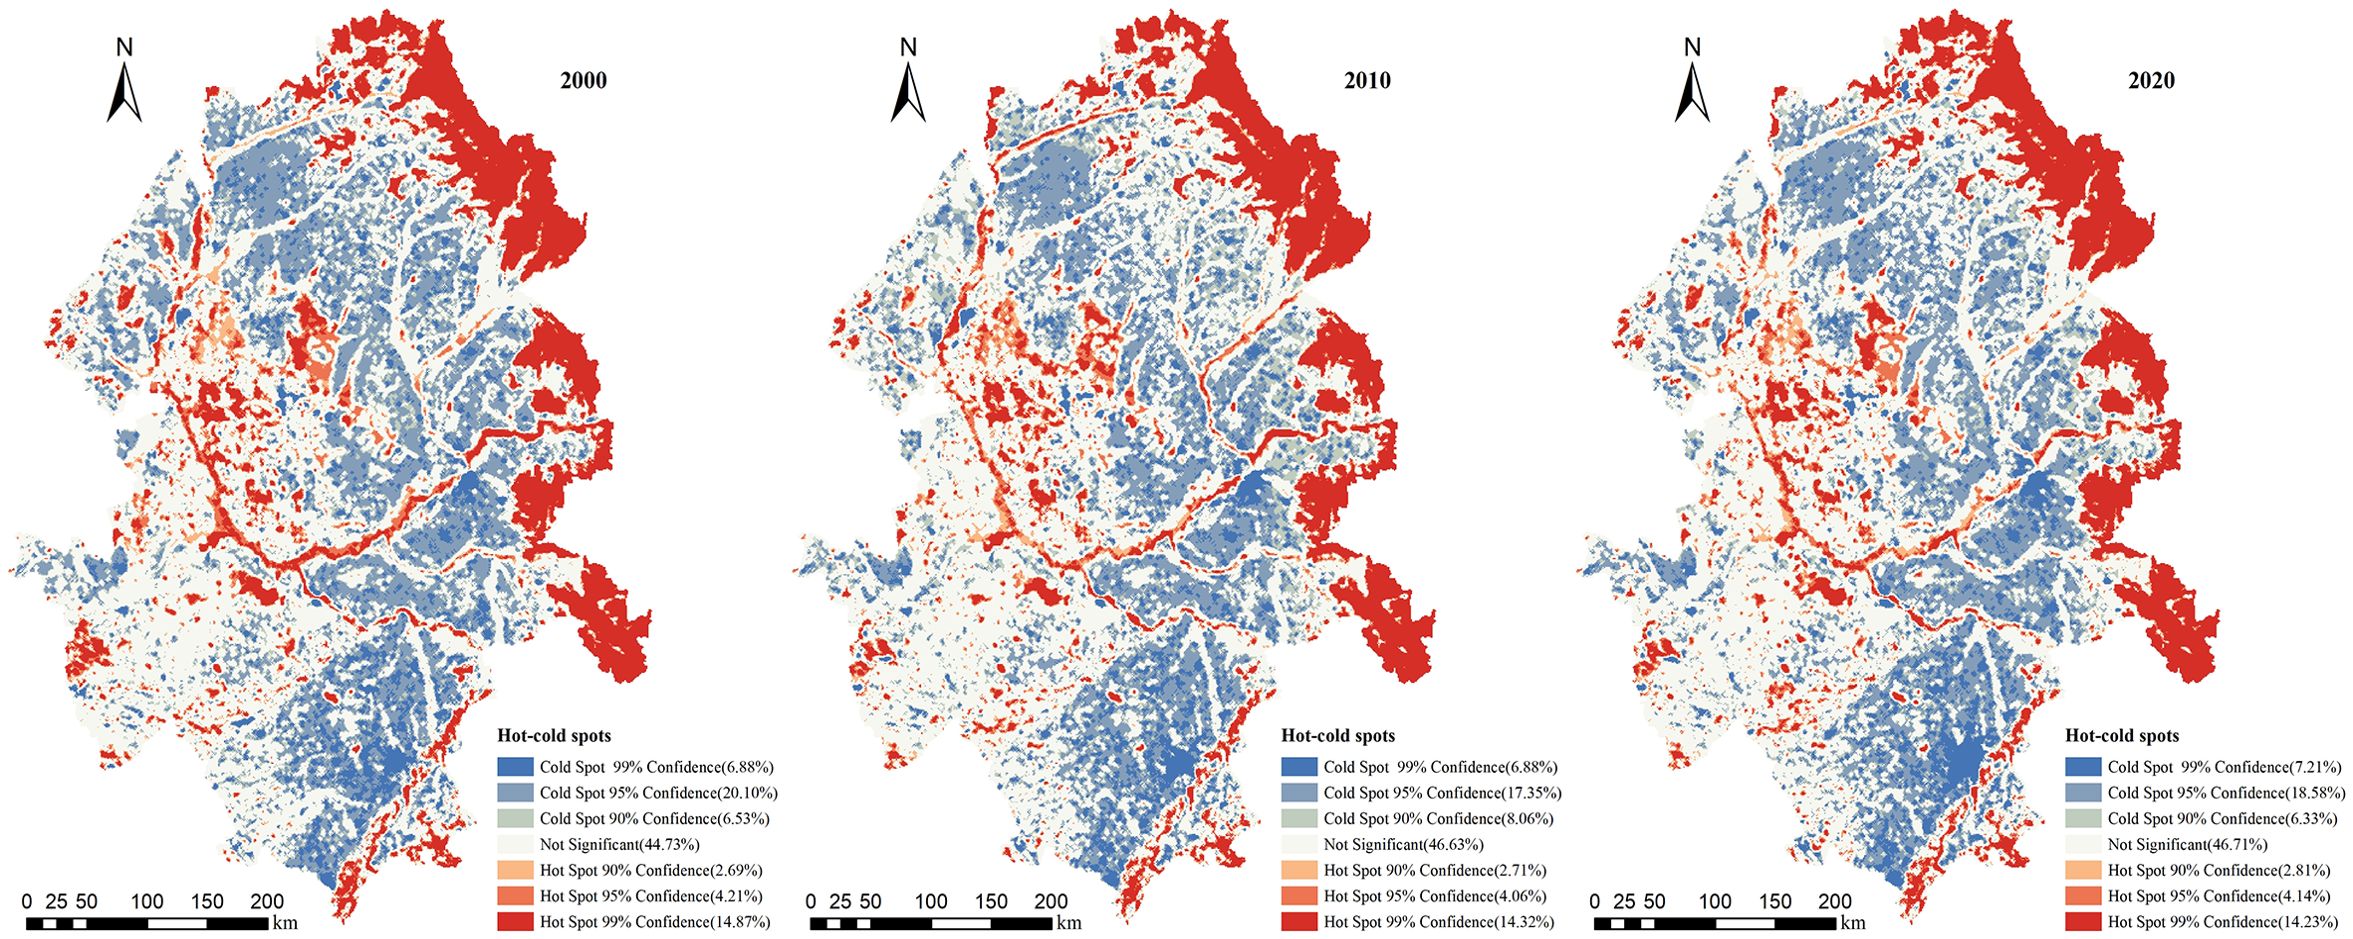
The Moran’s I of HQ in the Songnen Plain in 2000, 2010, and 2020 were all greater than 0, indicating a certain degree of spatial clustering distribution of HQ. The values of Moran’s I in 2000, 2010, and 2020 were 0.516, 0.507. and 0.508, respectively, showing a slight decrease followed by an increase in spatial clustering of HQ. Table 5 showed a decreasing trend in hotspot areas and an increasing trend in coldspot areas in the Songnen Plain from 2000 to 2020. The hotspot analyses of Getis-Ord G* (Figure 6) revealed that the spatial distribution of high and low HQ values remained relatively consistent from 2000 to 2020. The hotspots areas were largely located in the eastern part of the Songnen Plain, which was characterized by high elevation, dense vegetation cover, and good HQ. Hotspots were also found in the vicinity of Songhua River, Nenjiang River and other rivers, where there was less human disturbance occurred. Coldspot areas were mainly distributed in the central area of Songnen Plain. Building land and arable land were the main land use types in the central area which were greatly affected by human activities.
3.2.3 Degradation of habitat quality
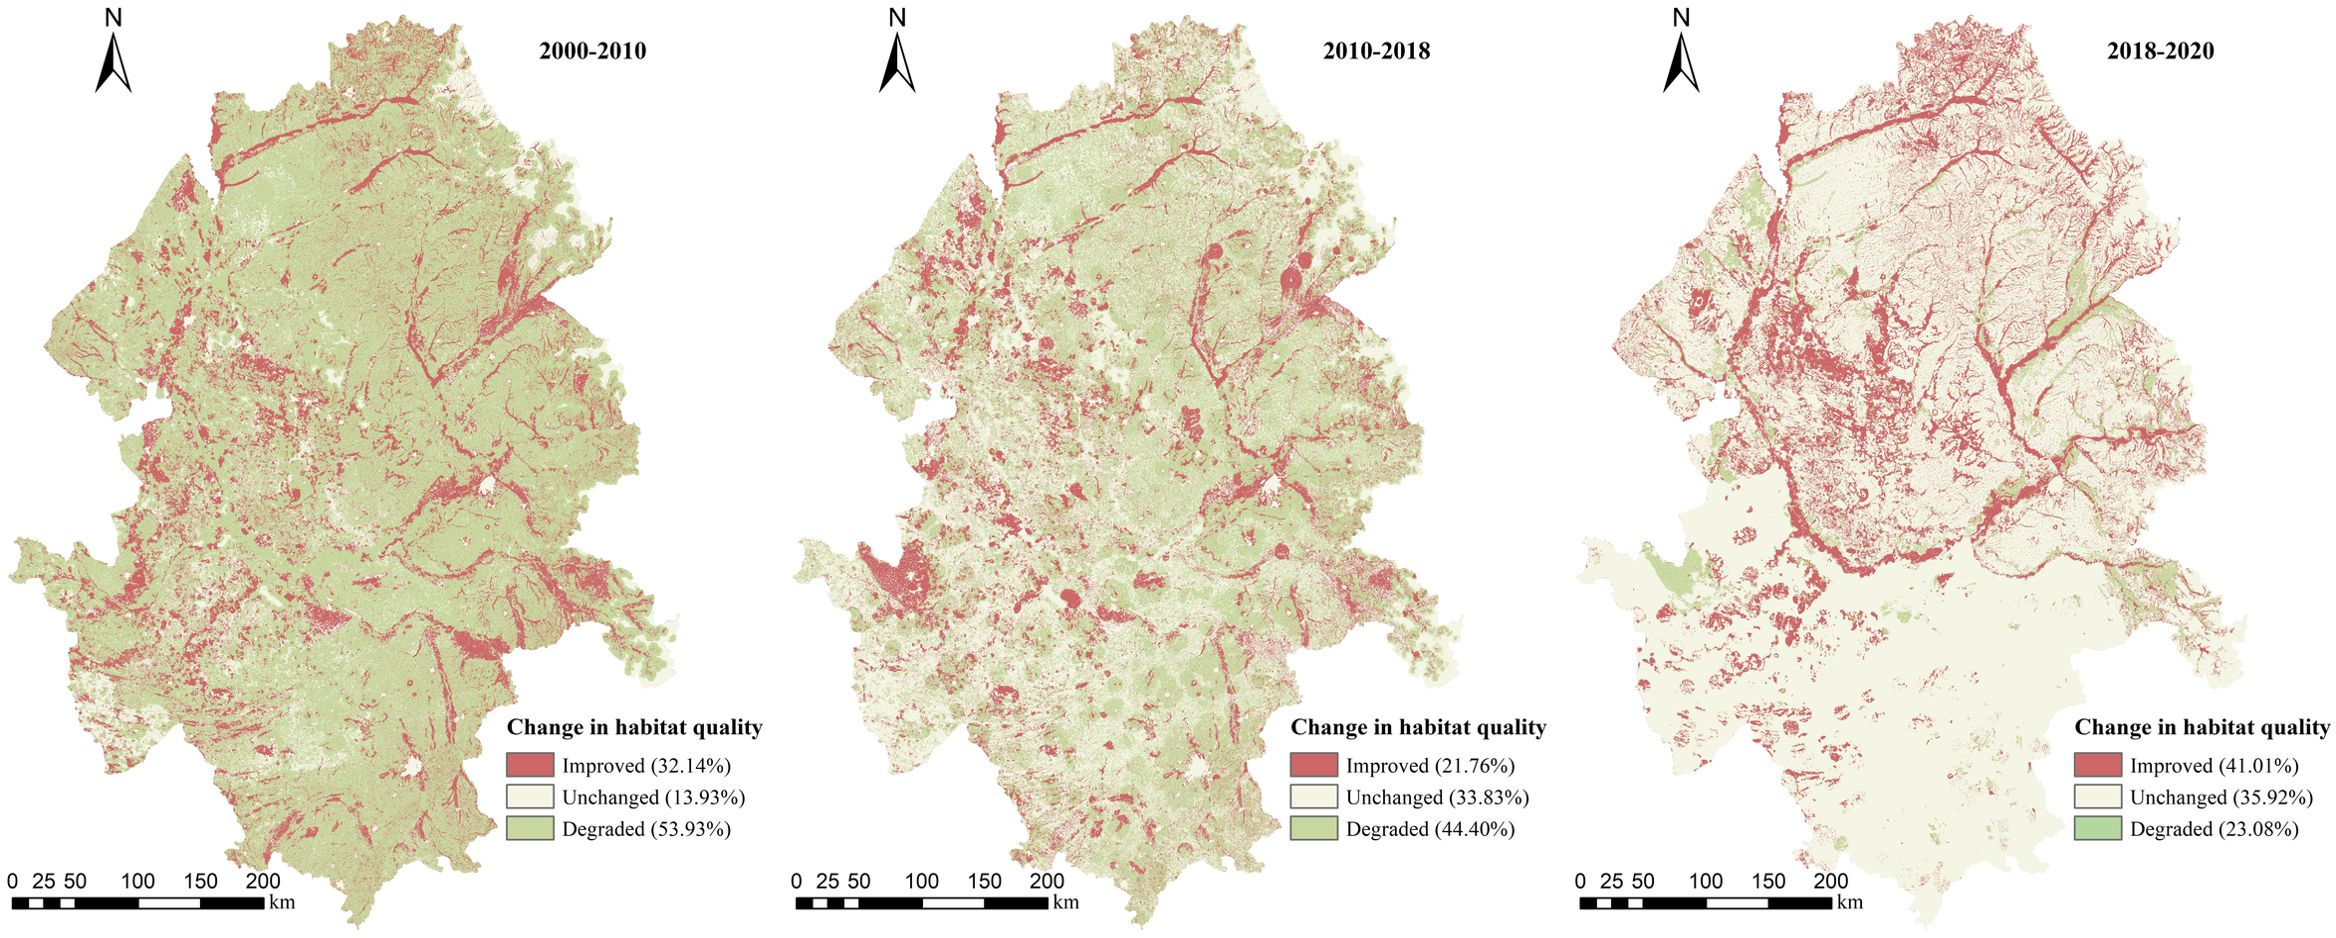
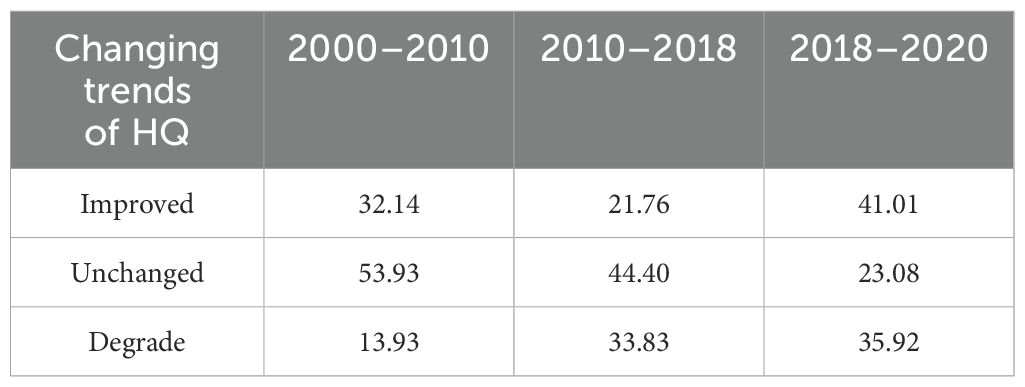
The distribution of habitat quality changes is shown in Figure 7. From 2000 to 2010, the percentage of degraded HQ areas in the Songnen Plain was as high as 53.93% (Table 6), and these areas were widely distributed. During this period, particularly from 2005 to 2010, the implementation of the Northeast Revitalization Strategy led to rapid economic development. Consequently, HQ degraded due to frequent industrial and agricultural activities. From 2010 to 2018, the degraded areas still dominated with 44.40% but showed a slight decrease compared to the period from 2000 to 2010. The area with unchanged HQ increased accounted for 33.83% (Table 6), indicating the implementation of policies considering both economic development and environmental protection. In 2018–2020, the areas with improved HQ were widely distributed, reaching up to 41.01% of Songnen plain. The percentage of degraded areas decreased to 23.08%, demonstrating that ecological environment protection and restoration practices progressively enhanced the habitat quality.
3.3 Impacts of influencing factors on habitat quality
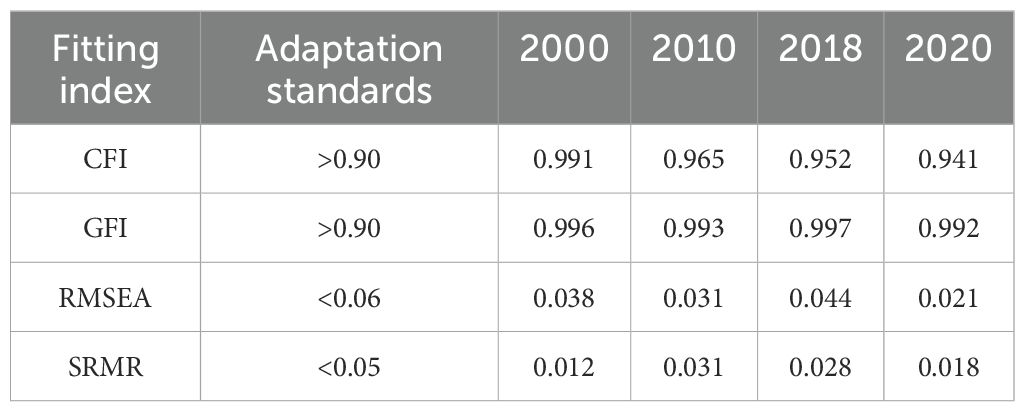
The SEM model of HQ influencing factors in the Songnen Plain met the required goodness-of-fit indicators (Table 7), 2000 (CFI=0.99, GFI=0.996,RMSEA=0.038,SRMR=0.012), 2010 (CFI=0.965, GFI=0.993,RMSEA=0.031,SRMR=0.031), 2018 (CFI=0.952, GFI=0.997,RMSEA= 0.044,SRMR=0.028), and 2020 (CFI=0.941, GFI=0.992,RMSEA=0.021,SRMR=0.018), indicating that fitness met the requirements.
SEM of HQ influencing factors (Figure 8) showed that in 2000 (Figure 8A), climate, topography, NDVI, and human disturbance combined to influence HQ. Climate had a strong direct positive influence on HQ with a coefficient of 0.21(r=0.21). Specifically, temperature had a negative effect on HQ, while precipitation had a positive effect, indicating that lower temperature, or higher precipitation produced higher HQ. NDVI had a small positive effect on HQ with a coefficient of 0.09. Topography also had an important effect on HQ in three pathways: 1) directly affecting HQ with an impact coefficient of 0.03, 2) indirectly affecting HQ through NDVI with an impact coefficient of 0.069, and 3) indirectly positively affecting HQ through limiting human disturbances with an impact coefficient of 0.002. The total effect of topography on HQ was 0.1. Human disturbance had a negative impact on HQ with an overall impact coefficient of −0.13. This included a direct effect (r=−0.12) and an indirect effect by influencing NDVI (r=−0.01).
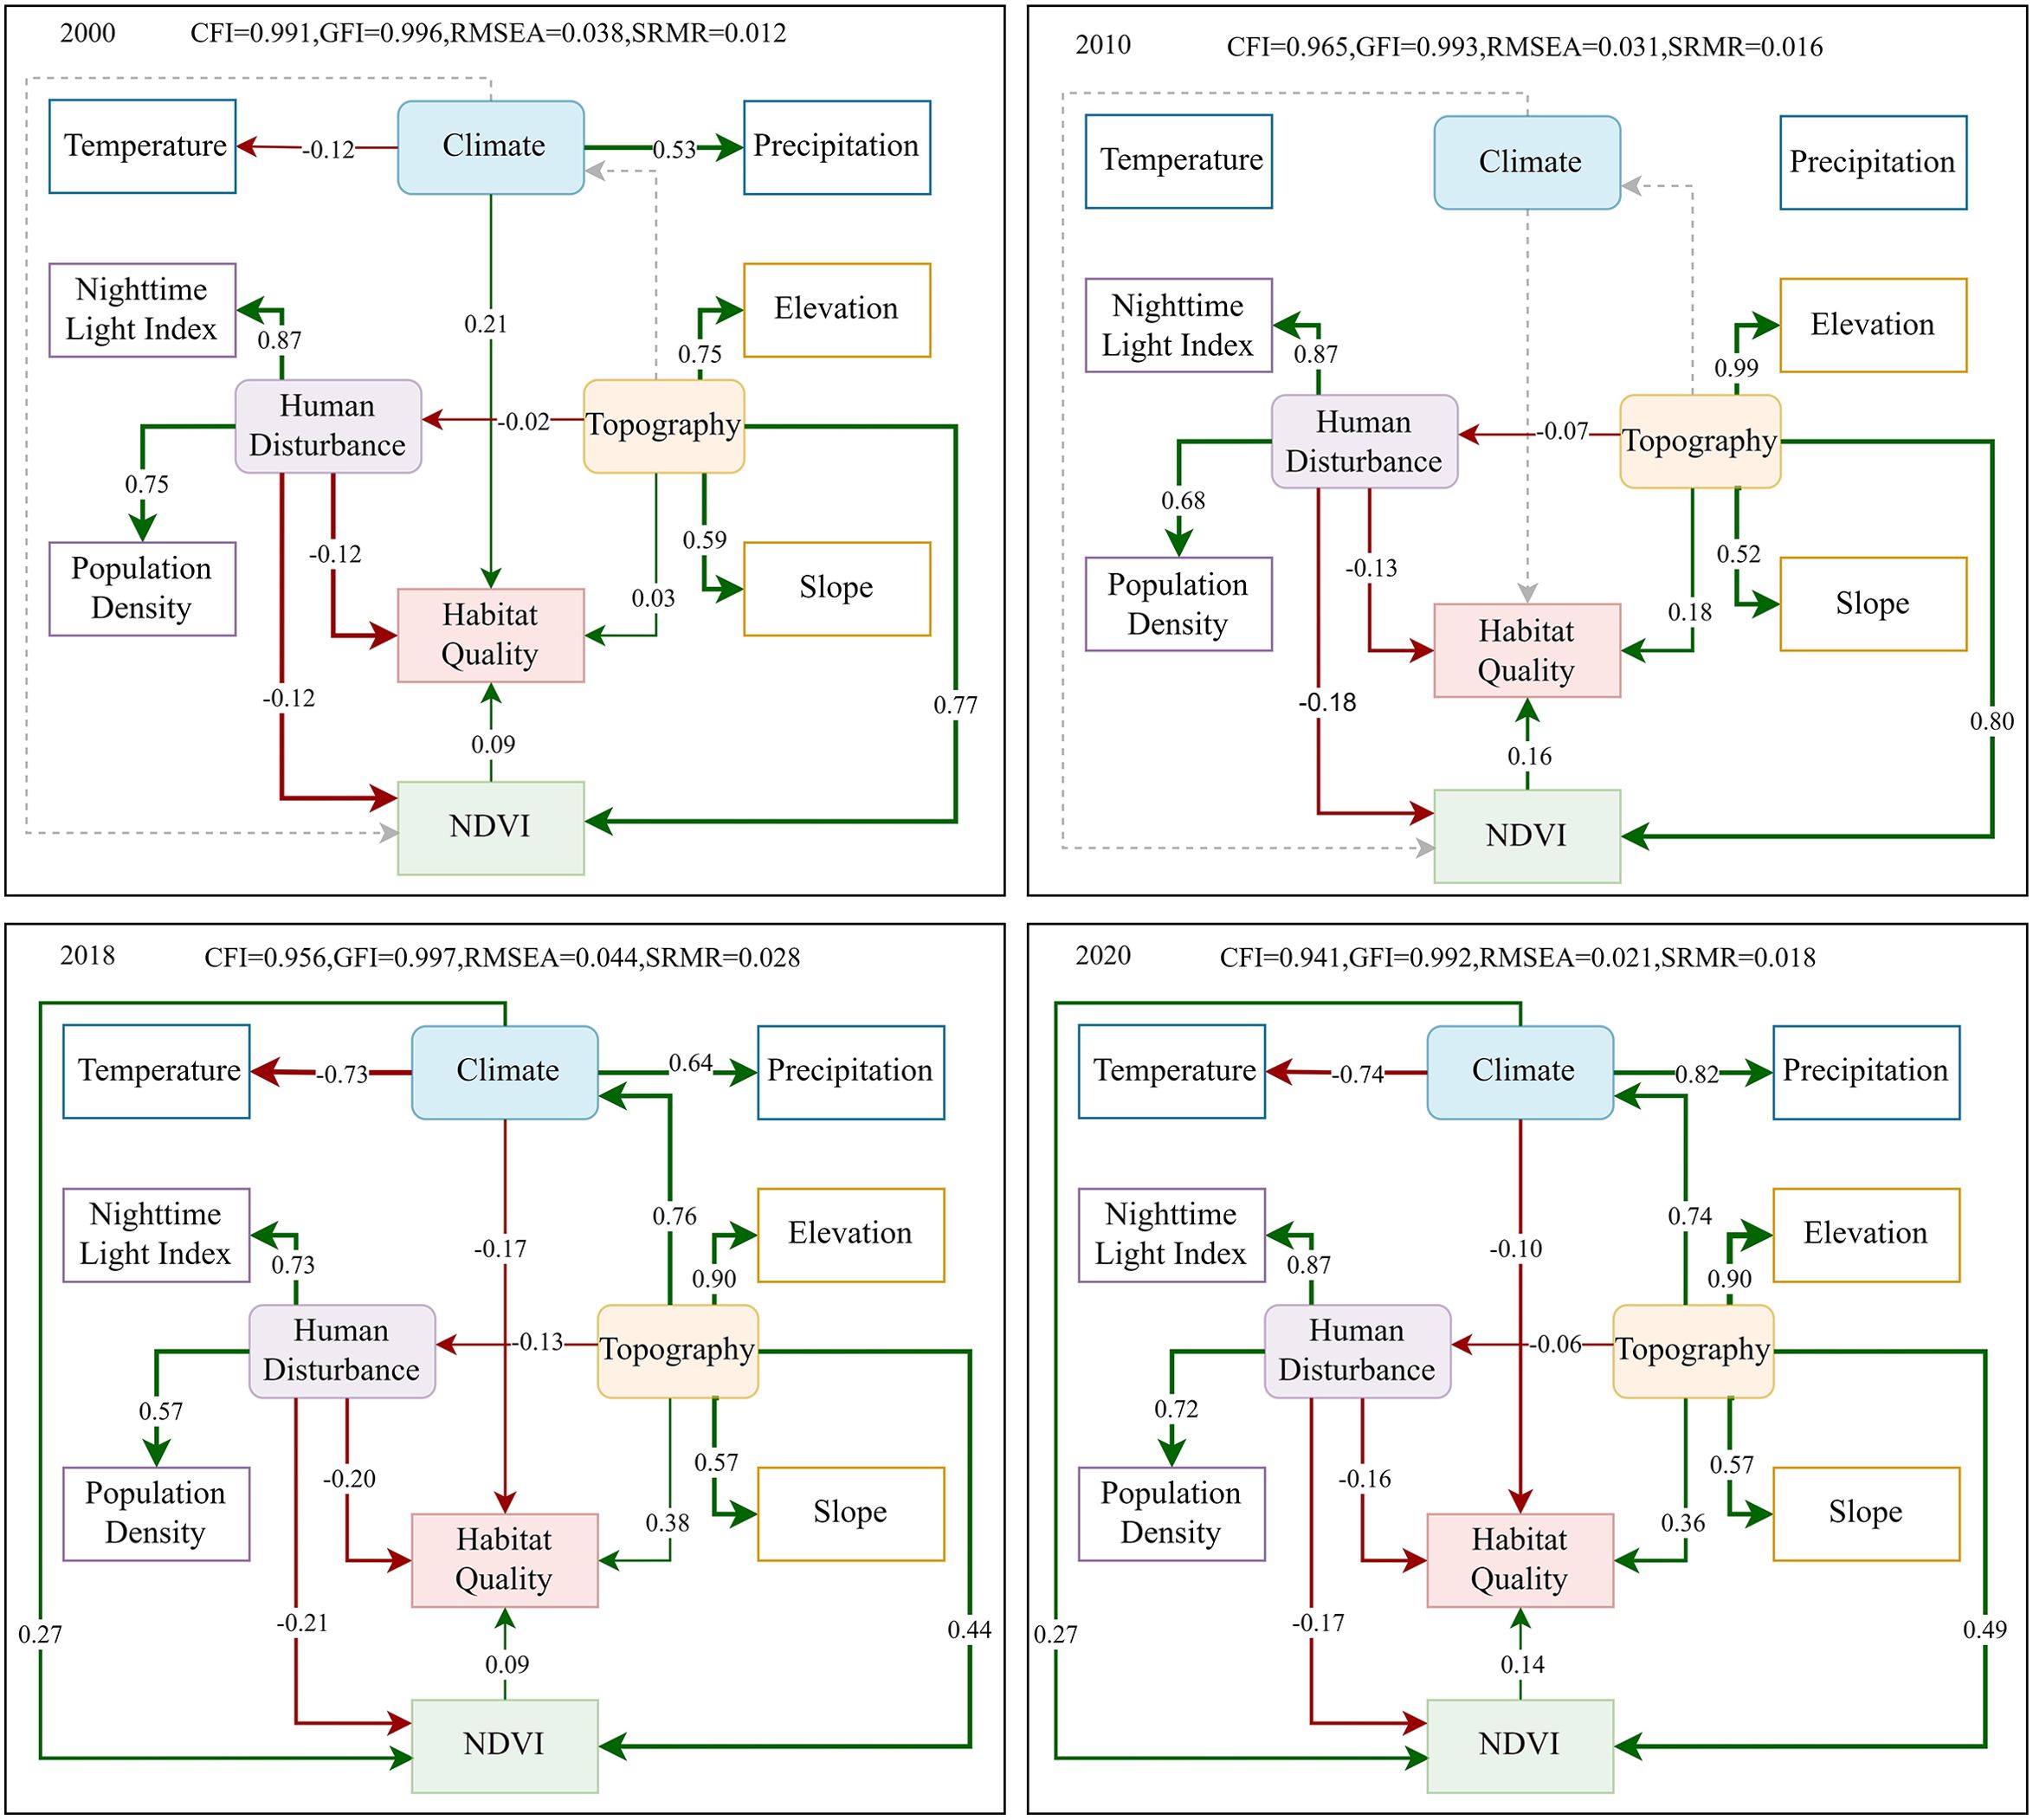
Figure 8. Structural equation model for the comprehensive effect of influencing factors on HQ. Green lines indicate positive impacts; red lines indicate negative impacts; solid lines indicate paths that passed the significance test (p<0.05); dashed lines indicate paths that are not significant; line widths indicate impact size
In 2010 SEM (Figure 8B), there was no pathway between climate factors and HQ, indicating that climate did not have a significant effect on HQ. Topography was the most important driver of HQ, with a total effect coefficient of 0.32. This included a positive direct effect (r = 0.18), as well as indirect effects through influencing NDVI (r = 0.13) and indirect effects through influencing human disturbance (r = 0.01). The total impacts of human disturbance on HQ were negative, including negative direct impacts (r=−0.13) and negative indirect impacts through NDVI (r=0.03). The total impact coefficient was -0.16, larger than 0.03 compared to 2000 (r=−0.13).
The 2018 SEM showed (Figure 8C) that topographic factors, as the strongest factor, had a strong overall positive effect (r=0.32), including a positive direct effect (r=0.38), a positive indirect effect through NDVI and human disturbance (r=0.07), and a negative indirect effect through climate (r=−0.13). The positive effect of topography on NDVI (r=0.44) indicated that areas with higher elevations and greater slopes had higher NDVI and tended to have higher HQ. Topography had a negative effect on human disturbance (r=−0.13), suggesting that areas with low elevation, low slope, and low topographic relief consisted of large urban area and more human activity. Human disturbance had the strongest negative effect on HQ, with a total impact coefficient of −0.23, including a strong negative direct effect on HQ (r=−0.20) and a negative indirect effect through NDVI (r=−0.03). Climate impacts on HQ were negative with a total impact coefficient of −0.15, including negative direct impacts with an impact coefficient of −0.17, and positive indirect impacts through NDVI (r=0.02).
The 2020 SEM showed (Figure 8D) that topography continued to be the strongest influence on HQ, with a total effect coefficient of 0.36. Topography had a very strong positive direct effect on HQ, with an effect coefficient of 0.36. Topography also had a positive indirect effect on HQ through its influence on NDVI and human disturbance (r=0.07), and a negative indirect effect on HQ through its influence on air temperature (r=−0.07). Human disturbance appeared to have the strongest negative influence on HQ, with an overall impact coefficient of −0.18, consisting of a strong negative direct effect on HQ (r=−0.16) and a weak negative indirect effect through NDVI (r=−0.02). Climate had a negative impact on HQ with a total impact coefficient of −0.12. This included a direct impact coefficient of −0.1 and an indirect impact coefficient of −0.02. Temperature had a positive impact on HQ, while precipitation had a negative impact. NDVI effected HQ with the coefficient of 0.14.
4 Discussion
4.1 Changes in habitat quality
The HQ of the Songnen Plain from 2000 to 2020 was low, which indicated the fragility of the ecological environment. Our results are exactly supported by Chen et al (Chen et al., 2020) and Yang who found that HQ was lower in the Songnen Plain during this period (Yang et al., 2021). Our study also found that the distribution of HQ in the Songnen Plain was spatially heterogeneous, showing a ‘high-low-higher’ pattern from east to west. In the eastern part of the region, large-area woodland, rich biodiversity, and minimal human disturbance resulted in relatively high HQ. In the flooded central and western regions, original land use types such as swamps and grasslands have been exploited by human activities to meet the demands of social development, resulting in low HQ. Our results indicated that the average value of HQ in the Songnen Plain generally decreased from 2000 to 2018 but increased from 2018 to 2020, which is similar to the trend in other studies. For example, Dai et al. found that HQ decreased due to landscape fragmentation in Northeast China from 1990 to 2010 (Dai et al., 2018). Chen et al. found that the HQ of Heilongjiang and Jilin provinces was lower in 2020 than in 2010 (Chen et al., 2023a).
Our study found that the area of lowest-grade and lower-grade HQ in the Songnen Plain continued to expand, while the area of highest-grade and higher-grade HQ decreased between 2000 and 2018, which is consistent with other existing findings (Chi et al., 2023; Li et al., 2023a). During this period, the Songnen Plain, as an important commercial grain base in China, was largely reclaimed from ecologically functional land use including grasslands and wetlands, to farmland to meet the growing demand for food. Although the implementation of ecological projects such as ‘Grain for Green’ maintained the HQ to some extent, these reclamation practices aimed at short-term economic benefits led to the degradation of the HQ in less economically developed areas (Wang et al., 2015; Jin et al., 2022).
Our study showed that during 2018–2020, the area of high-grade HQ increased to 15.32% and the area of higher-grade HQ increased to 14.72%, illustrating an upward trend in HQ. This was partly due to the restoration of damaged ecosystems as a result of the enforcement of environmental protection and restoration policies (Jasperson et al., 2018; Mao et al., 2021). That is, the national government has implemented several ecological conservation policies, such as the Natural Forest Conservation Project, the Grain to Green Project, and the Land Salinity/Sodicity Amelioration Project since 2000, and also proposed the goal of “accelerating the progress of ecological civilization” in 2015, which ultimately reversed the trend of habitat quality degradation around 2018 (Zedler, 2003). Through scientific and rational management, and the implementation of ecological protection policies, damaged ecosystems have been restored, leading to a significant improvement in habitat quality. Similarly, previous studies have shown that ecological protection projects and ecological restoration projects, such as the establishment of efficient ecological economic zones and ecological counties, have restored ecosystems to some extent and slowed down the decline of habitat quality (Sun et al., 2022; Zheng et al., 2022).
4.2 Impacts of influencing factors on habitat quality
The 2000 SEM showed that climate had the greatest influence on HQ, with temperature having a negative effect and precipitation having a positive effect. Since 1980, the annual temperature in the Songnen Plain had increased at a rate of more than 0.44°C per decade (Wang et al., 2011), which was found to cause the loss of swamp and grassland areas and subsequently the decrease in HQ (Wang et al., 2009b). In addition, Yang et al. found that Northeast China experienced eight months of severe drought from 2000 to 2001 (Yang et al., 2023a). During the drought period, a small amount of precipitation could promote HQ (Liu et al., 2023), illustrating the significant influence of precipitation, which supported our findings. Precipitation affects vegetation growth and distribution by influencing soil moisture and vegetation sensitivity to temperature, which in turn impacts habitat quality (Du et al., 2019). The effects of temperature and precipitation on HQ varied across years. There was a negative effect of temperature and a positive effect of precipitation in 2000, while, the directions of these effects were completely reversed in 2018 and 2020. Zheng and Li showed that the Songnen Plain experienced a wet period from 2018 to 2020 with a maximus number of extreme rainfall events in 2019 (Zheng and Li, 2022). Excessive precipitation in this wet year exacerbated soil erosion, negatively impacting HQ (Liu et al., 2022). In addition, our results indicated that precipitation and temperature affect HQ with varying intensities. That is, intensity of the positive impact of precipitation was higher than that of the negative impact of temperature in 2000, the intensity of the positive impact of temperature outweighed that of the negative impact of precipitation in 2018, and the intensity of the negative impact of precipitation was higher than the intensity of the negative impact of temperature in 2020. However, some studies demonstrated that precipitation had a greater influence on HQ than temperature (Fritz et al., 2018). This different conclusion from ours could be attributed to the different ecological spatiotemporal characteristics between the study areas.
Our study found that topography significantly influences HQ in the SEM during four years: 2000, 2010, 2018, and 2020, which is supported by some previous research indicating that HQ varies across topographies (Feng and Lei, 2023; Li et al., 2023a, b). HQ was higher in mountainous regions where forests were well-preserved, while HQ was lower in both hilly areas with intense agricultural activities and in plains with high population (Feng and Lei, 2023; Li et al., 2023a, b). In addition, we found that topography indirectly impacts HQ. Previous studies had shown that topography affect HQ by influencing climate, NDVI, and human activities to varying extents (Chen et al., 2023b; Shi et al., 2023b). For instance, Yang et al. reported that elevation and slope direction influence temperature and precipitation, finally determining forest distribution in the Qilian Mountains of northwestern China (Yang et al., 2018). Liu et al. demonstrated that elevation affects NDVI averages, and impacted vegetation distribution (Liu et al., 2021a). Chen et al. showed that lower- and mid-elevation areas were more vulnerable to human disturbance (Chen et al., 2023b). All of these studies highlighted the significant impact of topography on HQ (Xiao et al., 2022).
Our results showed that human activities involving nighttime light and population had the strongest negative impact on regional HQ. Nighttime light intensity and population density were found to reflect urban expansion and industrial agricultural activities. Other studies had found that human disturbance significantly affects HQ, e.g. Bai et al. found that human disturbance exacerbated the degradation of HQ in Changchun City (Bai et al., 2019), and Zhao et al. found a significant positive correlation between the intensity of human activities and HQ (Zhao et al., 2022c). Our study also showed that human disturbance had a negative effect on NDVI. Zhou et al. studied the historical dynamics of vegetation in China and found that human activities affected NDVI (Zhou et al., 2020). Additionally, our study demonstrated that the use of nighttime light data was a feasible solution to assess the effect of human activities on HQ, which was supported by Zhao et al (Zhao et al., 2022c).
Our results suggest that the overall effect of natural environmental factors on HQ in the Songnen Plain exceeds the total effect of human disturbance, but the effect of human disturbance on habitat quality is greater than that of natural environmental factors in some small areas due to the heterogeneity in landscape characters, and the intensity of the effect of each driver varies over time. Other studies conducted at different temporal and spatial scales have reached similar conclusions in other ecologically fragile areas, e.g., Mengist found that anthropogenic disturbances had affected HQ in a forested biosphere reserve in southwest Ethiopia (Mengist et al., 2021). In another fragile area, Ebinur Lake Basin (Xinjiang Province, China), land use changes reduced by human disturbance were found to affect HQ (Wei et al., 2022). Meanwhile, similar findings have been found in non-fragile. For example, Chen et a concluded that natural environmental factors determine the spatial pattern of HQ in the central region of the Yangtze River Delta (Chen et al., 2023c), and Wu et al. found that HQ was mainly influenced by natural factors in the Guangdong-Hong Kong-Macao Greater Bay Area from 2000 to 2020 (Wu et al., 2024).
4.3 Management implications
In this study, we obtained qualified evidence that the habitat quality in the fragile Songnen Plain is subject to multiple impacts from natural and anthropogenic factors, which has implications for ecological management in this study area and other similar fragile ecological zones. First, the eastern part of the Songnen Plain covered by a large area of forest with high habitat quality should be protected by management practices such as afforestation and fire prevention to maintain the habitat stability quality. Second, ecological projects such as Saline-alkali Land Restoration and Grain for Green need to be continuously implemented to improve the low habitat quality in the central and western parts of the Songnen Plain. Third, SEM results showed that precipitation and temperature have significant effects on habitat quality. To mitigate the negative threats to habitat quality from extreme weather events such as drought and flood, long-term monitoring of climate change, utilization of existing water infrastructure, and improved water management are needed (Sun et al., 2021). Fourth, the negative effects of human activities on habitat quality should not be ignored. In urban and rural development and construction, the landscape pattern can be optimized from an ecological protection perspective (Pu et al., 2024) to improve landscape functions. In sum, all those practices will help to balance economic growth and ecological land demand to improve the habitat quality of the entire region.
5 Conclusions
HQ in the Songnen Plain was low from 2000 to 2020, with significant heterogeneity in spatial distribution. HQ continued to decline from 2000 to 2018, and then recovered slightly from 2018 to 2020. The overall impact of natural factors on HQ in the Songnen Plain was stronger than that of human disturbance, and the intensity of the effects of the natural environment and human disturbance on HQ varied over time. Complex interactions between the natural environment and human disturbance were also important in influencing HQ. Our methodology and results have imporatn implications for ecological conservation in the Songnen Plain and provide insights for studying HO in other regions. Our study highlighted that HQ could be improved by regulating development and management practices, and offered strong evidence for demonstrating relationships between influencing factors and HQ in ecologically fragile areas.
Data availability statement
The original contributions presented in the study are included in the article/supplementary material, further inquiries can be directed to the corresponding authors.
Author contributions
XS: Writing – review & editing, Writing – original draft, Software, Methodology, Data curation, Conceptualization. YHL: Writing – review & editing, Methodology, Conceptualization. YH: Writing – review & editing, Data curation. YL: Writing – review & editing, Conceptualization.
Funding
The author(s) declare financial support was received for the research, authorship, and/or publication of this article. This research was funded by the National Key Research and Development Program of China (2022YFF1300904), the sub-project of the Major Science and Technology Special Projects of Liaoning Province: “Principle and Design of Holistic Restoration of Mountain-Water-Forest-Farmland-Lake-Grassland-Sand” funded by the Department of Science & Technology of Liaoning Province.
Acknowledgments
We would like to express our sincere gratitude to Shengjie Ba and Ying Wang for their contributions to this research.
Conflict of interest
The authors declare that the research was conducted in the absence of any commercial or financial relationships that could be construed as a potential conflict of interest.
Publisher’s note
All claims expressed in this article are solely those of the authors and do not necessarily represent those of their affiliated organizations, or those of the publisher, the editors and the reviewers. Any product that may be evaluated in this article, or claim that may be made by its manufacturer, is not guaranteed or endorsed by the publisher.
References
Alexander, L. C., Fritz, K. M., Schofield, K. A., Autrey, B. C., DeMeester, J. E., Golden, H. E., et al. (2018). Featured collection introduction: connectivity of streams and wetlands to downstream waters. JAWRA J. Am. Water Resour. Assoc. 54, 287–297. doi: 10.1111/1752-1688.12630
Bai, L., Xiu, C., Feng, X., Liu, D. (2019). Influence of urbanization on regional habitat quality:a case study of Changchun City. Habitat Int. 93, 102042. doi: 10.1016/j.habitatint.2019.102042
Chen, C., Liu, J., Bi, L. (2023a). Spatial and temporal changes of habitat quality and its influential factors in China based on the inVEST model. Forests 14, 374. doi: 10.3390/f14020374
Chen, S., Ma, M., Wu, S., Tang, Q., Wen, Z. (2023b). Topography intensifies variations in the effect of human activities on forest NPP across altitude and slope gradients. Environ. Dev. 45. doi: 10.1016/j.envdev.2023.100826
Chen, S., Yunxiang, J., YunLan, H. (2023c). Spatio-temporal variations of habitat quality and its underlying mechanism in the central region of Yangtze River Delta. Chin. J. Ecol. 42, 1175–1185. doi: 10.13292/j.1000-4890.202305.022
Chen, S., Zang, S., Sun, L. (2020). Effects of land use change on habitat quality based on inVEST model: A case of the songnen plain. Chin. Agric. Sci. Bull. 36, 74–80.
Chi, H., Chen, Y., Yang, X., Li, H., Wu, X., Zhou, J., et al. (2023). Spatial-temporal effects of land use and habitat quality in three northeastern provinces. Environ. Sci. Technol. 46, 187–196. doi: 10.19672/j.cnki.1003-6504.0166.23.338
Choudhary, A., Deval, K., Joshi, P. K. (2020). Study of habitat quality assessment using geospatial techniques in Keoladeo National Park, India. Environ. Sci. pollut. Res. 28, 14105–14114. doi: 10.1007/s11356-020-11666-3
Dai, L., Li, S., Lewis, B. J., Wu, J., Yu, D., Zhou, W., et al. (2018). The influence of land use change on the spatial–temporal variability of habitat quality between 1990 and 2010 in Northeast China. J. Forest. Res. 30, 2227–2236. doi: 10.1007/s11676-018-0771-x
Ding, Y., Peng, S. (2020). Spatiotemporal trends and attribution of drought across China from 1901–2100. Sustainability 12, 477. doi: 10.3390/su12020477
Du, J., He, Z., Piatek, K. B., Chen, L., Lin, P., Zhu, X. (2019). Interacting effects of temperature and precipitation on climatic sensitivity of spring vegetation green-up in arid mountains of China. Agric. For. Meteorol. 269-270, 71–77. doi: 10.1016/j.agrformet.2019.02.008
Feng, L., Lei, G. (2023). Study on spatial-temporal evolution characteristics and functional zoning of ecosystem services and trade-offs/synergies relationships in northeastern China. Chin. J. Land Sci. 37, 100–113.
Fritz, K. M., Schofield, K. A., Alexander, L. C., McManus, M. G., Golden, H. E., Lane, C. R., et al. (2018). Physical and chemical connectivity of streams and riparian wetlands to downstream waters: A synthesis. JAWRA J. Am. Water Resour. Assoc. 54, 323–345. doi: 10.1111/1752-1688.12632
Goertz, J. W. (1964). The influence of habitat quality upon density of cotton rat populations. Ecol. Monogr. 34, 359–381. doi: 10.2307/2937068
Grace, J. B., Anderson, T. M., Olff, H., Scheiner, S. M. (2010). On the specification of structural equation models for ecological systems. Ecol. Monogr. 80, 67–87. doi: 10.1890/09-0464.1
Grace, J. B., Anderson, T. M., Seabloom, E. W., Borer, E. T., Adler, P. B., Harpole, W. S., et al. (2016). Integrative modelling reveals mechanisms linking productivity and plant species richness. Nature 529, 390–393. doi: 10.1038/nature16524
He, J., Yang, K., Tang, W., Lu, H., Qin, J., Chen, Y., et al. (2020). The first high-resolution meteorological forcing dataset for land process studies over China. Sci. Data 7, 25. doi: 10.1038/s41597-020-0369-y
Huang, M., Zhang, G., Wang, Q., Yin, Q., Wang, J., Li, W., et al. (2023). Evaluation of typical ecosystem services in Dabie Mountain area and its application in improving residents’ well-being. Front. Plant Sci. 14. doi: 10.3389/fpls.2023.1195644
Jasperson, J. L., Gran, K. B., Magner, J. A. (2018). Seasonal and flood-induced variations in groundwater-surface water exchange in a northern coldwater fishery. JAWRA J. Am. Water Resour. Assoc. 54, 1109–1126. doi: 10.1111/1752-1688.12674
Jin, S., Liu, X., Yang, J., Lv, J., Gu, Y., Yan, J., et al. (2022). Spatial-temporal changes of land use/cover change and habitat quality in Sanjiang plain from 1985 to 2017. Front. Environ. Sci. 10. doi: 10.3389/fenvs.2022.1032584
Jöreskog, K. G. (1970). A GENERAL METHOD FOR ESTIMATING A LINEAR STRUCTURAL EQUATION SYSTEM*. ETS Res. Bull. Ser. 1970, i–41. doi: 10.1002/j.2333-8504.1970.tb00783.x
Lane, C. R., Leibowitz, S. G., Autrey, B. C., LeDuc, S. D., Alexander, L. C. (2018). Hydrological, physical, and chemical functions and connectivity of non-floodplain wetlands to downstream waters: A review. JAWRA J. Am. Water Resour. Assoc. 54, 346–371. doi: 10.1111/1752-1688.12633
Li, T., Bao, R., Li, L., Tang, M., Deng, H. (2023a). Temporal and spatial changes of habitat quality and their potential driving factors in southwest China. Land 12, 346. doi: 10.3390/land12020346
Li, T., Jia, B., Liu, W., Zhang, Q., Jiang, S. (2023b). Spatio-temporal dynamics and influencing factors of ecological security network elements in Yichang. Acta Ecol. Sin. 43, 6154–6169.
Li, Y., Li, J., Chen, H., Wang, Z. (2022). Landscape connectivity evaluation and temporal-spatial characteristics of Guiyang City from 2008 to 2017 based on MSPA and MCR models. Chin. J. Ecol. 41, 1240–1248. doi: 10.13292/j.1000-4890.202206.020
Li, T., Xiong, Q., Luo, P., Zhang, Y., Gu, X., Lin, B. (2019). Direct and indirect effects of environmental factors, spatial constraints, and functional traits on shaping the plant diversity of montane forests. Ecol. Evol. 10, 557–568. doi: 10.1002/ece3.5931
Li, Q., Zhou, Y., Xu, T. (2021). Spatio-temporal changes in wildlife habitat quality in the middle and lower reaches of the Yangtze river from 1980 to 2100 based on the inVEST model. J. Resour. Ecol. 12, 43–55. doi: 10.5814/j.issn.1674-764x.2021.01.005
Liang, X., Yuan, L., Ning, L., Song, C., Cheng, C., Wang, X. (2020). Spatial pattern and influencing factors of habitat quality in Heilongjiang Province based on InVEST model. J. Beijing Normal Univ. (Natural Sci. Edition) 56, 864–872.
Liu, C., Li, W., Wang, W., Zhou, H., Liang, T., Hou, F., et al. (2021a). Quantitative spatial analysis of vegetation dynamics and potential driving factors in a typical alpine region on the northeastern Tibetan Plateau using the Google Earth Engine. Catena 206, 105500. doi: 10.1016/j.catena.2021.105500
Liu, S., Liao, Q., Xiao, M., Zhao, D., Huang, C. (2022). Spatial and temporal variations of habitat quality and its response of landscape dynamic in the three gorges reservoir area, China. Int. J. Environ. Res. Public Health 19, 3594. doi: 10.3390/ijerph19063594
Liu, Y., Wang, Y., Lin, Y., Ma, X., Guo, S., Ouyang, Q., et al. (2023). Habitat quality assessment and driving factors analysis of Guangdong Province, China. Sustainability 15, 11615. doi: 10.3390/su151511615
Liu, C., Xu, Y., Lu, X., Han, J. (2021b). Trade-offs and driving forces of land use functions in ecologically fragile areas of northern Hebei Province: Spatiotemporal analysis. Land Use Policy 104, 105387. doi: 10.1016/j.landusepol.2021.105387
Luo, Y., Fang, S., Wu, H., Zhou, X., He, Z., Gao, L. (2024). Spatial and temporal evolution of habitat quality and its shrinkage effect in shrinking cities: Evidence from Northeast China. Ecol. Indic. 161, 111919. doi: 10.1016/j.ecolind.2024.111919
Lv, X., Xiao, W., Zhao, Y., Zhang, W., Li, S., Sun, H. (2019). Drivers of spatio-temporal ecological vulnerability in an arid, coal mining region in Western China. Ecol. Indic. 106, 105475. doi: 10.1016/j.ecolind.2019.105475
Mao, D., Tian, Y., Wang, Z., Jia, M., Du, J., Song, C. (2021). Wetland changes in the Amur River Basin: Differing trends and proximate causes on the Chinese and Russian sides. J. Environ. Manage. 280, 111670. doi: 10.1016/j.jenvman.2020.111670
Mengist, W., Soromessa, T., Feyisa, G. L. (2021). Landscape change effects on habitat quality in a forest biosphere reserve: Implications for the conservation of native habitats. J. Clean. Prod. 329. doi: 10.1016/j.jclepro.2021.129778
Miguel, M., Catarina, F., Marta, V., Helena, C., Artur, G. (2018). Spatial assessment of habitat conservation status in a Macaronesian island based on the InVEST model: a case study of Pico Island (Azores, Portugal). Land Use Policy 78, 637–649. doi: 10.1016/j.landusepol.2018.07.015
Nguyen, K.-A., Liou, Y.-A. (2019). Global mapping of eco-environmental vulnerability from human and nature disturbances. Sci. Total Environ. 664, 995–1004. doi: 10.1016/j.scitotenv.2019.01.407
Ouyang, Z., Liu, J., Xiao, H., Tan, Y., Zhang, H. (2001). An assessment of giant panda habitat in Wolong Nature Reserve. Acta Ecol. Sin. 11), 1869–1874.
Peng, S. (2020a). 1-km monthly mean temperature dataset for China, (1901-2022) (National Tibetan Plateau Data Center). doi: 10.11888/Meteoro.tpdc.270961
Peng, S. (2020b). 1-km monthly precipitation dataset for China, (1901-2022) (National Tibetan Plateau Data Center). doi: 10.5281/zenodo.3185722
Peng, S., Ding, Y., Liu, W., Li, Z. (2019). 1 km monthly temperature and precipitation dataset for China from 1901 to 2017. Earth Sys. Sci. Data 11, 1931–1946. doi: 10.5194/essd-11-1931-2019
Peng, S., Ding, Y., Wen, Z., Chen, Y., Cao, Y., Ren, J. (2017a). Spatiotemporal change and trend analysis of potential evapotranspiration over the Loess Plateau of China during 2011–2100. Agric. For. Meteorol. 233, 183–194. doi: 10.1016/j.agrformet.2016.11.129
Peng, S., Gang, C., Cao, Y., Chen, Y. (2017b). Assessment of climate change trends over the Loess Plateau in China from 1901 to 2100. Int. J. Climatol. 38, 2250–2264. doi: 10.1002/joc.5331
Prasad, G., Ramesh, M. V. (2018). Spatio-temporal analysis of land use/land cover changes in an ecologically fragile area—Alappuzha district, Southern Kerala, India. Natural Resour. Res. 28, 31–42. doi: 10.1007/s11053-018-9419-y
Pu, J., Shen, A., Liu, C., Wen, B. (2024). Impacts of ecological land fragmentation on habitat quality in the Taihu Lake basin in Jiangsu Province, China. Ecol. Indic. 158, 111611. doi: 10.1016/j.ecolind.2024.111611
Qi, Z., Xu, W., Xiong, X., Ouyang, Z., Zheng, H. (2011). Assessment of potential habitat for Ursus thibetanus in the Qinling Mountains. Biodivers. Sci. 19, 343–352 + 398.
Rahimi, L., Malekmohammadi, B., Yavari, A. R. (2020). Assessing and modeling the impacts of wetland land cover changes on water provision and habitat quality ecosystem services. Natural Resour. Res. 29, 3701–3718. doi: 10.1007/s11053-020-09667-7
Sallustio, L., De Toni, A., Strollo, A., Di Febbraro, M., Gissi, E., Casella, L., et al. (2017). Assessing habitat quality in relation to the spatial distribution of protected areas in Italy. J. Environ. Manage. 201, 129–137. doi: 10.1016/j.jenvman.2017.06.031
Sharafatmandrad, M., Khosravi Mashizi, A. (2023). Exploring the most important indicators for environmental condition assessment using structural equation modeling and InVEST habitat quality model. Environ. Monit. Assess. 195, 232. doi: 10.1007/s10661-022-10825-y
Shi, J., Liang, X., Li, H., Wei, Z. (2023a). Impact of landscape pattern on ecosystem service trade-offs in the Loess Plateau of Northern Shaanxi. Acta Ecol. Sin. 43, 8958–8972. doi: 10.20103/j.stxb.202211053163
Shi, S., Wang, X., Hu, Z., Zhao, X., Zhang, S., Hou, M., et al. (2023b). Geographic detector-based quantitative assessment enhances attribution analysis of climate and topography factors to vegetation variation for spatial heterogeneity and coupling. Global Ecol. Conserv. 42, e02398. doi: 10.1016/j.gecco.2023.e02398
Sun, H., Gong, Q., Liu, Q., Sun, P. (2022). Spatio-temporal evolution of habitat quality based on the land use changes in Shandong province. Chin. Journal ofSoil Sci. 53, 1019–1028. doi: 10.19336/j.cnki.trtb.2021082301
Sun, X., Jiang, Z., Liu, F., Zhang, D. (2019). Monitoring spatio-temporal dynamics of habitat quality in Nansihu Lake basin, eastern China, from 1980 to 2015. Ecol. Indic. 102, 716–723. doi: 10.1016/j.ecolind.2019.03.041
Sun, Y., Liu, S., Liu, Y., Dong, Y., Li, M., An, Y., et al. (2021). Effects of the interaction among climate, terrain and human activities on biodiversity on the Qinghai-Tibet Plateau. Sci. Total Environ. 794, 148497. doi: 10.1016/j.scitotenv.2021.148497
Tang, Y., Shao, Q., Liu, J., Zhang, H., Yang, F., Cao, W., et al. (2019). Did ecological restoration hit its mark? Monitoring and assessing ecological changes in the grain for green program region using multi-source satellite images. Remote Sens. 11, 358. doi: 10.3390/rs11030358
Team, R. C. (2013). R: A language and environment for statistical computing (R Foundation for Statistical Computing). Available at: http://www.R-project.org.
Ti, Y., Zhuang, H., Chen, M., Zhang, C., Hu, F., Zhao, Q., et al. (2023). Spatio-temporal evolution pattern of protected areas and regional habitat quality in Tianjin. Acta Ecol. Sin. 43, 2770–2780.
Wang, Z., Chen, Z., Hao, C. (2009a). Breeding habitat suitability evaluation of red-crown crane in Zhalong national nature reserve by the method of habitat suitability index. WETLAND Sci. 7, 197–201. doi: 10.13248/j.cnki.wetlandsci.2009.03.002
Wang, W., Feng, L., Zheng, T., Liu, Y. (2021b). The sustainability of ecotourism stakeholders in ecologically fragile areas: Implications for cleaner production. J. Clean. Prod. 279. doi: 10.1016/j.jclepro.2020.123606
Wang, Y., Fu, B., Lv, Y., Yang, K., Che, Y. (2016). Assessment of the social values of ecosystem services based on SolVES model: A case study of Wusong PaoTaiwan Wetland Forest Park, Shanghai, China. Chin. J. Appl. Ecol. 27, 1767–1774. doi: 10.13287/j.1001-9332.201606.011
Wang, D., Hao, H., Liu, H., Sun, L., Li, Y. (2024a). Spatial–temporal changes of landscape and habitat quality in typical ecologically fragile areas of western China over the past 40 years: A case study of the Ningxia Hui Autonomous Region. Ecol. Evol. 14, e10847. doi: 10.1002/ece3.10847
Wang, Z., Huang, N., Luo, L., Li, X., Ren, C., Song, K., et al. (2011). Shrinkage and fragmentation of marshes in the West Songnen Plain, China, from 1954 to 2008 and its possible causes. Int. J. Appl. Earth Observ. Geoinform. 13, 477–486. doi: 10.1016/j.jag.2010.10.003
Wang, S., Li, R., Wu, Y., Wang, W. (2023b). Estimation of surface soil moisture by combining a structural equation model and an artificial neural network (SEM-ANN). Sci. Total Environ. 876, 162558. doi: 10.1016/j.scitotenv.2023.162558
Wang, B., Oguchi, T., Liang, X. (2023a). Evaluating future habitat quality responding to land use change under different city compaction scenarios in Southern China. Cities 140, 104410. doi: 10.1016/j.cities.2023.104410
Wang, Y., Shen, X., Jiang, M., Tong, S., Lu, X. (2022a). Daytime and nighttime temperatures exert different effects on vegetation net primary productivity of marshes in the western Songnen Plain. Ecol. Indic. 137, 108789. doi: 10.1016/j.ecolind.2022.108789
Wang, Z., Song, K., Zhang, B., Liu, D., Ren, C., Luo, L., et al. (2009b). Shrinkage and fragmentation of grasslands in the West Songnen Plain, China. Agricult. Ecosyst. Environ. 129, 315–324. doi: 10.1016/j.agee.2008.10.009
Wang, Y., Wang, K., Qu, L., Jiang, S., Shao, C. (2024b). Process and mechanism of saline-alkali soil carbon uptake potential in the Songnen Plain of China. Chin. J. Agric. Resour. Reg. Plann. 45, 129–138.
Wang, Z., Wang, Z., Zhang, B., Lu, C., Ren, C. (2015). Impact of land use/land cover changes on ecosystem services in the Nenjiang River Basin, Northeast China. Ecol. Process. 4, 1–12. doi: 10.1186/s13717-015-0036-y
Wang, D., Yuan, Z., Cai, Y., Jing, D., Liu, F., Tang, Y., et al. (2021a). Characterisation of soil erosion and overland flow on vegetation-growing slopes in fragile ecological regions: A review. J. Environ. Manage. 285, 112165. doi: 10.1016/j.jenvman.2021.112165
Wang, Z., Zhu, T., Jiang, Q. (2022b). Analysis of land use/cover change and habitat quality in Heilongjiang Province. J. Northeast Agric. Univ. 53, 77–86. doi: 10.19720/j.cnki.issn.1005-9369.2022.01.009
Wei, Q., Abudureheman, M., Halike, A., Yao, K., Yao, L., Tang, H., et al. (2022). Temporal and spatial variation analysis of habitat quality on the PLUS-InVEST model for Ebinur Lake Basin, China. Ecol. Indic. 145. doi: 10.1016/j.ecolind.2022.109632
Wu, H., Fang, S., Yang, Y., Cheng, J. (2022). Changes in habitat quality of nature reserves in depopulating areas due to anthropogenic pressure: Evidence from Northeast China 2000–2018. Ecol. Indic. 138. doi: 10.1016/j.ecolind.2022.108844
Wu, Y., Shi, K., Chen, Z., Liu, S., Chang, Z. (2021). An improved time-series DMSP-OLS-like data, (1992-2023) in China by integrating DMSP-OLS and SNPP-VIIRS Vol. V5 (Harvard Dataverse). doi: 10.7910/DVN/GIYGJU
Wu, Y., Wang, J., Gou, A. (2024). Research on the evolution characteristics, driving mechanisms and multi-scenario simulation of habitat quality in the Guangdong-Hong Kong-Macao Greater Bay based on multi-model coupling. Sci. Total Environ. 924. doi: 10.1016/j.scitotenv.2024.171263
Xiao, Z., Liu, R., Gao, Y., Yang, Q., Chen, J. (2022). Spatiotemporal variation characteristics of ecosystem health and its driving mechanism in the mountains of southwest China. J. Clean. Prod. 345. doi: 10.1016/j.jclepro.2022.131138
Xu, H.j., Zhao, C.y., Wang, X.p. (2020). Elevational differences in the net primary productivity response to climate constraints in a dryland mountain ecosystem of northwestern China. Land Degrad. Dev. 31, 2087–2103. doi: 10.1002/ldr.3587
Yan, S., Wang, X., Cai, Y., Li, C., Yan, R., Cui, G., et al. (2018). An integrated investigation of spatiotemporal habitat quality dynamics and driving forces in the upper basin of Miyun reservoir, north China. Sustainability 10, 4625. doi: 10.3390/su10124625
Yang, L., Bian, C., Pan, S., Chen, W., Zeng, J., Xu, H., et al. (2023a). Assessing the conservation effectiveness of theWorld’s protected areas: A habitat quality and human activities perspective. J. Clean. Prod. 431. doi: 10.1016/j.jclepro.2023.139772
Yang, L., Bian, C., Pan, S., Chen, W., Zeng, J., Xu, H., et al. (2023b). Spatially non-stationary response of habitat quality to land use activities in World’s protected areas over 20 years. J. Clean. Prod. 419. doi: 10.1016/j.jclepro.2023.138245
Yang, Y., Song, G. (2021). Human disturbance changes based on spatiotemporal heterogeneity of regional ecological vulnerability: A case study of Qiqihaer city, northwestern Songnen Plain, China. J. Clean. Prod. 291. doi: 10.1016/j.jclepro.2020.125262
Yang, Z., Wang, S., Guo, M., Tian, J., Zhang, Y. (2021). Spatiotemporal differentiation of territorial space development intensity and its habitat quality response in northeast China. Land 10, 573. doi: 10.3390/land10060573
Yang, W., Wang, Y., Webb, A. A., Li, Z., Tian, X., Han, Z., et al. (2018). Influence of climatic and geographic factors on the spatial distribution of Qinghai spruce forests in the dryland Qilian Mountains of Northwest China. Sci. Total Environ. 612, 1007–1017. doi: 10.1016/j.scitotenv.2017.08.180
Ye, Q., Li, Z., Duan, L., Xu, X. (2022). Decoupling the influence of vegetation and climate on intra-annual variability in runoff in karst watersheds. Sci. Total Environ. 824, 153874. doi: 10.1016/j.scitotenv.2022.153874
Yohannes, H., Soromessa, T., Argaw, M., Dewan, A. (2021). Spatio-temporal changes in habitat quality and linkage with landscape characteristics in the Beressa watershed, Blue Nile basin of Ethiopian highlands. J. Environ. Manage. 281. doi: 10.1016/j.jenvman.2020.111885
Yu, H., Wang, Z., Mao, D., Jia, M., Chang, S., Li, X. (2023). Spatiotemporal variations of soil salinization in China’s West Songnen Plain. Land Degrad. Dev. 34, 2366–2378. doi: 10.1002/ldr.4613
Zedler, J. B. (2003). Wetlands at your service: reducing impacts of agriculture at the watershed scale. Front. Ecol. Environ. 1, 65–72. doi: 10.1890/1540-9295(2003)001[0065:Waysri]2.0.Co;2
Zhang, X., Wang, L., Fu, X., Li, H., Xu, C. (2017). Ecological vulnerability assessment based on PSSR in Yellow River Delta. J. Clean. Prod. 167, 1106–1111. doi: 10.1016/j.jclepro.2017.04.106
Zhao, B., Li, S., Ma, Gao, Z., Zhang, J., Cao, X. (2022a). Evaluation of habitat quality in Jilin Province based on InVEST model. J. Northeast Normal University(Natural Sci. Edition) 54, 132–141. doi: 10.16163/j.cnki.dslkxb202110040001
Zhao, C., Liu, J., Mou, W., Zhao, W., Zhou, Z., Ta, F., et al. (2023). Topography shapes the carbon allocation patterns of alpine forests. Sci. Total Environ. 898. doi: 10.1016/j.scitotenv.2023.165542
Zhao, Y., Qu, Z., Zhang, Y., Ao, Y., Han, L., Kang, S., et al. (2022c). Effects of human activity intensity on habitat quality based on nighttime light remote sensing: A case study of Northern Shaanxi, China. Sci. Total Environ. 851. doi: 10.1016/j.scitotenv.2022.158037
Zhao, L., Yu, W., Meng, P., Zhang, J., Zhang, J. (2022b). InVEST model analysis of the impacts of land use change on landscape pattern and habitat quality in the Xiaolangdi Reservoir area of the Yellow River basin, China. Land Degrad. Dev. 33, 2870–2884. doi: 10.1002/ldr.4361
Zheng, H., Li, H. (2022). Spatial–temporal evolution characteristics of land use and habitat quality in Shandong Province, China. Sci. Rep. 12, 15422. doi: 10.1038/s41598-022-19493-x
Zheng, J., Xie, B., You, X. (2022). Spatio-temporal characteristics of habitat quality based on land-use changes in Guangdong Province. Acta Ecol. Sin. 42, 6997–7010.
Zhou, Z., Ding, Y., Shi, H., Cai, H., Fu, Q., Liu, S., et al. (2020). Analysis and prediction of vegetation dynamic changes in China: Past, present and future. Ecol. Indic. 117. doi: 10.1016/j.ecolind.2020.106642
Keywords: ecologically fragile areas, Songnen Plain, habitat quality, InVEST model, structural equation model, influencing factors
Citation: Sun X, Li Y, Hu Y and Li Y (2024) Human and natural factors affect habitat quality in ecologically fragile areas: evidence from Songnen Plain, China. Front. Plant Sci. 15:1444163. doi: 10.3389/fpls.2024.1444163
Received: 05 June 2024; Accepted: 22 October 2024;
Published: 19 November 2024.
Edited by:
Sheel Bansal, United States Department of the Interior, United StatesReviewed by:
Feng Li, Institute of Subtropical Agriculture, Chinese Academy of Sciences (CAS), ChinaJiping Liu, Jilin Normal University, China
Copyright © 2024 Sun, Li, Hu and Li. This is an open-access article distributed under the terms of the Creative Commons Attribution License (CC BY). The use, distribution or reproduction in other forums is permitted, provided the original author(s) and the copyright owner(s) are credited and that the original publication in this journal is cited, in accordance with accepted academic practice. No use, distribution or reproduction is permitted which does not comply with these terms.
*Correspondence: Yuehui Li, bGl5aEBpYWUuYWMuY24=; Yue Li, eXVhbmxpbmxpeXVlQDE2My5jb20=
 Xiuli Sun
 Yuehui Li
 Yuanman Hu2