
94% of researchers rate our articles as excellent or good
Learn more about the work of our research integrity team to safeguard the quality of each article we publish.
Find out more
ORIGINAL RESEARCH article
Front. Plant Sci. , 05 March 2024
Sec. Plant Abiotic Stress
Volume 15 - 2024 | https://doi.org/10.3389/fpls.2024.1364826
This article is part of the Research Topic Plant Responses to Salt Stress View all 12 articles
 Yanmei Tang1Shicheng Li1Dessireé Zerpa-Catanho2Zhihai Zhang3Sai Yang4Xuying Zheng2Shuai Xue1Xianyan Kuang5Mingxi Liu6Xiong He7Zili Yi1*Liang Xiao1*
Marginal lands, such as those with saline soils, have potential as alternative resources for cultivating dedicated biomass crops used in the production of renewable energy and chemicals. Optimum utilization of marginal lands can not only alleviate the competition for arable land use with primary food crops, but also contribute to bioenergy products and soil improvement. Miscanthus sacchariflorus and M. lutarioriparius are prominent perennial plants suitable for sustainable bioenergy production in saline soils. However, their responses to salt stress remain largely unexplored. In this study, we utilized 318 genotypes of M. sacchariflorus and M. lutarioriparius to assess their salt tolerance levels under 150 mM NaCl using 14 traits, and subsequently established a mini-core elite collection for salt tolerance. Our results revealed substantial variation in salt tolerance among the evaluated genotypes. Salt-tolerant genotypes exhibited significantly lower Na+ content, and K+ content was positively correlated with Na+ content. Interestingly, a few genotypes with higher Na+ levels in shoots showed improved shoot growth characteristics. This observation suggests that M. sacchariflorus and M. lutarioriparius adapt to salt stress by regulating ion homeostasis, primarily through enhanced K+ uptake, shoot Na+ exclusion, and Na+ sequestration in shoot vacuoles. To evaluate salt tolerance comprehensively, we developed an assessment value (D value) based on the membership function values of the 14 traits. We identified three highly salt-tolerant, 50 salt-tolerant, 127 moderately salt-tolerant, 117 salt-sensitive, and 21 highly salt-sensitive genotypes at the seedling stage by employing the D value. A mathematical evaluation model for salt tolerance was established for M. sacchariflorus and M. lutarioriparius at the seedling stage. Notably, the mini-core collection containing 64 genotypes developed using the Core Hunter algorithm effectively represented the overall variability of the entire collection. This mini-core collection serves as a valuable gene pool for future in-depth investigations of salt tolerance mechanisms in Miscanthus.
Salinity is a significant abiotic stress factor that inhibits plant growth and reduces crop yield (Munns and Gilliham, 2015). Soil salinization is a devastating global environmental issue, affecting over 833 million hectares and accounting for more than 8.7% of the world’s land area (FAO, 2021). In China, the distribution of saline land is extensive, with approximately 99.13 million hectares located mainly in northern, northwestern, northeastern, and coastal areas (Wu et al., 2019). Saline land is generally unsuitable for most crops and leads to reduced production and plant mortality. There is an urgent global ecological need to find practical approaches to improve and utilize these salty lands (Wang et al., 2019). The most promising strategy is screening and developing salt-tolerant crop species and varieties (Ashraf et al., 2012).
Plant response to salt stress is a complex genetic and physiological mechanism controlled by multiple quantitative trait loci (QTL) (Flowers, 2004). Salt stress induces osmotic pressure, ion toxicity, and nutritional imbalances, which reduce cell growth and alter metabolite levels (Munns and Tester, 2008). Higher plants have developed various adaptive mechanisms in response to salt stress, which are generally categorized into three groups: tolerance to osmotic stress, Na+ exclusion through leaves, and tissue tolerance (Munns, 2005). Under salt stress, plants regulate osmotic pressure through the synthesis of organic regulators and accumulation of inorganic ions. Among these ions, K+, Na+, and Cl- are crucial for 80-95% of cellular osmoregulation (Munns, 2005). K+, in particular, is essential for maintaining vital cellular functions and has been emphasized for the critical role it plays in plant salt tolerance (Cuin et al., 2008). Additionally, plants possess mechanisms for external Na+ exclusion or ion segregation within cells (with ions accumulating in vesicles) to maintain ion homeostasis and stable plant growth under salt stress. Plant roots activate specific ion transporters, such as HKT (high-affinity K+ transporters), NHX (Na+/H+ antiporters), SOS (salt overly sensitive genes), HAK (high-affinity K+), potassium channels (AKT), and H+ pumping, to facilitate Na+ transport, compartmentation, or elimination under salt stress (Zhu, 2016).
Miscanthus is a perennial, rhizomatous, tall C4 grass that has been deemed a promising energy crop and is currently being developed to produce lignocellulosic biomass as a sustainable alternative to fossil fuels and as an eco-industrial crop (Shavyrkina et al., 2023). Growing Miscanthus on marginal land for biomass production could contribute to food security and efficient land use (Xue et al., 2016). Additionally, it has the potential to enhance soil carbon sequestration with long-term benefits for the recovery of marginal land by improving soil structure and fertility (Xu et al., 2021). M. lutarioriparius and M. sacchariflorus are closely related subspecies that are distributed in different habitats belonging to Poaceae, Miscanthus Anderson. M. sacchariflorus, characterized by high genetic diversity and adaptation (Sun et al., 2010), can be an alternative for ecological landscape restoration in coastal saline areas (Sun and Chen, 2015). Furthermore, M. lutarioriparius, a species endemic to Central China, exhibits the highest biomass production (Sun et al., 2010). Studies have shown that the seeds of M. sacchariflorus and M. lutarioriparius are more salt-tolerant than those of M. sinensis (Zheng et al., 2015). On marginal land (salinity level of 2.7 dS/m) in the Yellow River Delta, M. sacchariflorus demonstrated stable yields, whereas the biomass yield of M. lutarioriparius surpassed that of switchgrass (Zheng et al., 2019). Thus, M. sacchariflorus and M. lutarioriparius are biomass crops with a high potential for sustainable production in saline soils (Zheng et al., 2022). However, further research is required to fully understand the salt tolerance mechanisms of M. sacchariflorus and M. lutarioriparius. Previous evaluations of the salt tolerance of the seeds and seedlings of both species were performed using small sample sizes (Zong et al., 2013; Sun and Chen, 2015; Zheng et al., 2015; Chen et al., 2017; Duan et al., 2018). Similarly, transcriptomic approaches have shed light on some responsive genes in M. lutarioriparius under long-term salt stress. However, these represent only a fraction of the overall mechanisms underlying salt tolerance in M. lutarioriparius (Song et al., 2017; Wang et al., 2019; Yu et al., 2023). Therefore, the genetic diversity and mechanisms underlying salt tolerance in M. sacchariflorus and M. lutarioriparius remain largely unknown and require further investigation.
Studying the mechanism of salt tolerance using a large number of genotypes in M. sacchariflorus and M. lutarioriparius is time-consuming, labor-intensive, and expensive. To improve efficiency, it is necessary to establish a core library of salt tolerance that captures the entire range of genetic variability with minimal redundancy, by reducing the size and increasing the diversity of the germplasm set. This core set can provide a starting point for enhancing genetic gains and employing phenomic and genomic tools in less time (Tripathi et al., 2022). An economical, time-effective, and labor-saving approach for studying physiological or molecular response mechanisms using phenotypic traits of the core collection or trait-marker associations has been widely used (Guo et al., 2022; Wang et al., 2022).
In this study, we assessed the salt tolerance of 318 genotypes of M. sacchariflorus and M. lutarioriparius in a hydroponic system using 14 salt-tolerance traits. The objectives of this study were: (1) to determine the optimal salt concentration for evaluating salt tolerance in M. sacchariflorus and M. lutarioriparius; (2) to explore the genetic diversity and physiological mechanisms of salt tolerance in these species; (3) to develop a mathematical evaluation model for studying salt tolerance in M. sacchariflorus and M. lutarioriparius; and (4) to establish a core collection for salt tolerance in M. sacchariflorus and M. lutarioriparius. This study provides a better understanding of salt-tolerant Miscanthus variety breeding and improvement, as well as the optimum utilization of marginal lands.
The study material comprised 318 Miscanthus genotypes, including 230 M. lutarioriparius, 87 M. sacchariflorus, and one M. × giganteus (Mxg), a natural allotriploid hybrid between M. sacchariflorus and M. sinensis. The genotypes were collected from a range of regions in China and cultivated in Miscanthus Germplasm Nursery of Hunan Agricultural University (N28.18°, E113.07°) in Changsha, Hunan, China. Figure 1 and Supplementary Table S1 show the geocoordinates of each collection site mapped using geographic information system (GIS) tools with the Krasovsky_1940 datum and geographic projection system. For each genotype, clones were subjected to vegetative propagation by dividing the rhizomes.
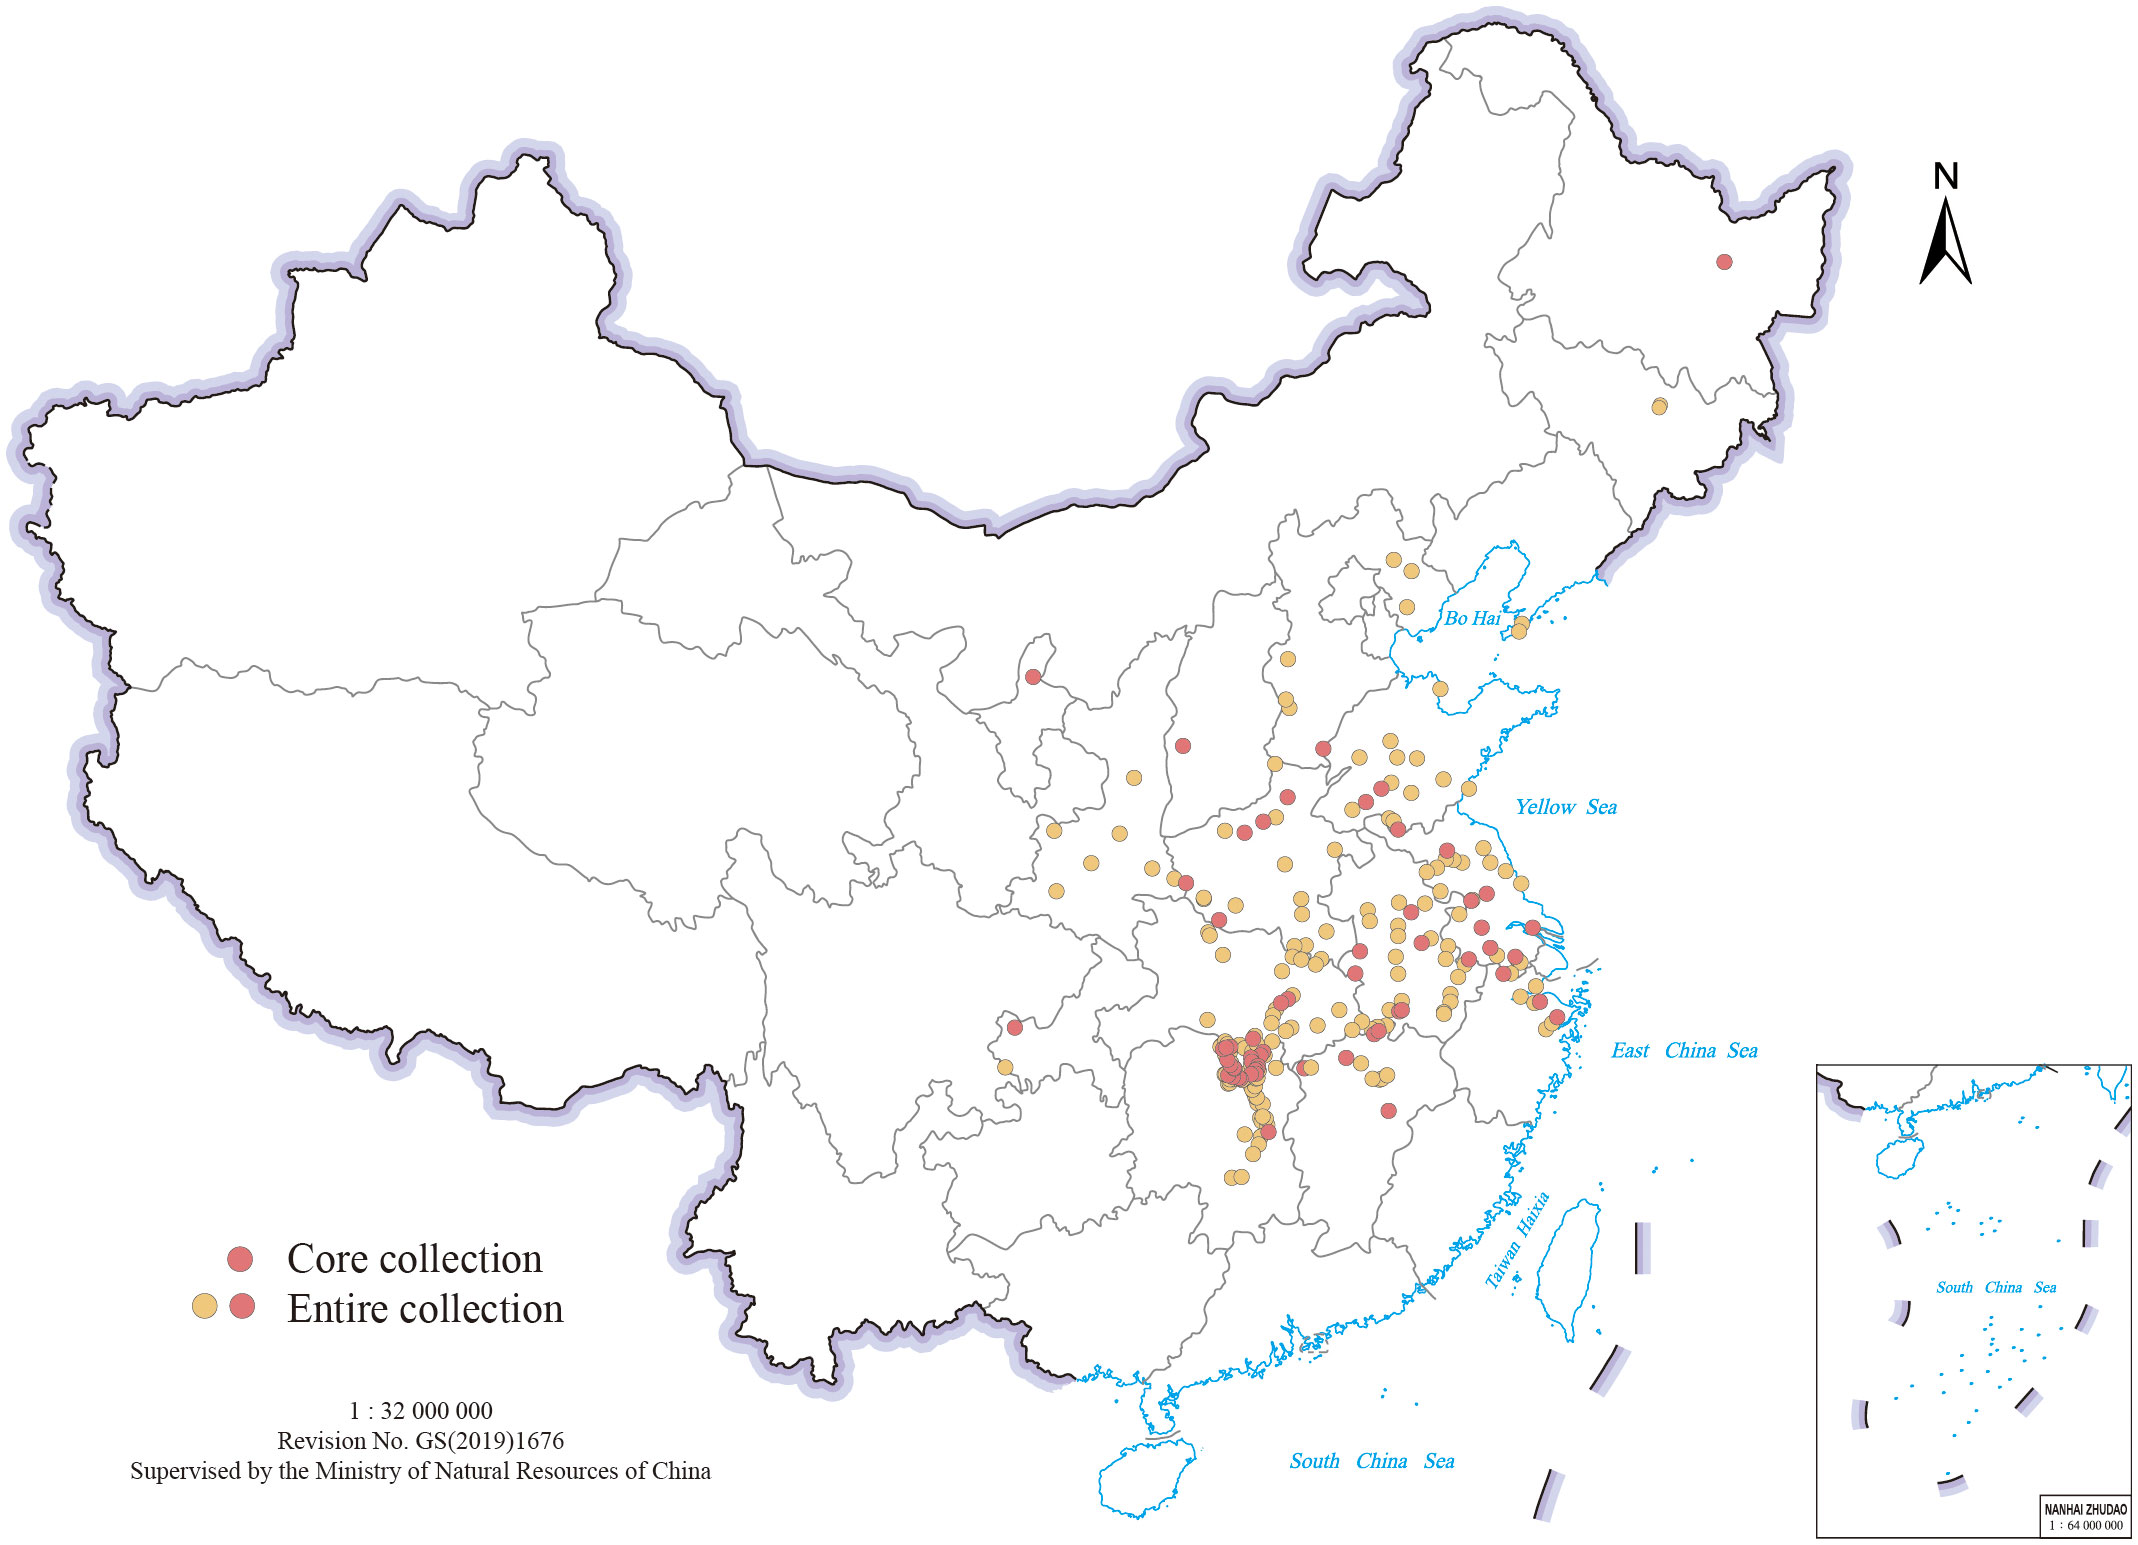
Figure 1 Collection sites of 318 M. sacchariflorus and M. lutarioriparius genotypes (excluding M. × giganteus) from different regions of China.
A preliminary experiment was performed to determine the optimal salt-stress concentration. Ten genotypes (M87, M112, M129, M164, M228, M229, M245, M253, M275, and Mxg) were randomly selected from the 318 genotypes and used to determine the optimal salt concentration across a range of NaCl concentrations (0, 100, 150, 200, and 250 mM). To prepare the plant materials, rhizomes of each genotype were divided into small cuttings, with each cutting carrying 1-2 buds (approximately eight cuttings per treatment), and placed into plug trays filled with peat soil. After one month of growth in the greenhouse, plants of uniform height and growth were selected for each genotype. The plants were transferred to a hydroponic system following the removal of the attached soil and were subjected to a one-week acclimation period. The hydroponic system comprised a 24-hole floating planting plate (4 cm in diameter per hole), measuring 60 × 40 × 3 cm. This plate, which held a planting plug and a planting basket, was placed within a square plastic tray (61 × 42 × 9.5 cm) designed to accommodate up to 24 plants. A half-strength modified version of Hoagland’s solution was added to the square trays for growth support and was replaced every five days. Each container included eight genotypes in three replicates, totaling 24 plants. After one week of acclimation, NaCl was incrementally added to the nutrient solution at daily increments of 20, 30, 40, and 50 mM until the desired corresponding concentrations of 100, 150, 200, and 250 mM were reached, except for the 0 mM NaCl control. The hydroponic salt stress experiments were conducted in a growth chamber set at a constant temperature of 25°C, a relative humidity of 70%, and a light intensity of 650 μmol·m-2·s-1 (16 h light/8 h dark).
After 17 days of salt treatment, the plants from both the salt and control treatments were evaluated for 14 traits (Table 1): shoot growth rate (GR), leaves increased number (NIL), leaf expansion rate (LER), leaf senescence scale (Sen), shoot water content (SWC), root water content (RWC), shoot Na+ concentration (SNC), root Na+ concentration (RNC), the ratio of shoot Na+ concentration to root Na+ concentration (SN/RN), shoot K+ concentration (SKC), root K+ concentration (RKC), the ratio of shoot K+ concentration to root K+ concentration (SK/RK), the ratio of shoot K+ concentration to shoot Na+ concentration (SK/N), and the ratio of root K+ concentration to root Na+ concentration (RK/N).
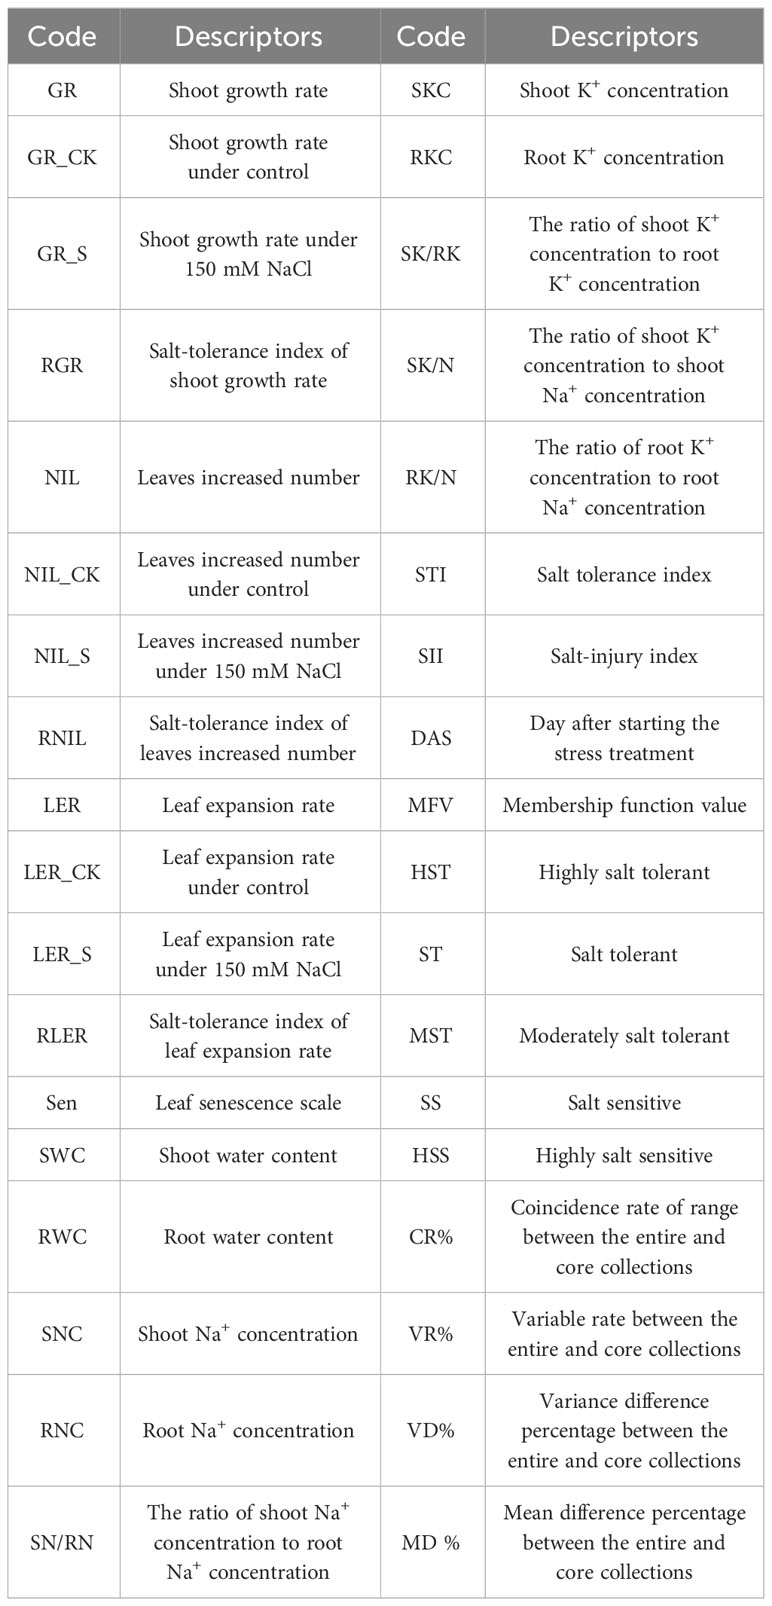
Table 1 Description of abbreviations.
The salt tolerance index (STI) for GR, NIL, and LER was calculated for each as the ratio of the value of stressed plants to the value of the control plants. For instance, the relative GR (RGR) was calculated as RGR = GR under salt stress/GR under control conditions. These ratios are referred to as RGR, Relative NIL (RNIL), and Relative LER (RLER), respectively. Additionally, salt-injury index (SII) is defined as SII = 1-STI, which quantifies the degree of injury from salt stress (Wu et al., 2019). The SII for GR, NIL and LER were calculated for the 10 genotypes at each concentration. The optimum stress concentration of NaCl was determined at the level where the SII was 50% of the control’s value and the diversity of Sen was the greatest.
Following the above-mentioned methods, plants derived from a pool of 318 genotypes were vegetative propagation, washed, and transferred to a hydroponic system in a growth chamber for evaluation. Each treatment had three biological replicates and was treated with the optimal NaCl concentration (150 mM NaCl) and 0 mM NaCl (control). The growth chamber conditions were identical to those used in the preliminary experiment. After four days of acclimation in the hydroponics system, NaCl was added to the stress treatment group at 75 mM daily increments until the final concentration reached 150 mM NaCl. Treatments were carried out for 17 d, during which GR, NIL, and LER were determined under control and salt stress conditions, and STI was calculated for these traits (RGR, RNIL, and RLER). In addition, Sen, SWC, RWC, SNC, RNC, SN/RN, SKC, RKC, SK/RK, SK/N, and RK/N were determined under the salt treatment. The experiment was repeated three times.
Plant height, leaf expansion, and leaf number were recorded for all plants under control and saline conditions. Plant height (cm) was measured from the base of the plant to the tip of the tallest leaf on the second day after starting the stress treatment (DAS) and at 7 and 17 DAS. The GR, NIL, LER, Sen, SWC, and RWC were assessed according to the protocol described by Chen et al. (2017). GR was evaluated as the daily increase in height, with the unit of centimeters per day (cm/day); it was calculated as the mean of the daily increase in height between 7 and 2 DAS and between 17 and 2 DAS. Similarly, NIL (leaf) was obtained by subtracting the number of leaves at 1 DAS from the number of leaves at 17 DAS. For leaf expansion measurements, the youngest leaf of each plant was marked at 1 DAS and its length measured at 2, 7, and 12 DAS. LER was evaluated as the mean of the daily leaf expansion between 7 and 2 DAS and between 12 and 2 DAS (cm/day). Sen was measured by visually scoring all leaves of each plant under salt stress at 17 DAS, using a 1 to 9 scale according to the percentage of senesced area (1 = no senescence, 3 = 1-30% senesced area, 5 = 30-60% senesced area, 7 = 60-90% senesced areas, 9 = >90% senesced area). At harvest (17 DAS), all plants from the control and salt treatment groups were thoroughly washed, blotted dry, cut, and separated into shoots and roots. The fresh weights of the shoots and roots were then separately measured immediately. Subsequently, both plant parts were dried separately in a forced- air oven at 80°C for 3-4 days, and their dry weights were recorded to calculate the SWC (%) and RWC (%).
To determine the ion concentrations in the shoots and roots, three replicate samples of either shoots or roots for each genotype were pooled after the dry weights were measured. The samples were then processed by shearing and grinding to a fine powder using a sample grinder, followed by sieving with a 0.15 mm sieve. A 0.1 g sample of this dry powder was digested on a graphite digester using the H2SO4-H2O2 digestion method. Distilled water was added to the digested solution to obtain a final volume of 50 mL. The sample solutions were then filtered through a filter with a pore size of 0.22 µm, and the filtered solutions were diluted 160-fold for shoot samples and 100-fold for root samples before the Na+ and K+ content was assessed for each genotype’s root and leaf samples using a flame atomic absorption spectrophotometer (AA-7000, SHIMADZU, Japan).
The salt tolerance of M. sacchariflorus and M. lutarioriparius was evaluated by calculating the membership function value (MFV) of STI and traits such as RGR, RNIL, RLER, Sen, SWC, RWC, SNC, RNC, SN/RN, SKC, RKC, SK/RK, SK/N, and RK/N using a fuzzy comprehensive evaluation method. The MFV of salt tolerance was calculated using the following equation (Wassie et al., 2019; Weng et al., 2021; Wang et al., 2023):
Where Fij is the MFV of indicator (j) for genotype (i) for salt tolerance. Xij is the value of indicator (j) for genotype (i). Xjmax and Xjmin are the maximum and minimum values of the indicator (j), respectively. The membership function reflects the positive correlation between a particular indicator variable and salt stress, as expressed in Equation 1, whereas Equation 2 expresses a negative correlation. Di is the mean MFV of the 14 salt tolerance traits of genotype (i) by Equation 3 for salt tolerance. Higher values of D indicate higher salt tolerance.
Hierarchical cluster analysis based on the Euclidean distance of D values was also used to evaluate salt tolerance. Salt tolerance was clustered into five different levels: highly salt tolerant (HST), salt tolerant (ST), moderately salt tolerant (MST), salt sensitive (SS), and highly salt sensitive (HSS).
Multiple regression analysis was performed on the 303 genotypes’ D values (taking as dependent variable Y) and indicator values (taking as independent variable Xi). A mathematical evaluation model for salt tolerance was established as follows: Y = μ+β1X1+β2X2+β3X3+β4X4+β5X5+β6X6+β7X7, where Y is the Di, X1 is SNC, X2 is RNIL, X3 is RWC, X4 is RGR, X5 is RKC, X6 is Sen, X7 is RNC, β is the B of unstandardized coefficient, and μ is constant (random error). For model validation, another 15 genotypes were used, with three genotypes selected from each of the five salt tolerance levels.
A mini-core collection was developed using 14 traits of salt tolerance (RGR, RNIL, RLER, Sen, SWC, RWC, SNC, RNC, SN/RN, SKC, RKC, SK/RK, SK/N, and RK/N) and the distance-based Core Hunter approach. Gower’s distance measure (Gower, 1971) was employed in the CH3 method (De Beukelaer et al., 2018) to calculate the pairwise distances between genotypes as entry-to-nearest-entry (E-NE) and access-to-nearest-entry (A-NE). The core set, which accounted for 20% of the entire collection, was generated by optimizing both E-NE (maximizing) and A-NE (minimizing) with equal weighting. The optimization process used the default parallel tempering search algorithm, which was terminated when no improvement was observed for 30 s.
To compare the mean, variance, median, and representativeness of the entire and core collections for the 14 traits, we applied the Newman-Keuls procedure (Newman, 1939; Keuls, 1952), Levene’s test (Levene, 1960), Wilcoxon rank-sum non-parametric test (Wilcoxon, 1945), and the Shannon-Weaver diversity index (Shannon and Weaver, 1949), respectively. In addition, we assessed the quality of the developed mini-core collection using various criteria proposed by Hu et al. (2000) and Kim et al. (2007). These criteria included the estimation of the mean difference percentage (MD %), variance difference percentage (VD %), coincidence rate of range (CR %), and variable rate (VR %) between the entire and core collections. The mini core collection was considered well represented by the entire collection if MD % was below 20%, VD % and VR % were sufficiently large, and CR % exceeded 80% (Hu et al., 2000). The similarity in genetic traits between the entire and core collections was also compared using correlation analysis. The contributions of different descriptor traits to multivariate polymorphisms and conservation in the core collection were assessed using principal component analysis (PCA).
Data are presented as means. The statistics and summarization of the data were conducted using Excel 365. All subsequent data analysis and visualization were performed by R 4.3.0, with the exception of generating the distribution map of germplasm using GIS. Specifically, the core collection tests were performed using the EvaluateCore package in R (Aravind et al., 2022).
We evaluated the GR, NIL, LER, Sen, SWC, RWC, SNC, RNC, SN/RN, SKC, RKC, SK/RK, SK/N, and RK/N of the genotypes at 17 DAS, as detailed in Supplementary Table S2, Supplementary Figure S1. The SII of GR, NIL, and LER were calculated from the data in Supplementary Tables S2 and S3. Linear regression analysis was conducted on the mean values of the three SII across the ten genotypes. The results indicated that according to the linear regression fitting, the SII for NIL would decrease to 50% of the control’s value at a NaCl concentration of 144.48 mM NaCl (Figure 2A), and the SII for LER would decrease to 50% of the control’s value at the predicted 153.70 mM (Figure 2B). Notably, Sen exhibited considerable variability under 150 mM NaCl treatment, indicating its suitability as a criterion for evaluating salt tolerance across different genotypes (Figure 2C). Therefore, 150 mM NaCl was used for the evaluation of the salt tolerance for the 318 genotypes in the present study.
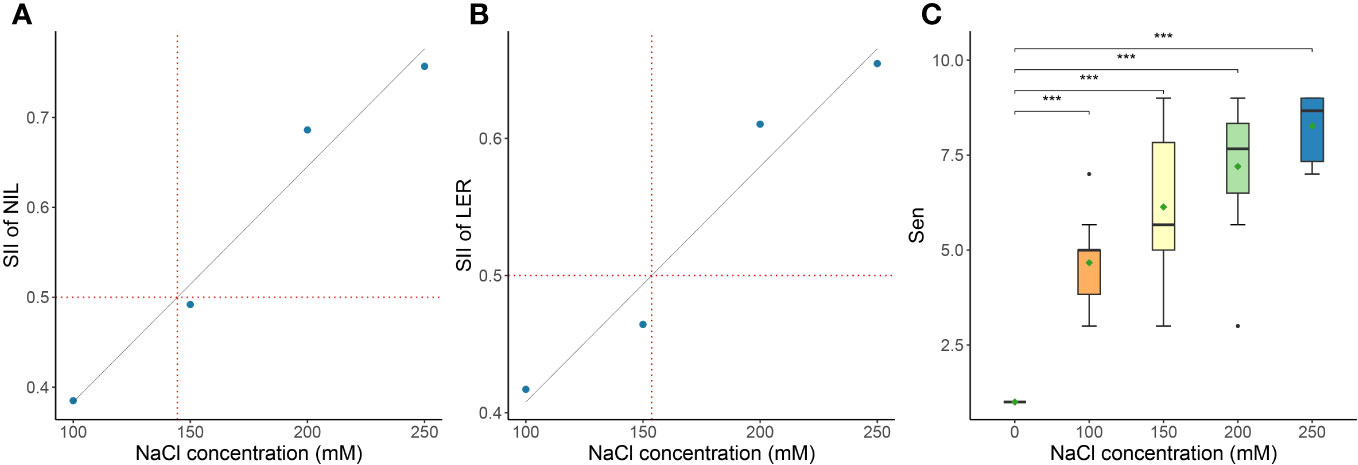
Figure 2 Determination of the optimal NaCl concentration for evaluating salt tolerance. The NaCl concentration of the salt-injury index (SII) is 0.5 of leaves increased number (NIL) (A), leaf expansion rate (LER) (B) of ten Miscanthus genotypes under different NaCl concentrations, as well as the effect on leaf senescence scale (Sen) (significance of the t-test: ***P<0.001) (C). Data in the figure are means of ten Miscanthus genotypes for each trait under each concentration of NaCl.
Salt tolerance of the 318 genotypes at the seedling stage was evaluated using 150 mM NaCl, as detailed in Supplementary Table S4 and Figure 3. Descriptive statistics for the salt tolerance traits, including RG, RGR, NIL, RNIL, LER, RLER, Sen, SWC, RWC, SNC, RNC, SN/RN, SKC, RKC, SK/RK, SK/N, and RK/N, are presented in Table 2 and Supplementary Figure S2. Continuous variation was observed across all traits with approximately normal distributions, as seen in Supplementary Figure S3. The 318 genotypes exhibited a wide variation in response to the 150 mM NaCl treatment. A Kruskal-Wallis test applied to salt tolerance-related traits indicated significant differences (P<0.001) among genotypes, suggesting that genetic effects explained a large proportion of the phenotypic variance. Significant differences in GR, NIL, and LER between the control and salt treatment (P<0.001) were also noted (Supplementary Figure S2). Furthermore, to account for background differences, salt tolerance indices of GR, NIL, and LER (RGR, RNIL, and RLER, respectively) were used to evaluate the salt stress response in M. sacchariflorus and M. lutarioriparius. RGR, RNIL, and RLER showed variations ranging from 0.03 to 1.77, 0.00 to 0.94, and 0.19 to 1.09, respectively, with RGR exhibiting the most significant coefficient of variation at 53%. The water content of the plants was affected by salt stress, leading to SWC varying from 4.37% to 28.78% and RWC from 3.57% to 22.62%. Sen exhibited a mean value of 6.33 with a range of variability from 3.67 to 8.78 across different genotypes, highlighting the diverse response of M. sacchariflorus and M. lutarioriparius genotypes to salt stress.
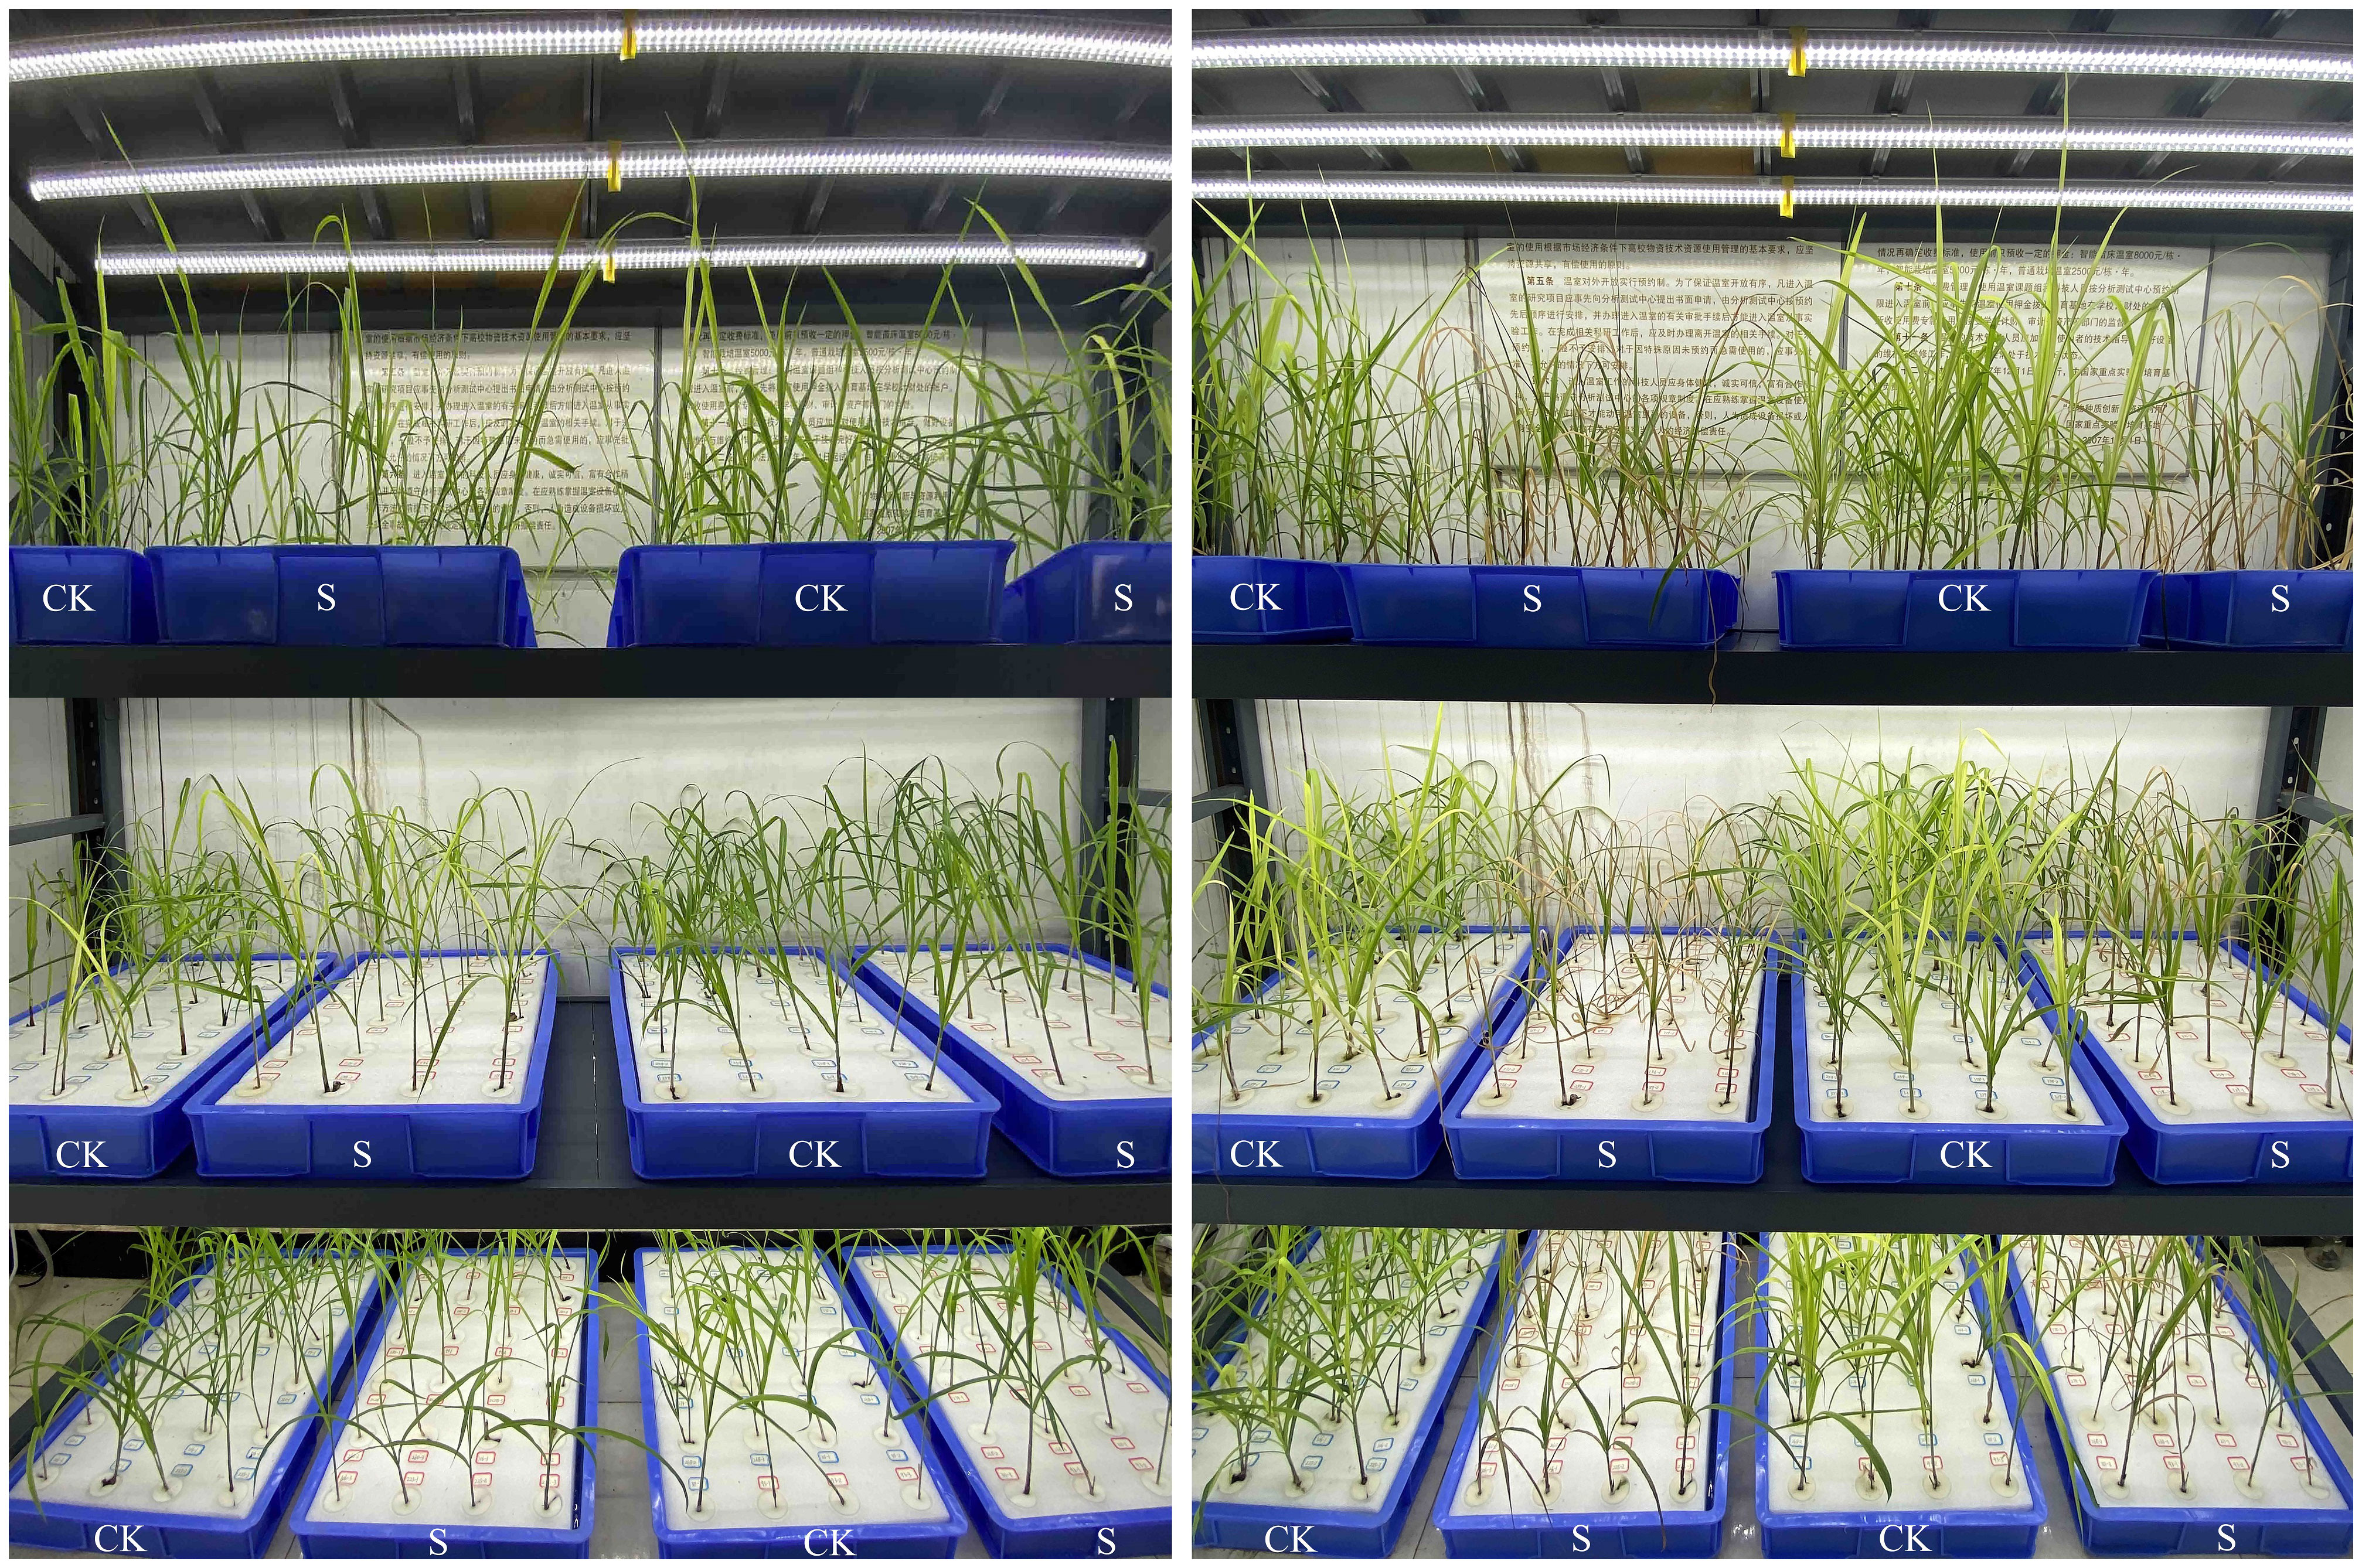
Figure 3 Plants were subjected to 150 mM NaCl (S) and control (CK) conditions for 0 (left panel) and 17 days (right panel). Each group of two adjacent hydroponic containers, from left to right, was used to represent the CK and S conditions, respectively. The position of each plant in these two hydroponic containers was matched one-to-one.
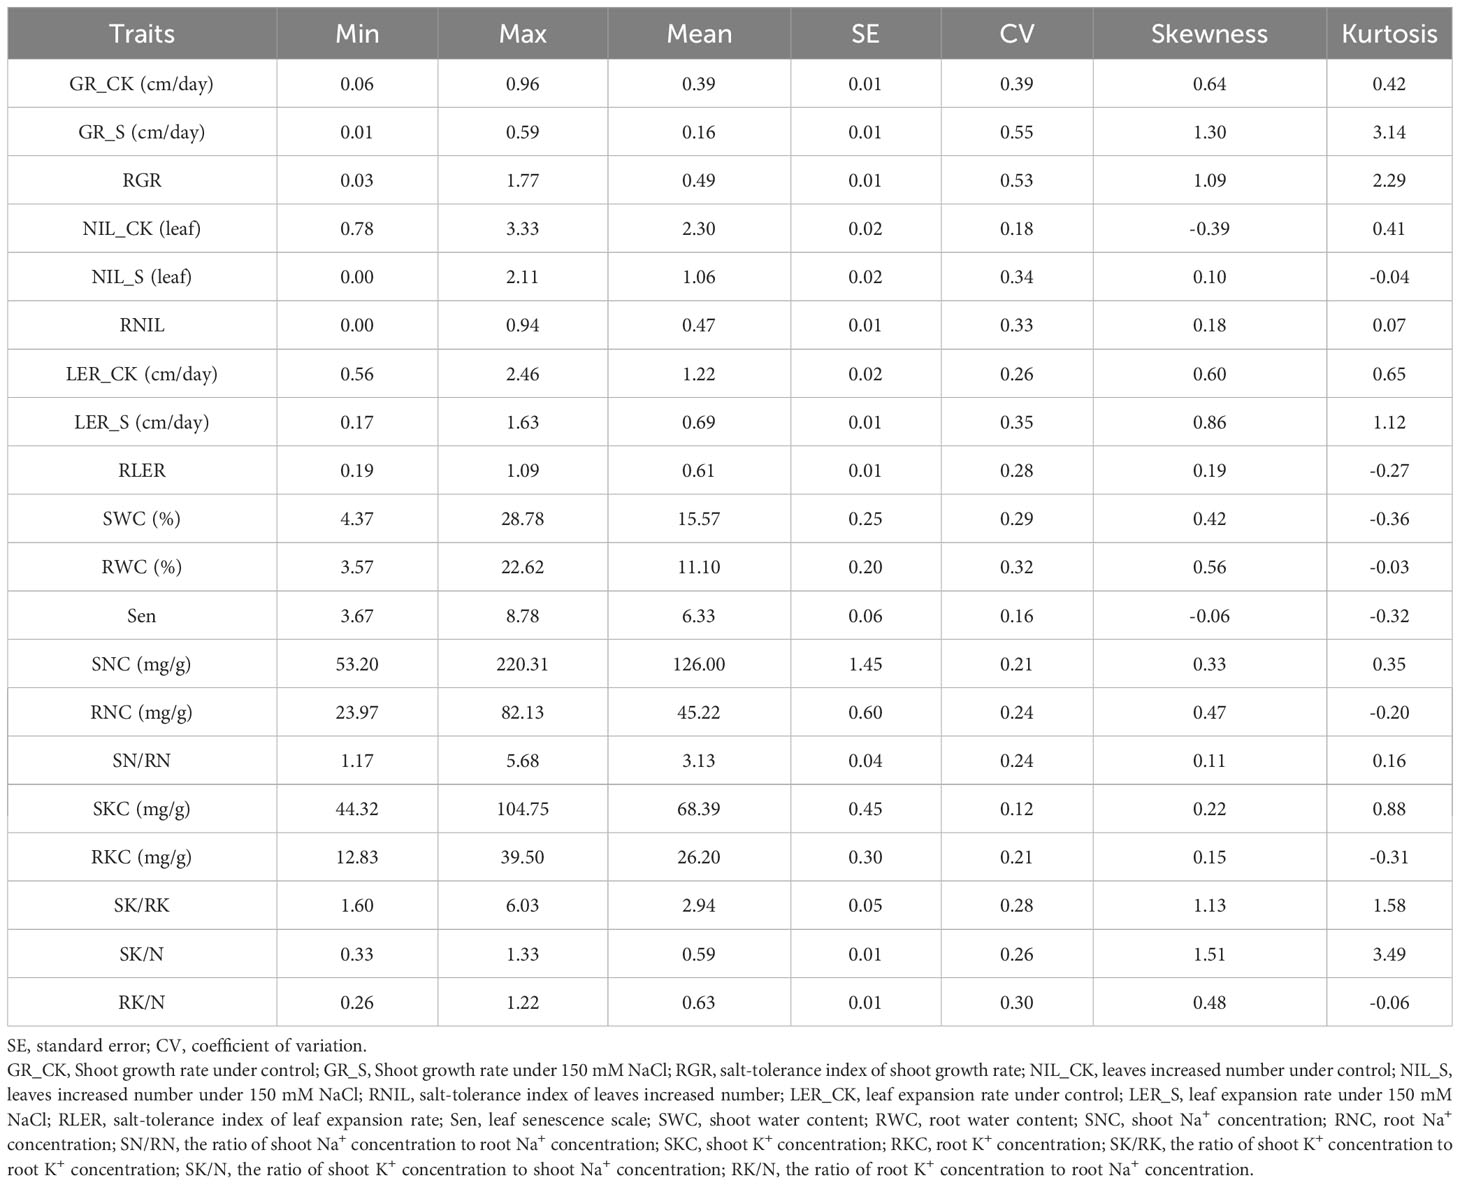
Table 2 Descriptive statistics of all traits for 318 M. sacchariflorus and M. lutarioriparius genotypes.
The 318 genotypes showed significant differences (P<0.001) in their Na+ and K+ responses to salt stress (Figure 4, Table 2, Supplementary Table S4). Specifically, SNC ranged from 53.20 mg/g (in genotype M192) to 220.31 mg/g (in genotype M88), RNC ranged from 23.97 mg/g (in genotype M338) to 82.13 mg/g (in genotype M301), and SN/RN was notably high at 3.13, suggesting a greater accumulation of Na+ in the shoots of M. sacchariflorus and M. lutarioriparius under salt stress. In contrast, the range of K+ concentration was narrower; SKC was 44.32 mg/g (in genotype M19) - 104.75 mg/g (in genotype M122), and RKC was 12.83 mg/g (M203) - 39.50 mg/g (M349), but SK/RK also reached 2.94. Regarding the K+ to Na+ ratio, SK/N ranged from 0.33 (in genotype M126) to 1.33 (in genotype M192), and RK/N ranged from 0.26 (in genotype M123) to 1.22 (in genotype M405). Notably, a decline in SKC and RKC was not observed despite increased SNC, indicating the capacity of M. sacchariflorus and M. lutarioriparius to enhance K+ uptake under salt stress conditions. Additionally, among the 20 genotypes with the highest SNC, genotypes M283 and M349 exhibited Sen values lower than 7, specifically 6.56. Genotype M283 also displayed relatively high levels of RNIL, RLER, and SWC; M349 also exhibited relatively high RGR and SWC, and slightly higher average RNIL. These results suggest that these genotypes may utilize a tissue tolerance mechanism, possibly through the accumulation of Na+ in shoot vacuoles.
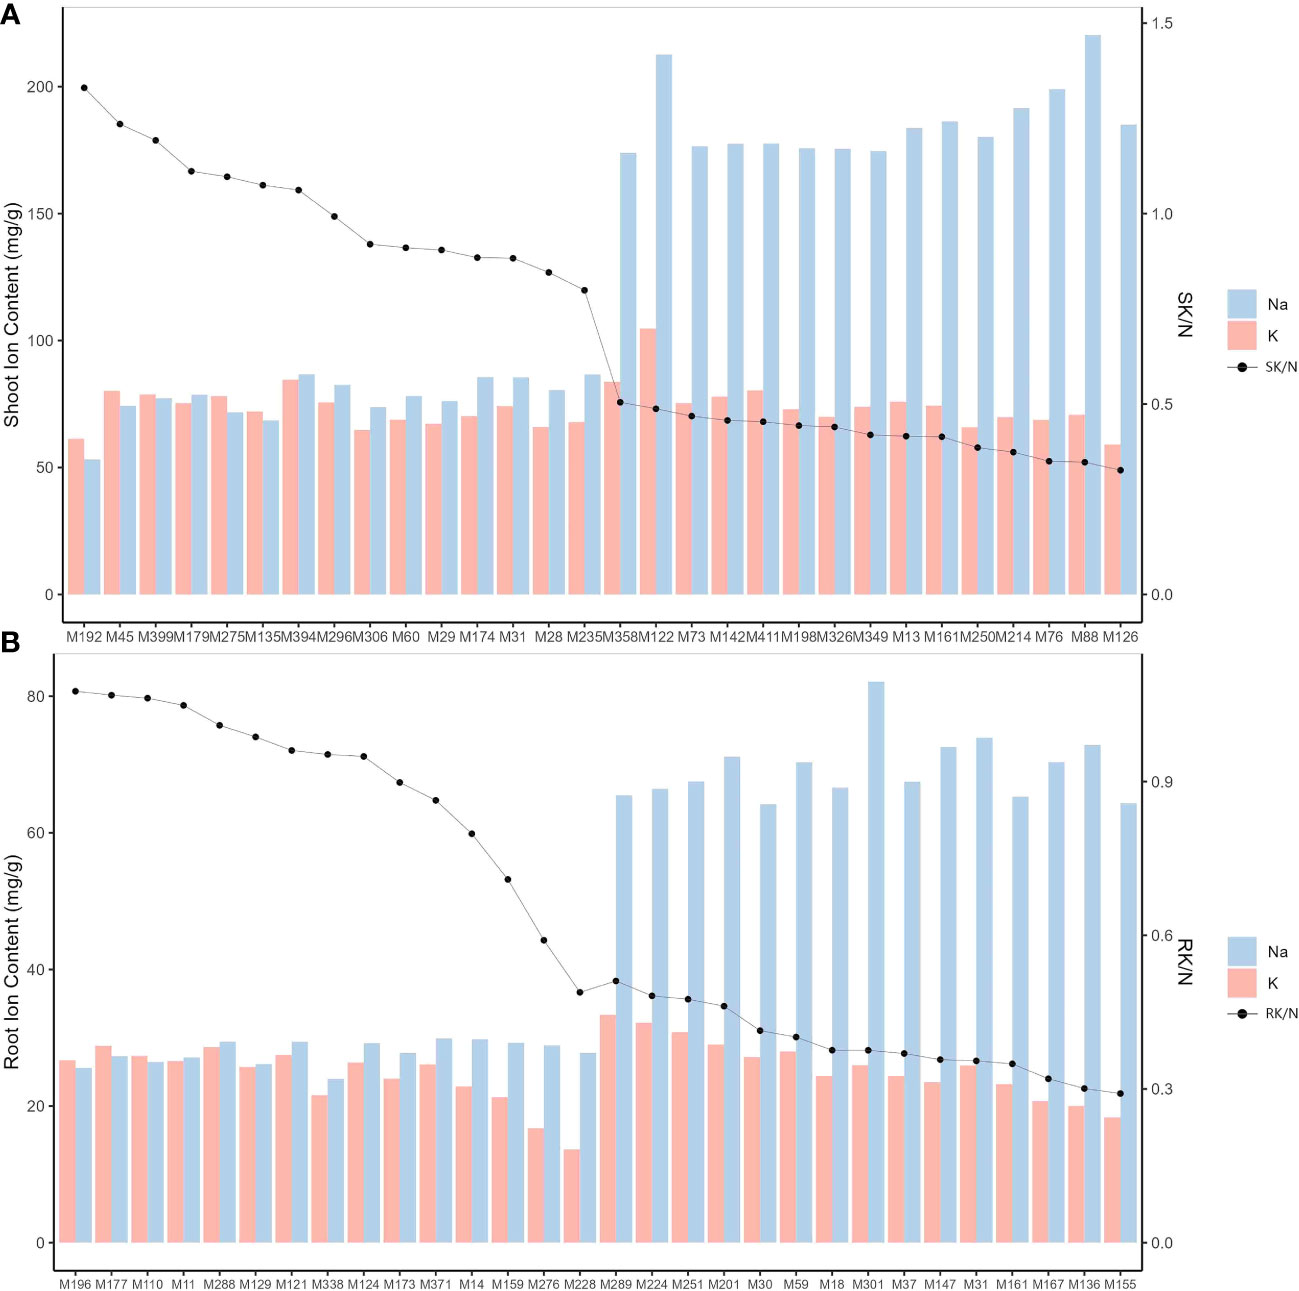
Figure 4 Na+ and K+ concentrations and K+/Na+ ratios in M. sacchariflorus and M. lutarioriparius under 150 mM NaCl. Ion concentrations for 15 genotypes with the highest shoot Na+ concentration (SNC) and 15 genotypes with the lowest shoot Na+ concentration (A), and ion concentrations for 15 genotypes with the highest root Na+ concentration (RNC) and 15 genotypes with the lowest root Na+ concentration (B). SK/N and RK/N are K+/Na+ ratios in shoots and roots, respectively.
Correlation analyses were conducted to examine the relationships among various parameters under NaCl stress, including RGR, RNIL, RLER, Sen, SWC, RWC, SNC, RNC, SN/RN, SKC, RKC, SK/RK, SK/N, and RK/N (Figure 5). Significant positive correlations were found between RGR, RLER, RNIL, and SWC as well as between SKC, SK/RK, and SK/N. The highest positive correlation coefficient was observed between SWC and RWC (0.73), followed by SNC and Sen (0.66). Significant positive correlations were also noted between SN/RN and SNC (0.58), Sen (0.55), and RK/N (0.53). Notably, both SKC and RKC showed significant positive correlations with SNC. Conversely, significant negative correlations existed between Sen, SNC, and SN/RN with RGR, RNIL, RLER, and SK/N. The correlation coefficient between Sen and SK/N had the largest absolute value at -0.54, followed by that between Sen and RNIL at -0.52, and that between Sen and RLER at -0.45.
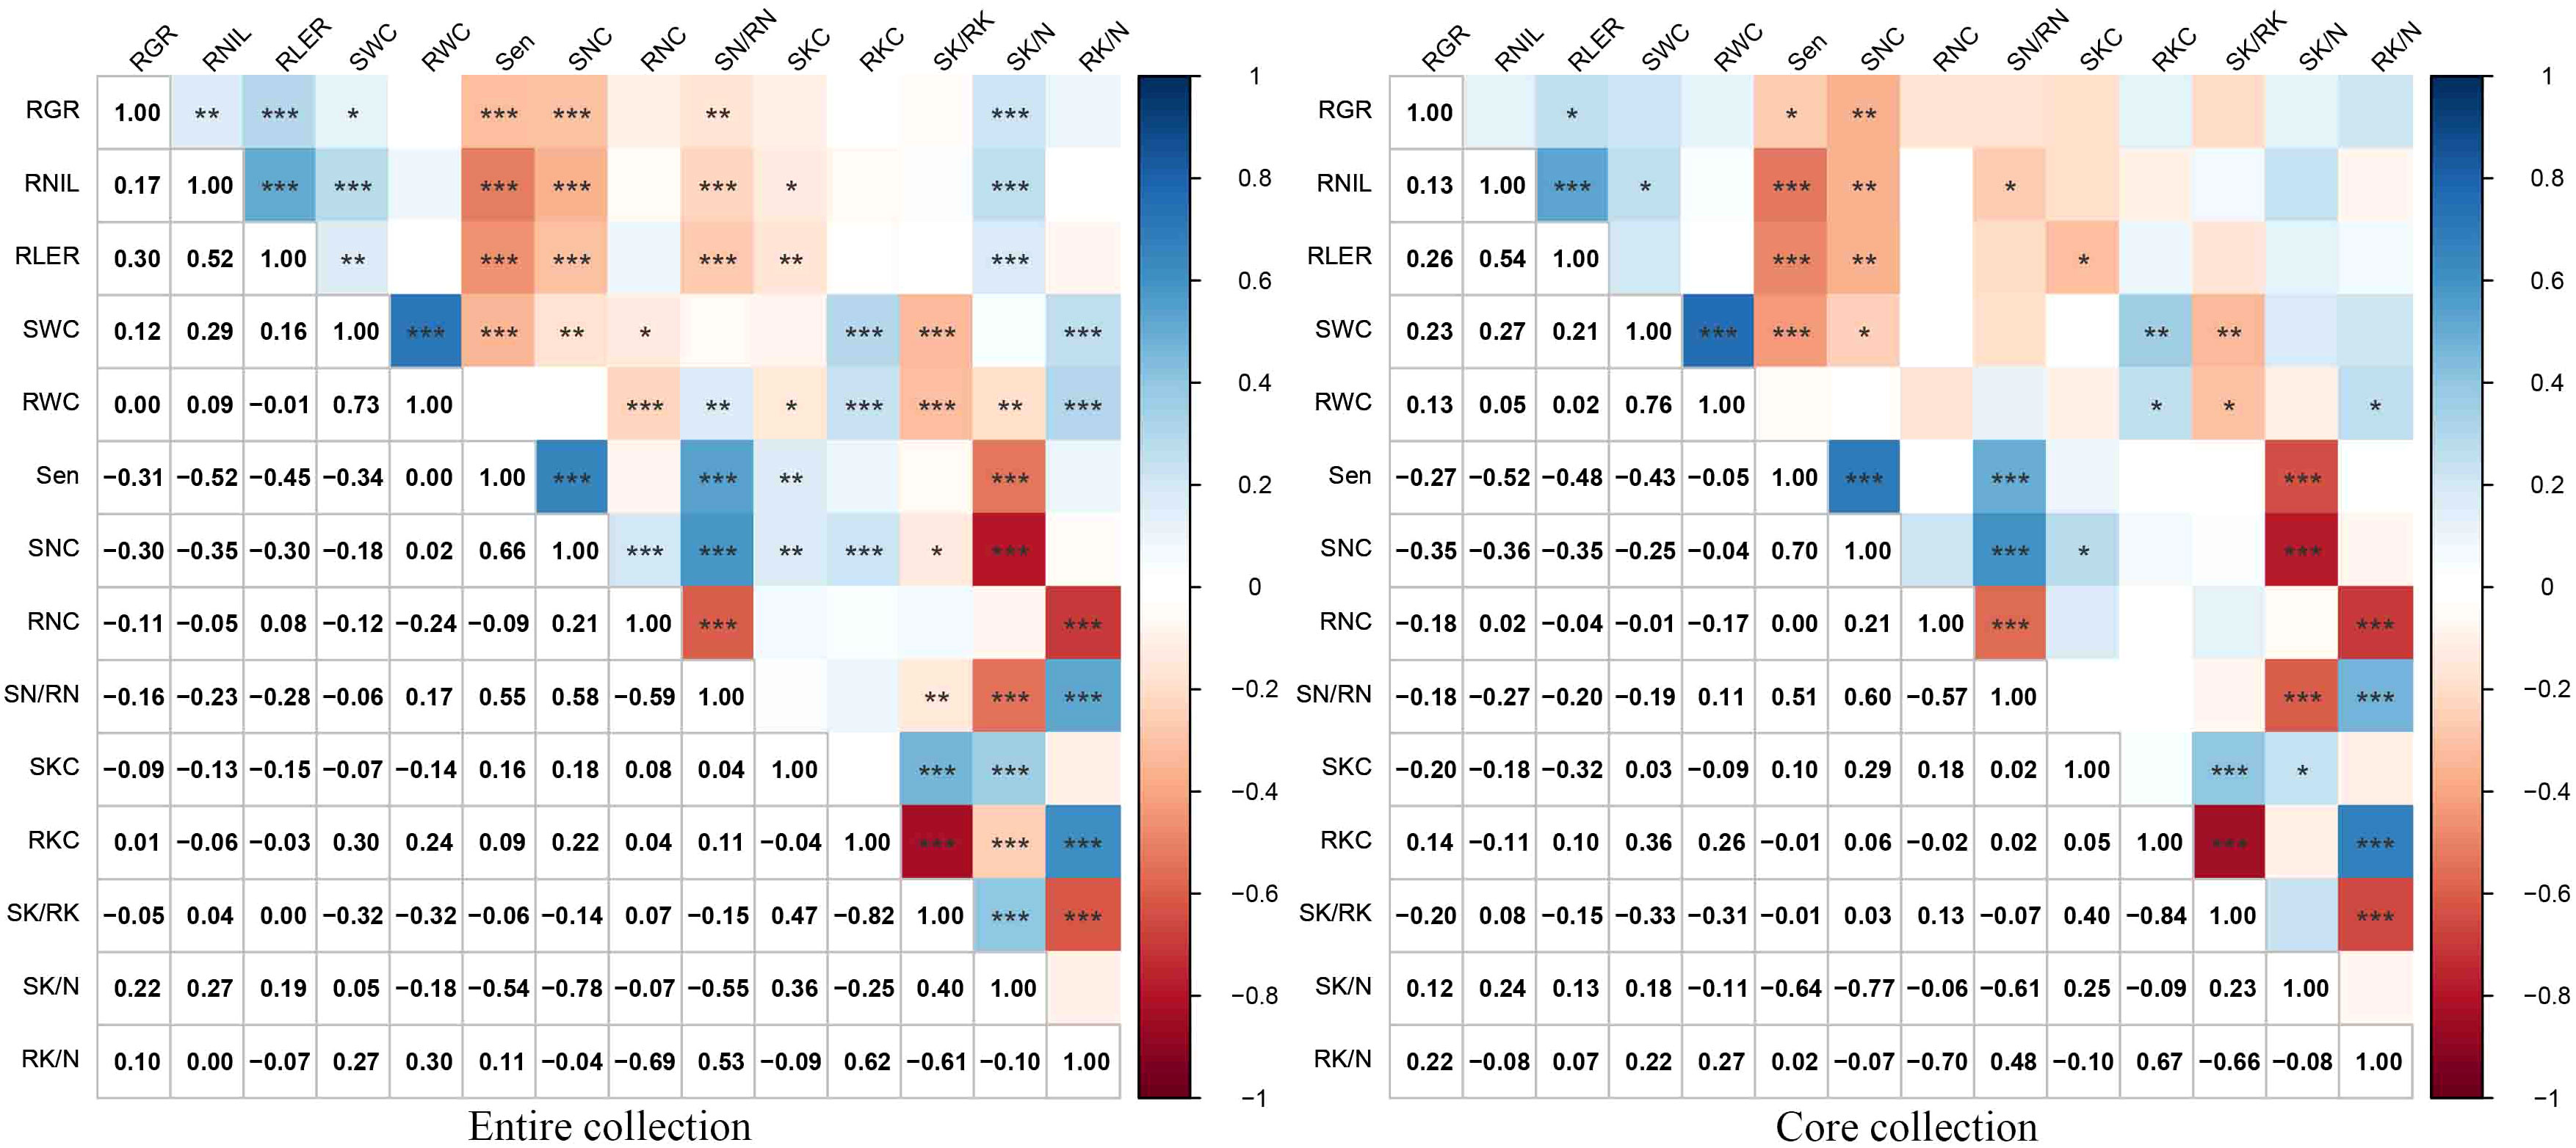
Figure 5 Pearson correlation analysis between 14 traits of the entire and core collections. *, **, and *** indicate significance at P<0.05, P<0.01, and P<0.001, respectively. Salt-tolerance index of leaves increased number (RNIL), salt-tolerance index of leaf expansion rate (RLER), leaf senescence scale (Sen), shoot water content (SWC), root water content (RWC), shoot Na+ concentration (SNC), root Na+ concentration (RNC), the ratio of shoot Na+ concentration to root Na+ concentration (SN/RN), shoot K+ concentration (SKC), root K+ concentration (RKC), the ratio of shoot K+ concentration to root K+ concentration (SK/RK), the ratio of shoot K+ concentration to shoot Na+ concentration (SK/N), and the ratio of root K+ concentration to root Na+ concentration (RK/N).
PCA was used to synthesize these 14 normalized traits. Based on eigenvalues greater than one, five principal components (PCs) were extracted, which accounted for a cumulative variance contribution rate of 81.42% (Table 3, Figure 6). PC1 (27.75%) mainly reflected the effect of 150 mM NaCl stress on RK/N, RKC, SN/RN (positive loading), and SK/RK (negative loading), which are traits related to ion content. PC2 (23.18%) was significantly correlated with the growth traits of SWC, RLER, RNIL (positive loading), and Sen (negative loading) as well as the ion content-related traits of SNC (negative loading). PC3 (12.87%) was primarily associated with RNC, showing a significantly negative loading. PC4 (9.82%) included SWC and RWC, with positive loadings. Finally, PC5 (7.79%) mainly consisted of RLER with a positive loading.
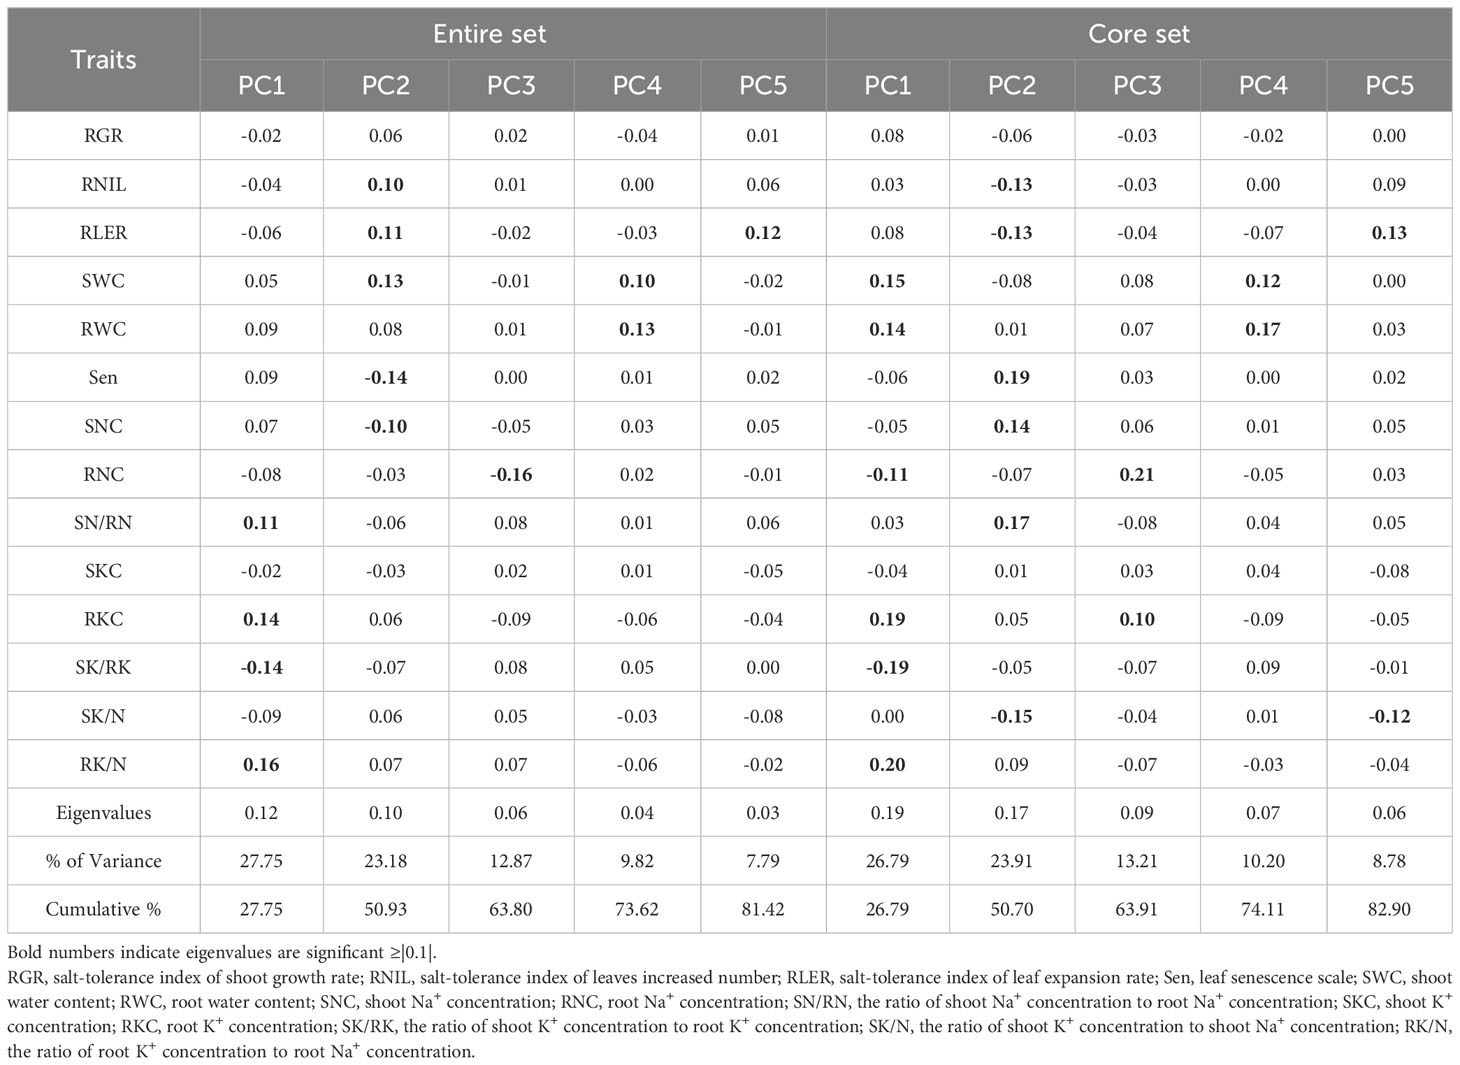
Table 3 Principal component analysis of the entire and core sets showing the contributions of each trait to the variation in the germplasm.
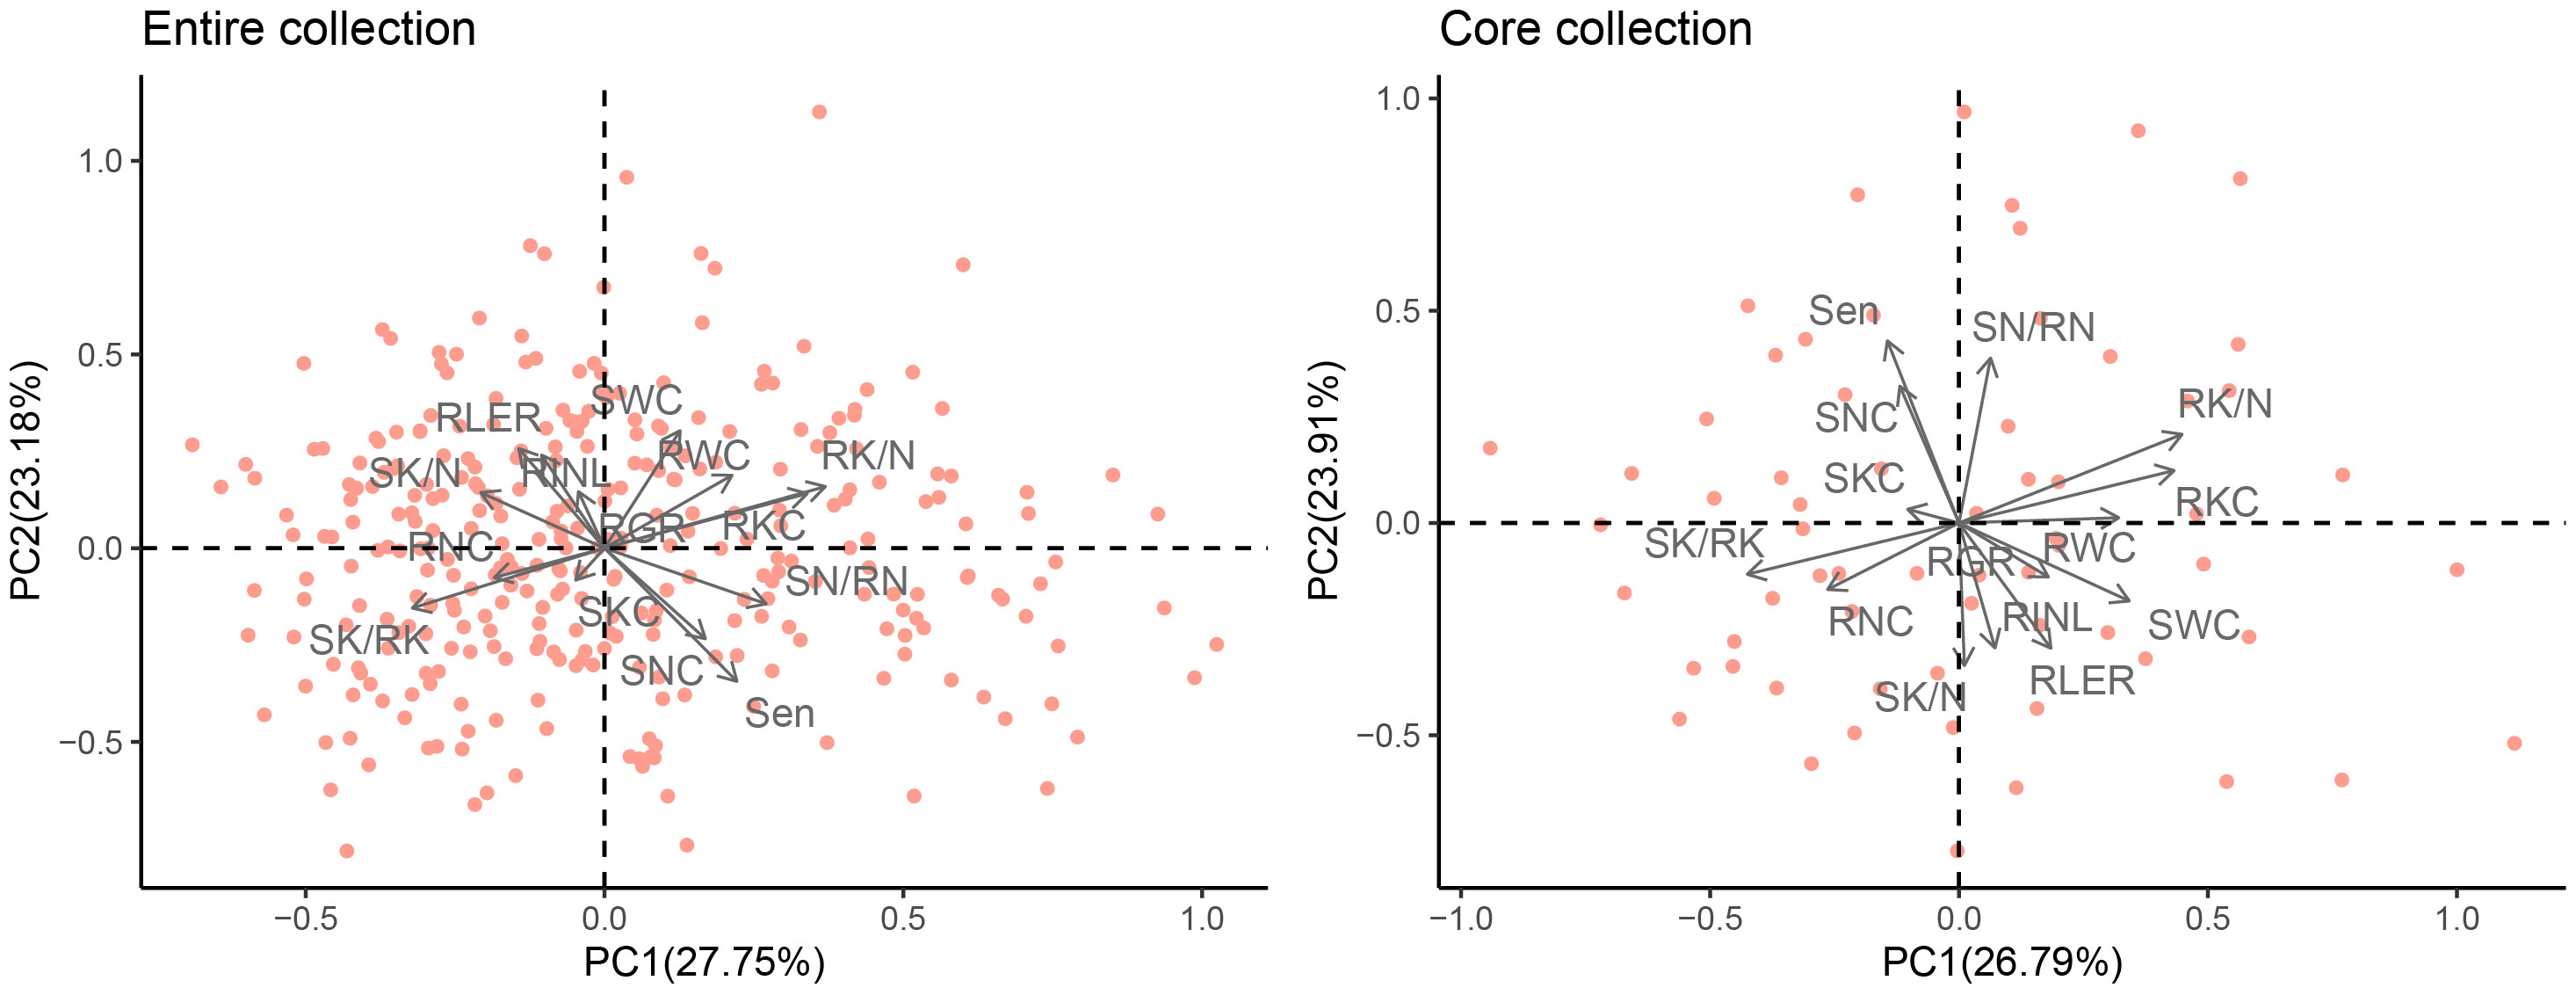
Figure 6 Principal component analysis plot of the entire and mini-core sets of M. sacchariflorus and M. lutarioriparius based on 14 traits. The angles captained by any of the two arrows less than 90° imply the two indices have a positive correlation, otherwise they represent a negative correlation between the two indices. Salt-tolerance index of shoot growth rate (RGR), salt-tolerance index of leaves increased number (RNIL), salt-tolerance index of leaf expansion rate (RLER), leaf senescence scale (Sen), shoot water content (SWC), root water content (RWC), shoot Na+ concentration (SNC), root Na+ concentration (RNC), the ratio of shoot Na+ concentration to root Na+ concentration (SN/RN), shoot K+ concentration (SKC), root K+ concentration (RKC), the ratio of shoot K+ concentration to root K+ concentration (SK/RK), the ratio of shoot K+ concentration to shoot Na+ concentration (SK/N), and the ratio of root K+ concentration to root Na+ concentration (RK/N).
Based on the results of the pre-experiment for the ten genotypes and the subsequent correlation analysis, it was found that Sen, SNC, RNC, SN/RN, SKC, and RKC exhibited higher levels under salt stress than under the control conditions and that these traits showed a negative correlation with salt stress (Supplementary Figure S1, Figure 5). Consequently, Equation 2 was employed to calculate the MFV for Sen, SNC, RNC, SN/RN, SKC, and RKC, whereas Equation 1 was used for the remaining eight traits. The mean MFV (D value) was calculated for each genotype (see Supplementary Table S5). Hierarchical cluster analysis based on the D values was used to assess the salt tolerance of 318 M. sacchariflorus and M. lutarioriparius genotypes (Figure 7). Salt tolerance was classified into five levels at a Euclidean distance of 0.12: highly salt tolerant (HST), salt tolerant (ST), moderately salt tolerant (MST), salt sensitive (SS), and highly salt sensitive (HSS). Among the genotypes analyzed, three were classified as HST, 50 as ST, 127 as MST, 117 as SS, and 21 as HSS. Across these categories, a trend was observed whereas the level of salt tolerance decreased from HST to HSS, the values of RGR, RLER, and SK/N decreased, whereas Sen, SNC, RNC, and SN/RN exhibited an increasing trend. Notably, SNC was over two times as high in the HSS group (176.6 mg/g) compared to the HST (72.52 mg/g), as detailed in Supplementary Table S6. Genotypes classified in the higher salt tolerance categories exhibited superior growth characteristics, reduced leaf senescence, and lower Na+ content.
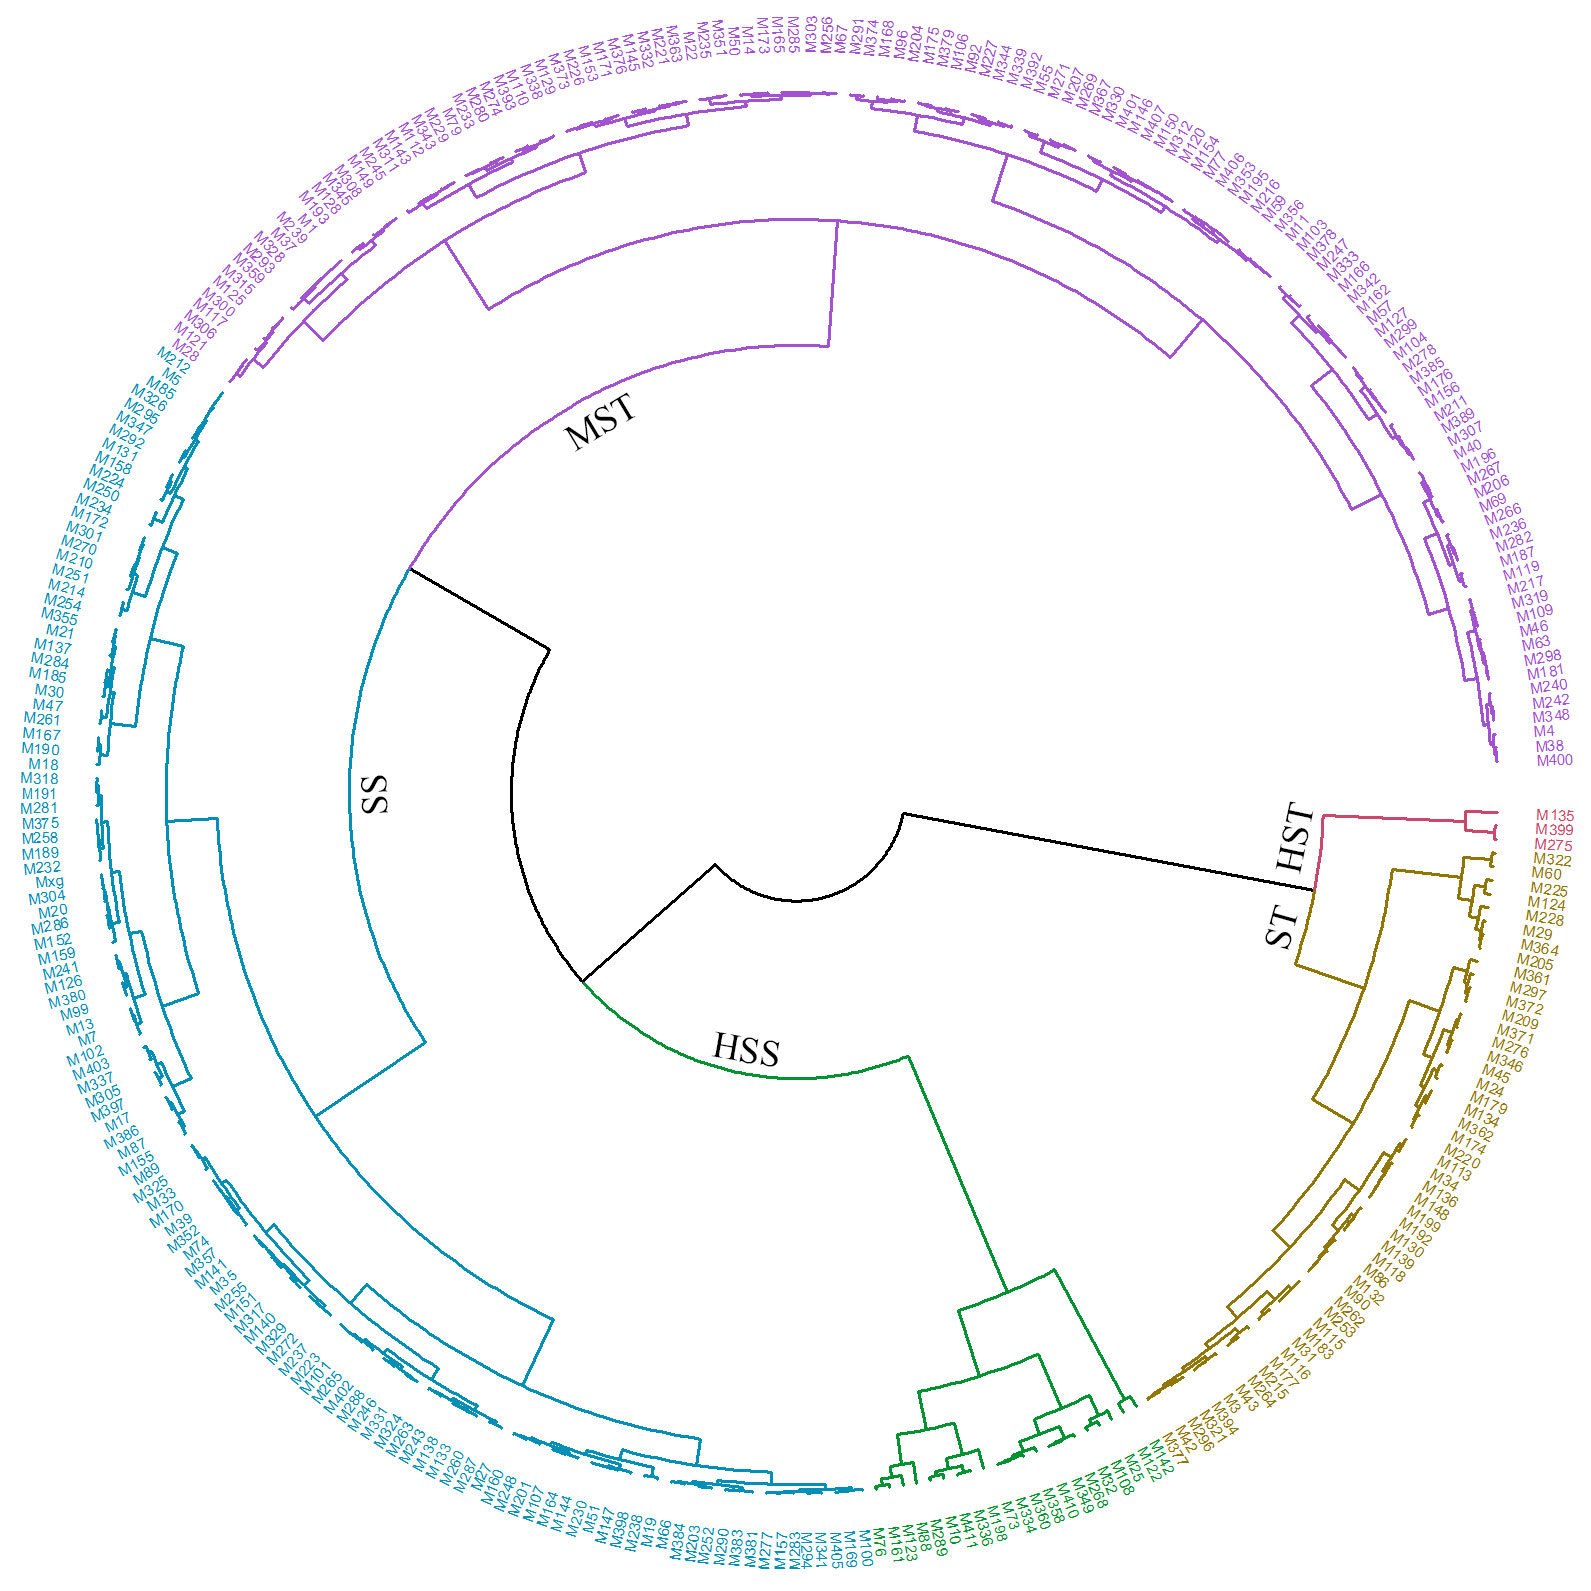
Figure 7 Hierarchical cluster analysis based on the Euclidean distance to evaluate the salt tolerance of 318 M. sacchariflorus and M. lutarioriparius. HST, highly salt tolerant; ST, salt tolerant; MST, moderately salt tolerant; SS, salt sensitive; and HSS, highly salt sensitive.
To screen and evaluate salt tolerance traits in M. sacchariflorus and M. lutarioriparius, the D values of 303 genotypes were used as a dependent variable and the values of the 14 traits as independent variables to develop the most predictive regression equation for salt tolerance. The random error term was 0.6895. The unstandardized coefficients for SNC, RNIL, RWC, RGR, RKC, Sen, and RNC were -0.0012, 0.1242, 0.0057, 0.0516, -0.0023, -0.0202, and -0.0010, respectively. The optimal regression equation is as follows: Y=0.6895-0.0012SNC+0.1242RNIL+0.0057RWC+0.0516RGR-0.0023RKC-0.0202Sen-0.0010RNC (R2 = 0.962, P<0.001) (Table 4).
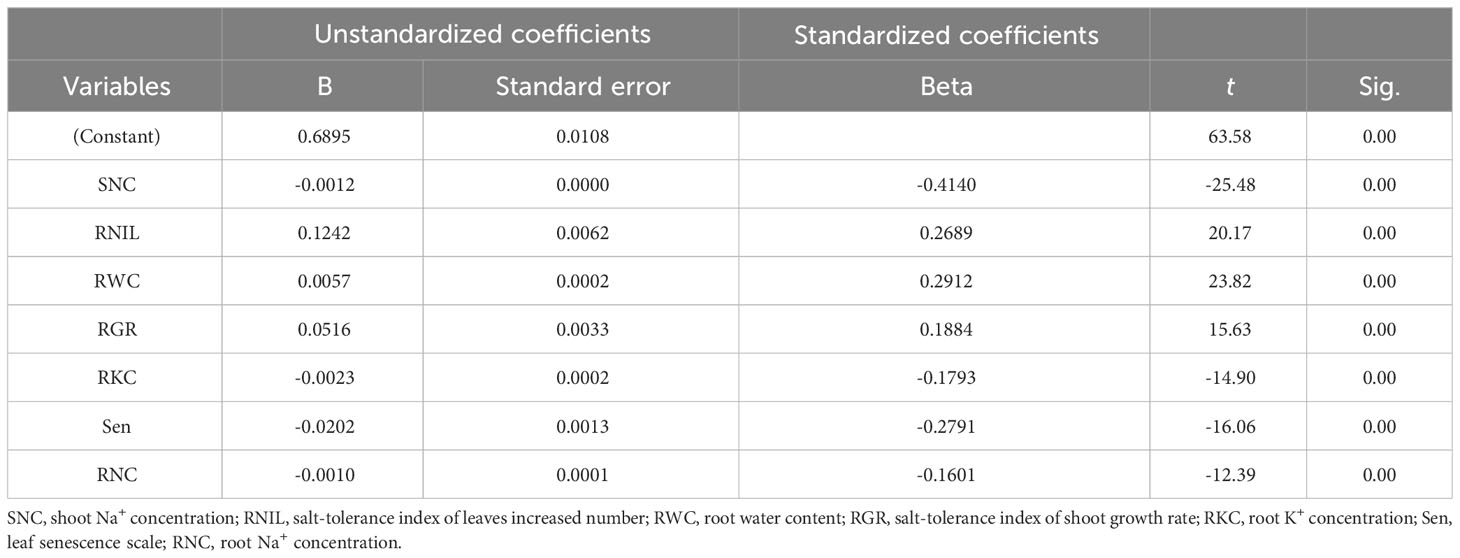
Table 4 Multiple linear regression analysis of the comprehensive evaluation value of salt tolerance (D value) on seven traits.
To verify the predictability of the mathematical evaluation model for salt tolerance in M. sacchariflorus and M. lutarioriparius, three genotypes from each cluster were randomly selected and their corresponding Y values were calculated (Table 5). These results demonstrated that this formula can effectively evaluate the salt tolerance of M. sacchariflorus and M. lutarioriparius at the seedling stage. For instance, for genotype M411 which was classified as HSS, it had a Y value of 0.3167 (Y= 0.6895-0.0012*177.6243 + 0.1242*0.2667 + 0.0057*8.4277 + 0.0516*0.0350-0.0023*29.2614-0.0202*7.0000-0.0010*33.9501), which closely matched its D value of 0.317; for genotype M333 which was categorized as MST, it had a Y value of 0.4496, aligning well with its D value of 0.4513; for genotype M135 which was under the HST group, its Y value is 0.6504, which is very close to its D value of 0.6528. The close correspondence between the D and Y values indicates the reliability of our model and its applicability in predicting salt tolerance in M. sacchariflorus and M. lutarioriparius at the seedling stage.
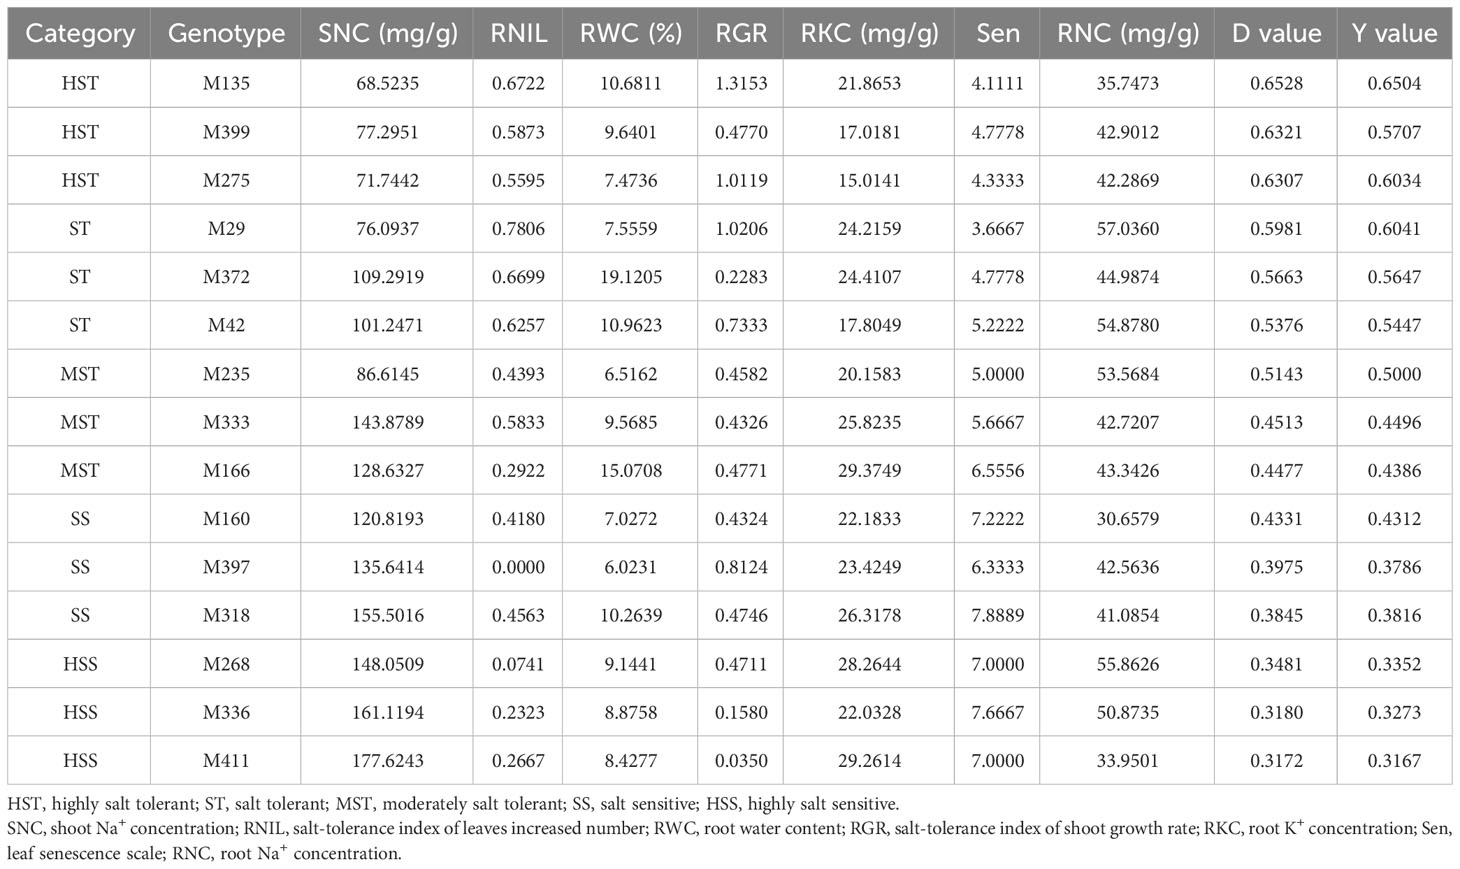
Table 5 Verification of salinity tolerance values (Y value) from multiple regression analysis with the comprehensive evaluation value of salt tolerance (D value).
The mini-core collection displayed strong representativeness of the entire collection, as determined by the Core Hunter algorithm. Of the 318 genotypes used for the entire collection, 64 (20%) were selected to constitute the mini-core collection (Supplementary Table S4). The CR % was high for all studied traits except for RWC and RNC, which fell slightly below 80%. CR % values were 100% for Sen, SNC, and RK/N. The mean CR % was calculated to be 94.28% (Table 6). The VR % values for all studied traits were high, ranging from 101.32% for RWC to 175.87% for RGR, with an average VR % value of 141.16. The highest and lowest VD % values were observed for the RGR and RWC, respectively. The MD % analysis indicated a minimal difference (0.18-8.69%) between the mini-core and entire collections for all the traits. The Newman-Keuls test and Wilcoxon rank-sum test showed no significant differences in the means and medians between the entire and core collections for the studied traits. Furthermore, Levene’s test results indicated that there were no significant differences (P>0.05) between the core and entire collections for all traits except RGR, SN/RN, and RK/N, demonstrating that the central tendency and variability of phenotypic traits in the mini-core collection closely matched those in the entire collection. The Shannon-Weaver diversity index, which measures the diversity of individual phenotypic traits, ranged from 3.97 to 4.15 in the mini-core collection and from 5.63 to 5.76 in the entire collection, averaging 4.10 and 5.72, respectively. These results imply a moderate loss of diversity, about 28.32%, in the core collection, which could be attributed to missing genetic data.
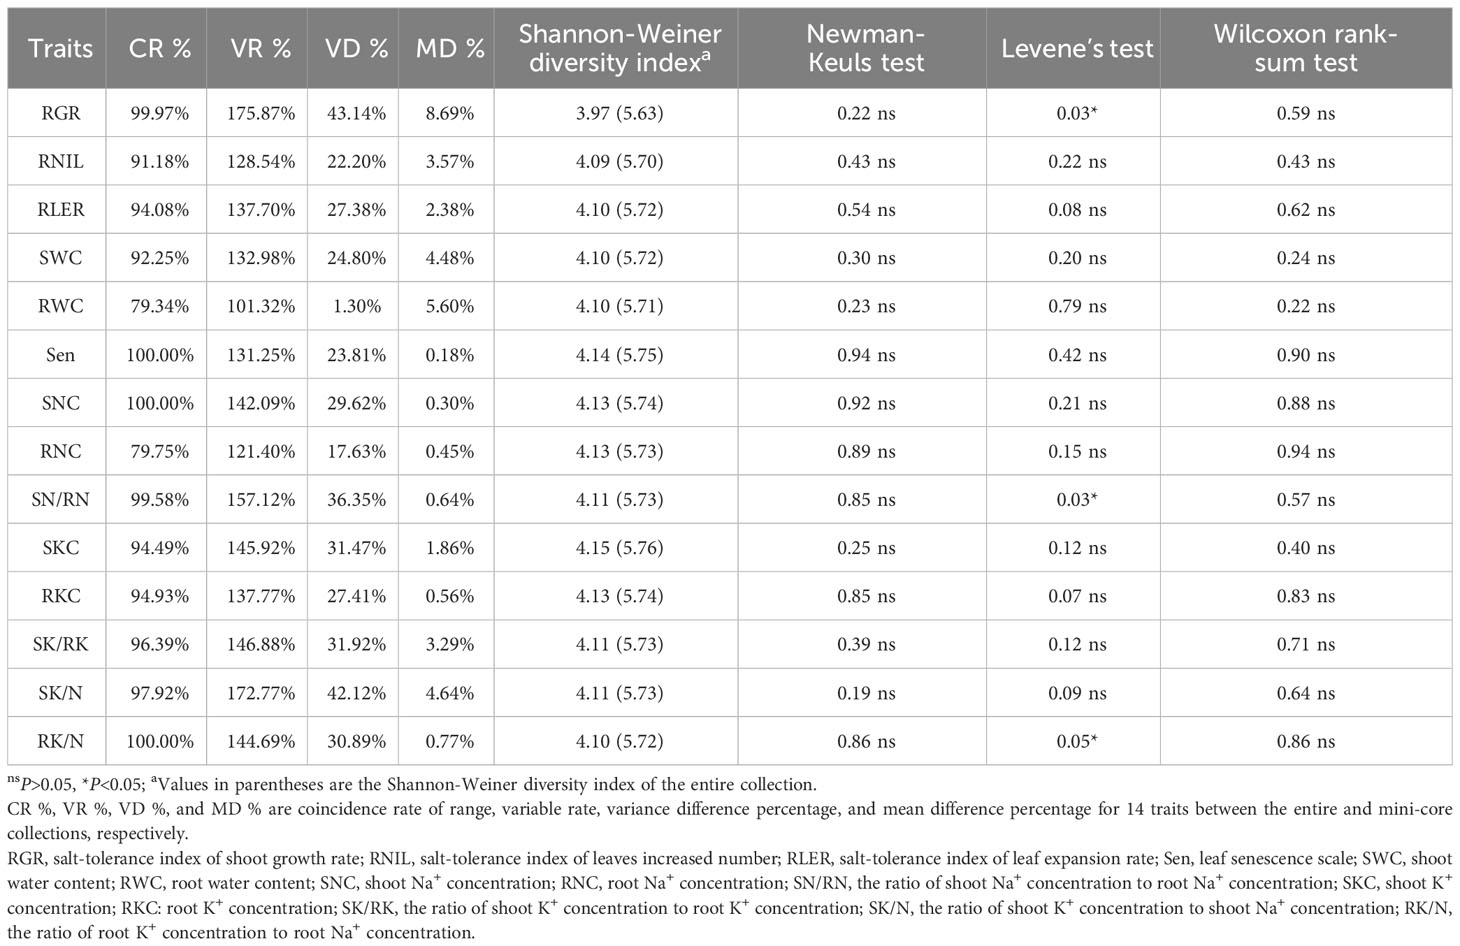
Table 6 Evaluation parameters of the core collection.
In the mini-core collection of M. sacchariflorus and M. lutarioriparius, significant positive correlations were observed between SWC and RWC (r=0.76, r=0.73 in the entire set), as well as between Sen and SNC (r=0.70, r=0.66 in the entire set). Additionally, significant positive correlations were found between SKC and SNC, whereas the correlation between RKC and SNC was insignificant. Sen exhibited a significantly negative correlation with RNIL (r=-0.52, r=-0.52 in the entire set) and RLER (r=-0.48, r=-0.45 in the entire set). The correlation trends between traits in the core set resembled those observed in the entire set (Figure 5). Furthermore, the PCA conducted on the core set resulted in the extraction of five PCs, which explained 82.90% of the total variation in the mini core set. PC1, PC2, PC3, PC4, and PC5 accounted for 26.79%, 23.91%, 13.21%, 10.20%, and 8.78% of total variation, respectively (Table 3). PC1 displayed significant correlations with RK/N, RKC, SWC, RWC (positive loading), SK/RK and RNC (negative loading), whereas PC2 primarily included Sen, SN/RN and SNC with a positive loading, and SK/N, RNIL and RLER with a negative loading (Figure 6). These values were comparable to those obtained for the entire set.
The susceptibility of plants to environmental conditions during the seedling stage highlights the importance of evaluating salt tolerance based on plant responses at the seedling stage as a crucial screening criterion. However, the genetic diversity of salt tolerance in these species remains largely unknown due to the self- incompatibility of Miscanthus (Jiang et al., 2017) and the high heterozygosity of their genetic background. This complicated the use of plants at the seedling stage for stress experiments in subsequent genomic studies, as it is costly to obtain plants through asexual propagation (O’Loughlin et al., 2018). Previous studies by Chen et al. (2017) explored salt tolerance of 70 Miscanthus genotypes at the seedling stage (including 57 M. sinensis, 5 M. sacchariflorus, and 8 hybrids) using an indoor hydroponic system. The present study represents the first attempt to assess the genetic diversity of salt tolerance in M. sacchariflorus and M. lutarioriparius at the seedling stage using a large sample size of 318 genotypes. Our methodology involved planting rhizomes, each with 1-2 buds of a specific genotype, in plug trays prior to stress application. Hydroponics offer a favorable alternative for maintaining consistent screening conditions within a large population by providing uniform root environments and accommodating a high capacity of different genotypes (Tavakkoli et al., 2012; Nguyen et al., 2013). Single plants of similar heights from each genotype were selected and transferred to a homemade hydroponic setup after thorough root cleaning to ensure the uniformity of the tested plant materials. It is reported that employing such a similar system has allowed for successful assessment of salt tolerance and cadmium accumulation in different rapeseed germplasms, with related QTLs identified (Wan et al., 2017; Chen et al., 2018). Moreover, to account for the inherent differences among genotypes, our methodology also adopted the usage of relative values of growth traits, a widely-used approach (Wu et al., 2019; Luo et al., 2021), to evaluate the performance of different M. sacchariflorus and M. lutarioriparius genotypes under salt stress.
Studies have demonstrated that high concentrations of soil salts damage plants by causing ion (mainly Na+) toxicity and osmotic stress (Munns and Tester, 2008). Therefore, osmotic tolerance and ion exclusion need to be considered together when improving salt tolerance in plants (Genc et al., 2010). Low Na+ concentrations in shoots have been successfully used as selection criteria for breeding salt-tolerant cultivars of durum wheat (Munns et al., 2012), barley (Nguyen et al., 2013), and rice (Lin et al., 2004). Our results indicated that salt-tolerant genotypes exhibited significantly lower SNC, which is consistent with previous studies on salt tolerance in M. sinensis (Sun et al., 2014; Chen et al., 2017; Sun et al., 2021), M. × giganteus (Plazek et al., 2014; Stavridou et al., 2020), and polyploid M. lutarioriparius (Duan et al., 2018). These findings suggested that the mechanisms of Na+ exclusion utilized to improve salt tolerance in cereals were also employed by M. sacchariflorus and M. lutarioriparius. Notably, our study revealed that two genotypes (M283 and M349) exhibited lower Sen and higher RGR, RNIL, RLER, and SWC despite having high shoot Na+ concentrations. This observation may indicate the existence of a tissue tolerance mechanism, with Na+ being compartmentalized within vacuoles to prevent toxic concentrations in the cytoplasm (Munns and James, 2003).
However, under salt stress, high Na+ concentrations interfere with K+ uptake and function (Shabala and Cuin, 2008). Maintaining a high K+ concentration is another important mechanism in response to relatively high Na+ levels under salt stress (Munns and James, 2003; Krishnamurthy et al., 2007). In the present study, the evaluation of ten genotypes based on different salt concentrations showed that most genotypes had higher SKC and RKC under salt stress than under the control. Moreover, our evaluation of 318 genotypes under 150 mM NaCl revealed that genotypes with high Na+ concentrations displayed higher K+ concentrations than those with low Na+ concentrations. These results can be attributed to the adaptive response of M. sacchariflorus and M. lutarioriparius to excessive Na+ levels in their surrounding environments, leading to increased uptake and transport of K+ possibly through the enhanced activity of K+ channels in the cell membrane and transporter proteins. This response allows the maintenance of stable levels of intracellular K+ and Na+, ultimately enabling normal growth and metabolic functions. Previous studies have reported a higher K+ content under salt stress than under the control in M. × giganteus (Plazek et al., 2014; Stavridou et al., 2020) and polyploid M. lutarioriparius (Duan et al., 2018). Plazek et al. (2014) concluded that a high accumulation of K+ in leaves reduces the Na+ effect and determines the salinity tolerance of Miscanthus. Our study showed a strong positive correlation between the ability of plants to retain K+ after exposure to NaCl and salinity tolerance, which is consistent with previous reports in a wide range of plants, including wheat (Cuin et al., 2008), Hami melon (Xiong et al., 2018), Nitraria sibirica (Tang et al., 2018), pumpkin (Huang et al., 2019) and Puccinellia nuttalliana (Vaziriyeganeh et al., 2022).
The stress resistance capacity of plants results from their responses to adverse environmental conditions and long-term evolution. As it is a quantitative trait controlled by multiple genes, using a single index to evaluate the stress resistance of plants is unreliable. For a more comprehensive assessment of plant stress resistance, employing multidimensional indices is considered more scientifically sound (Wu et al., 2019; Weng et al., 2021). Membership function analysis has gained a wider use in recent years for evaluating plant stress tolerance in that it addresses the limitations of selecting plant varieties based on a single index (Wassie et al., 2019; Weng et al., 2021; Wang et al., 2023). In the present study, through membership function analysis, 14 individual indicators were integrated into a comprehensive evaluation index of salt tolerance (D value) for different genotypes of M. sacchariflorus and M. lutarioriparius at the seedling stage, with a higher D value indicating stronger salt tolerance ability. Cluster analysis based on the D value would lead to a more objective selection of three HST, 50 ST, 127 MST, 117 SS and 21 HSS genotypes. This outcome diverges from what would be obtained if any single indicator were used, suggesting that salt tolerance evaluation of M. sacchariflorus and M. lutarioriparius could not rely on a single indicator. All genotypes of M. sacchariflorus and M. lutarioriparius were evaluated for salt tolerance for the first time. Further studies are needed to compare differences in physiological indicators among genotypes of M. sacchariflorus and M. lutarioriparius with different salt tolerance levels and their performance in saline soils. Our findings may provide materials with extreme salt tolerance for further studies on the mechanisms of M. sacchariflorus and M. lutarioriparius in response to salt stress using comparative transcriptome and selective sweep analysis.
Determining the salt tolerance of one or some M. sacchariflorus and M. lutarioriparius genotypes is challenging without a large number of other genotypes for comparison. Assessing 14 traits and calculating the D value for salt tolerance evaluation is laborious and complicated. To evaluate the salt tolerance of M. sacchariflorus and M. lutarioriparius in a more convenient and reliable manner, a mathematical evaluation model for the salt tolerance was established using multiple regression analysis. The larger the Y value, the higher the salt tolerance. As a result, it is only necessary to measure seven traits: SNC, RNIL, RWC, RGR, RKC, Sen, and RNC to calculate the Y value for estimating salt tolerance in any genotypes of M. sacchariflorus and M. lutarioriparius. To our best knowledge, this is the first time a mathematical evaluation model is established to predict the salt tolerance of M. sacchariflorus and M. lutarioriparius during the seedling stage.
This study represents a pioneering effort to establish a core collection for the salt tolerance of M. sacchariflorus and M. lutarioriparius at the seedling stage. The salt-tolerant traits used were able to generate a mini-core collection that captured the full range of trait variability that existed in the entire collection. This provides the foundation for studying the salt tolerance mechanism through marker-trait associations, which is essential for the conservation of genetic resources and the breeding of salt-tolerant M. sacchariflorus and M. lutarioriparius lines.
The mini-core collection constituted approximately 20% of the evaluated entire collection, falling within the recommended size range of 10% to 30% for a well-representative core collection (Tchokponhoue et al., 2020; Uba et al., 2023). Additionally, a mini-core collection with a CR % exceeding 80% is deemed suitable for breeding (Hu et al., 2000). High values of VR % and VD % indicate the successful preservation of diversity from the entire set in the core set (Mahmoodi et al., 2019). The MD % for all studied traits was below 20%, indicating that the mini-core collection effectively represented the entire collection. Notably, no significant differences were observed between the core and entire collections in terms of means, variances (for all traits except for RGR, SN/RN, and RK/N), and medians, further validating the representativeness of the mini-core collection.
When establishing a core set, it is crucial to preserve the phenotypic associations within the entire collection to maintain co-adapted genetic complexes and enable efficient germplasm utilization (Tripathi et al., 2022). The results of the Pearson’s correlation analysis for the 14 traits showed that the correlation coefficients between all combinations of traits remained similar in both the core and entire sets. This preservation of trait associations in the core set aligns with findings from previous studies on core collection development in various crops, such as turnips (Li et al., 2021), wheat (Phogat et al., 2021), mustards (Nanjundan et al., 2022), and lentils (Tripathi et al., 2022). Furthermore, five PCs were identified in the core and entire sets, which collectively explained 82.90% and 81.42% of the total variation, respectively. This indicates that the mini-core collection established in this study effectively represents the overall variability of the entire collection. The use of PCA to assess the spatial distribution of entries and to explain the variance serves as an exploratory criterion for evaluating the core set, as has been reported in previous studies (Li et al., 2021; Tripathi et al., 2022).
This study established that the optimal NaCl concentration for evaluating the salt tolerance of M. sacchariflorus and M. lutarioriparius is 150 mM. Significant genotype-dependent differences in salt tolerance were observed at the seedling stage in both species. M. sacchariflorus and M. lutarioriparius adapt to salt stress by regulating ion homeostasis primarily through enhanced K+ uptake, shoot Na+ exclusion, and Na+ sequestration in shoot vacuoles. A total of 318 genotypes were evaluated, resulting in the identification of three HST, 50 ST, 127 MST, 117 SS, and 21 HSS genotypes of M. sacchariflorus and M. lutarioriparius at the seedling stage. A mathematical evaluation model was proposed to assess salt tolerance by using fourteen traits in the 318 M. sacchariflorus and M. lutarioriparius genotypes, leading to the development of a representative mini core set of 64 genotypes. These findings significantly contribute to the evaluation and breeding of salt-tolerant M. sacchariflorus and M. lutarioriparius. Moreover, these also provide valuable resources for an in-depth understanding of the adaptive mechanisms and molecular regulatory networks of M. sacchariflorus and M. lutarioriparius in response to salt stress, thereby offering scientific support for future efforts to enhance salt tolerance and improve stress resilience in plants. This study is of great implication for the utilization and improvement of marginal lands.
The original contributions presented in the study are included in the article/Supplementary Material. Further inquiries can be directed to the corresponding authors.
YT: Conceptualization, Data curation, Formal Analysis, Investigation, Methodology, Software, Visualization, Writing – original draft, Writing – review & editing. SL: Investigation, Software, Writing – original draft. DZ: Writing – review & editing. ZZ: Writing – review & editing. SY: Resources, Writing – original draft. XZ: Writing – review & editing. SX: Resources, Writing – original draft. XK: Writing – review & editing. ML: Methodology, Writing – original draft. XH: Investigation, Writing – original draft. ZY: Conceptualization, Funding acquisition, Resources, Writing – review & editing. LX: Project administration, Supervision, Writing – review & editing, Writing – original draft.
The author(s) declare financial support was received for the research, authorship, and/or publication of this article. This research was supported by the National Natural Science Foundation of China (Grant No. 31871693) and Foundation for the Construction of Innovative Hunan (Grant No. 2019NK2011).
The authors thank Jian Tang, Hongge Qian, Weihong Du, Peng Zhu, Ning Peng, Songtao Guo, Miaomiao Peng, Jie Li, Manti Li, Tianzhuo Fu, Lan Gu, Xianghui Li, and Kejia Zhu for their assistance with experiments. We also thank the reviewers.
Author XH is employed by Hunan Heyi Crop Science Co., Ltd., Changsha, Hunan, China.
The remaining authors declare that the research was conducted in the absence of any commercial or financial relationships that could be construed as a potential conflict of interest.
All claims expressed in this article are solely those of the authors and do not necessarily represent those of their affiliated organizations, or those of the publisher, the editors and the reviewers. Any product that may be evaluated in this article, or claim that may be made by its manufacturer, is not guaranteed or endorsed by the publisher.
The Supplementary Material for this article can be found online at: https://www.frontiersin.org/articles/10.3389/fpls.2024.1364826/full#supplementary-material
Aravind, J., Kaur, V., Wankhede, D. P., Nanjundan, J. (2022). EvaluateCore: Quality Evaluation of Core Collections (R package version 0.1.3). Available at: https://aravind-j.github.io/EvaluateCore/, https://CRAN.R-project.org/package=EvaluateCore.
Ashraf, M. Y., Awan, A. R., Mahmood, K. (2012). Rehabilitation of saline ecosystems through cultivation of salt tolerant plants. Pak. J. Bot. 44, 69–75.
Chen, C.-L., van der Schoot, H., Dehghan, S., Kamei, C. L. A., Schwarz, K.-U., Meyer, H., et al. (2017). Genetic diversity of salt tolerance in Miscanthus. Front. Plant Sci. 8. doi: 10.3389/fpls.2017.00187
Chen, L. L., Wan, H. P., Qian, J. L., Guo, J. B., Sun, C. M., Wen, J., et al. (2018). Genome-wide association study of cadmium accumulation at the seedling stage in rapeseed (Brassica napus L.). Front. Plant Sci. 9. doi: 10.3389/fpls.2018.00375
Cuin, T. A., Betts, S. A., Chalmandrier, R., Shabala, S. (2008). A root’s ability to retain K+ correlates with salt tolerance in wheat. J. Exp. Bot. 59, 2697–2706. doi: 10.1093/jxb/ern128
De Beukelaer, H., Davenport, G. F., Fack, V. (2018). Core Hunter 3, flexible core subset selection. BMC Bioinform. 19, 203. doi: 10.1186/s12859-018-2209-z
Duan, J. Y., Shi, Y. L., Lin, Y. H., Huang, H. M., Liu, Q. B., Yi, Z. L., et al. (2018). Characteristics of inorganic salt ion absorption of Miscanthus lutarioriparius polyploid under NaCl stress. Pratacultural Sci. 35, 2893–2902. doi: 10.11829/j.issn.1001-0629.2018-0432
FAO. Global Soil Partnership (2021) World map of salt-affected soils launched at virtual conference. Available online at: https://www.fao.org/global-soil-partnership/resources/highlights/detail/en/c/1445579/ (Accessed October 20, 2021).
Flowers, T. J. (2004). Improving crop salt tolerance. J. Exp. Bot. 55, 307–319. doi: 10.1093/jxb/erh003
Genc, Y., Oldach, K., Verbyla, A. P., Lott, G., Hassan, M., Tester, M., et al. (2010). Sodium exclusion QTL associated with improved seedling growth in bread wheat under salinity stress. Theor. Appl. Genet. 121, 877–894. doi: 10.1007/s00122-010-1357-y
Gower, J. C. (1971). A general coefficient of similarity and some of its properties. Biometrics 27, 857–871. doi: 10.2307/2528823
Guo, Y. Y., Kuang, L. H., Xu, Y., Yan, T., Jiang, L. X., Dong, J., et al. (2022). Construction of a worldwide core collection of rapeseed and association analysis for waterlogging tolerance. Plant Growth Regul. 98, 321–328. doi: 10.1007/s10725-022-00862-5
Hu, J., Zhu, J., Xu, H. M. (2000). Methods of constructing core collections by stepwise clustering with three sampling strategies based on the genotypic values of crops. Theor. Appl. Genet. 101, 264–268. doi: 10.1007/s001220051478
Huang, Y., Cao, H. S., Yang, L., Chen, C., Shabala, L., Xiong, M., et al. (2019). Tissue-specific respiratory burst oxidase homolog-dependent H2O2 signaling to the plasma membrane H+-ATPase confers potassium uptake and salinity tolerance in Cucurbitaceae. J. Exp. Bot. 70, 5879–5893. doi: 10.1093/jxb/erz328
Jiang, J. X., Guan, Y. F., McCormick, S., Juvik, J., Lubberstedt, T., Fei, S. Z. (2017). Gametophytic self-incompatibility is operative in Miscanthus sinensis (Poaceae) and is affected by pistil age. Crop Sci. 57, 1948–1956. doi: 10.2135/cropsci2016.11.0932
Keuls, M. (1952). The use of the studentized range in connection with an analysis of variance. Euphytica 1, 112–122. doi: 10.1007/BF01908269
Kim, K. W., Chung, H. K., Cho, G. T., Ma, K. H., Chandrabalan, D., Gwag, J. G., et al. (2007). PowerCore, a program applying the advanced M strategy with a heuristic search for establishing core sets. Bioinformatics 16, 2155–2162. doi: 10.1093/bioinformatics/btm313
Krishnamurthy, L., Serraj, R., Hash, C. T., Dakheel, A. J., Reddy, B. V. S. (2007). Screening sorghum genotypes for salinity tolerant biomass production. Euphytica 156, 15–24. doi: 10.1007/s10681-006-9343-9
Levene, H. (1960). ““Robust tests for equality of variances,”,” in contributions to probability and statistics, essays in honor of harold hoteling. Ed. Olkin, I. (Stanford University Press, Stanford, CA), 278–292.
Li, R. R., Zhou, F. Y., Gao, Y. Y., Liu, C. L., Yu, S. B., Zhao, K., et al. (2021). Genetic diversity and primary core collection construction of turnip (Brassica rapa L. ssp. rapifera Matzg) landraces in tibet revealed via morphological and SSR markers. Agron. J. 11, 1901. doi: 10.3390/agronomy11101901
Lin, H. X., Zhu, M. Z., Yano, M., Gao, J. P., Liang, Z. W., Su, W. A., et al. (2004). QTLs for Na+ and K+ uptake of the shoots and roots controlling rice salt tolerance. Theor. Appl. Genet. 108, 253–260. doi: 10.1007/s00122-003-1421-y
Luo, M. J., Zhang, Y. X., Li, J. N., Zhang, P. P., Chen, K., Song, W., et al. (2021). Molecular dissection of maize seedling salt tolerance using a genome-wide association analysis method. Plant Biotechnol. J. 19, 1937–1951. doi: 10.1111/pbi.13607
Mahmoodi, R., Dadpour, M. R., Hassani, D., Zeinalabedini, M., Vendramin, E., Micali, S., et al. (2019). Development of a core collection in Iranian walnut (Juglans regia L.) germplasm using the phenotypic diversity. Sci. Hortic. 249, 439–448. doi: 10.1016/j.scienta.2019.02.017
Munns, R. (2005). Genes and salt tolerance, bringing them together. New Phytol. 167, 645–663. doi: 10.1111/j.1469-8137.2005.01487.x
Munns, R., Gilliham, M. (2015). Salinity tolerance of crops - what is the cost? New Phytol. 208, 668–673. doi: 10.1111/nph.13519
Munns, R., James, R. A. (2003). Screening methods for salinity tolerance, a case study with tetraploid wheat. Plant Soil. 253, 201–218. doi: 10.1023/A:1024553303144
Munns, R., James, R. A., Xu, B., Athman, A., Conn, S. J., Jordans, C., et al. (2012). Wheat grain yield on saline soils is improved by an ancestral Na+ transporter gene. Nat. Biotechnol. 30, 360–364. doi: 10.1038/nbt.2120
Munns, R., Tester, M. (2008). Mechanisms of salinity tolerance. Annu. Rev. Plant Biol. 59, 651–681. doi: 10.1146/annurev.arplant.59.032607.092911
Nanjundan, J., Aravind, J., Radhamani, J., Singh, K. H., Kumar, A., Thakur, A. K., et al. (2022). Development of Indian mustard [Brassica juncea (L.) Czern.] core collection based on agro-morphological traits. Genet. Resour. Crop Evol. 69, 145–162. doi: 10.1007/s10722-021-01211-7
Newman, D. (1939). The distribution of range in samples from a normal population expressed in terms of an independent estimate of standard deviation. Biometrika 31, 20–30. doi: 10.1093/biomet/31.1-2.20
Nguyen, V. L., Ribot, S. A., Dolstra, O., Niks, R. E., Visser, R. G. F., van der Linden, C. G. (2013). Identification of quantitative trait loci for ion homeostasis and salt tolerance in barley (Hordeum vulgare L.). Mol. Breed. 31, 137–152. doi: 10.1007/s11032-012-9777-9
O’Loughlin, J., McDonnell, K., Finnan, J. (2018). Quantifying the economic and greenhouse gas balance advantages of establishing Miscanthus from stem cuttings. Biomass Bioenergy 109, 147–154. doi: 10.1016/j.biombioe.2017.12.010
Phogat, B. S., Kumar, S., Kumari, J., Kumar, N., Pandey, A. C., Singh, T. P., et al. (2021). Characterization of wheat germplasm conserved in the Indian National Genebank and establishment of a composite core collection. Crop Sci. 61, 604–620. doi: 10.1002/csc2.20285
Plazek, A., Dubert, F., Koscielniak, J., Tatrzanska, M., Maciejewski, M., Gondek, K., et al. (2014). Tolerance of Miscanthus × giganteus to salinity depends on initial weight of rhizomes as well as high accumulation of potassium and proline in leaves. Ind. Crops Prod. 52, 278–285. doi: 10.1016/j.indcrop.2013.10.041
Shabala, S., Cuin, T. A. (2008). Potassium transport and plant salt tolerance. Physiol. Plant 133, 651–669. doi: 10.1111/j.1399-3054.2007.01008.x
Shannon, C. E., Weaver, W. (1949). The mathematical theory of communication (Champaign, IL: The University of Illinois Press).
Shavyrkina, N. A., Budaeva, V. V., Skiba, E. A., Gismatulina, Y. A., Sakovich, G. V. (2023). Review of current prospects for using Miscanthus-based polymers. Polymers 15, 3097. doi: 10.3390/polym15143097
Song, Z. H., Xu, Q., Lin, C., Tao, C. C., Zhu, C. Y., Xing, S. L., et al. (2017). Transcriptomic characterization of candidate genes responsive to salt tolerance of Miscanthus energy crops. GCB Bioenergy 9, 1222–1237. doi: 10.1111/gcbb.12413
Stavridou, E., Webster, R. J., Robson, P. R. H. (2020). The effects of moderate and severe salinity on composition and physiology in the biomass crop Miscanthus × giganteus. Plant 9, 1266. doi: 10.3390/plants9101266
Sun, P., Chen, Y. Y. (2015). Physiological response of Triarrherca sacchariflora under heavy saline-alkali stress in coastal region. Periodical Ocean Univ. China 45, 115–120. doi: 10.16441/j.cnki.hdxb.20130369
Sun, Q., Lin, Q., Yi, Z. L., Yang, Z. R., Zhou, F. S. (2010). A taxonomic revision of Miscanthus s.l. (Poaceae) from China. Bot. J. Linn. Soc 164, 178–220. doi: 10.1111/boj.2010.164.issue-2
Sun, Q., Yamada, T., Han, Y. L., Takano, T. (2021). Differential responses of NHX1 and SOS1 gene expressions to salinity in two Miscanthus sinensis Anderss. accessions with different salt tolerance. Phyton-Int. J. Exp. Bot. 90, 827–836. doi: 10.32604/phyton.2021.013805
Sun, Q., Yamada, T., Takano, T. (2014). Salinity effects on germination, growth, photosynthesis, and ion accumulation in wild Miscanthus sinensis Anderss. populations. Crop Sci. 54, 2760–2771. doi: 10.2135/cropsci2013.09.0636
Tang, X. Q., Yang, X. Y., Li, H. Y., Zhang, H. X. (2018). Maintenance of K+/Na+ balance in the roots of Nitraria sibirica Pall. in response to NaCl stress. Forests 9, 601. doi: 10.3390/f9100601
Tavakkoli, E., Fatehi, F., Rengasamy, P., McDonald, G. K. (2012). A comparison of hydroponic and soil-based screening methods to identify salt tolerance in the field in barley. J. Exp. Bot. 63, 3853–3867. doi: 10.1093/jxb/ers085
Tchokponhoue, D. A., Achigan-Dako, E. G., N’Danikou, S., Nyadanu, D., Kahane, R., Houéto, J., et al. (2020). Phenotypic variation, functional traits repeatability and core collection inference in Synsepalum dulcificum (Schumach & Thonn.) Daniell reveals the Dahomey Gap as a center of diversity. Sci. Rep. 10, 19538. doi: 10.1038/s41598-020-76103-4
Tripathi, K., Kumari, J., Gore, P. G., Mishra, D. C., Singh, A. K., Mishra, G. P., et al. (2022). Agro-morphological characterization of lentil germplasm of Indian national genebank and development of a core set for efficient utilization in lentil improvement programs. Front. Plant Sci. 12. doi: 10.3389/fpls.2021.751429
Uba, C. U., Oselebe, H. O., Tesfaye, A. A., Mekonen, G. S., Abtew, W. G. (2023). Exploring phenotypic variation of diverse bambara groundnut (Vigna subterranea L) origin and development of mini-core collection for future breeding. Food Energy Secur. 12, e460. doi: 10.1002/fes3.460
Vaziriyeganeh, M., Carvajal, M., Du, N., Zwiazek, J. J. (2022). Salinity tolerance of halophytic grass Puccinellia nuttalliana is associated with enhancement of aquaporin-mediated water transport by sodium. Int. J. Mol. Sci. 23, 5732. doi: 10.3390/ijms23105732
Wan, H. P., Chen, L. L., Guo, J. B., Li, Q., Wen, J., Yi, B., et al. (2017). Genome-wide association study reveals the genetic architecture underlying salt tolerance-related traits in rapeseed (Brassica napus L.). Front. Plant Sci. 8. doi: 10.3389/fpls.2017.00593
Wang, Q., Kan, L. F., Lin, C., Song, Z. H., Tao, C. H., Liu, W., et al. (2019). Transcriptomic evaluation of Miscanthus photosynthetic traits to salinity stress. Biomass Bioenergy 125, 123–130. doi: 10.1016/j.biombioe.2019.03.005
Wang, X. L., Li, J. Q., Sun, J., Gu, S., Wang, J. B., Su, C., et al. (2022). Mining beneficial genes for salt tolerance from a core collection of rice landraces at the seedling stage through genome-wide association mapping. Front. Plant Sci. 13. doi: 10.3389/fpls.2022.847863
Wang, Y., Liu, K., Liang, G., Jia, Z. F., Ju, Z. L., Ma, X., et al. (2023). Comprehensive evaluation of low nitrogen tolerance in oat (Avena sativa L.) seedlings. Agronomy 13, 604. doi: 10.3390/agronomy13020604
Wassie, M., Zhang, W. H., Zhang, Q., Ji, K., Chen, L. (2019). Effect of heat stress on growth and physiological traits of alfalfa (Medicago sativa L.) and a comprehensive evaluation for heat tolerance. Agronomy 9, 597. doi: 10.3390/agronomy9100597
Weng, J. Y., Li, P. L., Rehman, A. S., Wang, L. K., Gao, X., Niu, Q. L. (2021). Physiological response and evaluation of melon (Cucumis melo L.) germplasm resources under high temperature and humidity stress at seedling stage. Sci. Hortic. 288, 110317. doi: 10.1016/j.scienta.2021.110317
Wilcoxon, F. (1945). Individual comparisons by ranking methods. Biometrics 1, 80–83. doi: 10.2307/3001968
Wu, H., Guo, J., Wang, C., Li, K. L., Zhang, X. W., Yang, Z., et al. (2019). An effective screening method and a reliable screening trait for salt tolerance of Brassica napus at the germination stage. Front. Plant Sci. 10. doi: 10.3389/fpls.2019.00530
Xiong, M., Zhang, X. J., Shabala, S., Shabala, L., Chen, Y. J., Xiang, C. L., et al. (2018). Evaluation of salt tolerance and contributing ionic mechanism in nine Hami melon landraces in Xinjiang, China. Sci. Hortic. 237, 277–286. doi: 10.1016/j.scienta.2018.04.023
Xu, Y., Zheng, C., Liang, L., Yi, Z. L., Xue, S. (2021). Quantitative assessment of the potential for soil improvement by planting Miscanthus on saline-alkaline soil and the underlying microbial mechanism. GCB Bioenergy 13, 1191–1205. doi: 10.1111/gcbb.12845
Xue, S., Lewandowski, I., Wang, X. Y., Yi, Z. L. (2016). Assessment of the production potentials of Miscanthus on marginal land in China. Renew. Sust. Energy Rev. 54, 932–943. doi: 10.1016/j.rser.2015.10.040
Yu, T., Wang, Y. C., Xu, P. P., Cheng, S. A., Hou, X. W., Geng, G. F., et al. (2023). MsaH2A.W is identified response to salt tolerance in Miscanthus sacchariflorus. GCB Bioenergy 15, 1058–1073. doi: 10.1111/gcbb.13084
Zheng, C., Iqbal, Y., Labonte, N., Sun, G. R., Feng, H., Yi, Z. L., et al. (2019). Performance of switchgrass and Miscanthus genotypes on marginal land in the Yellow River Delta. Ind. Crops Prod. 141, 111773. doi: 10.1016/j.indcrop.2019.111773
Zheng, C., Yi, Z. L., Xiao, L., Sun, G. R., Li, M., Xue, S., et al. (2022). The performance of Miscanthus hybrids in saline-alkaline soil. Front. Plant Sci. 13. doi: 10.3389/fpls.2022.921824
Zheng, C., Yi, Z. L., Xiao, L., Yang, S., Chen, Z. Y., Pang, Z. J. (2015). Effects of NaCl stress on seed germination and seedling growth of Miscanthus. Chin. J. Grassland 37, 37–42. doi: 10.3969/j.issn.1673-5021.2015.03.007
Zhu, J. K. (2016). Abiotic stress signaling and responses in plants. Cell 167, 313–324. doi: 10.1016/j.cell.2016.08.029
Keywords: Miscanthus sacchariflorus, Miscanthus lutarioriparius, seedling stage, salt tolerance, comprehensive evaluation, ion homeostasis, core collection
Citation: Tang Y, Li S, Zerpa-Catanho D, Zhang Z, Yang S, Zheng X, Xue S, Kuang X, Liu M, He X, Yi Z and Xiao L (2024) Salt tolerance evaluation and mini-core collection development in Miscanthus sacchariflorus and M. lutarioriparius. Front. Plant Sci. 15:1364826. doi: 10.3389/fpls.2024.1364826
Received: 03 January 2024; Accepted: 21 February 2024;
Published: 05 March 2024.
Edited by:
Zulfiqar Ali Sahito, Zhejiang University, ChinaReviewed by:
Jianxiong Jiang, Jiangsu University, ChinaCopyright © 2024 Tang, Li, Zerpa-Catanho, Zhang, Yang, Zheng, Xue, Kuang, Liu, He, Yi and Xiao. This is an open-access article distributed under the terms of the Creative Commons Attribution License (CC BY). The use, distribution or reproduction in other forums is permitted, provided the original author(s) and the copyright owner(s) are credited and that the original publication in this journal is cited, in accordance with accepted academic practice. No use, distribution or reproduction is permitted which does not comply with these terms.
*Correspondence: Liang Xiao, xiaoliang@hunau.edu.cn; Zili Yi, yizili@hunau.net
Disclaimer: All claims expressed in this article are solely those of the authors and do not necessarily represent those of their affiliated organizations, or those of the publisher, the editors and the reviewers. Any product that may be evaluated in this article or claim that may be made by its manufacturer is not guaranteed or endorsed by the publisher.
Research integrity at Frontiers
Learn more about the work of our research integrity team to safeguard the quality of each article we publish.