- Department of Biophysics, N.I. Lobachevsky State University of Nizhny Novgorod, Nizhny Novgorod, Russia
Early prediction of important agricultural traits in wheat opens up broad prospects for the development of approaches to accelerate the selection of genotypes for further breeding trials. This study is devoted to the search for predictors of biomass accumulation and tolerance of wheat to abiotic stressors. Hyperspectral (HS) and chlorophyll fluorescence (ChlF) parameters were analyzed as predictors under laboratory conditions. The predictive ability of reflectance and normalized difference indices (NDIs), as well as their relationship with parameters of photosynthetic activity, which is a key process influencing organic matter production and crop yields, were analyzed. HS parameters calculated using the wavelengths in Red (R) band and the spectral range next to the red edge (FR-NIR) were found to be correlated with biomass accumulation. The same ranges showed potential for predicting wheat tolerance to elevated temperatures. The relationship of HS predictors with biomass accumulation and heat tolerance were of opposite sign. A number of ChlF parameters also showed statistically significant correlation with biomass accumulation and heat tolerance. A correlation between HS and ChlF parameters, that demonstrated potential for predicting biomass accumulation and tolerance, has been shown. No predictors of drought tolerance were found among the HS and ChlF parameters analyzed.
1 Introduction
Ensuring food security in the context of an ever-growing global population requires an increase in production of agricultural crops, among which wheat occupies a special place, providing up to 20% of the total calories and protein consumed in the world (Shiferaw et al., 2013). To achieve this goal, it is necessary to develop new cultivars that are highly productive and tolerant to external stress (Hossain et al., 2021). To optimize a long and expensive breeding process, classical methods for assessing and selecting promising plant lines are complemented by genotypic and phenotypic studies, which make it possible to identify genotypes that potentially have the necessary economically significant traits.
Integration of advanced genetic technologies such as quantitative trait loci (QTL) mapping, marker-assisted selection and genomic selection into the breeding process has significantly accelerated the development of new cultivars (Alotaibi et al., 2021; Hossain et al., 2021). However, a significant factor limiting the development of breeding is the current gap between the capabilities of genotyping and phenotyping (Grzybowski et al., 2021; Dos Santos et al., 2022; Trono and Pecchioni, 2022). This problem is driving the rapid development of phenotyping methods, among which optical methods occupy a special place, allowing non-invasive acquisition of large amounts of data on various spatial and temporal scales. Among the sensors used in optical phenotyping methods, multi- and hyperspectral, fluorescence and thermal imaging sensors are widely used. Spectral research methods, which allow remotely obtaining highly informative data on the state of plants in both laboratory and field studies at high speed (Perez-Sanz et al., 2017; Sarić et al., 2022), are of particular interest. They are based on the specific nature of the interaction of light of certain ranges in the visible and infrared regions of the spectrum with the plant (Ollinger, 2011). Moreover, changes in tissue structure, content of pigments and other substances, and the activity of physiological processes can cause changes in the spectral properties of the plant (Kim et al., 2021), which provides the potential of multi- and hyperspectral methods in quickly assessing plant responses to changing environmental conditions.
Optical phenotyping is actively used in the early detection of abiotic and biotic stress (Sarić et al., 2022), including drought (Katsoulas et al., 2016) and exposure to elevated temperatures (Venkatesh et al., 2022). Real-time quantitative assessment of plant responses to stressors makes it possible to predict the productivity and stress tolerance of plants long before the harvest stage, which is of great importance for accelerating the selection of promising genotypes in breeding (Gosa et al., 2019). In particular, a fairly large number of works show reliable correlations of canopy reflectance parameters at different stages of wheat development with grain yield under limited water availability (Aparicio et al., 2000; Tattaris et al., 2016; Becker and Schmidhalter, 2017; El-Hendawy et al., 2017; Thapa et al., 2019; Bhandari et al., 2021). The works (S. Pradhan et al., 2012; Bandyopadhyay et al., 2014; Liu et al., 2022) showed high correlation coefficients of yield with wheat reflectance indices at different stages of growth under different irrigation.
Along with drought, elevated temperature is often a negative factor affecting wheat plants. Both problems are intensifying, including due to ongoing climate change (Lippmann et al., 2019; Shahzad et al., 2021; Zahra et al., 2021; Lesk et al., 2022; Sánchez-Bermúdez et al., 2022; Mao et al., 2023; Zahra et al., 2023). A number of works have demonstrated the efficiency of spectral predictors of economically significant traits, which are recorded at the stages of wheat plants development preceding full maturity, under different regimes of water availability and elevated ambient temperatures (Crain et al., 2018; Juliana et al., 2019; Krause et al., 2019).
In addition to the magnitude of changes in spectral indices caused by the action of a stressor, their absolute values determined for plants under optimal growing conditions are also used in predicting crop yields. Thus, a number of works have shown a fairly high ability for a number of vegetation (Tattaris et al., 2016; El-Hendawy et al., 2017; Thapa et al., 2019) and water (El-Hendawy et al., 2017) reflectance indices, as well as their combinations (Hassan et al., 2022) in predicting economically significant traits of wheat grown under optimal water conditions (in irrigated fields).
In addition to the use of reflectance parameters as independent predictors of economically important traits, a number of works have shown the promise of integrating spectral data into multivariate analysis based on genotyping to improve the accuracy of wheat yield prediction (Rutkoski et al., 2016; Sun et al., 2017; Juliana et al., 2019; Lozada and Carter, 2020). Another important direction in the research development is the study of the relationship between phenotypic traits determined using spectral imaging and the activity of physiological processes, primarily photosynthesis, which determines plant productivity. A widely used method for assessing photosynthetic activity is chlorophyll fluorescence (ChlF) recording using Pulse-Amplitude-Modulation (PAM) fluorometry (Maxwell and Johnson, 2000; Baker, 2008; Kalaji et al., 2017; Ni et al., 2019). It is important to note that ChlF parameters determined by the PAM method are effective predictors of economically important traits in wheat under optimal conditions and under the influence of abiotic stress factors (Sharma et al., 2015; Sherstneva et al., 2021; Terletskaya et al., 2021). Our previous work demonstrated the high efficiency of ChlF parameters characterizing transient light-induced processes in the photosynthetic apparatus (PSA) as predictors of biomass accumulation and tolerance to water deficiency and high-temperature stress (Sherstneva et al., 2021).
PAM fluorometry has a number of significant advantages, such as high information content and non-invasiveness, but it has limitations in speed (long time) and throughput. In this regard, a direction of research devoted to the search for the connection between spectral characteristics (which can be quickly determined on a large scale) and chlorophyll fluorescence parameters (which provide information about the activity of photosynthesis) is currently actively developing (Peng et al., 2017; El-Hendawy et al., 2019; Sukhova and Sukhov, 2020). However, knowledge in this area remains incomplete and requires further research.
Another important unsolved problem today is to elucidate the factors that determine the prognostic potential of the studied predictors. To study this issue, assessing the relationship of predictors with both economically important traits and physiological processes seems to be the most effective.
The aim of this work was to analyze the relationship between the spectral characteristics of plants and chlorophyll fluorescence parameters reflecting the activity of photosynthesis, as well as to analyze their predictive potential in relation to such important economic traits as biomass accumulation and tolerance to drought and heat. We conducted laboratory phenotyping under controlled environmental conditions and analyzed the relationship of spectral and chlorophyll fluorescence parameters of 2-week-old wheat seedlings with the rate of biomass accumulation and tolerance to water deficiency and elevated temperatures.
2 Materials and methods
2.1 Plant material
The experiments were carried out on wheat seedlings (Triticum aestivum L.). Eleven cultivars of wheat were used in the study: Lutescens 62, Strubes Schlesischer Grannen, Alen’kaya Uimonskaya, Khludovka, Paradis, Saratovskaya 29, Wachtel, Solo, Kantegirskaya 89, Sibirskaya 12, Naxos (hereinafter, cultivars C1–C11, respectively). Wheat seeds were provided by Federal Research Center N.I. Vavilov All-Russian Institute of Plant Genetic Resources (VIR).
2.2 Experiment design
Plants were grown in 1.2 L pots (9 plants per pot, peat soil Peter Peat Agro Black, Peter Peat, Moscow, Russia) under controlled conditions (air temperature 24 °С, relative humidity 50% and a 16 h photoperiod) in a vegetation room. The plants were illuminated using cool white fluorescent lamps L36W/640 (Osram, Munich, Germany); the light intensity was 200 μmol m−2 s−1.
Reflectance and ChlF parameters for all experimental groups were assessed at the age of 2 weeks (Figure 1). In the first set of experiments, soil drought stress conditions were applied; for this purpose, irrigation of plants in the experimental group (drought-stressed group) was stopped at the age of 2 weeks. In the control group, irrigation (every 2 days) continued; soil moisture (calculated as ) was at least 70%. The dynamics of water content in the soil and for the control and drought-stressed groups is shown in Supplementary Figure 1 in Supplementary Files.
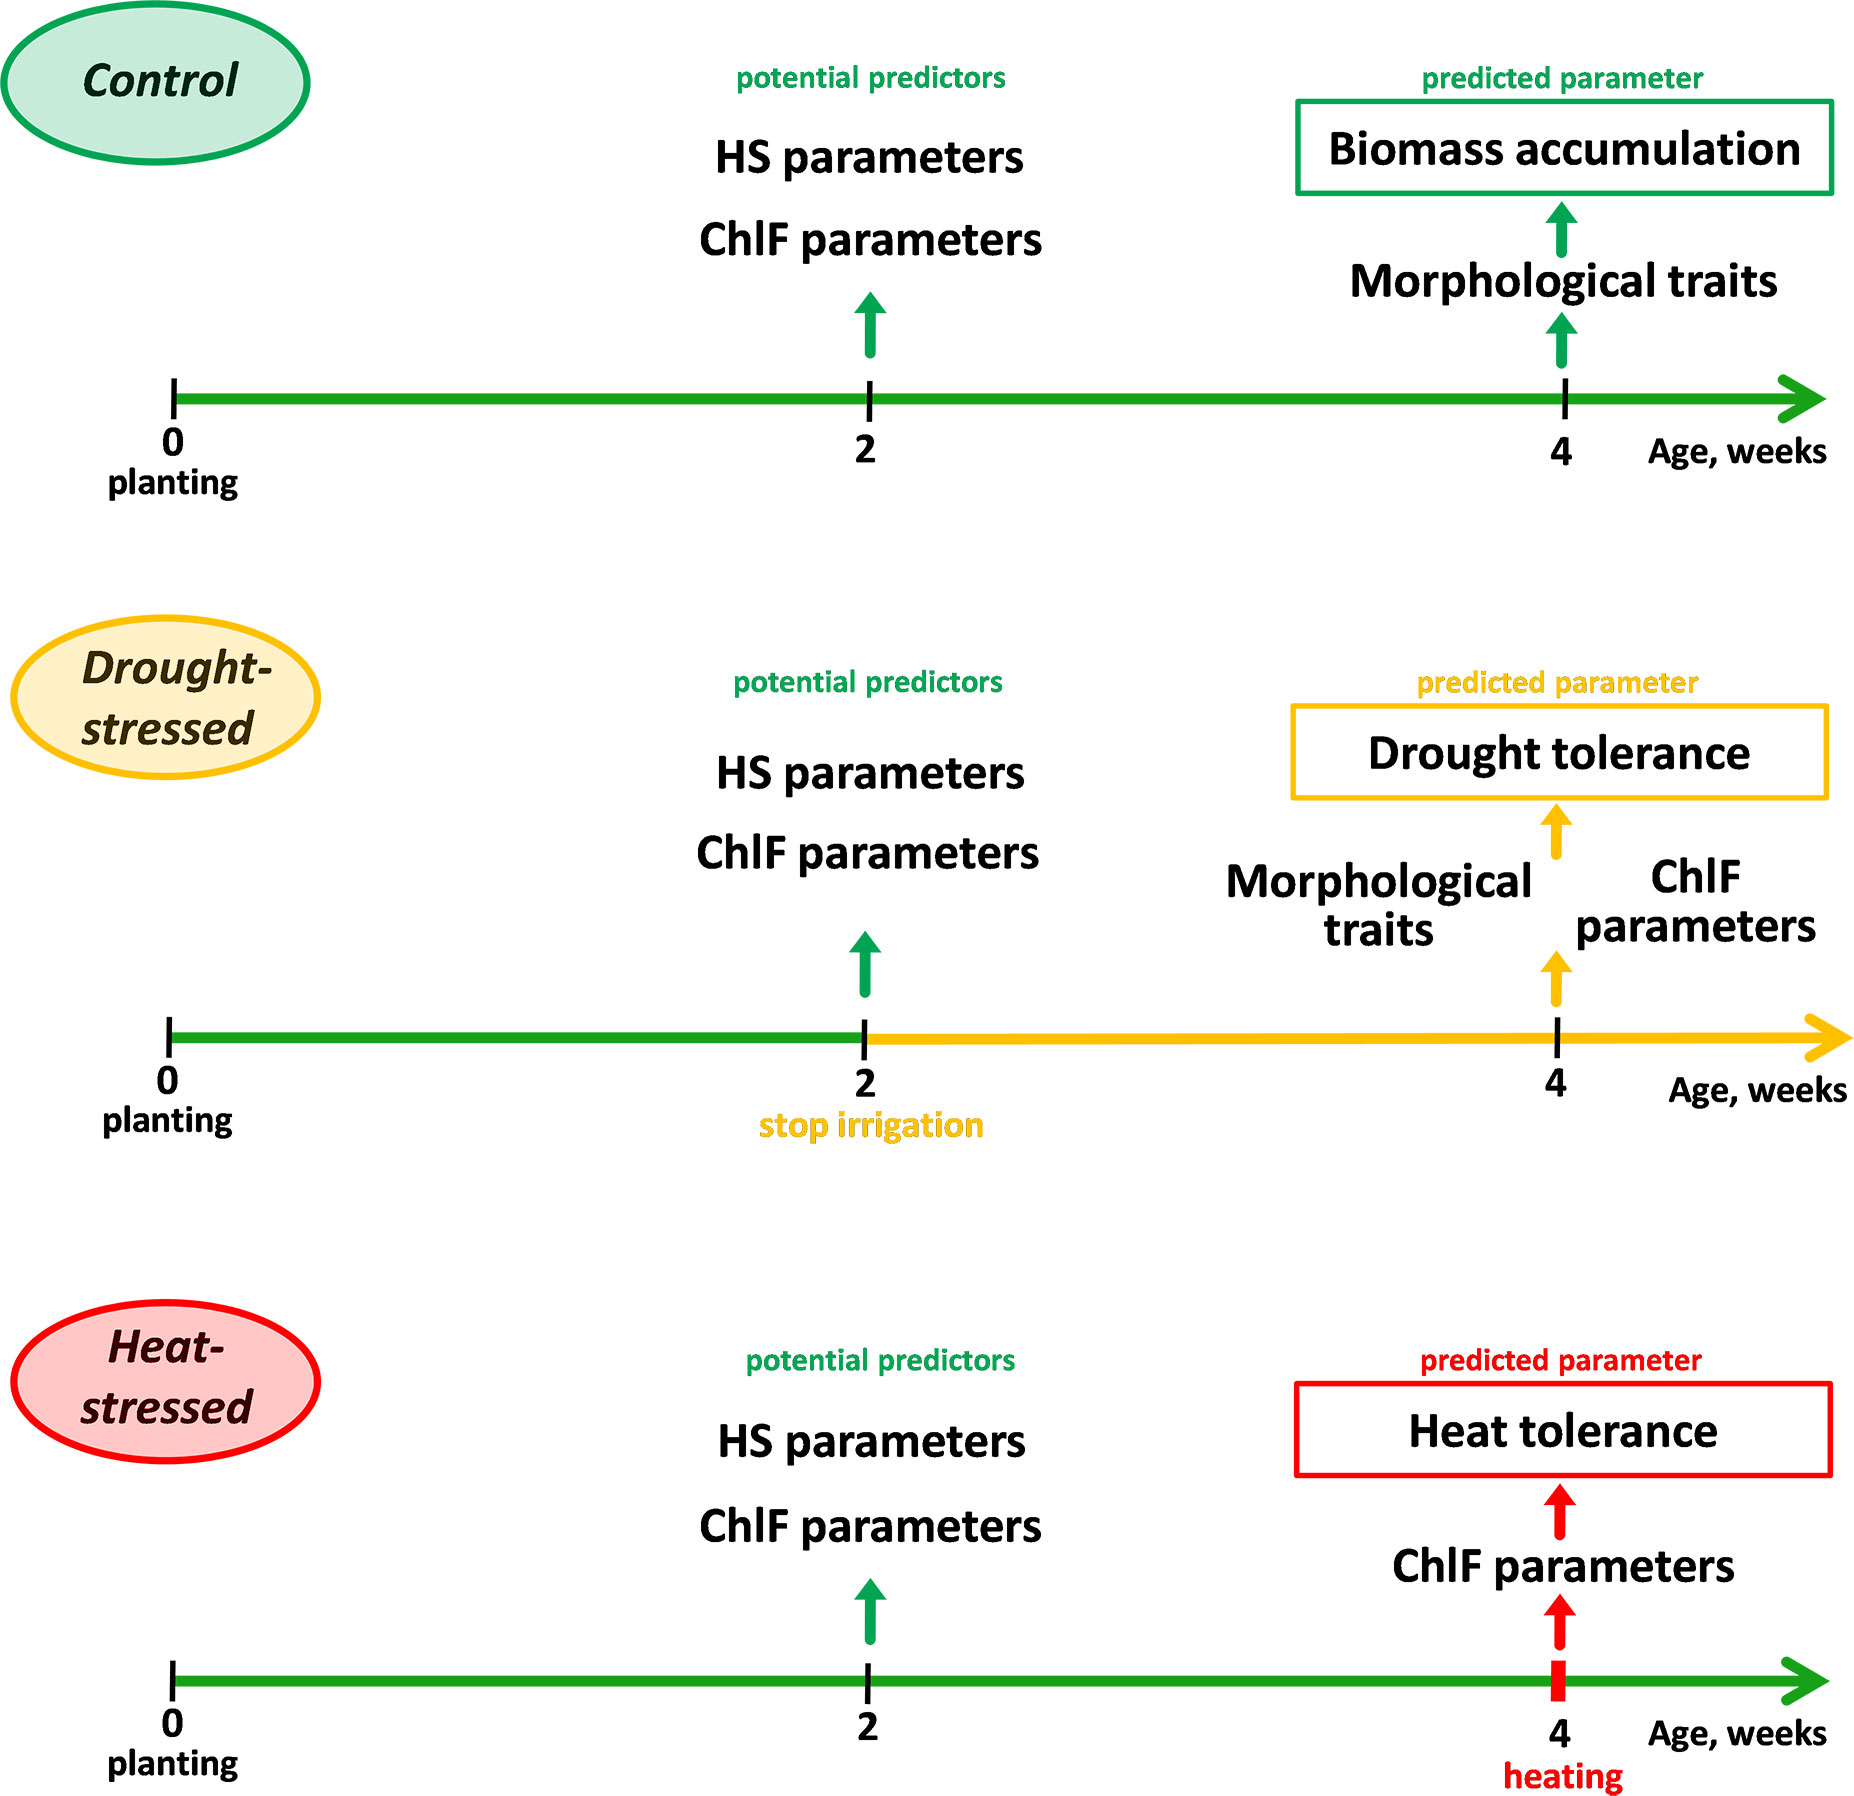
Figure 1 Experiment design for studying wheat biomass accumulation, tolerance to drought, and tolerance to heat stress.
Morphometric (length, fresh and dry weight of shoots and roots) and ChlF parameters of plants were measured at the age of 4 weeks to assess tolerance to drought. Drought tolerance index () and residual levels of photosynthetic activity parameters, expressed in % of control () were used as tolerance indicators. In the second set of experiments, 4-week-old plants grown under conditions of sufficient water availability were subjected to gradual heating of leaves (heat-stressed group) fixed on a hot plate (Microstat-30/80, KB Technom, Yekaterinburg, Russia).
The hot plate temperature increased every 5 minutes from 25 to 55°C in increments of 5°C; the duration of treatment at 55°C was 10 minutes. Infrared images of wheat leaves were acquired using a testo 885 thermal imager (Testo, Lenzkirch, Germany) every 60 s to assess the temperature of wheat leaves and the hot plate. Image analysis was performed using IRSoft software (Testo, Lenzkirch, Germany); regions of interest (ROIs) were placed on wheat leaves and on the hot plate around the leaves.
The tolerance of the photosynthetic apparatus was used as an indicator of wheat tolerance to high-temperature stress. For this purpose, ChlF parameters were recorded using the PAM imaging method simultaneously with heating. The tolerance was expressed quantitatively in two parameters: the residual level of the quantum yield of photochemical reactions of photosystem II (ΦPSII), calculated as the ratio of the final level of ΦPSII at 55°C to the initial level at 25°C, expressed as a percentage (), as well as the hot plate temperature at which ΦPSII decreased below the initial control value of 25°C (tdec).
2.3 Morphological traits determination
The length, fresh and dry weight of the roots, shoots and whole 4-week-old plants were used as morphometric parameters of wheat seedlings. Shoots and roots of wheat seedlings were weighed separately using the analytical balance (Explorer EX125D, Ohaus, Parsippany, NJ, USA), then placed in the drying oven for 3 hours at 90°С; after that they were weighed again. Weight was assessed integrally for a pot (9 plants) and calculated for an individual plant. The length of shoots and roots was measured individually for each plant.
2.4 PAM imaging
Recording of photosynthetic activity parameters was carried out using a system based on the PAM fluorometry method (Open FluorCam FC 800-O/1010-S, Photon Systems Instruments, Drásov, Czech Republic). Wheat plants were subjected to dark adaptation for 15 minutes, after which the dark (F0) and maximum (Fm) fluorescence yields were determined. Actinic light (AL, cool white light, 200 µmol m−2 s−1) was then turned on, and the current (F) and maximum (Fm’) fluorescence yields were determined every 30 s for 15 minutes.
The parameters Fm and Fm′ were measured using a saturation pulse (cold white light, 4000 µmol m−2 s−1, 800 ms duration, 6500 K). Based on the recorded values, parameters of photosynthetic activity such as the quantum yield of photochemical reactions of photosystem II (ΦPSII) and non-photochemical quenching of chlorophyll fluorescence (NPQ) were calculated by a program integrated into the recording system, and their dynamics, induced by a change in the illumination mode, were analyzed. ΦPSII and NPQ values were calculated using the equations: ΦPSII = (Fm′ − F)/Fm′ and NPQ = (Fm − Fm′)/Fm′ (Maxwell and Johnson, 2000), where Fm is the maximum fluorescence yield of chlorophyll after dark adaptation, Fm′ is the maximum fluorescence yield under lighting, F is the current fluorescence level under lighting.
The following quantitative characteristics of the light-induced dynamics of ΦPSII and NPQ were analyzed (Figure 2): maximum quantum yield of photochemical reactions of photosystem II, determined after dark adaptation (Fv/Fm), steady-state level of photosystem II quantum yield under AL (ΦPSIIef), time for the ΦPSII value to reach ½ ΦPSIIef after switching on AL (t1/2(ΦPSIIef)), maximum value of non-photochemical fluorescence quenching after switching on AL (NPQmax), time for the NPQ value to reach NPQmax after switching on AL (t(NPQmax)), and steady-state NPQ level under AL (NPQs) (Sherstneva et al., 2021).
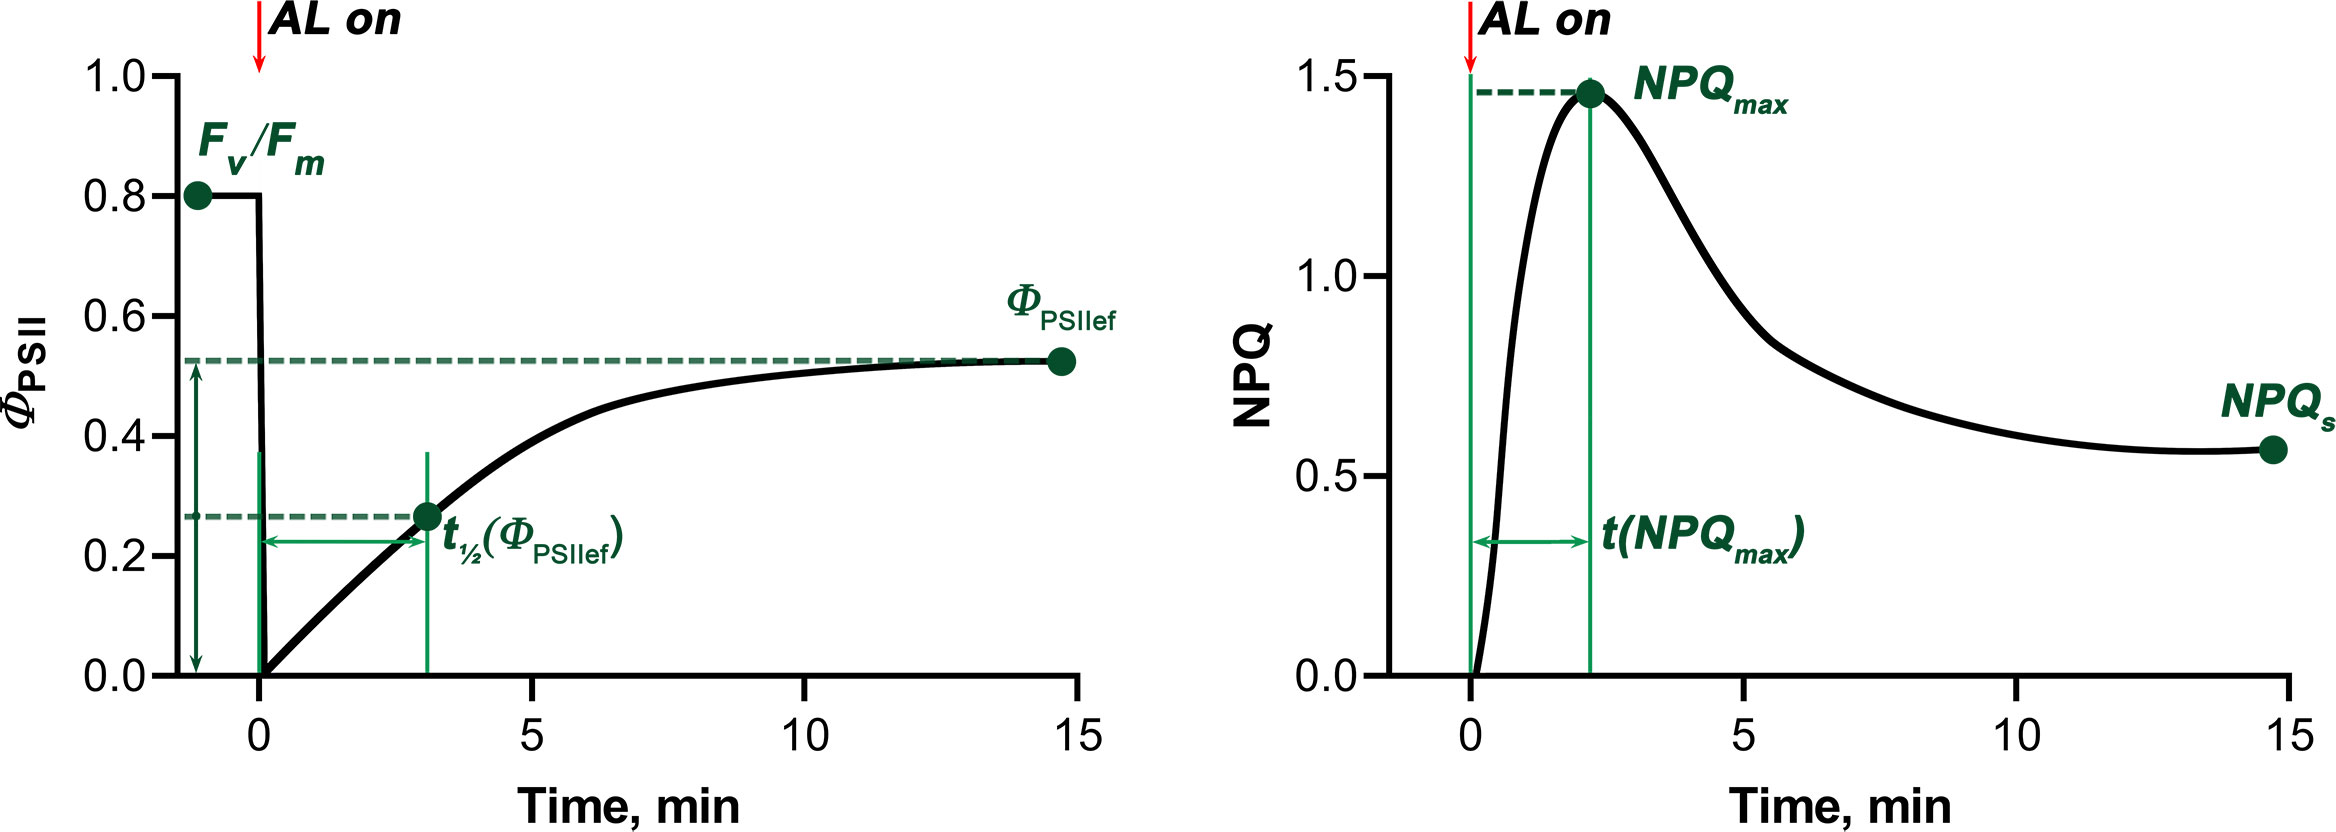
Figure 2 Scheme illustrating standard light-induced ΦPSII and NPQ curves and characteristic values used to quantify photosynthetic activity. The red arrows mark the moment when the actinic light was switched on (AL on). Fv/Fm - maximum quantum yield of photochemical reactions of photosystem II, ΦPSIIef - steady-state level of photosystem II quantum yield under AL, t1/2(ΦPSIIef) - time for the ΦPSII value to reach ½ ΦPSIIef after switching on AL, NPQmax - maximum value of non-photochemical fluorescence quenching after switching on AL, t(NPQmax) - time for the NPQ value to reach NPQmax after switching on AL, NPQs - steady-state NPQ level under AL.
In experiments with gradual heating of leaves, plants were also adapted to darkness within 15 minutes. Then the initial parameters (F0 and Fm) were determined, AL was turned on, and ChlF parameters were recorded every 60 s for 40 minutes.
2.5 Hyperspectral imaging
Hyperspectral images of plants were obtained using the Specim IQ hyperspectral camera (Specim, Spectral Imaging Ltd., Oulu, Finland). Images of wheat leaves were separated from the background, then ROIs were placed (each ROI included the whole aboveground part of all plants in the pot above 3 cm from the soil); one reflectance spectrum was integrally obtained from each ROI. The resulting reflectance spectra of shoots in the range of 400-800 nm in steps of 3 nm were normalized by the reflectance spectrum of the white standard. Normalized difference indices (NDIs) were also calculated for each combination of wavelengths according to the equation:
where and are the intensities of the reflectance at the wavelengths and , respectively.
NDIs were presented as heat maps.
2.6 Statistics
Statistical processing of the results was carried out using GraphPad Prism (GraphPad Software Inc., San Diego, CA, USA) and Microsoft Excel (Microsoft Corporation, Redmond, WA, USA). The results are presented as average curves with standard errors of the mean (SEM), average values with SEM, heat maps of parameters, as well as spectra and heat maps of Pearson correlation coefficients (r). The probability value (p-value) was used to assess the statistical significance of the result; p< 0.05 was considered significant. The normality of data distribution was assessed using the Kolmogorov–Smirnov test. The one-way analysis of variance (ANOVA) followed by Tukey’s test was used.
At the age of 2 weeks, 4 pots of 9 plants for each cultivar were assessed in each experimental group (control, drought-stressed, heat-stressed). Weight was assessed integrally for a pot (9 plants) and calculated for an individual plant (n = 4). Shoot and root length were measured for individual plants. The chlorophyll fluorescence parameters were registered for 5 plants per pot (n = 20 for 2-week-old plants; n = 10 for 4-week-old plants in each experimental group).
3 Results
3.1 Wheat parameters under control and stress conditions
3.1.1 Morphological, hyperspectral, and ChlF parameters under control conditions
In this study, the morphometric parameters of 4-week-old wheat seedlings, including length, fresh and dry weight of shoots and roots were assessed (Figure 3, Table S1). Whole plant dry weight (DW) ranged from 29.4 to 77.05 mg; subsequently, this parameter was used as the most informative parameter reflecting the accumulation of biomass by wheat seedlings.
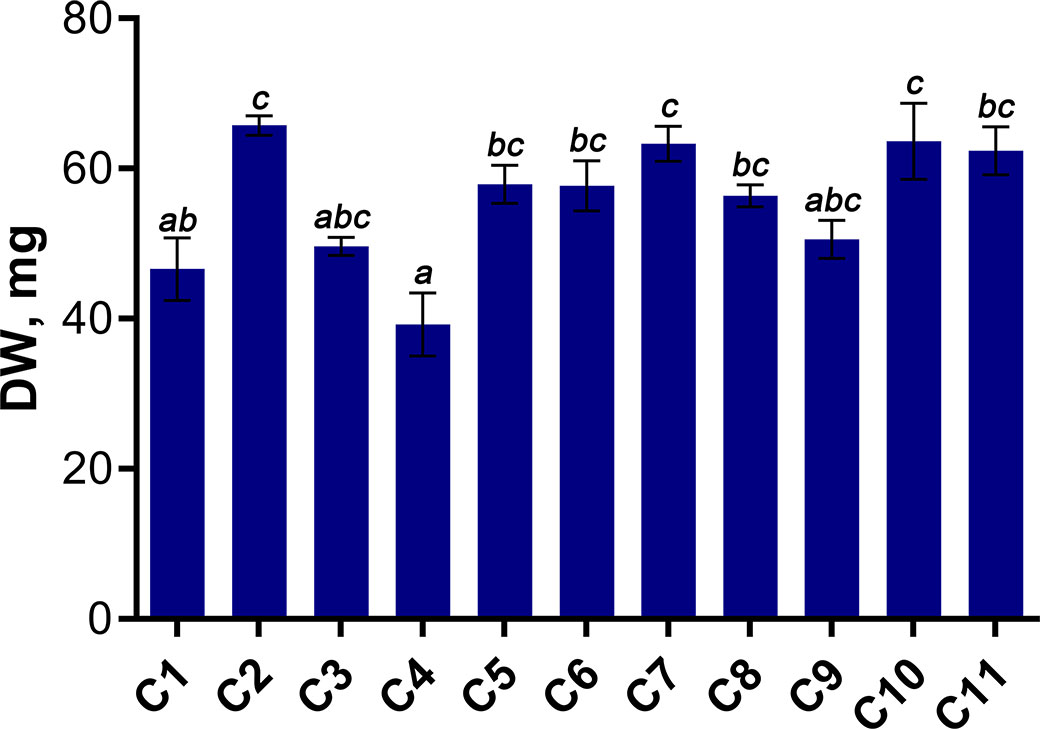
Figure 3 Dry weight (DW) of 4-week-old wheat seedlings. Data are presented as means with SE bars (n = 4). Significant differences between the cultivars are indicated by different letters (ANOVA followed by Tukey’s test, p< 0.05). Values with the same letters are not significantly different.
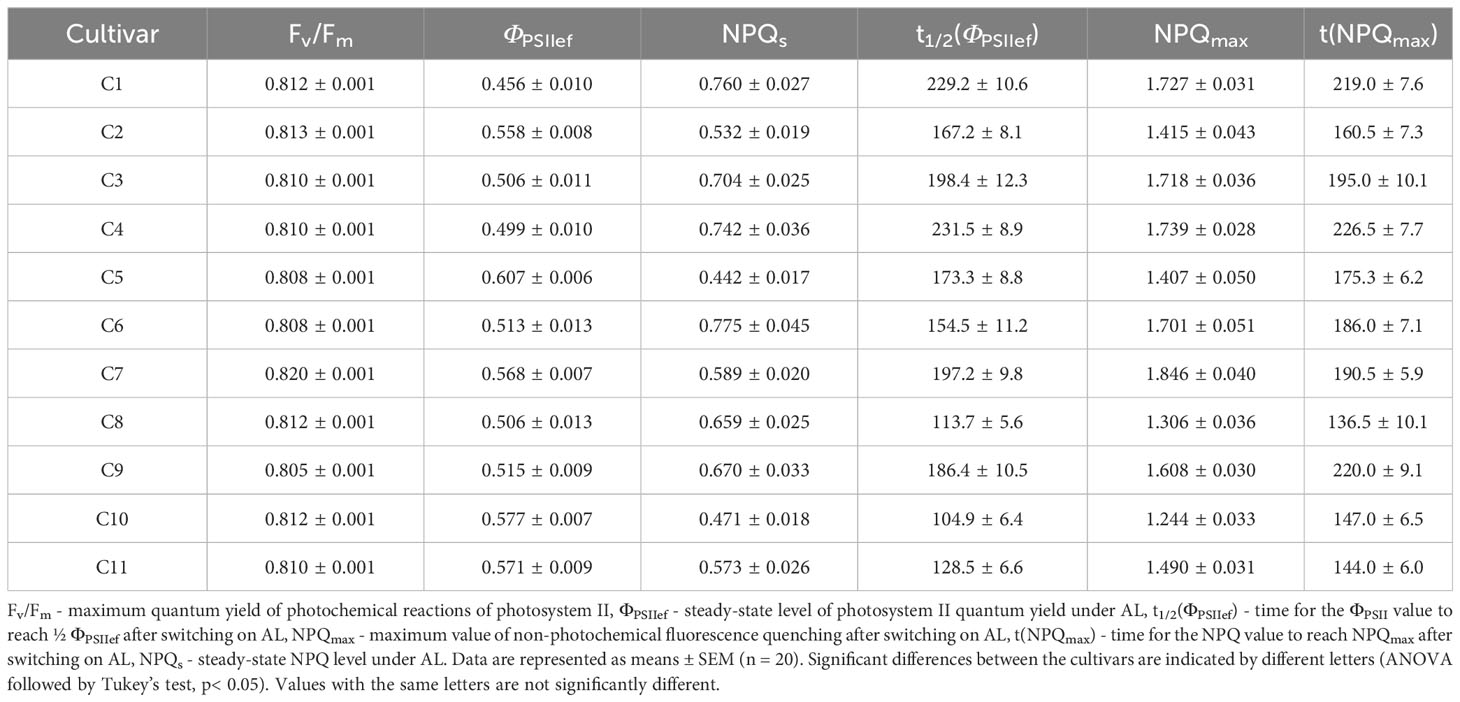
Chlorophyll fluorescence (ChlF) and hyperspectral characteristics (HS parameters), which were further analyzed as potential predictors of biomass accumulation and tolerance to drought and heat stress, were determined in 2-week-old wheat seedlings. ChlF parameters were recorded using the PAM imaging method (Table 1). To assess the functioning of the PSA, such parameters of chlorophyll fluorescence as stationary levels of the quantum yield of photochemical reactions of photosystem II and non-photochemical quenching of fluorescence in light and in the dark, as well as parameters characterizing the rate of transition processes caused by the dark-light transition were analyzed (Figure 2).
Along with determining ChlF parameters, spectral characteristics of 2-week-old seedlings were recorded. To search for spectral parameters that can act as predictors of biomass accumulation and wheat tolerance to soil moisture deficiency and heating, the reflectance spectra of the studied plants were obtained using hyperspectral imaging. Figure 4 shows the average reflectance spectra of shoots of 2-week-old wheat seedlings of 11 cultivars. The reflectance spectrum has typical minimums in the blue and red regions, a sharp rise in the red edge band, and high values in the near-infrared (NIR) region. Figure 4 shows an example of a heat map of normalized difference indices (NDIs). NDIs heat maps for all studied cultivars are presented in Supplementary Figure 2 in Supplementary Files. Subsequently, the absolute values of the intensity of the reflected light (normalized to the intensity of the light reflected by the white standard) in the range of 400-800 nm in steps of 3 nm and the entire set of NDIs calculated for this wavelength range were used to search for correlations of the reflectance parameters of young plants with dry weight and stress tolerance of plants of later age.

Figure 4 Reflectance spectra of 2-week-old wheat seedlings of 11 cultivars (means with SE bars) and an example of an NDIs heat map (cultivar C1).
3.1.2 Relationship between HS and ChlF parameters
The next step was to study the possible connection between reflectance properties and the activity of photosynthetic processes. For this purpose, correlation coefficients were calculated between the intensity of reflected light at a certain wavelength in the range of 400-800 nm and the ChlF parameters (Figure 5). Fv/Fm, ΦPSIIef and NPQs had maximum values of Pearson correlation coefficients (r) with reflectance intensity in the blue (B) and red (R) regions of the spectrum. These coefficients were negative for Fv/Fm and ΦPSIIef and positive for NPQs. A statistically significant (p < 0.05) relationship was detected for Fv/Fm in the B range (420-490 nm, the correlation coefficient reached –0.72); there was no significant correlation in the R range, but a tendency towards a negative relationship was observed. On the contrary, ΦPSIIef was significantly negatively correlated with reflectance intensity in the R range (640-690 nm); r reached –0.72. No statistically significant correlation was found for NPQs.
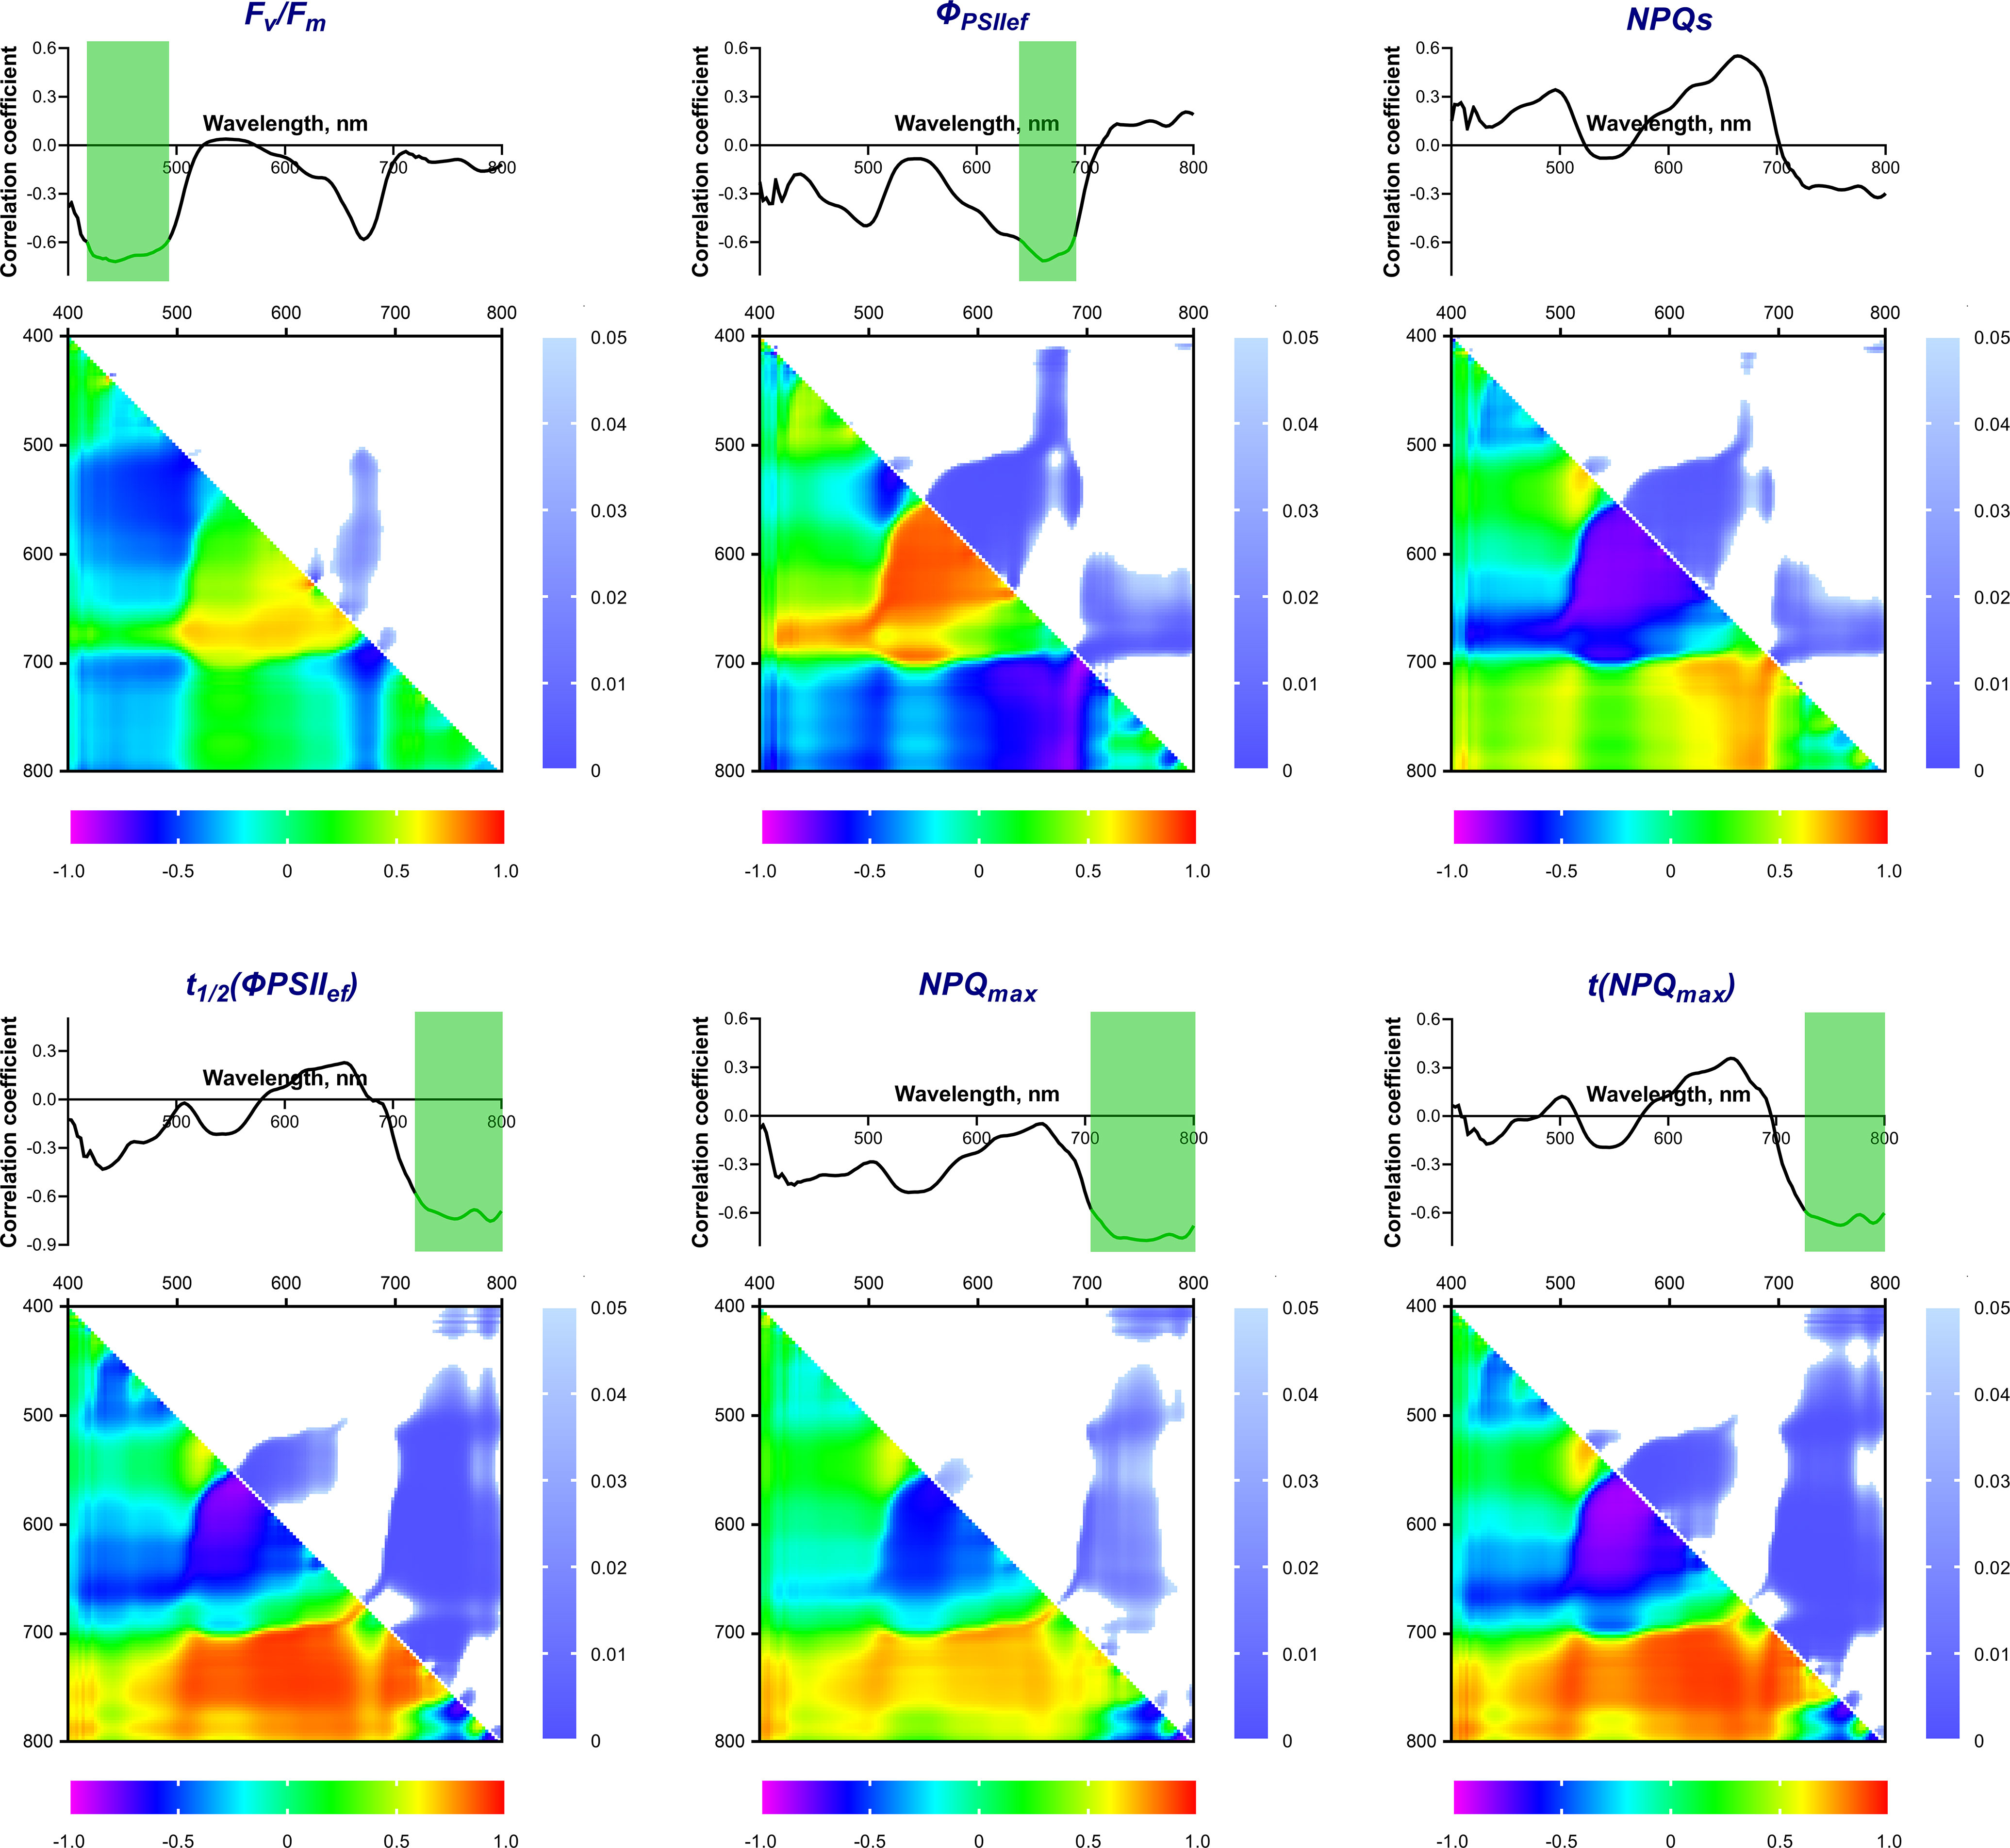
Figure 5 Spectra and heat maps of Pearson correlation coefficients between HS and ChlF parameters of 2-week-old wheat plants. Areas of the spectra with statistically significant correlation are highlighted in green. Heat maps show correlation coefficients (bottom left) and p-values (top right).
The maximum values of the correlation coefficients for the parameters t1/2(ΦPSIIef), NPQmax, and t(NPQmax) occurred in the far-red-NIR (FR-NIR) range (710-800 nm). The wavelength ranges with significant correlation were: 720-800 nm for t1/2(ΦPSIIef) (r reached –0.75), 710-800 nm for NPQmax (r reached –0.77), and 730-800 nm for t(NPQmax) (r reached –0.68).
A correlation analysis of the relationship between ChlF parameters and NDIs, calculated using all combinations of recorded wavelengths in the range of 400-800 nm, was also carried out. Figure 5 shows heat maps of correlation coefficients and statistical significance level values. It was shown that Fv/Fm correlates significantly (p < 0.05) (max r = –0.68) with NDIs calculated using λ1 650-685 (hereinafter referred to as R range); λ2 510-620 nm. ΦPSIIef had a wider significant region in this range (NDI(λ1 560-650; λ2 500-610) and NDI(λ1 650-690; λ2 410-560), max r = –0.88 and –0.83, respectively). In addition, a small significant region was noted in the FR-NIR range: NDI(λ1 700-800; λ2 620-700), max r = 0.84. NPQs also demonstrated a similar relationship. Transient ChlF parameters showed a significant relationship with the wider FR-NIR range: NDI(λ1 700-800; λ2 450-710 for t1/2(ΦPSIIef) (max r = –0.92), NDI(λ1 700-780; λ2 450-700) for NPQmax (max r = –0.72), NDI(λ1 700-800; λ2 400-720 for t(NPQmax) (max r = –0.92). In addition, t1/2(ΦPSIIef) and t(NPQmax) had a high significant correlation with NDIs in the R range: NDI(λ1 560-650; λ2 510-570) for t1/2(ΦPSIIef), NDI(λ1 560-650; λ2 510-610) for t(NPQmax) (max r = 0.83 and 0.86, respectively).
3.1.3 Drought stress
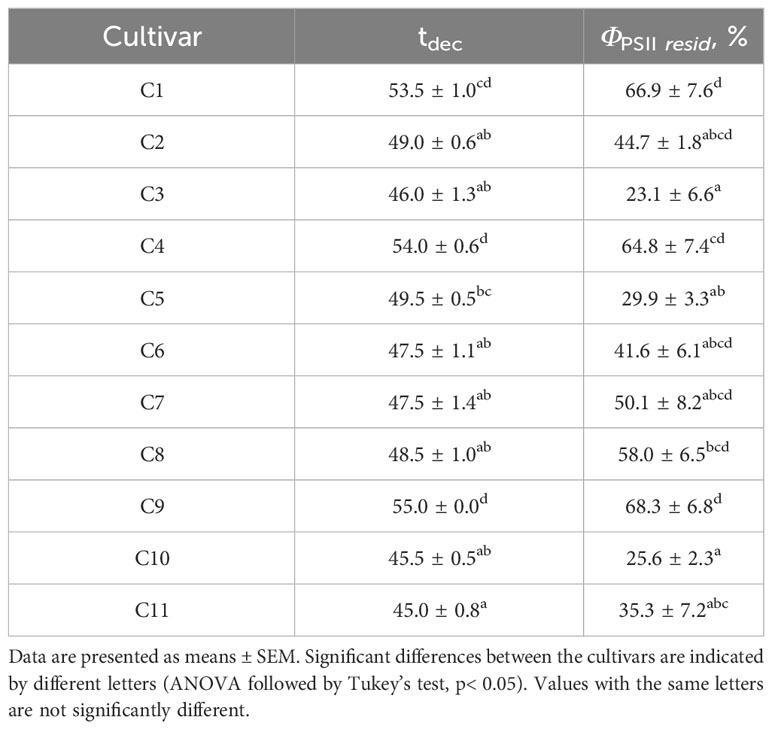
Along with recording parameters under control conditions, the tolerance of wheat plants to abiotic stressors was assessed. The residual level of dry weight of the whole plants was assessed as a criterion for the tolerance of wheat seedlings to drought (Table 2, Supplementary Table 2). An additional parameter reflecting the degree of suppression of physiological processes in wheat under water deficiency was the residual level of activity and integrity of the PSA, which was determined by the residual levels of such ChlF parameters as Fv/Fm and ΦPSIIef (Table 2).
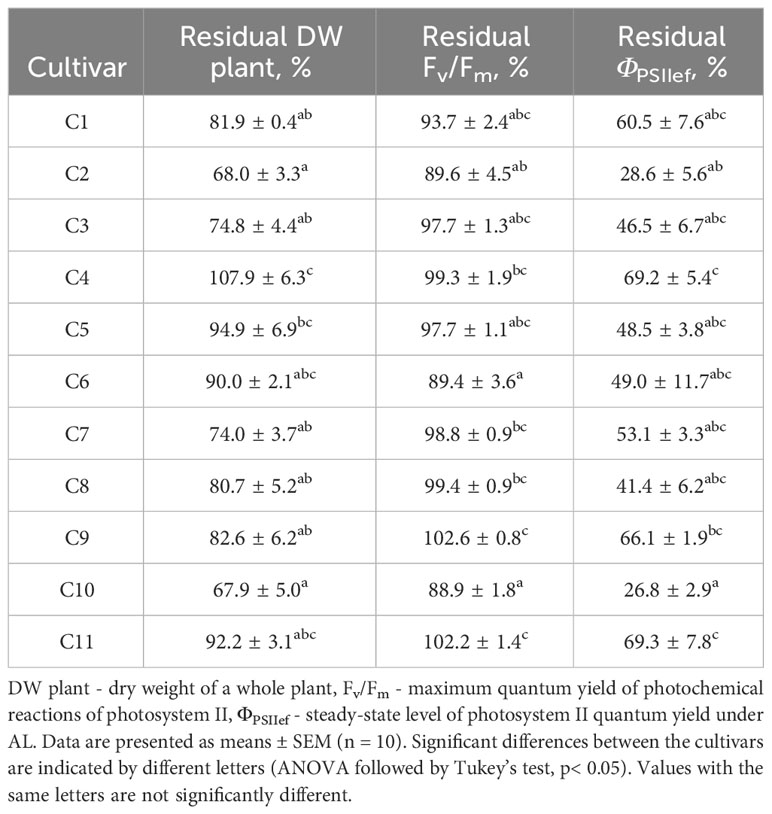
Table 2 Residual values of dry weight and ChlF parameters, expressed in % of control, after 14-day drought stress of wheat plants.
Residual DW of drought-stressed plants (14-day drought), which was subsequently used as the main indicator of tolerance (drought tolerance index), varied significantly between cultivars. At the same time, the relative water content (RWC) of control plants varied from 85.8 to 89.5% and averaged 87.9 ± 0.2%; RWC in drought-stressed plants varied from 45.6 to 81.2 and averaged 70.2 ± 1.5%. The dynamics of RWC in control and drought-stressed plants is shown in Supplementary Figure 3 in Supplementary Files. RWC values did not differ significantly between the studied cultivars, both in control and under conditions of soil moisture deficiency. Residual levels of ChlF parameters, reflecting the sensitivity of photosynthetic processes to water deficiency, varied significantly (Table 2). At the same time, the residual level of ΦPSIIef significantly correlated with the drought tolerance index (Table 3), which indicates the potential possibility of using this parameter as an indicator of stress and plant sensitivity to water deficiency.
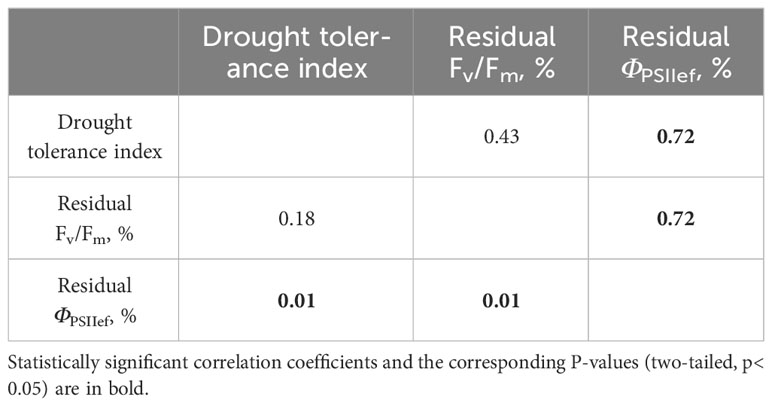
Table 3 Correlation coefficients between the drought tolerance index and residual levels of ChlF parameters in wheat plants affected by a 14-day drought.
3.1.4 Heat stress
To study the tolerance of wheat seedlings to elevated temperatures, gradual heating of wheat leaves was carried out using a hot plate; the dynamics of ΦPSII was recorded simultaneously (Figure 6). The temperature of the hot plate and leaves was recorded using a thermal imager. The dynamics of photosynthesis activity induced by gradual heating was similar for different cultivars, but the quantitative parameters varied significantly. Figure 6 shows an example of the average dynamics of leaf temperature and ΦPSII in plants of cultivars contrasting in sensitivity to elevated temperature (C1 and C3, which were later classified as tolerant and sensitive to heat, respectively). It was shown that ΦPSII increased as the hot plate temperature increased from 25°C to values ranging from 35.5 (C2) to 41°C (C1 and C9); with a further increase in temperature, ΦPSII gradually decreased and reached values in the range from 0.09 (C3) to 0.23 (C8) at a final hot plate temperature of 55°C. Two parameters were used as criteria for the tolerance of wheat seedlings to heat: the temperature of the hot plate, at which ΦPSII decreased below the initial level at 25°C (tdec), as well as the residual level of ΦPSII at 55°C, expressed as a percentage of the initial level at 25° (ΦPSII resid). The average values of tdec and ΦPSII resid for all studied cultivars are shown in Table 4. Correlation analysis showed a strong positive relationship between these parameters of heat tolerance (r = 0.84, p = 0.001), therefore, only tdec was chosen for further analysis.
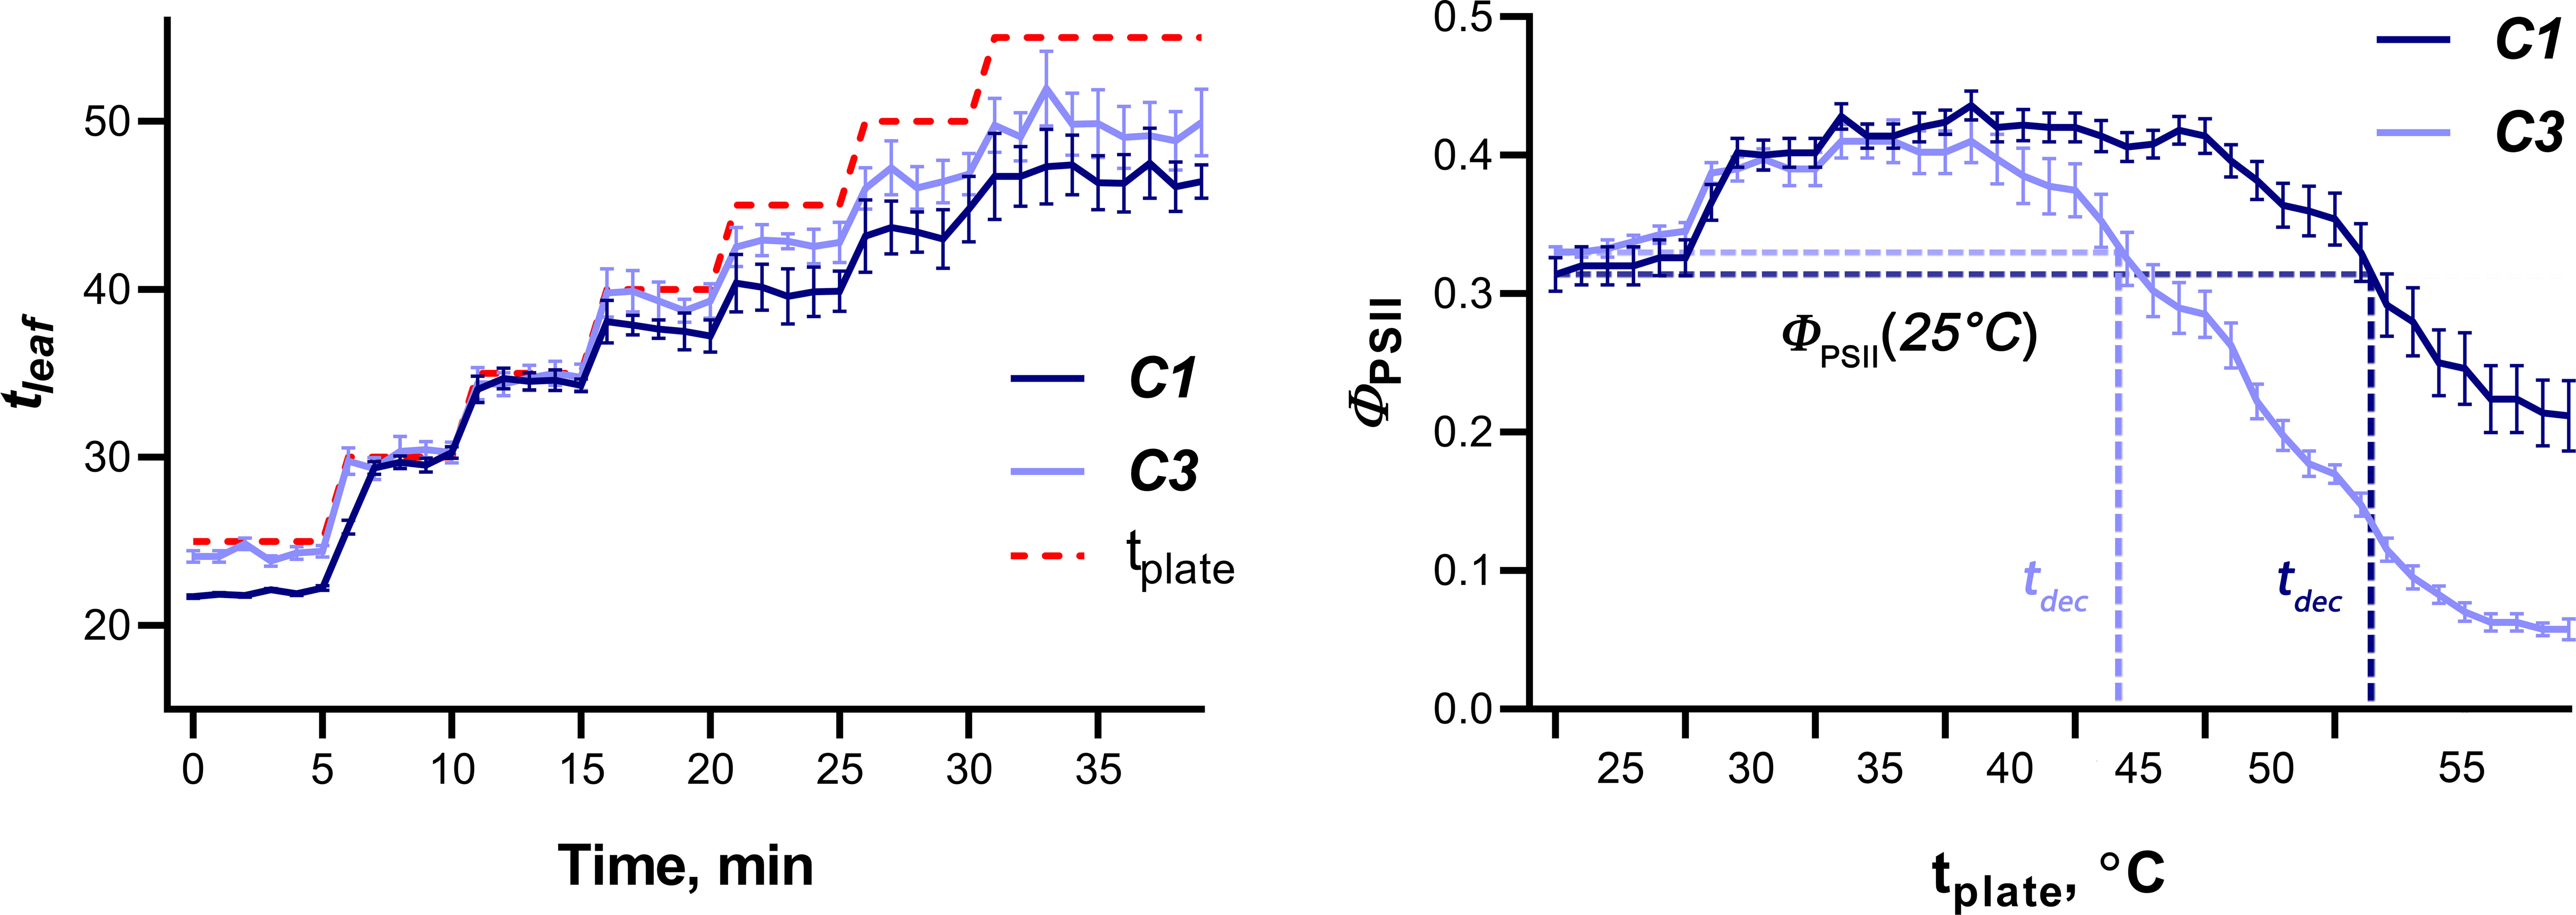
Figure 6 Dynamics of wheat leaf temperature (left) and ΦPSII (right) in plants of tolerant (C1) and sensitive to heat (C3) cultivars. Data are presented as means with SE bars. Red dashed line on the left graph indicates the temperature of a hot plate.
3.2 Predictors of biomass accumulation
3.2.1 HS parameters
A correlation analysis of the relationship between the dry weight of 4-week-old wheat seedlings and the HS parameters of the shoots of 2-week-old plants was carried out to search for predictors of biomass accumulation in plants under optimal temperature and water conditions.
Figure 7 shows the spectrum of correlation coefficients of dry weight of 4-week-old seedlings with the reflectance intensity (normalized to the reflectance intensity of the white standard) of 2-week-old seedlings in the wavelength range from 400 to 800 nm. The highest correlation coefficients for these parameters were in the R (650-670 nm) and B (480-510 nm) bands (negative correlations), as well as in the FR-NIR range (750-800 nm, positive correlation). A statistically significant (p< 0.05) correlation was observed only in the R range of spectrum; the Pearson correlation coefficient reached –0.67. In B and FR-NIR bands, r reached –0.49 and 0.5, respectively; however, the correlation was not significant.
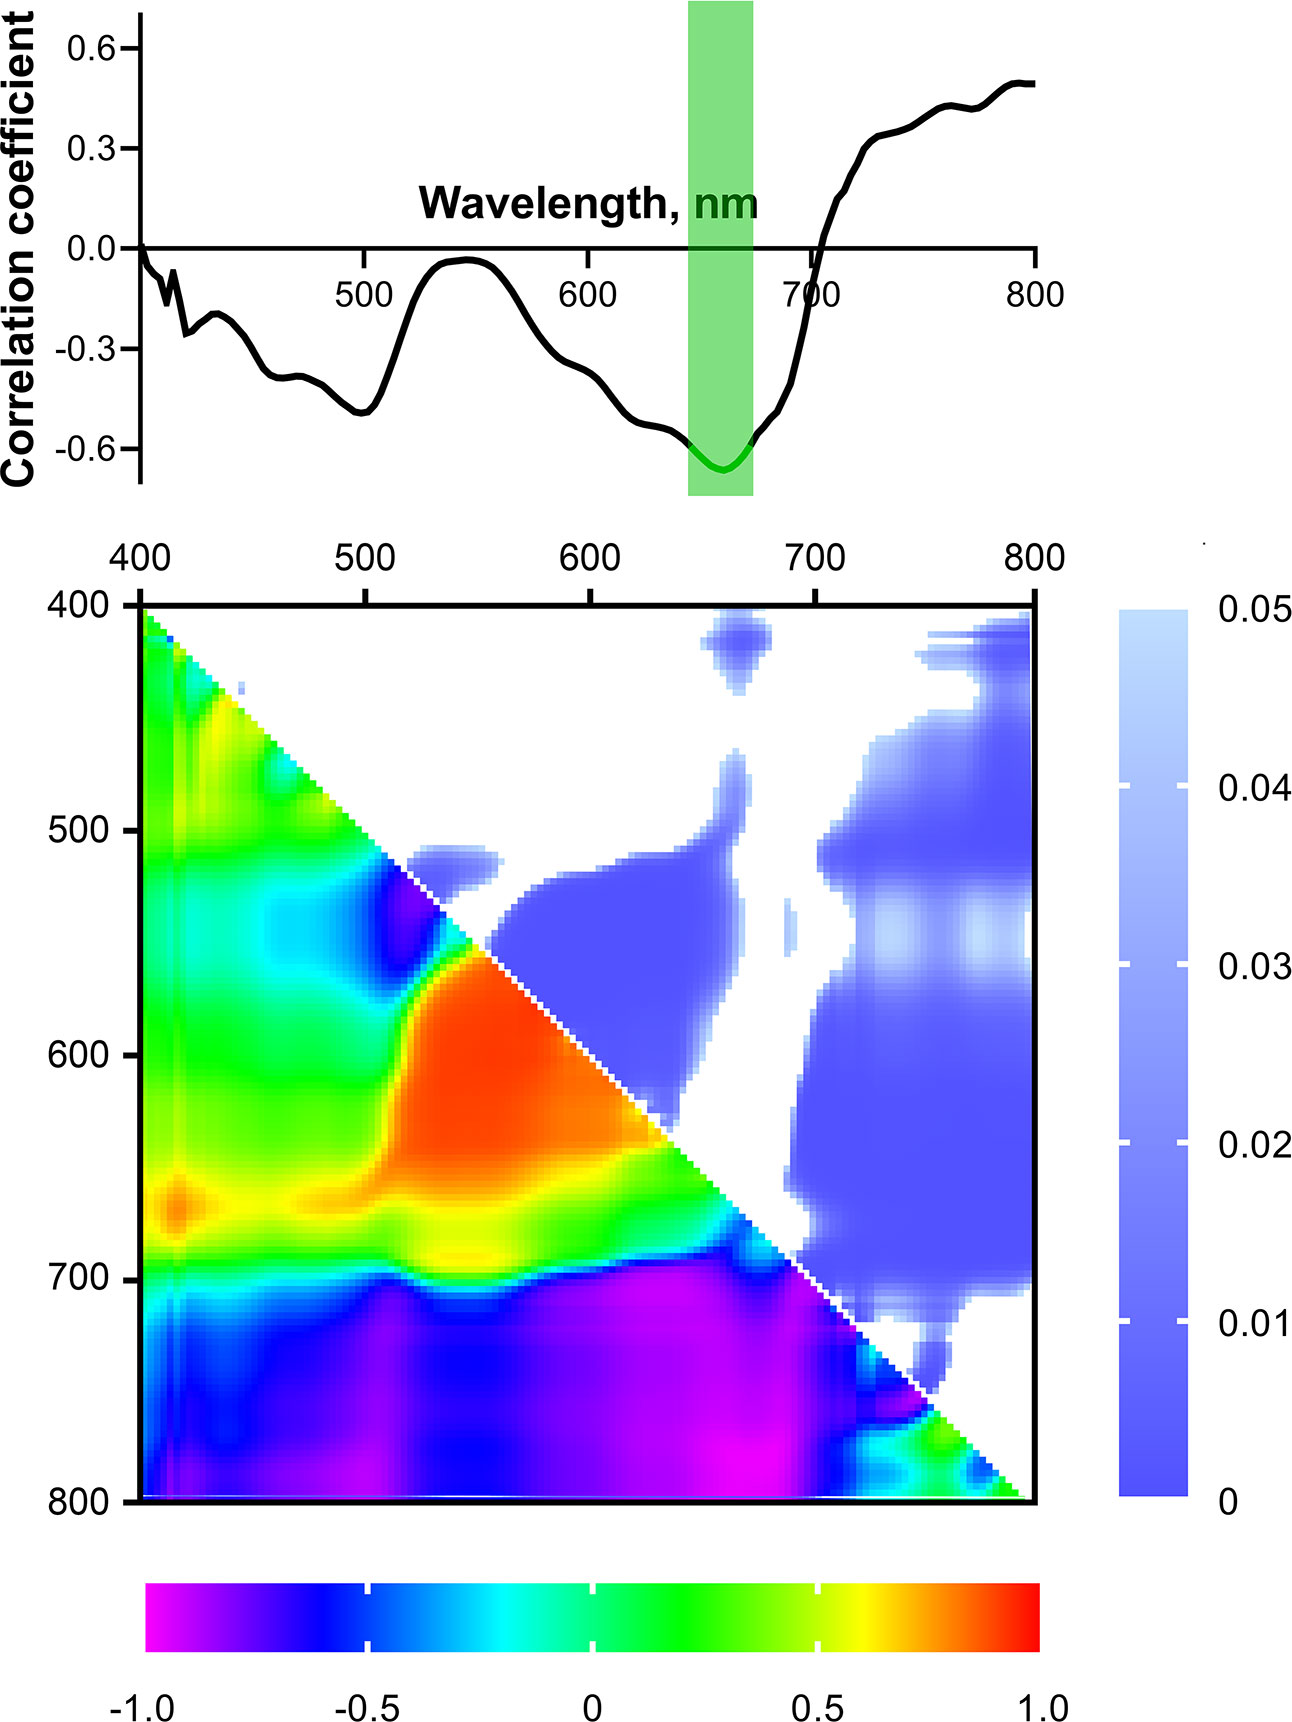
Figure 7 Spectrum and heat map of Pearson correlation coefficients between HS parameters of 2-week-old and DW of 4-week-old wheat plants. Area of the spectrum with statistically significant correlation is highlighted in green. Heat map shows correlation coefficients (bottom left) and p-values (top right).
Next, NDIs calculated for all combinations of wavelengths in the range from 400 to 800 nm were considered as potential predictors of biomass accumulation. Figure 7 shows a heat map of correlation coefficients between NDIs of shoots of 2-week-old wheat seedlings and DW of 4-week-old ones. The highest correlation coefficients were observed for NDIs calculated using wavelengths in the R and FR-NIR bands. Pearson correlation coefficients reached 0.91 and –0.97 (p< 0.05) for NDI(λ1 580-670; λ2 520-600) and NDI(λ1 710-800; λ2 400-700), respectively.
3.2.2 ChlF parameters
An analysis of the relationship between ChlF parameters of 2-week-old wheat seedlings and the dry weight of 4-week-old plants showed that a number of parameters of photosynthetic activity at an early age correlate with the biomass accumulation at a later age (Table 5). In particular, a significant correlation of DW with stationary parameters of photosynthetic activity in a state adapted to light was shown (a positive correlation with ΦPSII (r = 0.74) and a negative correlation with NPQ (r = –0.70)). In addition, a number of parameters reflecting transient processes caused by changes in lighting conditions were negatively correlated with the biomass accumulation [r = –0.69 for t1/2(ΦPSIIef) and r = –0.77 for t(NPQmax)].

Table 5 Correlation coefficients between ChlF parameters of 2-week-old wheat seedlings and the dry weight of 4-week-old plants.
3.3 Predictors of drought tolerance
3.3.1 HS parameters
To search for predictors of drought tolerance of wheat, a correlation analysis between the reflectance parameters of 2-week-old plants and the drought tolerance index, estimated by the residual DW of 4-week-old drought-stressed plants (in % of control) was carried out. However, no significant relationship was shown between the drought tolerance index and the reflectance of 2-week-old seedlings in the wavelength range from 400 to 800 nm (Figure 8). A similar result was obtained for the residual levels of ChlF parameters, reflecting the tolerance of the PSA to water deficiency (Figure 9).
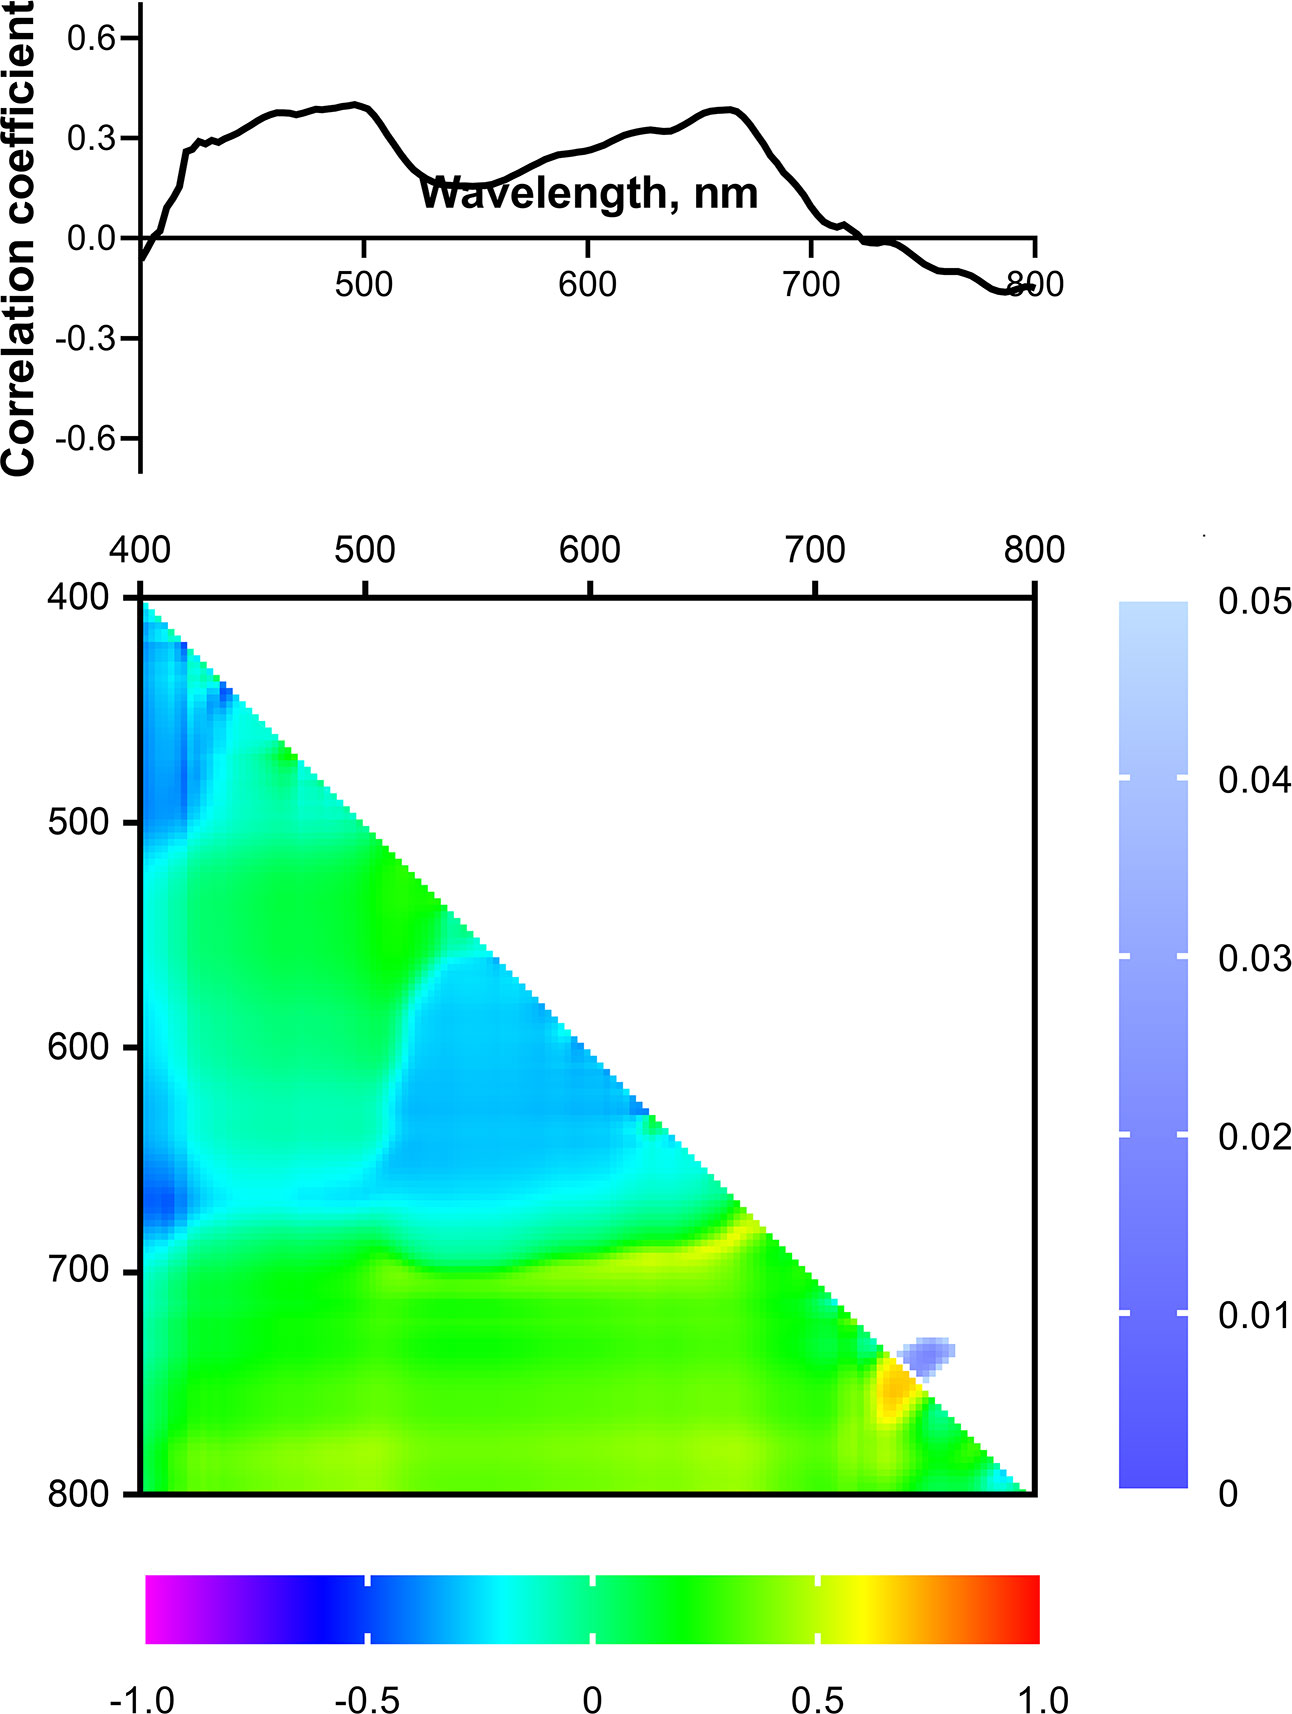
Figure 8 Spectrum and heat map of Pearson correlation coefficients between HS parameters of 2-week-old wheat plants and the drought tolerance index of 4-week-old wheat plants. Heat map shows correlation coefficients (bottom left) and p-values (top right).
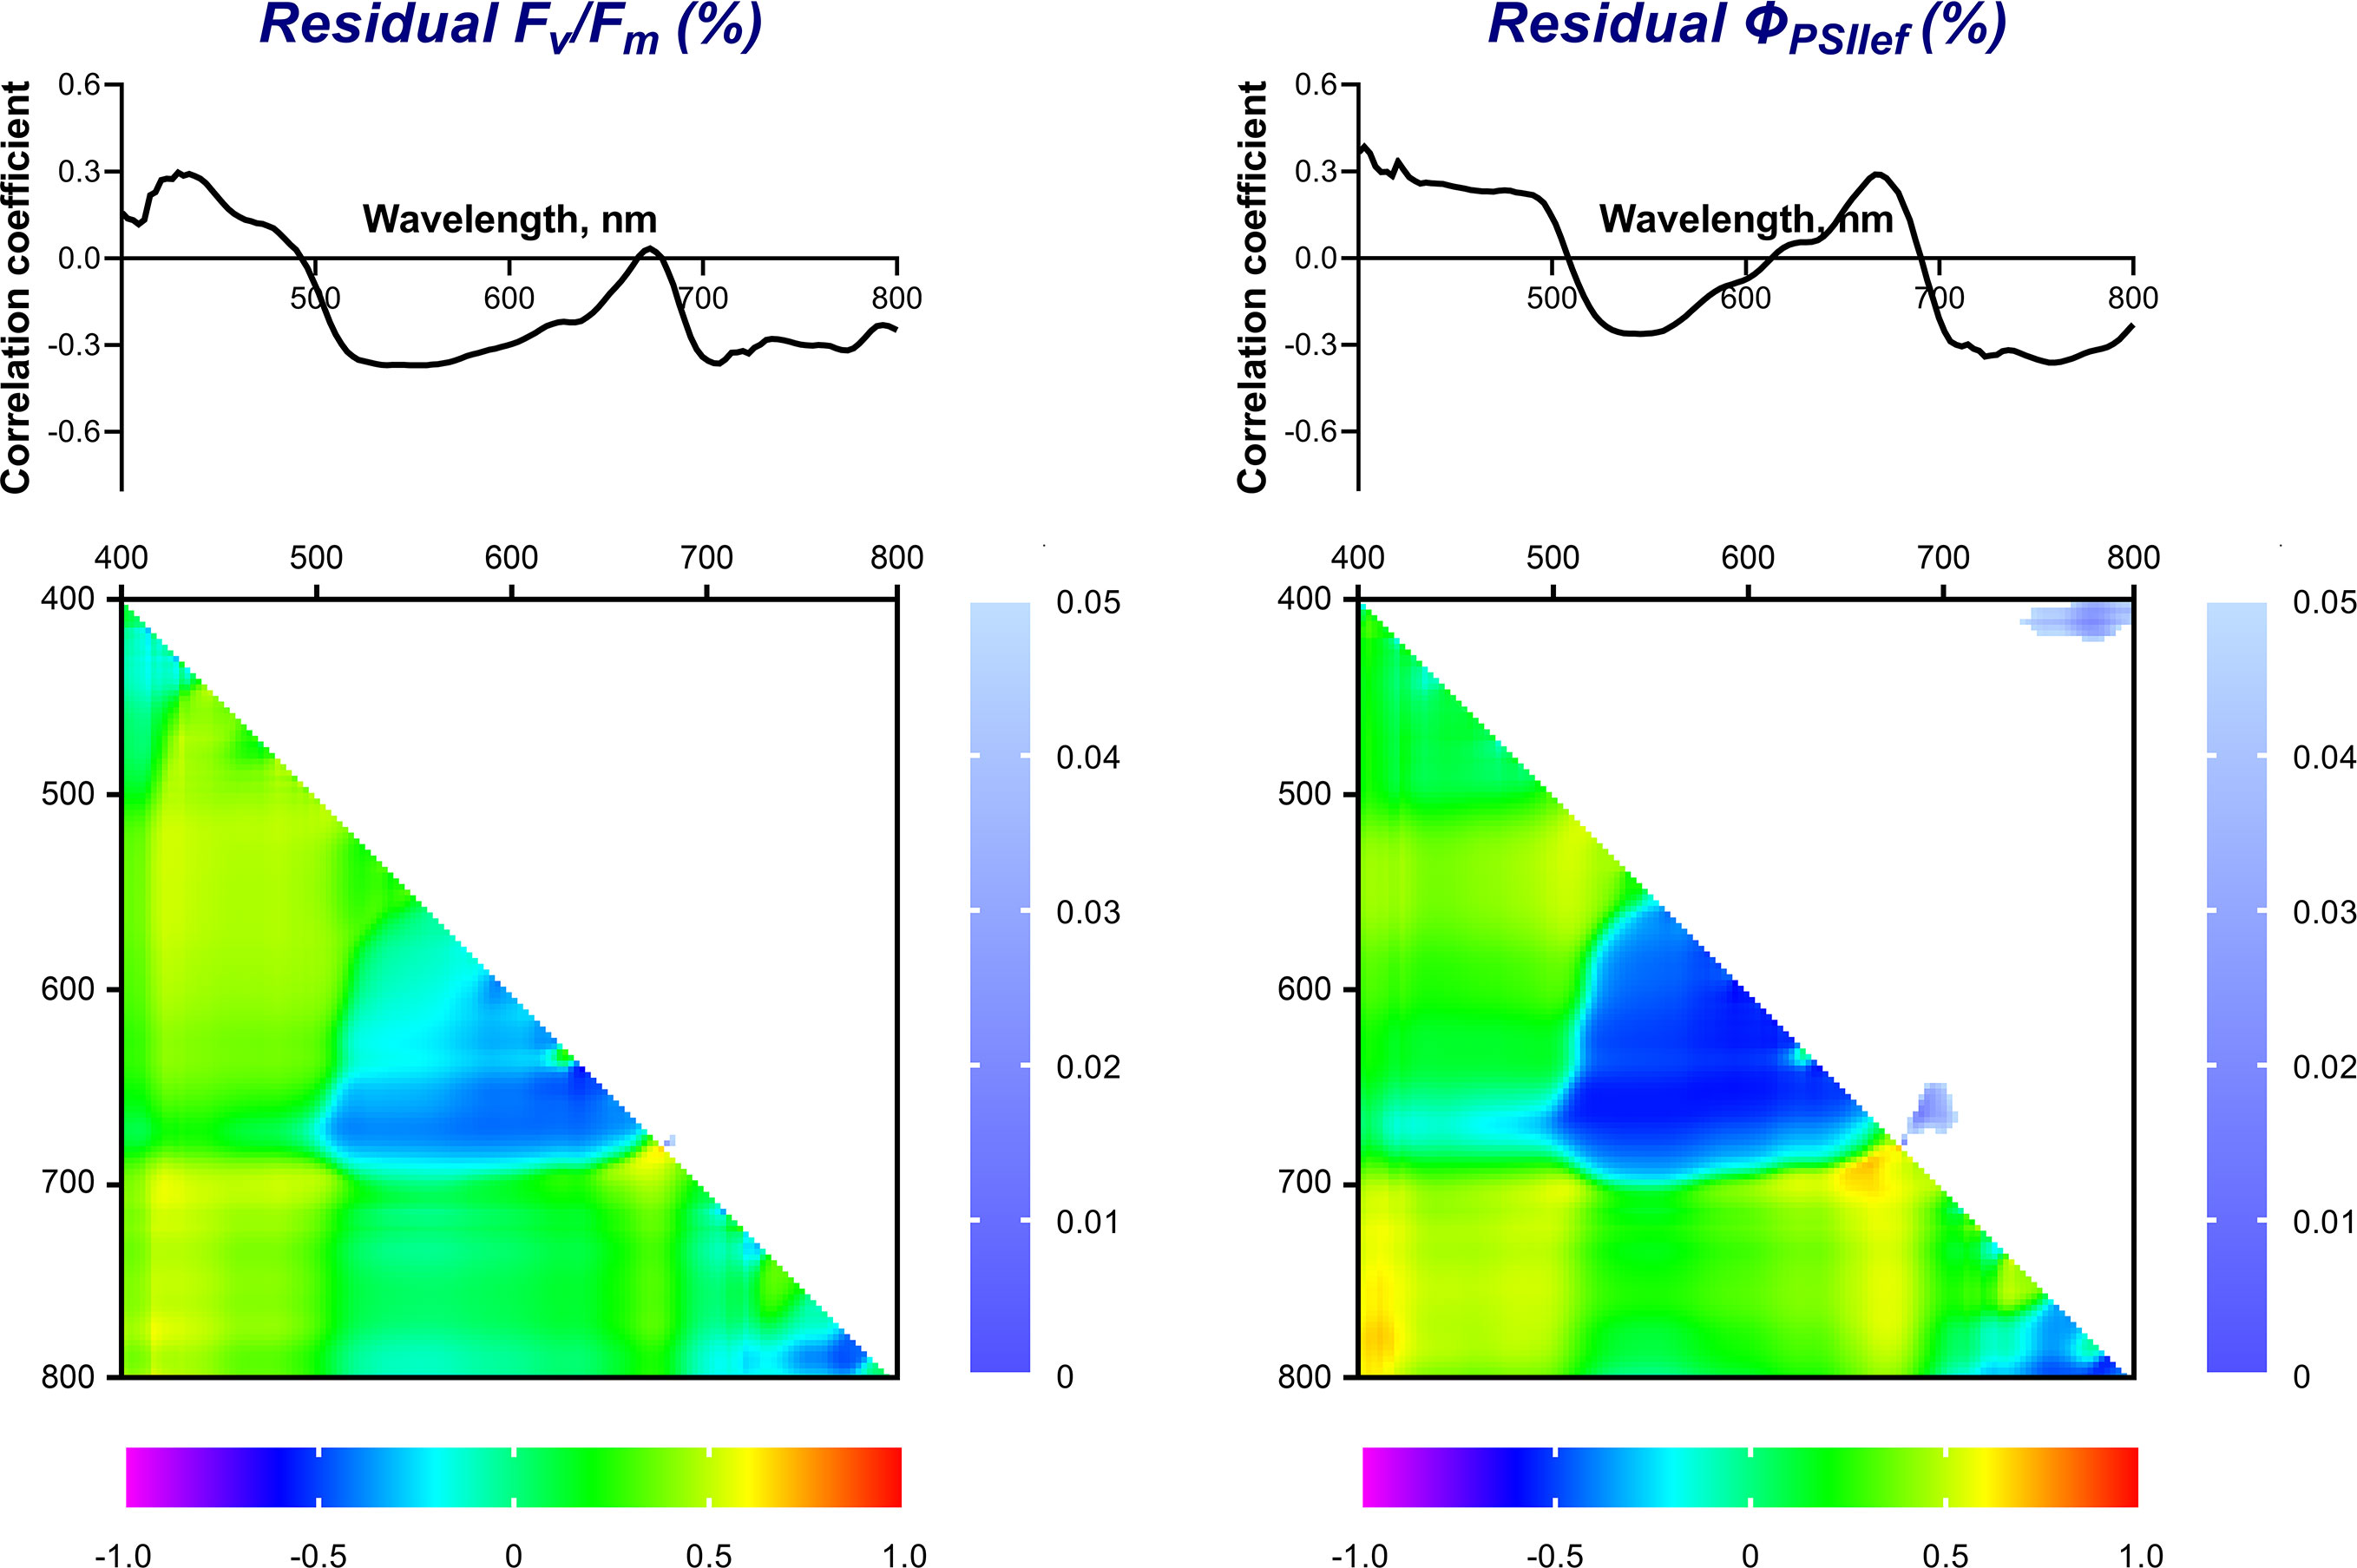
Figure 9 Spectra and heat maps of Pearson correlation coefficients between HS of 2-week-old and residual levels of ChlF parameters of 4-week-old wheat plants. Heat maps show correlation coefficients (bottom left) and p-values (top right).
Statistically significant correlation of the NDIs (considered as potential predictors of drought tolerance) with the drought tolerance index and residual levels of ChlF parameters were also not observed (Figures 8, 9). We did not take significant areas of heat maps for the drought tolerance index and residual ΦPSII into further analysis due to their small size and low correlation coefficients.
3.3.2 ChlF parameters
As in the case of spectral characteristics, correlation analysis of the relationship between ChlF parameters and drought tolerance also did not show a significant correlation (Table 6).

Table 6 Correlation coefficients between ChlF parameters of 2-week-old wheat seedlings and drought tolerance of 4-week-old plants.
3.4 Predictors of heat tolerance
3.4.1 HS parameters
The hot plate temperature at which ΦPSII decreased below the initial control value at 25°C (tdec) was used as a criterion for the tolerance of wheat seedlings to heat. Cultivars that exhibited later ΦPSII suppression were considered more tolerant, and vice versa. Figure 10 shows the spectrum of correlation coefficients between tdec for 4-week-old wheat plants and reflectance in the range of 400-800 nm for 2-week-old seedlings. A significant (p< 0.05) positive correlation of these parameters was observed in the R range (610-675 nm); Pearson correlation coefficient reached 0.71.
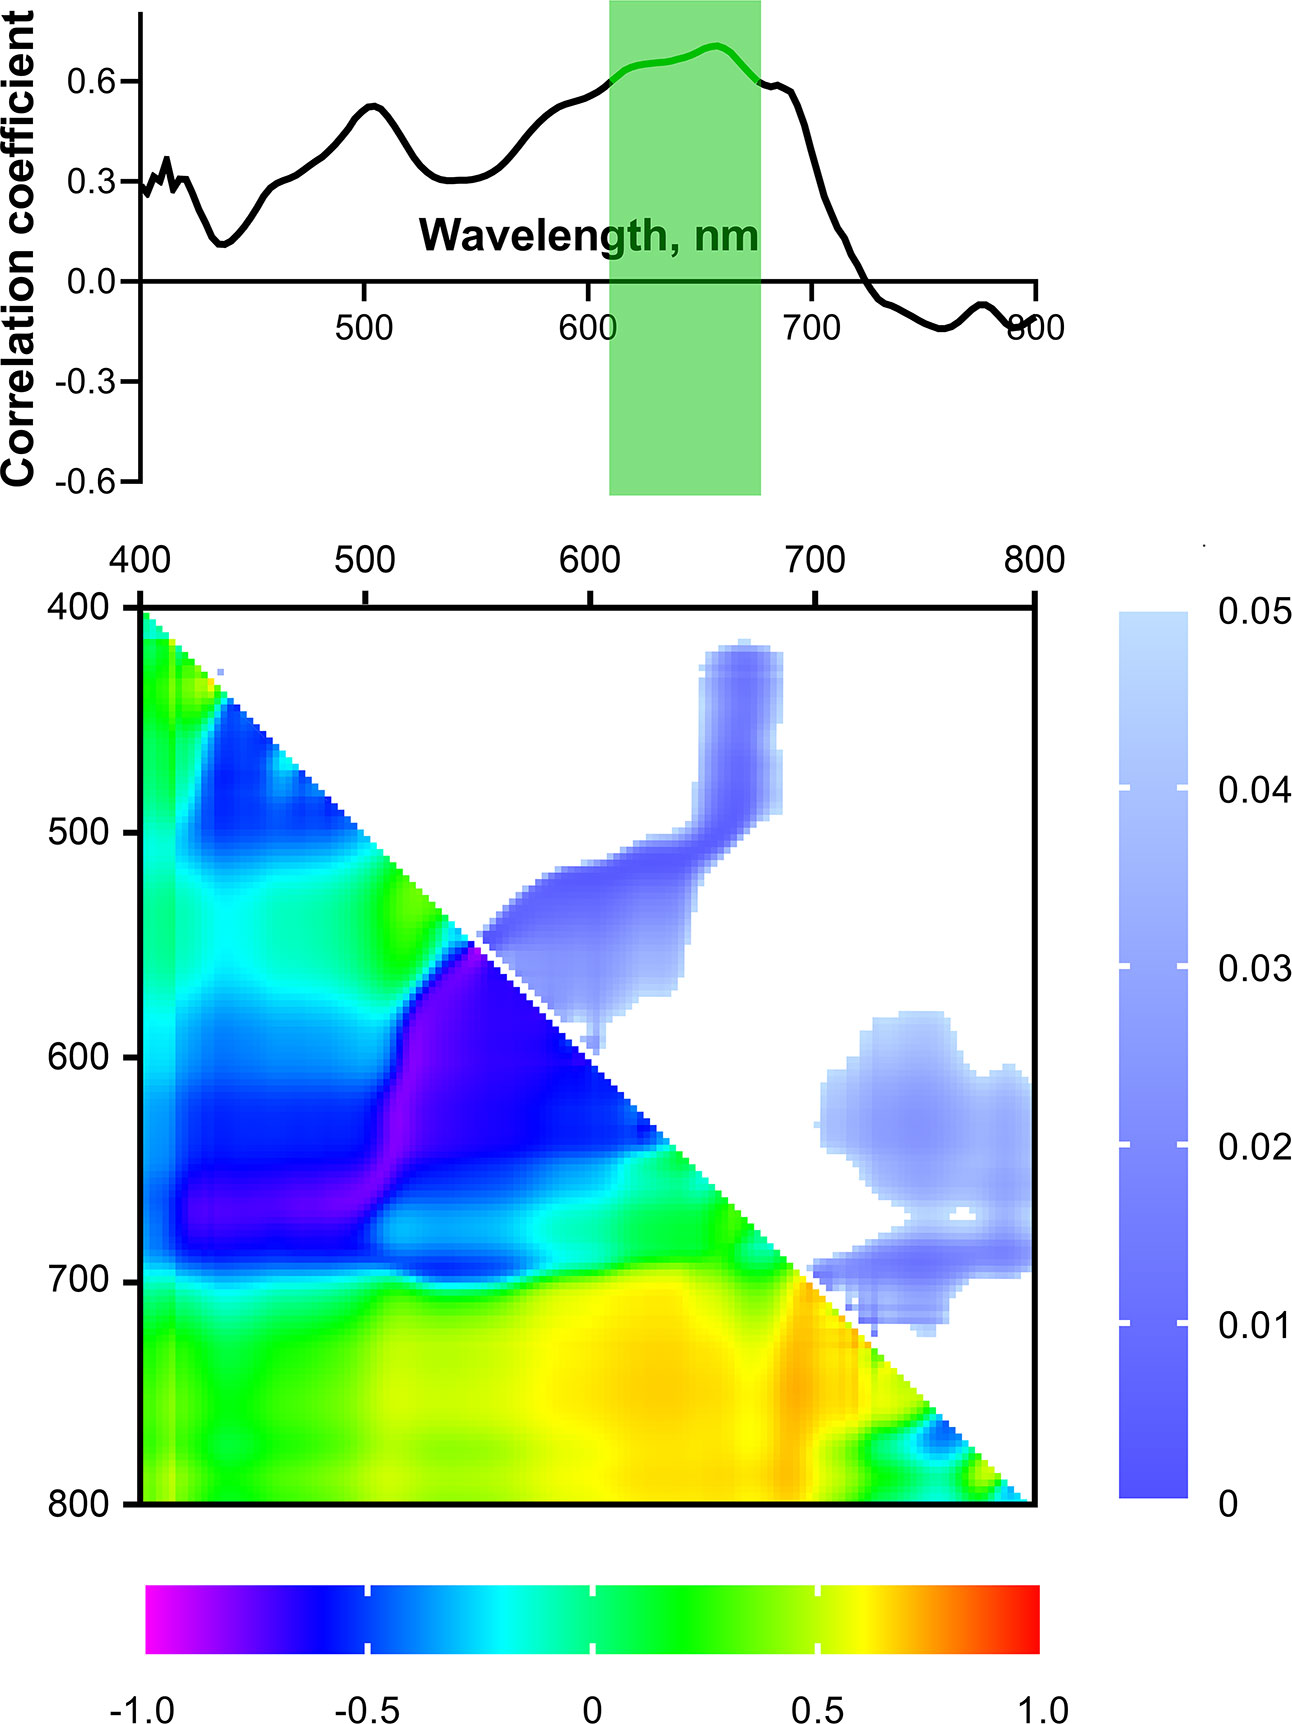
Figure 10 Spectrum and heat map of Pearson correlation coefficients between HS parameters of 2-week-old and heat tolerance of 4-week-old wheat plants. Area of the spectra with statistically significant correlation is highlighted in green. Heat map shows correlation coefficients (bottom left) and p-values (top right).
Correlation analysis of the relationship between NDIs of 2-week-old plants and heat tolerance revealed two large areas with significant correlation on the heat map (Figure 10): R range [NDI(λ1 580-630; λ2 520-570), NDI(λ1 650-690; λ2 420-500)] and FR-NIR range (NDI(λ1 400-700; λ2 710-800)); Pearson correlation coefficients reached 0.91, 0.0.91, and –0.97, respectively (p< 0.05).
3.4.2 ChlF parameters
The tolerance of 4-week-old wheat seedlings to heat, assessed by tdec, was positively correlated with t1/2(ΦPSIIef) (r = 0.66) and t(NPQmax) (r = 0.76), reflecting the rate of transient processes in PSA after switching on the AL (Table 7). No pronounced relationship with stationary parameters was observed.

Table 7 Correlation coefficients between ChlF parameters of 2-week-old and heat tolerance of 4-week-old wheat plants.
4 Discussion
Early phenotyping-based prediction of economically important wheat traits, such as grain yield and tolerance to stressors, is a good way to develop methods for accelerating the selection of promising lines in the breeding process. In our study, the predicted traits were tolerance to heat and drought, as well as biomass accumulation, which, like yield, is largely determined by the intensity of the production process. We have previously shown that the biomass of young wheat plants correlates well with the biomass of older plants under controlled conditions (Sherstneva et al., 2021). In the field, wheat yield has been demonstrated to be related to both the biomass of mature plants (Okuyama et al., 2004; White and Wilson, 2006; Thapa et al., 2019) and the biomass of significantly younger plants, including under different conditions of water availability (Thapa et al., 2019). The presence of a relationship between yield and biomass suggests that the latter is an important target trait during phenotyping at the early stages of breeding research.
4.1 Relationship between spectral and fluorescent parameters in wheat seedlings
An important part of this work was the study of the relationship between reflectance parameters recorded using HS sensors and ChlF parameters recorded by PAM fluorometry. An obvious advantage of multi- and hyperspectral phenotyping methods is their high throughput and ability to perform measurements over wide spatial scales. Non-invasively obtained canopy reflectance parameters are widely used to evaluate the structural and biochemical characteristics of wheat (Al-Tamimi et al., 2022; Skendžić et al., 2023; Zhang et al., 2023). The PAM fluorometry method, which directly provides information on the activity of photosynthesis, a key physiological process that determines productivity, has both spatial and temporal limitations. In this regard, studies aimed at assessing the photosynthetic activity of plants based on reflectance parameters, as well as the search for such parameters correlating with ChlF parameters, have become widespread (Sukhova and Sukhov, 2018; Pérez-Bueno et al., 2019; Fu et al., 2022).
In our work, a number of ChlF parameters were determined and classified into two groups. The first group (stationary parameters) includes such parameters as Fv/Fm, ΦPSIIef, and NPQs which reflect the functioning of PSA in a state adapted to darkness or light. The second group (transient parameters) includes the parameters t1/2(ΦPSIIef), NPQmax, and t(NPQmax) which reflect transient processes when actinic light is switched on after dark adaptation. The relationship of the recorded ChlF parameters with the reflectance spectra of wheat leaves and NDIs, calculated from all combinations of recorded wavelengths in the range of 400-800 nm, was analyzed. Three wavelength ranges, demonstrating a strong relationship with PAM parameters, were identified (Figure 5): Blue (B, 420-490 nm), Red (R, 640-690 nm) and FR-NIR (710-800 nm).
Fv/Fm and ΦPSIIef (included in the group of stationary parameters) negatively correlated with the B and R bands of the VIS spectral range. It is known that leaf reflectance in VIS depends primarily on the pigment composition of the green parts of plants (Li et al., 2014; Liu et al., 2022). It can be assumed that the content of chlorophyll, which has absorption maxima in the B and R spectral bands, determines the relationship of these spectral bands with stationary ChlF parameters. The relationship between Fv/Fm and ΦPSIIef and chlorophyll content is a well-known fact (Kalaji et al., 2017).
Reflectance in the FR-NIR range was associated with ChlF parameters reflecting transient processes caused by the dark-light transition (NPQmax, t(NPQmax), t1/2(ΦPSIIef)). The rate of change in the ΦPSII and NPQ parameters when actinic light is switched on is determined by the rate of achieving a balance between the production of NADPH and ATP in the light-dependent photosynthetic reactions and their consumption in the reactions of the Calvin-Benson cycle (Baker, 2008). The activity of the Calvin-Benson cycle reactions is largely determined by the availability of the substrate – CO2 (Baker, 2008; Flexas et al., 2008; Zhu et al., 2010; Tholen and Zhu, 2011). In this regard, it is important to note that the optical properties of the green parts of plants in the FR-NIR range, characterized by a high reflectance, are determined by the structural features of plant tissues (Ollinger, 2011). In particular, the intensity of NIR light reflection positively correlates with the volume of intercellular air spaces (Ustin and Jacquemoud, 2020), including at wavelengths in the range we studied (Slaton et al., 2001). The looser mesophyll may contribute to the greater possible rate of influx of CO2 consumed in cells in the Calvin-Benson cycle.
Spectral indices (NDIs), calculated for the entire studied spectral range, showed a more complex relationship with the parameters of photosynthetic activity. Two significant areas were identified on the heat maps of NDIs correlations against ChlF parameters: area for λ1 in R band and area for λ1 in FR-NIR band. The highest NDIs correlations in the R range were found for ΦPSIIef and NPQs. It is worth noting that these parameters characterize the activity of photosynthetic processes in a state adapted to light. Strong relationship of NDIs in the indicated range was also for t1/2(ΦPSIIef) and t(NPQmax); however, the size of this region was significantly smaller. The second wide area on the NDIs heat map with high correlation coefficients (FR-NIR) appeared predominantly for the parameters t1/2(ΦPSIIef), NPQmax and t(NPQmax) which characterize transient processes in the photosynthetic apparatus caused by the switching on the actinic light. At the same time, stationary parameters correlated with NDIs in a much narrower range. This effect for NDIs fits into the nature of the relationship between the reflectance spectrum and the ChlF parameters, described above; in this case, R and FR-NIR can serve as measuring wavelength ranges to characterize stationary and transient processes in the photosynthetic apparatus.
The search for the relationship between NDIs in the studied wavelength range and ChlF parameters of wheat has been described in a number of works. In particular, NDVI (Normalized difference vegetation index) was significantly positively correlated with Fv/Fm in wheat under optimal conditions (El-Hendawy et al., 2019). The NDVI and NDRE (Red edge NDVI) indices showed a positive relationship with Fv/Fm in unstressed leaves of aspen and cherry trees (Peng et al., 2017). The work of Sukhova and Sukhov (Sukhova and Sukhov, 2020) showed that the light-induced changes in the PRIs (ΔPRIs) can be used to assess a number of parameters of PSI and PSII activity.
4.2 Search for predictors of biomass accumulation in wheat seedlings
During the search for predictors of biomass accumulation, a number of parameters determined by HS and PAM methods in young plants demonstrated a relationship with the biomass of older plants. Considering the spectral characteristics, we can highlight the R range (650-670 nm), which showed a significant negative correlation with DW of 4-week-old seedlings (Figure 7). When examining the predictive potential of spectral indices, two regions on the NDIs heat map with a significant correlation against the DW of 4-week-old seedlings were found: R and FR-NIR ranges (Figure 7). It is worth noting that the identified ranges of statistically significant correlations between NDIs and biomass accumulation include such widely used spectral indices as GNDVI (Green normalized difference vegetation index, (R780–R550)/(R780+R550) (Aparicio et al., 2000), and RNDVI (Red normalized difference vegetation index, (R780−R670)/(R780+R670) (Raun et al., 2001). GNDVI and RNDVI, recorded using a spectrometer with high spectral resolution, showed a high positive correlation with yield under full irrigation conditions (El-Hendawy et al., 2017). NDVI (λ1 774, λ2 656) recorded by a multispectral sensor was positively correlated with the yield of irrigated wheat; moreover, the yield significantly correlated with the aboveground biomass (Thapa et al., 2019). Grain yield and biomass were also positively correlated with GNDVI and RNDVI, starting from the tillering stage, under different irrigation and nitrogen levels (S. Pradhan et al., 2012). These data are consistent with the results of our work, which indicate a significant positive relationship between NDIs in FR-NIR region and biomass accumulation in wheat plants.
Correlation analysis of the relationship between potential fluorescent predictors and biomass accumulation revealed a significant correlation with stationary ChlF parameters (ΦPSIIef and NPQs), as well as with transient parameters of light-induced ChlF dynamics [t1/2(ΦPSIIef) and t(NPQmax)]. Our previous work (Sherstneva et al., 2021), carried out using other cultivars, also showed the potential of ΦPSIIef and t1/2(ΦPSIIef) for predicting seedling biomass. At the same time, t1/2(ΦPSIIef) maintained a significant correlation with biomass accumulation with increasing prediction period.
It is worth noting that the identified HS and ChlF predictors are related to each other. The presence of such a connection suggests a generic physiological basis for the predictive potential of the fluorescent and spectral parameters used. In particular, the R range of the correlation spectrum with DW lies in the region of high correlation of the reflectance spectrum with ΦPSIIef of plants of the same age (Figure 5). This relationship is consistent with the high positive correlation between these ChlF parameters and biomass accumulation 2 weeks after the ChlF recording (Table 5). ΦPSIIef as a stationary parameter of photosynthetic activity in the light-adapted state reflects the efficiency of using the energy of absorbed light by photosystems and is linearly related to the rate of CO2 assimilation (Leipner et al., 1999; Maxwell and Johnson, 2000; Baker, 2008). These processes directly influence the synthesis of organic matter and the rate of biomass accumulation (Kruger and Volin, 2006; Ferguson et al., 2021). The parameter t1/2(ΦPSIIef), which characterizes the rate at which maximum quantum efficiency is achieved after actinic light is switched on, depends on the rate of activation of the Calvin-Benson cycle (Baker, 2008), which is regulated, in particular, by CO2 availability. The greater availability of CO2 determines the intensification of the production process, leading to more intensive accumulation of biomass. In the case of NDIs heat maps, the significant R region of correlation with biomass accumulation coincided to a greater extent with that for heat maps of NDIs correlations against stationary parameters of ChlF (ΦPSIIef, NPQs). On the other hand, the significant region for FR-NIR range corresponded predominantly to heat maps of NDIs correlations against the transient ChlF parameters [t1/2(ΦPSIIef), t(NPQmax)] (Figure 5). In particular, as noted earlier, such a relationship between the ChlF parameters which characterize the rate of optimization of the dark reactions activity regulated by CO2 availability, and HS parameters in the FR-NIR range may be due to the structural characteristics of the leaves, in particular, the volume of intercellular air spaces (Ustin and Jacquemoud, 2020), promoting more intense gas exchange and, as a result, greater availability of CO2.
4.3 Search for predictors of tolerance of wheat seedlings to drought
The drought tolerance index (reflecting the percentage ratio between the DW of experimental and control plants) was used as the main criterion for tolerance of wheat seedlings to water deficiency. Additional tolerance criteria (residual levels of photosynthetic activity parameters in plants affected by drought, also expressed as a percentage of control levels) were also used. A statistically significant correlation between residual ΦPSIIef and the drought tolerance index was found (Table 3), which is consistent with the data of earlier work, which showed the relationship between the drought tolerance index and residual ΦPSIIef 2 weeks after stopping irrigation (Sherstneva et al., 2021). An approach to assessing drought tolerance based on the use of several criteria worked well in the search for fluorescent predictors of tolerance in wheat seedlings (Sherstneva et al., 2021) and made it possible to evaluate drought-induced suppression of physiological processes in plants. However, despite the wide range of wavelengths and high spectral resolution of the data obtained in our work, which provides high information content of the method, no strong relationship between HS and drought tolerance parameters was identified (Figures 8, 9). This effect persisted for both reflectance and NDIs. Analysis of the predictive potential of ChlF parameters of 2-week-old seedlings also did not reveal their connection with tolerance to 14-day drought.
At the moment, there is a sufficient number of works devoted to the prediction of economically important traits of wheat under conditions of water deficiency (Aparicio et al., 2000; Bandyopadhyay et al., 2014; Tattaris et al., 2016; Becker and Schmidhalter, 2017; El-Hendawy et al., 2017; Condorelli et al., 2018; Thapa et al., 2019). In this case, HS parameters covering a wide range of wavelengths are used. In particular, water and other indices that take into account the reflectance in a longer wavelengths region than the range recorded in our work have shown their efficiency (Bandyopadhyay et al., 2014; Becker and Schmidhalter, 2017; El-Hendawy et al., 2017). Such indices may show a higher and more significant correlation with plant yield under water deficit conditions compared to indices in the range up to 800 nm (Becker and Schmidhalter, 2017; El-Hendawy et al., 2017). In addition, there are works showing the potential of NDVI for predicting biomass accumulation (Tattaris et al., 2016; El-Hendawy et al., 2017; Condorelli et al., 2018) and crop yield (Aparicio et al., 2000; Tattaris et al., 2016; Becker and Schmidhalter, 2017; El-Hendawy et al., 2017; Thapa et al., 2019) under conditions of water deficiency. At the same time, only a few studies used spectral predictors recorded under control conditions. In particular, the work of Condorelli et al. (Condorelli et al., 2018) showed the potential of NDVI recorded before the irrigation stop to predict wheat biomass at the terminal stage of drought. In another work, some vegetation and water indices recorded under full irrigation correlated with the yield index and a number of drought tolerance parameters of spring wheat (El-Hendawy et al., 2017).
4.4 Search for predictors of tolerance of wheat seedlings to heat
The next step was to assess the relationship between HS predictors and the tolerance of wheat seedlings to elevated temperatures. A fairly wide spectral band that significantly correlated with tolerance to heating two weeks after HS imaging was discovered (Figure 10). This range partially coincided with that for biomass accumulation under control conditions (Figure 7). Heat maps of correlations of NDIs with tolerance also showed partial overlap of significant regions with a heat map of correlations against biomass accumulation in the R band. The direction of the correlation for biomass accumulation and heat tolerance was opposite.
It is also important to note that ChlF parameters which have a statistically significant correlation with heat tolerance (Table 7), also correlated with productivity. As in the case of spectral characteristics, the correlation of these parameters with biomass and heat tolerance had the opposite trend. This result is consistent with the fact that heat tolerance was negatively correlated with biomass accumulation (r = –0.7, p = 0.02).
The discovered patterns can apparently be due to a number of causes. It is known that during heat stress, reactive oxygen species (ROS), the concentration of which increases when exposed to elevated temperatures, play a significant role in plant damage, including inactivation of photosynthesis and damage to PSA in plants (Fortunato et al., 2023). The main sites for the production of excess ROS under heat stress are the photosynthetic electron transport chain and the Calvin-Benson cycle (Allakhverdiev et al., 2008). It can be assumed that the level of ROS increases more significantly under heat stress in plants with high activity of photosynthetic processes, which ensure high productivity, compared to plants with a lower level of photosynthetic activity. A greater increase in ROS can have a greater negative effect on the PSA and, as a result, on the biomass accumulation.
5 Conclusion
We found that hyperspectral (HS) characteristics determined in young wheat plants can act as predictors of biomass accumulation and tolerance to heat stress. The revealed HS predictors demonstrate a statistically significant correlation with ChlF parameters which also correlate with the studied wheat traits. The presence of a relationship between HS predictors, depending on the parameters of the composition and structure of plant tissues, and ChlF predictors, depending on the activity of photosynthetic processes, increases the reliability of the prediction and allows us to reasonably assume the physiological basis of their prognostic potential. The identified potential of HS predictors determines the possibilities for accelerating the breeding process. Selection of the most promising genotypes at the early stages will significantly reduce the consumption of resources and time for further breeding trials.
Further research should focus on determination of a detailed relationship between the identified predictors and biochemical, physiological and structural parameters of plants, as well as genetic markers. Taken together, this approach will not only increase the reliability of forecasts, but will also contribute to reliable modeling of plant growth and development in various conditions based on genotyping and early phenotyping.
Data availability statement
The original contributions presented in the study are included in the article/Supplementary Material. Further inquiries can be directed to the corresponding author.
Author contributions
OS: Conceptualization, Formal Analysis, Investigation, Methodology, Writing – original draft, Writing – review & editing. FA: Visualization, Writing – review & editing. DK: Investigation, Writing – review & editing. LY: Writing – review & editing. EG: Investigation, Writing – review & editing. VV: Conceptualization, Funding acquisition, Project administration, Writing – original draft, Writing – review & editing.
Funding
The author(s) declare financial support was received for the research, authorship, and/or publication of this article. This research was funded by the Ministry of Science and Higher Education of the Russian Federation, grant number 075-15-2021-1066.
Conflict of interest
The authors declare that the research was conducted in the absence of any commercial or financial relationships that could be construed as a potential conflict of interest.
Publisher’s note
All claims expressed in this article are solely those of the authors and do not necessarily represent those of their affiliated organizations, or those of the publisher, the editors and the reviewers. Any product that may be evaluated in this article, or claim that may be made by its manufacturer, is not guaranteed or endorsed by the publisher.
Supplementary material
The Supplementary Material for this article can be found online at: https://www.frontiersin.org/articles/10.3389/fpls.2024.1344826/full#supplementary-material
References
Allakhverdiev, S. I., Kreslavski, V. D., Klimov, V. V., Los, D. A., Carpentier, R., Mohanty, P. (2008). Heat stress: an overview of molecular responses in photosynthesis. Photosynth Res. 98, 541–550. doi: 10.1007/s11120-008-9331-0
Alotaibi, F., Alharbi, S., Alotaibi, M., Al Mosallam, M., Motawei, M., Alrajhi, A. (2021). Wheat omics: Classical breeding to new breeding technologies. Saudi J. Biol. Sci. 28, 1433–1444. doi: 10.1016/j.sjbs.2020.11.083
Al-Tamimi, N., Langan, P., Bernád, V., Walsh, J., Mangina, E., Negrão, S. (2022). Capturing crop adaptation to abiotic stress using image-based technologies. Open Biol. 12, 210353. doi: 10.1098/rsob.210353
Aparicio, N., Villegas, D., Casadesus, J., Araus, J. L., Royo, C. (2000). Spectral vegetation indices as nondestructive tools for determining durum wheat yield. Agron. J. 92, 83–91. doi: 10.2134/agronj2000.92183x
Baker, N. R. (2008). Chlorophyll fluorescence: A probe of photosynthesis in vivo. Annu. Rev. Plant Biol. 59, 89–113. doi: 10.1146/annurev.arplant.59.032607.092759
Bandyopadhyay, K. K., Pradhan, S., Sahoo, R. N., Singh, R., Gupta, V. K., Joshi, D. K., et al. (2014). Characterization of water stress and prediction of yield of wheat using spectral indices under varied water and nitrogen management practices. Agric. Water Manage. 146, 115–123. doi: 10.1016/j.agwat.2014.07.017
Becker, E., Schmidhalter, U. (2017). Evaluation of yield and drought using active and passive spectral sensing systems at the reproductive stage in wheat. Front. Plant Sci. 8. doi: 10.3389/fpls.2017.00379
Bhandari, M., Baker, S., Rudd, J. C., Ibrahim, A. M. H., Chang, A., Xue, Q., et al. (2021). Assessing the effect of drought on winter wheat growth using unmanned aerial system (UAS)-based phenotyping. Remote Sens. 13, 1144. doi: 10.3390/rs13061144
Condorelli, G. E., Maccaferri, M., Newcomb, M., Andrade-Sanchez, P., White, J. W., French, A. N., et al. (2018). Comparative aerial and ground based high throughput phenotyping for the genetic dissection of NDVI as a proxy for drought adaptive traits in durum wheat. Front. Plant Sci. 9. doi: 10.3389/fpls.2018.00893
Crain, J., Mondal, S., Rutkoski, J., Singh, R. P., Poland, J. (2018). Combining high-throughput phenotyping and genomic information to increase prediction and selection accuracy in wheat breeding. Plant Genome 11, 170043. doi: 10.3835/plantgenome2017.05.0043
Dos Santos, T. B., Ribas, A. F., De Souza, S. G. H., Budzinski, I. G. F., Domingues, D. S. (2022). Physiological responses to drought, salinity, and heat stress in plants: A review. Stresses 2, 113–135. doi: 10.3390/stresses2010009
El-Hendawy, S., Elshafei, A., Al-Suhaibani, N., Alotabi, M., Hassan, W., Dewir, Y. H., et al. (2019). Assessment of the salt tolerance of wheat genotypes during the germination stage based on germination ability parameters and associated SSR markers. J. Plant Interact. 14, 151–163. doi: 10.1080/17429145.2019.1603406
El-Hendawy, S. E., Hassan, W. M., Al-Suhaibani, N. A., Schmidhalter, U. (2017). Spectral assessment of drought tolerance indices and grain yield in advanced spring wheat lines grown under full and limited water irrigation. Agric. Water Manage. 182, 1–12. doi: 10.1016/j.agwat.2016.12.003
Ferguson, J. N., Tidy, A. C., Murchie, E. H., Wilson, Z. A. (2021). The potential of resilient carbon dynamics for stabilizing crop reproductive development and productivity during heat stress. Plant Cell Environ. 44, 2066–2089. doi: 10.1111/pce.14015
Flexas, J., Ribas-Carbó, M., Diaz-Espejo, A., Galmés, J., Medrano, H. (2008). Mesophyll conductance to CO2: current knowledge and future prospects. Plant Cell Environ. 31, 602–621. doi: 10.1111/j.1365-3040.2007.01757.x
Fortunato, S., Lasorella, C., Dipierro, N., Vita, F., De Pinto, M. C. (2023). Redox signaling in plant heat stress response. Antioxidants 12, 605. doi: 10.3390/antiox12030605
Fu, P., Montes, C. M., Siebers, M. H., Gomez-Casanovas, N., McGrath, J. M., Ainsworth, E. A., et al. (2022). Advances in field-based high-throughput photosynthetic phenotyping. J. Exp. Bot. 73, 3157–3172. doi: 10.1093/jxb/erac077
Gosa, S. C., Lupo, Y., Moshelion, M. (2019). Quantitative and comparative analysis of whole-plant performance for functional physiological traits phenotyping: New tools to support pre-breeding and plant stress physiology studies. Plant Sci. 282, 49–59. doi: 10.1016/j.plantsci.2018.05.008
Grzybowski, M., Wijewardane, N. K., Atefi, A., Ge, Y., Schnable, J. C. (2021). Hyperspectral reflectance-based phenotyping for quantitative genetics in crops: Progress and challenges. Plant Commun. 2, 100209. doi: 10.1016/j.xplc.2021.100209
Hassan, M. A., Fei, S., Li, L., Jin, Y., Liu, P., Rasheed, A., et al. (2022). Stacking of canopy spectral reflectance from multiple growth stages improves grain yield prediction under full and limited irrigation in wheat. Remote Sens. 14, 4318. doi: 10.3390/rs14174318
Hossain, A., Skalicky, M., Brestic, M., Maitra, S., Ashraful Alam, M., Syed, M. A., et al. (2021). Consequences and Mitigation Strategies of Abiotic Stresses in Wheat (Triticum aestivum L.) under the Changing Climate. Agronomy 11, 241. doi: 10.3390/agronomy11020241
Juliana, P., Montesinos-López, O. A., Crossa, J., Mondal, S., González Pérez, L., Poland, J., et al. (2019). Integrating genomic-enabled prediction and high-throughput phenotyping in breeding for climate-resilient bread wheat. Theor. Appl. Genet. 132, 177–194. doi: 10.1007/s00122-018-3206-3
Kalaji, H. M., Schansker, G., Brestic, M., Bussotti, F., Calatayud, A., Ferroni, L., et al. (2017). Frequently asked questions about chlorophyll fluorescence, the sequel. Photosynth Res. 132, 13–66. doi: 10.1007/s11120-016-0318-y
Katsoulas, N., Elvanidi, A., Ferentinos, K. P., Kacira, M., Bartzanas, T., Kittas, C. (2016). Crop reflectance monitoring as a tool for water stress detection in greenhouses: A review. Biosyst. Eng. 151, 374–398. doi: 10.1016/j.biosystemseng.2016.10.003
Kim, M., Lee, C., Hong, S., Kim, S. L., Baek, J.-H., Kim, K.-H. (2021). High-throughput phenotyping methods for breeding drought-tolerant crops. IJMS 22, 8266. doi: 10.3390/ijms22158266
Krause, M. R., González-Pérez, L., Crossa, J., Pérez-Rodríguez, P., Montesinos-López, O., Singh, R. P., et al. (2019). Hyperspectral reflectance-derived relationship matrices for genomic prediction of grain yield in wheat. G3 Genes|Genomes|Genetics 9, 1231–1247. doi: 10.1534/g3.118.200856
Kruger, E. L., Volin, J. C. (2006). Reexamining the empirical relation between plant growth and leaf photosynthesis. Funct. Plant Biol. 33, 421. doi: 10.1071/FP05310
Leipner, J., Fracheboud, Y., Stamp, P. (1999). Effect of growing season on the photosynthetic apparatus and leaf antioxidative defenses in two maize genotypes of different chilling tolerance. Environ. Exp. Bot. 42, 129–139. doi: 10.1016/S0098-8472(99)00026-X
Lesk, C., Anderson, W., Rigden, A., Coast, O., Jägermeyr, J., McDermid, S., et al. (2022). Compound heat and moisture extreme impacts on global crop yields under climate change. Nat. Rev. Earth Environ. 3, 872–889. doi: 10.1038/s43017-022-00368-8
Li, L., Zhang, Q., Huang, D. (2014). A review of imaging techniques for plant phenotyping. Sensors 14, 20078–20111. doi: 10.3390/s141120078
Lippmann, R., Babben, S., Menger, A., Delker, C., Quint, M. (2019). Development of wild and cultivated plants under global warming conditions. Curr. Biol. 29, R1326–R1338. doi: 10.1016/j.cub.2019.10.016
Liu, S., Hu, Z., Han, J., Li, Y., Zhou, T. (2022). Predicting grain yield and protein content of winter wheat at different growth stages by hyperspectral data integrated with growth monitor index. Comput. Electron. Agric. 200, 107235. doi: 10.1016/j.compag.2022.107235
Lozada, D. N., Carter, A. H. (2020). Genomic selection in winter wheat breeding using a recommender approach. Genes 11, 779. doi: 10.3390/genes11070779
Mao, H., Jiang, C., Tang, C., Nie, X., Du, L., Liu, Y., et al. (2023). Wheat adaptation to environmental stresses under climate change: Molecular basis and genetic improvement. Mol. Plant 16, 1564–1589. doi: 10.1016/j.molp.2023.09.001
Maxwell, K., Johnson, G. N. (2000). Chlorophyll fluorescence—a practical guide. J. Exp. Bot. 51, 659–668. doi: 10.1093/jexbot/51.345.659
Ni, Z., Lu, Q., Huo, H., Zhang, H. (2019). Estimation of chlorophyll fluorescence at different scales: A review. Sensors 19, 3000. doi: 10.3390/s19133000
Okuyama, L. A., Federizzi, L. C., Barbosa Neto, J. F. (2004). Correlation and path analysis of yield and its components and plant traits in wheat. Cienc. Rural 34, 1701–1708. doi: 10.1590/S0103-84782004000600006
Ollinger, S. V. (2011). Sources of variability in canopy reflectance and the convergent properties of plants. New Phytol. 189, 375–394. doi: 10.1111/j.1469-8137.2010.03536.x
Peng, Y., Zeng, A., Zhu, T., Fang, S., Gong, Y., Tao, Y., et al. (2017). Using remotely sensed spectral reflectance to indicate leaf photosynthetic efficiency derived from active fluorescence measurements. J. Appl. Remote Sens 11, 26034. doi: 10.1117/1.JRS.11.026034
Pérez-Bueno, M. L., Pineda, M., Barón, M. (2019). Phenotyping plant responses to biotic stress by chlorophyll fluorescence imaging. Front. Plant Sci. 10. doi: 10.3389/fpls.2019.01135
Perez-Sanz, F., Navarro, P. J., Egea-Cortines, M. (2017). Plant phenomics: an overview of image acquisition technologies and image data analysis algorithms. GigaScience 6, 1–18. doi: 10.1093/gigascience/gix092
Pradhan, S., Bandyopadhyay, K. K., Joshi, D. K. (2012). Canopy reflectance spectra of wheat as related to crop yield, grain protein under different management practices. J. Agrometeorol. 14, 21–25. doi: 10.54386/jam.v14i1.1373
Raun, W. R., Solie, J. B., Johnson, G. V., Stone, M. L., Lukina, E. V., Thomason, W. E., et al. (2001). In-season prediction of potential grain yield in winter wheat using canopy reflectance. Agron. J. 93, 131–138. doi: 10.2134/agronj2001.931131x
Rutkoski, J., Poland, J., Mondal, S., Autrique, E., Pérez, L. G., Crossa, J., et al. (2016). Canopy temperature and vegetation indices from high-throughput phenotyping improve accuracy of pedigree and genomic selection for grain yield in wheat. G3 Genes|Genomes|Genetics 6, 2799–2808. doi: 10.1534/g3.116.032888
Sánchez-Bermúdez, M., Del Pozo, J. C., Pernas, M. (2022). Effects of combined abiotic stresses related to climate change on root growth in crops. Front. Plant Sci. 13. doi: 10.3389/fpls.2022.918537
Sarić, R., Nguyen, V. D., Burge, T., Berkowitz, O., Trtílek, M., Whelan, J., et al. (2022). Applications of hyperspectral imaging in plant phenotyping. Trends Plant Sci. 27, 301–315. doi: 10.1016/j.tplants.2021.12.003
Shahzad, A., Ullah, S., Dar, A. A., Sardar, M. F., Mehmood, T., Tufail, M. A., et al. (2021). Nexus on climate change: agriculture and possible solution to cope future climate change stresses. Environ. Sci. pollut. Res. 28, 14211–14232. doi: 10.1007/s11356-021-12649-8
Sharma, D. K., Andersen, S. B., Ottosen, C., Rosenqvist, E. (2015). Wheat cultivars selected for high F v/F m under heat stress maintain high photosynthesis, total chlorophyll, stomatal conductance, transpiration and dry matter. Physiologia Plantarum 153, 284–298. doi: 10.1111/ppl.12245
Sherstneva, O., Khlopkov, A., Gromova, E., Yudina, L., Vetrova, Y., Pecherina, A., et al. (2021). Analysis of chlorophyll fluorescence parameters as predictors of biomass accumulation and tolerance to heat and drought stress of wheat (. Funct. Plant Biol. 49, 155–169. doi: 10.1071/FP21209
Shiferaw, B., Smale, M., Braun, H.-J., Duveiller, E., Reynolds, M., Muricho, G. (2013). Crops that feed the world 10. Past successes and future challenges to the role played by wheat in global food security. Food Sec. 5, 291–317. doi: 10.1007/s12571-013-0263-y
Skendžić, S., Zovko, M., Lešić, V., Pajač Živković, I., Lemić, D. (2023). Detection and evaluation of environmental stress in winter wheat using remote and proximal sensing methods and vegetation indices—A review. Diversity 15, 481. doi: 10.3390/d15040481
Slaton, M. R., Raymond Hunt, E., Smith, W. K. (2001). Estimating near-infrared leaf reflectance from leaf structural characteristics. Am. J. Bot. 88, 278–284. doi: 10.2307/2657019
Sukhova, E., Sukhov, V. (2018). Connection of the photochemical reflectance index (PRI) with the photosystem II quantum yield and nonphotochemical quenching can be dependent on variations of photosynthetic parameters among investigated plants: A meta-analysis. Remote Sens. 10, 771. doi: 10.3390/rs10050771
Sukhova, E., Sukhov, V. (2020). Relation of photochemical reflectance indices based on different wavelengths to the parameters of light reactions in photosystems I and II in pea plants. Remote Sens. 12, 1312. doi: 10.3390/rs12081312
Sun, J., Rutkoski, J. E., Poland, J. A., Crossa, J., Jannink, J., Sorrells, M. E. (2017). Multitrait, random regression, or simple repeatability model in high-throughput phenotyping data improve genomic prediction for wheat grain yield. Plant Genome 10. doi: 10.3835/plantgenome2016.11.0111
Tattaris, M., Reynolds, M. P., Chapman, S. C. (2016). A direct comparison of remote sensing approaches for high-throughput phenotyping in plant breeding. Front. Plant Sci. 7. doi: 10.3389/fpls.2016.01131
Terletskaya, N. V., Stupko, V. Y., Altayeva, N. A., Kudrina, N. O., Blavachinskaya, I. V., Kurmanbayeva, M. S., et al. (2021). Photosynthetic activity of Triticum dicoccum × Triticum aestivum alloplasmic lines during vegetation in connection with productivity traits under varying moister conditions. Photosynt 59, 74–83. doi: 10.32615/ps.2021.003
Thapa, S., Rudd, J. C., Xue, Q., Bhandari, M., Reddy, S. K., Jessup, K. E., et al. (2019). Use of NDVI for characterizing winter wheat response to water stress in a semi-arid environment. J. Crop Improvement 33, 633–648. doi: 10.1080/15427528.2019.1648348
Tholen, D., Zhu, X.-G. (2011). The mechanistic basis of internal conductance: A theoretical analysis of mesophyll cell photosynthesis and CO 2 diffusion. Plant Physiol. 156, 90–105. doi: 10.1104/pp.111.172346
Trono, D., Pecchioni, N. (2022). Candidate genes associated with abiotic stress response in plants as tools to engineer tolerance to drought, salinity and extreme temperatures in wheat: an overview. Plants 11, 3358. doi: 10.3390/plants11233358
Ustin, S. L., Jacquemoud, S. (2020). “How the optical properties of leaves modify the absorption and scattering of energy and enhance leaf functionality,” in Remote Sensing of Plant Biodiversity. Eds. Cavender-Bares, J., Gamon, J. A., Townsend, P. A. (Cham: Springer International Publishing), 349–384. doi: 10.1007/978-3-030-33157-3_14
Venkatesh, K., Senthilkumar, K. M., Mamrutha, H. M., Singh, G., Singh, G. P. (2022). “High-temperature stress in wheat under climate change scenario, effects and mitigation strategies,” in Climate Change and Crop Stress (Cambridge, MA: Elsevier), 209–229. doi: 10.1016/B978-0-12-816091-6.00014-6
White, E. M., Wilson, F. E. A. (2006). Responses of grain yield, biomass and harvest index and their rates of genetic progress to nitrogen availability in ten winter wheat varieties. Irish J. Agric. Food Res. 45, 85–101.
Zahra, N., Hafeez, M. B., Wahid, A., Al Masruri, M. H., Ullah, A., Siddique, K. H. M., et al. (2023). Impact of climate change on wheat grain composition and quality. J. Sci. Food Agric. 103, 2745–2751. doi: 10.1002/jsfa.12289
Zahra, N., Wahid, A., Hafeez, M. B., Ullah, A., Siddique, K. H. M., Farooq, M. (2021). Grain development in wheat under combined heat and drought stress: Plant responses and management. Environ. Exp. Bot. 188, 104517. doi: 10.1016/j.envexpbot.2021.104517
Zhang, H., Wang, L., Jin, X., Bian, L., Ge, Y. (2023). High-throughput phenotyping of plant leaf morphological, physiological, and biochemical traits on multiple scales using optical sensing. Crop J. 11, 1303–1318. doi: 10.1016/j.cj.2023.04.014
Keywords: hyperspectral imaging, PAM imaging, chlorophyll fluorescence, tolerance, abiotic stress, breeding, Triticum aestivum L
Citation: Sherstneva O, Abdullaev F, Kior D, Yudina L, Gromova E and Vodeneev V (2024) Prediction of biomass accumulation and tolerance of wheat seedlings to drought and elevated temperatures using hyperspectral imaging. Front. Plant Sci. 15:1344826. doi: 10.3389/fpls.2024.1344826
Received: 26 November 2023; Accepted: 23 January 2024;
Published: 02 February 2024.
Edited by:
Jianfeng Zhou, University of Missouri, United StatesReviewed by:
Klára Kosová, Crop Research Institute (CRI), CzechiaPenghao Wang, Murdoch University, Australia
Copyright © 2024 Sherstneva, Abdullaev, Kior, Yudina, Gromova and Vodeneev. This is an open-access article distributed under the terms of the Creative Commons Attribution License (CC BY). The use, distribution or reproduction in other forums is permitted, provided the original author(s) and the copyright owner(s) are credited and that the original publication in this journal is cited, in accordance with accepted academic practice. No use, distribution or reproduction is permitted which does not comply with these terms.
*Correspondence: Oksana Sherstneva, c2hlcnN0bmV2YS1va3NhbmFAeWFuZGV4LnJ1
 Oksana Sherstneva
 Firuz Abdullaev
 Lyubov Yudina
 Vladimir Vodeneev