
95% of researchers rate our articles as excellent or good
Learn more about the work of our research integrity team to safeguard the quality of each article we publish.
Find out more
ORIGINAL RESEARCH article
Front. Plant Sci. , 30 August 2023
Sec. Technical Advances in Plant Science
Volume 14 - 2023 | https://doi.org/10.3389/fpls.2023.1250854
This article is part of the Research Topic Advances in Statistical Methods for the Genetic Dissection of Complex Traits in Plants View all 19 articles
 Yan Zheng1,2,3†
 Khin Mar Thi2,3†Lihui Lin2,3
 Xiaofang Xie1,2,3Ei Ei Khine2,3Ei Ei Nyein2,3Min Htay Wai Lin4Win Win New4
 San San Aye4
 Weiren Wu2,3*
Cooking-caused rice grain expansion (CCRGE) is a critical trait for evaluating the cooking quality of rice. Previous quantitative trait locus (QTL) mapping studies on CCRGE have been limited to bi-parental populations, which restrict the exploration of natural variation and mapping resolution. To comprehensively and precisely dissect the genetic basis of CCRGE, we performed a genome-wide association study (GWAS) on three related indices: grain breadth expansion index (GBEI), grain length expansion index (GLEI), and grain length-breadth ratio expansion index (GREI), using 345 rice accessions grown in two years (environments) and 193,582 SNP markers. By analyzing each environment separately using seven different methods (3VmrMLM, mrMLM, FASTmrMLM, FASTmrEMMA, pLARmEB, pKWmEB, ISIS EM-BLASSO), we identified a total of 32, 19 and 27 reliable quantitative trait nucleotides (QTNs) associated with GBEI, GLEI and GREI, respectively. Furthermore, by jointly analyzing the two environments using 3VmrMLM, we discovered 19, 22 and 25 QTNs, as well as 9, 5 and 7 QTN-by-environment interaction (QEIs) associated with GBEI, GLEI and GREI, respectively. Notably, 12, 9 and 15 QTNs for GBEI, GLEI and GREI were found within the intervals of previously reported QTLs. In the vicinity of these QTNs or QEIs, based on analyses of mutation type, gene ontology classification, haplotype, and expression pattern, we identified five candidate genes that are related to starch synthesis and endosperm development. The five candidate genes, namely, LOC_Os04g53310 (OsSSIIIb, near QTN qGREI-4.5s), LOC_Os05g02070 (OsMT2b, near QTN qGLEI-5.1s), LOC_Os06g04200 (wx, near QEI qGBEI-6.1i and QTNs qGREI-6.1s and qGLEI-6.1t), LOC_Os06g12450 (OsSSIIa, near QTN qGLEI-6.2t), and LOC_Os08g09230 (OsSSIIIa, near QTN qGBEI-8.1t), are predicted to be involved in the process of rice grain starch synthesis and to influence grain expansion after cooking. Our findings provide valuable insights and will facilitate genetic research and improvement of CCRGE.
Rice (Oryza sativa L.) is a crucial cereal crop that serves as a staple food for over half of the global population. It is the only cereal crop that is primarily consumed as whole grains, which underscores its significance in the field of rice breeding (Hossain et al., 2009). The quality of rice is assessed based on several factors, including appearance, milling, cooking, sensory properties, and nutrition (Cheng et al., 2005; Feng et al., 2017). Among these factors, cooking quality is a critical determinant for the economic value of rice. The cooking quality of rice refers to the characteristics of cooked rice, including its texture, tenderness, stickiness, and overall palatability. As starch accounts for up to 95% of the dry weight of a polished rice grain (Fitzgerald et al., 2009), the cooking quality of rice is mainly determined by starch. During the cooking process, rice grains absorb water and undergo gelatinization, leading to a noticeable expansion in volume (Golam and Prodhan, 2013). The extent of this cooking-caused rice grain expansion (CCRGE) can affect the texture, tenderness and overall quality of cooked rice, and is significantly influenced by the properties of starch (Pang et al., 2016). In general, rice varieties with a higher amylose content (AC) tend to absorb more water and exhibit greater increase in volume after cooking (Frei et al., 2003). Hence, CCRGE is a complex trait closely related to the cooking quality of rice. As the desired cooking quality can vary depending on the type of rice and the culinary preferences of individuals or cultural cuisines (Suwannaporn and Linnemann, 2008), the corresponding suitable degree of CCRGE is also diverse. To meet the varying demands for the cooking quality of rice, different goals should be established in rice breeding. Dissecting the genetic basis of CCRGE will facilitate the efforts toward the goals.
For this purpose, a number of studies have been conducted to map quantitative trait loci (QTLs) underlying CCRGE. To date, 47 QTLs for grain length expansion (Ahn et al., 1993; Li et al., 2004; Zhang et al., 2004; Ge et al., 2005; Shen et al., 2005; Tian et al., 2005; Wang et al., 2007; Amarawathi et al., 2008; Liu et al., 2008; Govindaraj et al., 2009; Shen et al., 2011; Swamy et al., 2012; Li et al., 2015; Arikit et al., 2019), 10 QTLs for grain breadth expansion (Ge et al., 2005; Govindaraj et al., 2009), and 15 QTLs for grain length-breadth relative expansion (He et al., 2003; Jiang et al., 2008; Liu et al., 2008; Thi et al., 2020; Malik et al., 2022) have been reported, demonstrating that CCRGE is a very complex trait. However, none of these QTLs have been cloned.
All the QTLs reported for CCRGE were identified through conventional linkage analysis methods utilizing various populations derived from bi-parental crosses, including F2 (Arikit et al., 2019), F3 (Ahn et al., 1993), F2:3 (Jiang et al., 2008; Thi et al., 2020), BC2F2 (Swamy et al., 2012), BC3F1 (Li et al., 2004), doubled haploid (DH) (Zhang et al., 2004; Tian et al., 2005; Govindaraj et al., 2009), and recombinant inbred lines (RILs) (He et al., 2003; Malik et al., 2022). The linkage-based QTL mapping methods are limited by two main factors. First, it can only investigate the variation between two parents. Second, it has a low mapping resolution due to strong linkage disequilibrium in the mapping population used. Consequently, the mapped QTLs can only account for a small portion of the related genetic variations in the rice germplasm. Therefore, further studies are necessary.
During the domestication process, rice germplasm resources have accumulated a rich array of natural variations in the genome. The advent of high-throughput DNA sequencing technologies has facilitated the use of genome-wide association study (GWAS) as an effective method for identifying natural genomic variations associated with quantitative traits (Huang et al., 2010; Zhao et al., 2011). Unlike the linkage-based QTL mapping method, GWAS utilizes high-density single nucleotide polymorphisms (SNPs) as genetic markers and is performed on diverse natural populations. As linkage disequilibrium is much weaker in natural populations, GWAS achieves higher resolution in QTL mapping (Huang and Han, 2014; Burghardt et al., 2017). GWAS has been successfully employed to map genes or QTLs for numerous important traits in rice, such as flowering time (Huang et al., 2012), grain yield components (Eizenga et al., 2019), grain qualities (Misra et al., 2017; Wang et al., 2020), and so on. However, to date, no GWAS has been conducted to identify QTLs underlying CCRGE.
In this study, we performed GWAS on three traits of CCRGE based on two replicated experiments conducted in two different years (environments) and using seven different methods to analyze the data. We detected 165 related quantitative trait nucleotides (QTNs), including some exhibiting only the effect of QTN-by-environment interaction (QEI). Based on the detected QTNs, we identified five candidate genes through gene ontology (GO), haplotype, and expression pattern analyses. Our findings will facilitate further genetic research and the genetic improvement of CCRGE.
A set of 345 rice accessions among the list of the 3K Rice Genomes Project (2014) were utilized for this research (Table S1). These accessions included 108 japonica, 177 indica, 48 circum-Aus group (cA), 2 circum-Basmati group (cB), and 10 admixed (between major groups) according to Wang et al. (2018). All accessions were grown at the Experimental Farm of Fujian Agriculture and Forestry University in Yangzhong (E118.485841, N26.287161) during the normal growing season (April to October) in 2017 (E1) and 2018 (E2). In both years, 20 seeds of each accession were sown on a seedbed after pregermination, and 14 seedlings were transplanted onto the paddy field 25 days later with a 20-cm spacing between plants and between rows. Field management followed standard agronomic procedures. Mature seeds were harvested from each accession, and subjected to sun, then stored at the room temperature. The newly harvested seeds were utilized for the measurement of CCRGE traits in each year.
The procedure for quantifying the characteristics of cooking-caused rice grain expansion was performed according to Thi et al. (2020). The experiment was conducted in three replicates for each accession. In each replicate, 30 intact white rice grains were soaked (for 30 min) and boiled (for 45 min), and the average length and average breadth of 30 uncooked grains (L0 and B0) and 15 unbroken and straight cooked grains (L1 and B1) were measured. Subsequently, the grain breadth expansion index (GBEI), grain length expansion index (GLEI) and grain length-breadth relative expansion index (GREI) of each accession were calculated according to the formulae described by Thi et al. (2020), where GLEI = L1/L0, GBEI = B1/B0, and GREI = (L1/B1)/(L0/B0) = (L1/L0)/(B1/B0) = GLEI/GBEI.
The SNP data of the 345 rice accessions were obtained from the 3K Rice Genomes Project (http://iric.irri.org/resources/3000-genomes-project). The core genome set of 404K SNPs (https://snp-seek.irri.org/download.zul, accessed on 1 September 2021) was employed for the analysis. A stringent quality control process was performed, which involved removal of the SNPs that had more than 20% missing calls and a minor allele frequency (MAF) smaller than 5%. As a result, a total of 193,582 SNPs were retained for subsequent analysis.
The genetic distances between 345 accessions were calculated based on SNP data, and a phylogenetic tree was constructed using the MEGA 11 software. Population structure was analyzed using principal component analysis (PCA) plots and the Admixture program as described by Alexander and Lange (2011). The linkage disequilibrium (LD) between pairwise SNPs located within 1 megabase (Mb) on each chromosome or across the entire genome was estimated by computing the determination coefficient (R2) using the plink software (Purcell et al., 2007).
GWAS was performed on GLEI, GBEI and GREI with two strategies: (1) single-environment analysis, namely, analyzing each environment separately; and (2) two-environment analysis, namely, analyzing the two environments jointly. For single-environment analysis, we employed two R packages: 3VmrMLM (Li et al., 2022; https://github.com/YuanmingZhang65/IIIVmrMLM) and mrMLM v4.0.2 (Zhang et al., 2020). The former includes the method 3VmrMLM, while the latter contains six methods, namely, mrMLM (Wang et al., 2016), FASTmrMLM (Tamba and Zhang, 2018), FASTmrEMMA (Wen et al., 2018), pLARmEB (Zhang et al., 2017), pKWmEB (Ren et al., 2018), and ISIS EM-BLASSO (Tamba et al., 2017). The option “method=Single_env” was chosen in 3VmrMLM, while default parameters were used for the other methods. Two-environment analysis was conducted using 3VmrMLM only, with the option set to “method=Multi_env”. This method allowed for the estimation of the main effect of a QTN and the effect of QTN-by-environment interaction. For distinction, a QTN showing only the effect of QTN-by-environment interaction was denoted as QEI. Each QTN or QEI was named following the nomenclature “q + trait + chromosome + number + s/t/i”, where “s” and “t” indicate that the QTN was detected based on single- or two-environment analysis, respectively, and “i” indicates a QEI. According to Zhang et al. (2019), the QTNs identified by multiple methods were deemed as reliable QTNs, with particular emphasis on those identified in multiple environments, which were considered stable QTNs.
Based on the distinct LD decay in each rice chromosome, the left and right R2 half-decay regions flanking each QTN or QEI were determined to identify potential candidate genes. The following sequential steps were executed: (1) the SNP effect prediction software snpEff.v1.9 (Cingolani et al., 2012) was employed to evaluate the effects of SNPs on the regional genes, and annotated genes with effective mutation types, such as non-synonymous substitution, splice site, and UTR-5’ mutation, were selected; (2) GO classifications related to starch synthesis or endosperm development were searched in the rice database (https://www.ricedata.cn/ontology/), and all genes with these GO classifications were retrieved; and (3) genes that meet both steps 1 and 2 were screened out and then subjected to haplotype analysis, where different haplotypes exhibiting t-test significance were considered as candidate genes.
The expression profiles of the candidate genes in various tissues were obtained from the Rice Genome Annotation Project database (http://rice.uga.edu), including shoots (library name in NCBI: SRR042529), leaves-20 days (OSN_AA and OSN_CA), pre-emergence inflorescence (OSN_AC), post-emergence inflorescence (OSN_AB), anther (OSN_AD), pistil (OSN_AE), seed-5 DAP (days after pollination; OSN_AF), seed-10 DAP (OSN_AK), embryo-25 DAP (OSN_AG) and endosperm-25 DAP (OSN_AH and OSN_BH). A heatmap was generated to visualize the gene expression patterns across the different tissues.
The traits GBEI, GLEI, and GREI exhibited a continuous unimodal distribution in both environments, suggesting that these traits are quantitative and controlled by multiple genes (Figure 1). After performing the Brown-Forsythe Test for assessing homogeneity of variances, the analysis revealed that the error variances of each accession in both environment for the three traits were homogeneous, indicating that the collected data is suitable for subsequent analysis of variance (ANOVA). Although the population means of these traits were similar in both environments (GBEI: 1.822 and 1.765; GLEI: 1.752 and 1.740; GREI: 0.990 and 1.016), ANOVA revealed statistically significant variation between the two environments and genotype-by-environment interaction (Table 1). These results indicated that all the three traits exhibited significant variation across macro-environments. However, there were still significant correlations between the two environments in these traits, particularly in GLEI and GREI (Table 2).
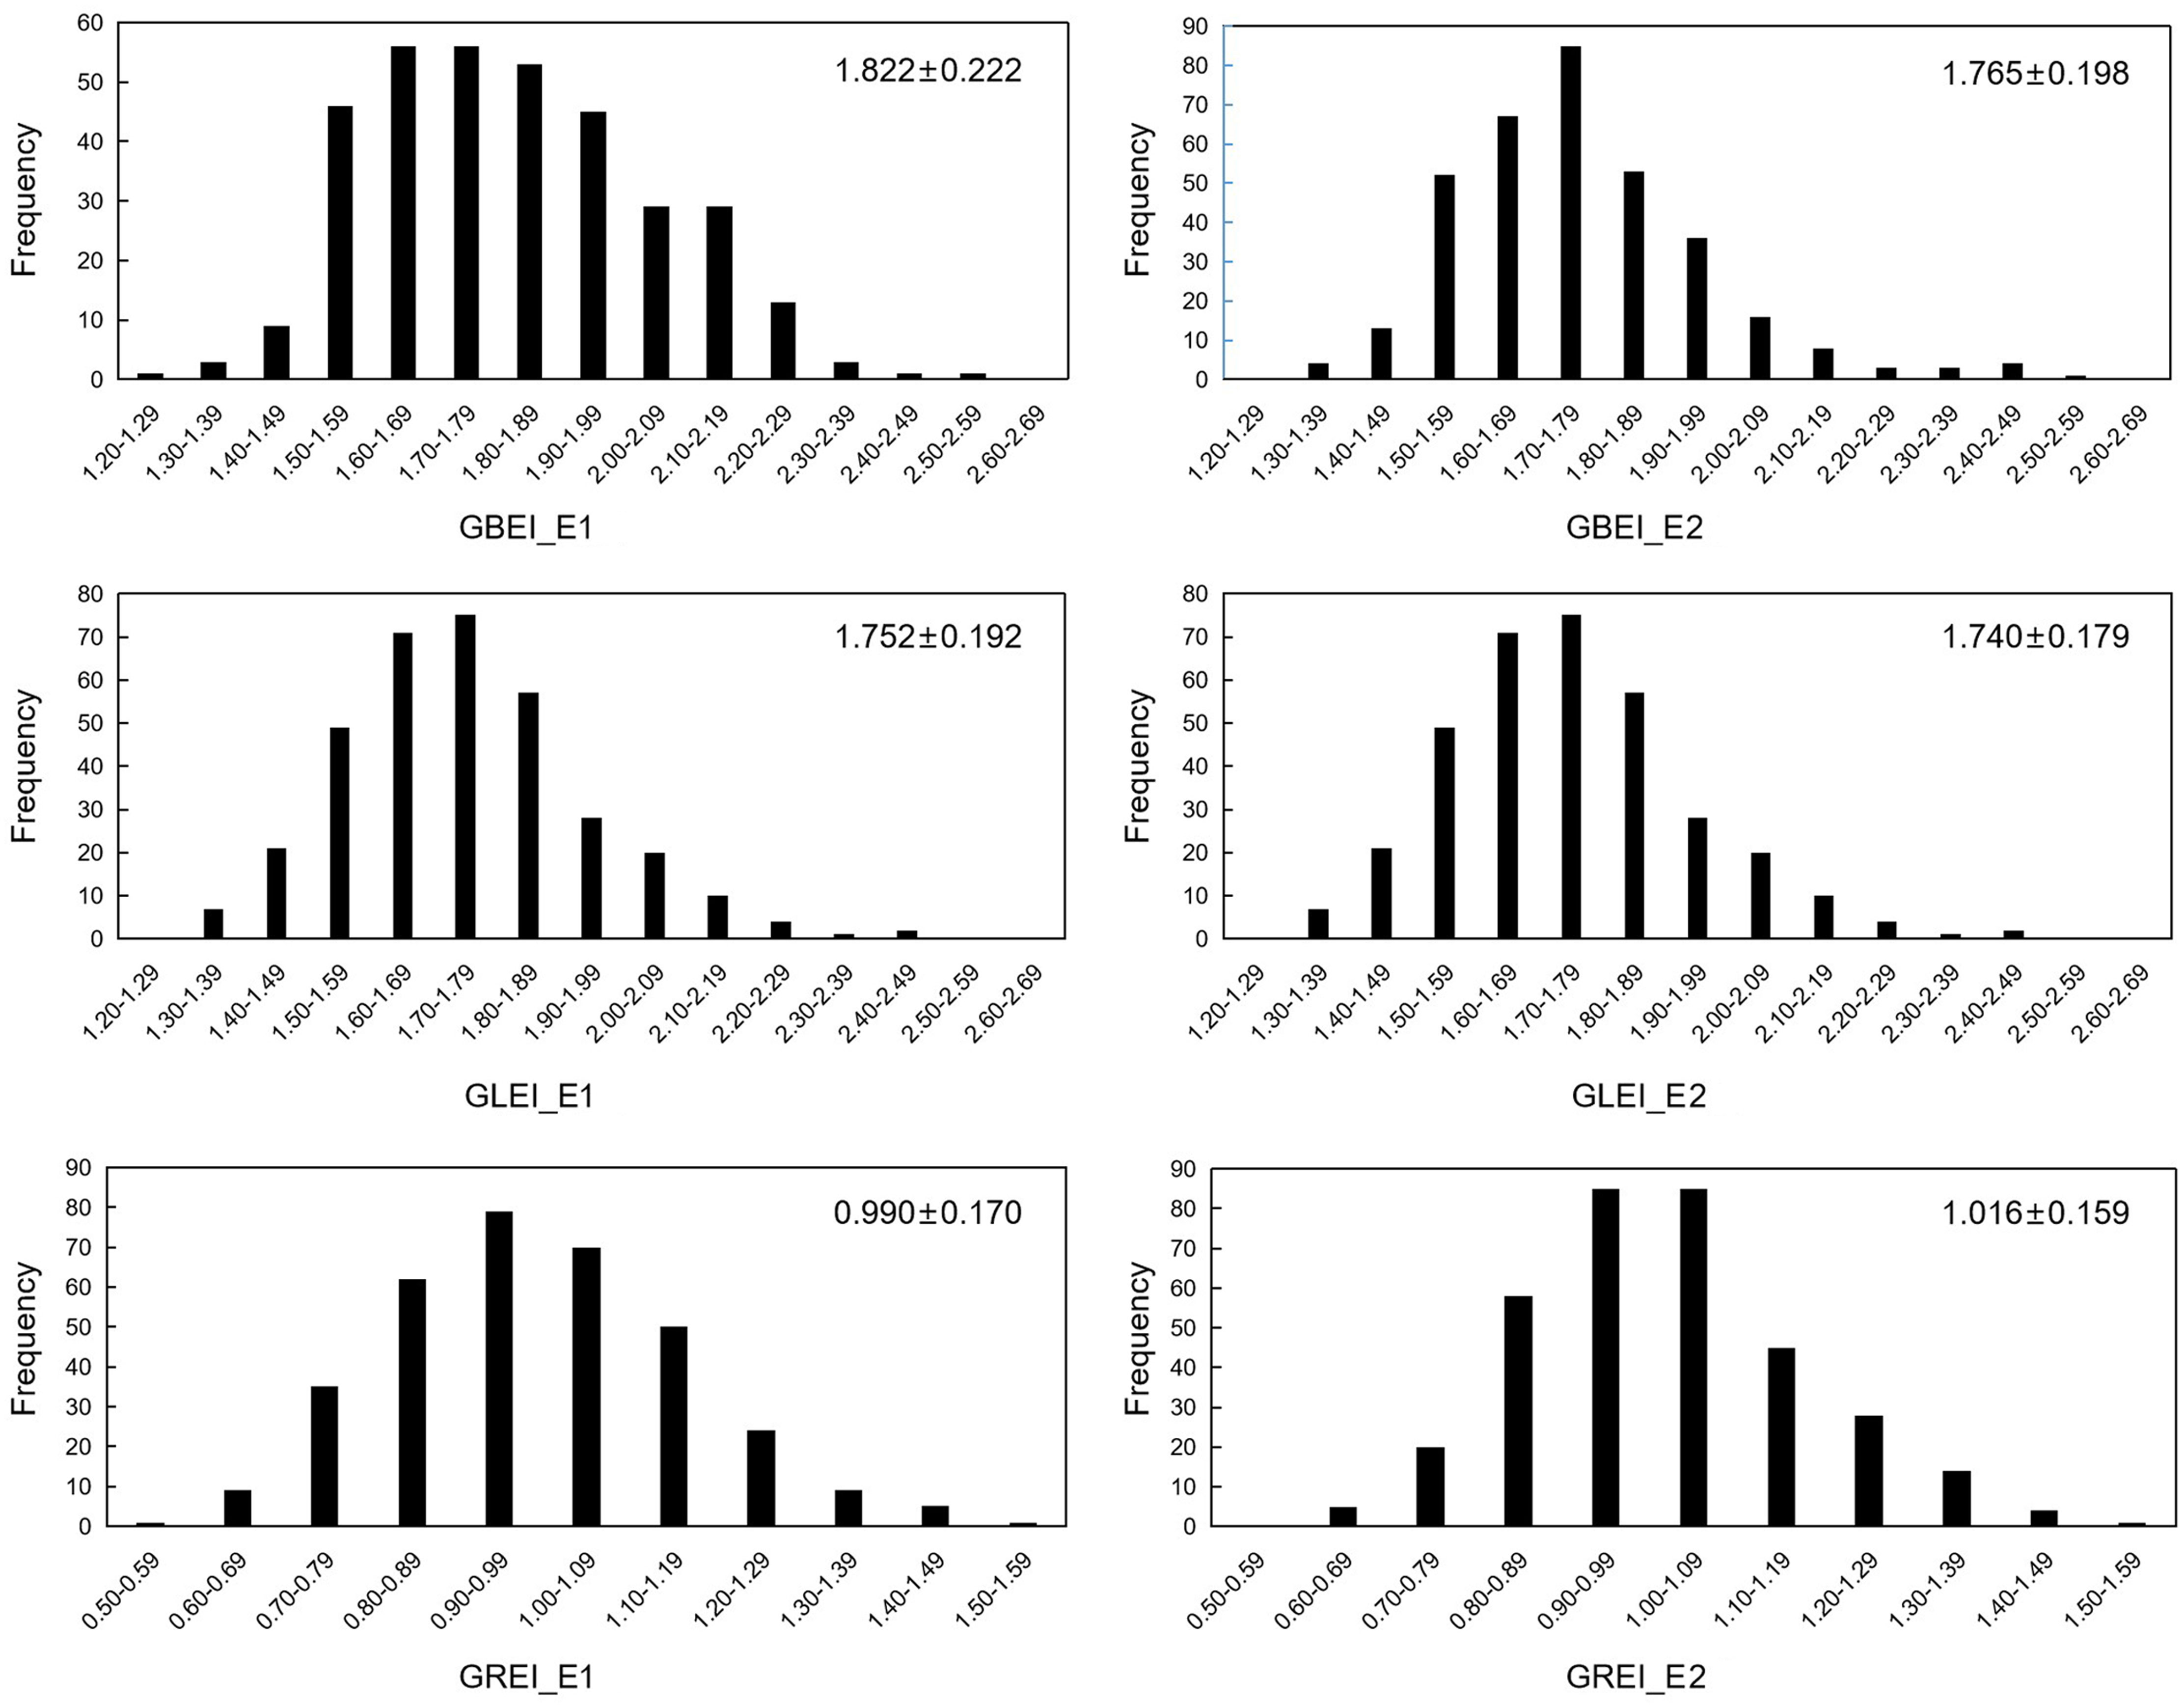
Figure 1 Frequency distribution of GBEI, GLEI and GREI in two environments. Values on the top right corner of each diagram are mean ± standard deviation (cm).
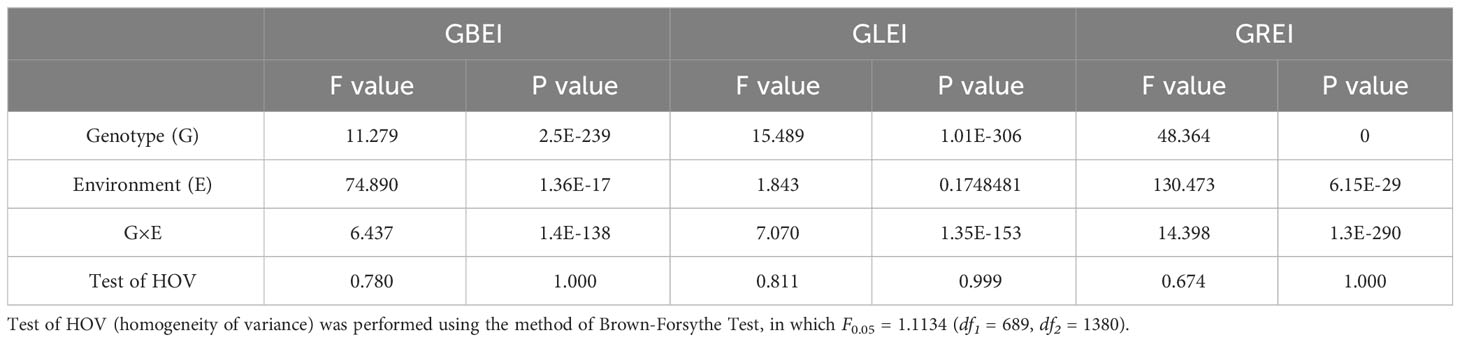
Table 1 ANOVA of GBEI, GLEI and GREI on genotypes and environments, and their interactions.
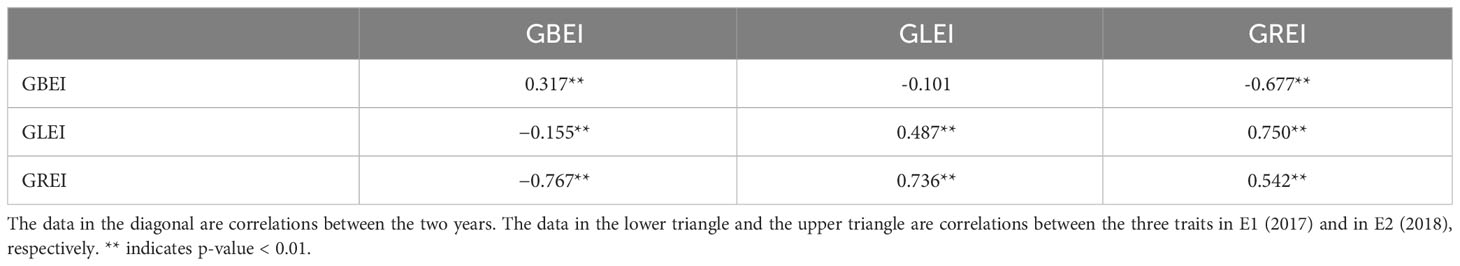
Table 2 Coefficients of correlation between different traits in each environment and between different environments in each trait.
GREI exhibited significant positive and negative correlations with GLEI and GBEI, respectively (Table 2). This is understandable, as GREI is a composite trait that is influenced by both GLEI and GBEI. However, the correlation between GLEI and GBEI was found to be low (-0.155 in E1 and -0.101 in E2) (Table 2), implying that grain length expansion and breadth expansion during cooking are two relatively independent processes with potentially distinct genetic bases.
A set of 193,582 SNPs meeting the requirements of MAF > 5% and missing data < 20% were obtained. The SNPs were not evenly distributed in the genome (Figure 2). SNPs were the densest on chromosome 11 but the sparsest on chromosome 3, respectively (Table 3). On average, there was one SNP every 1928 bp in the genome.
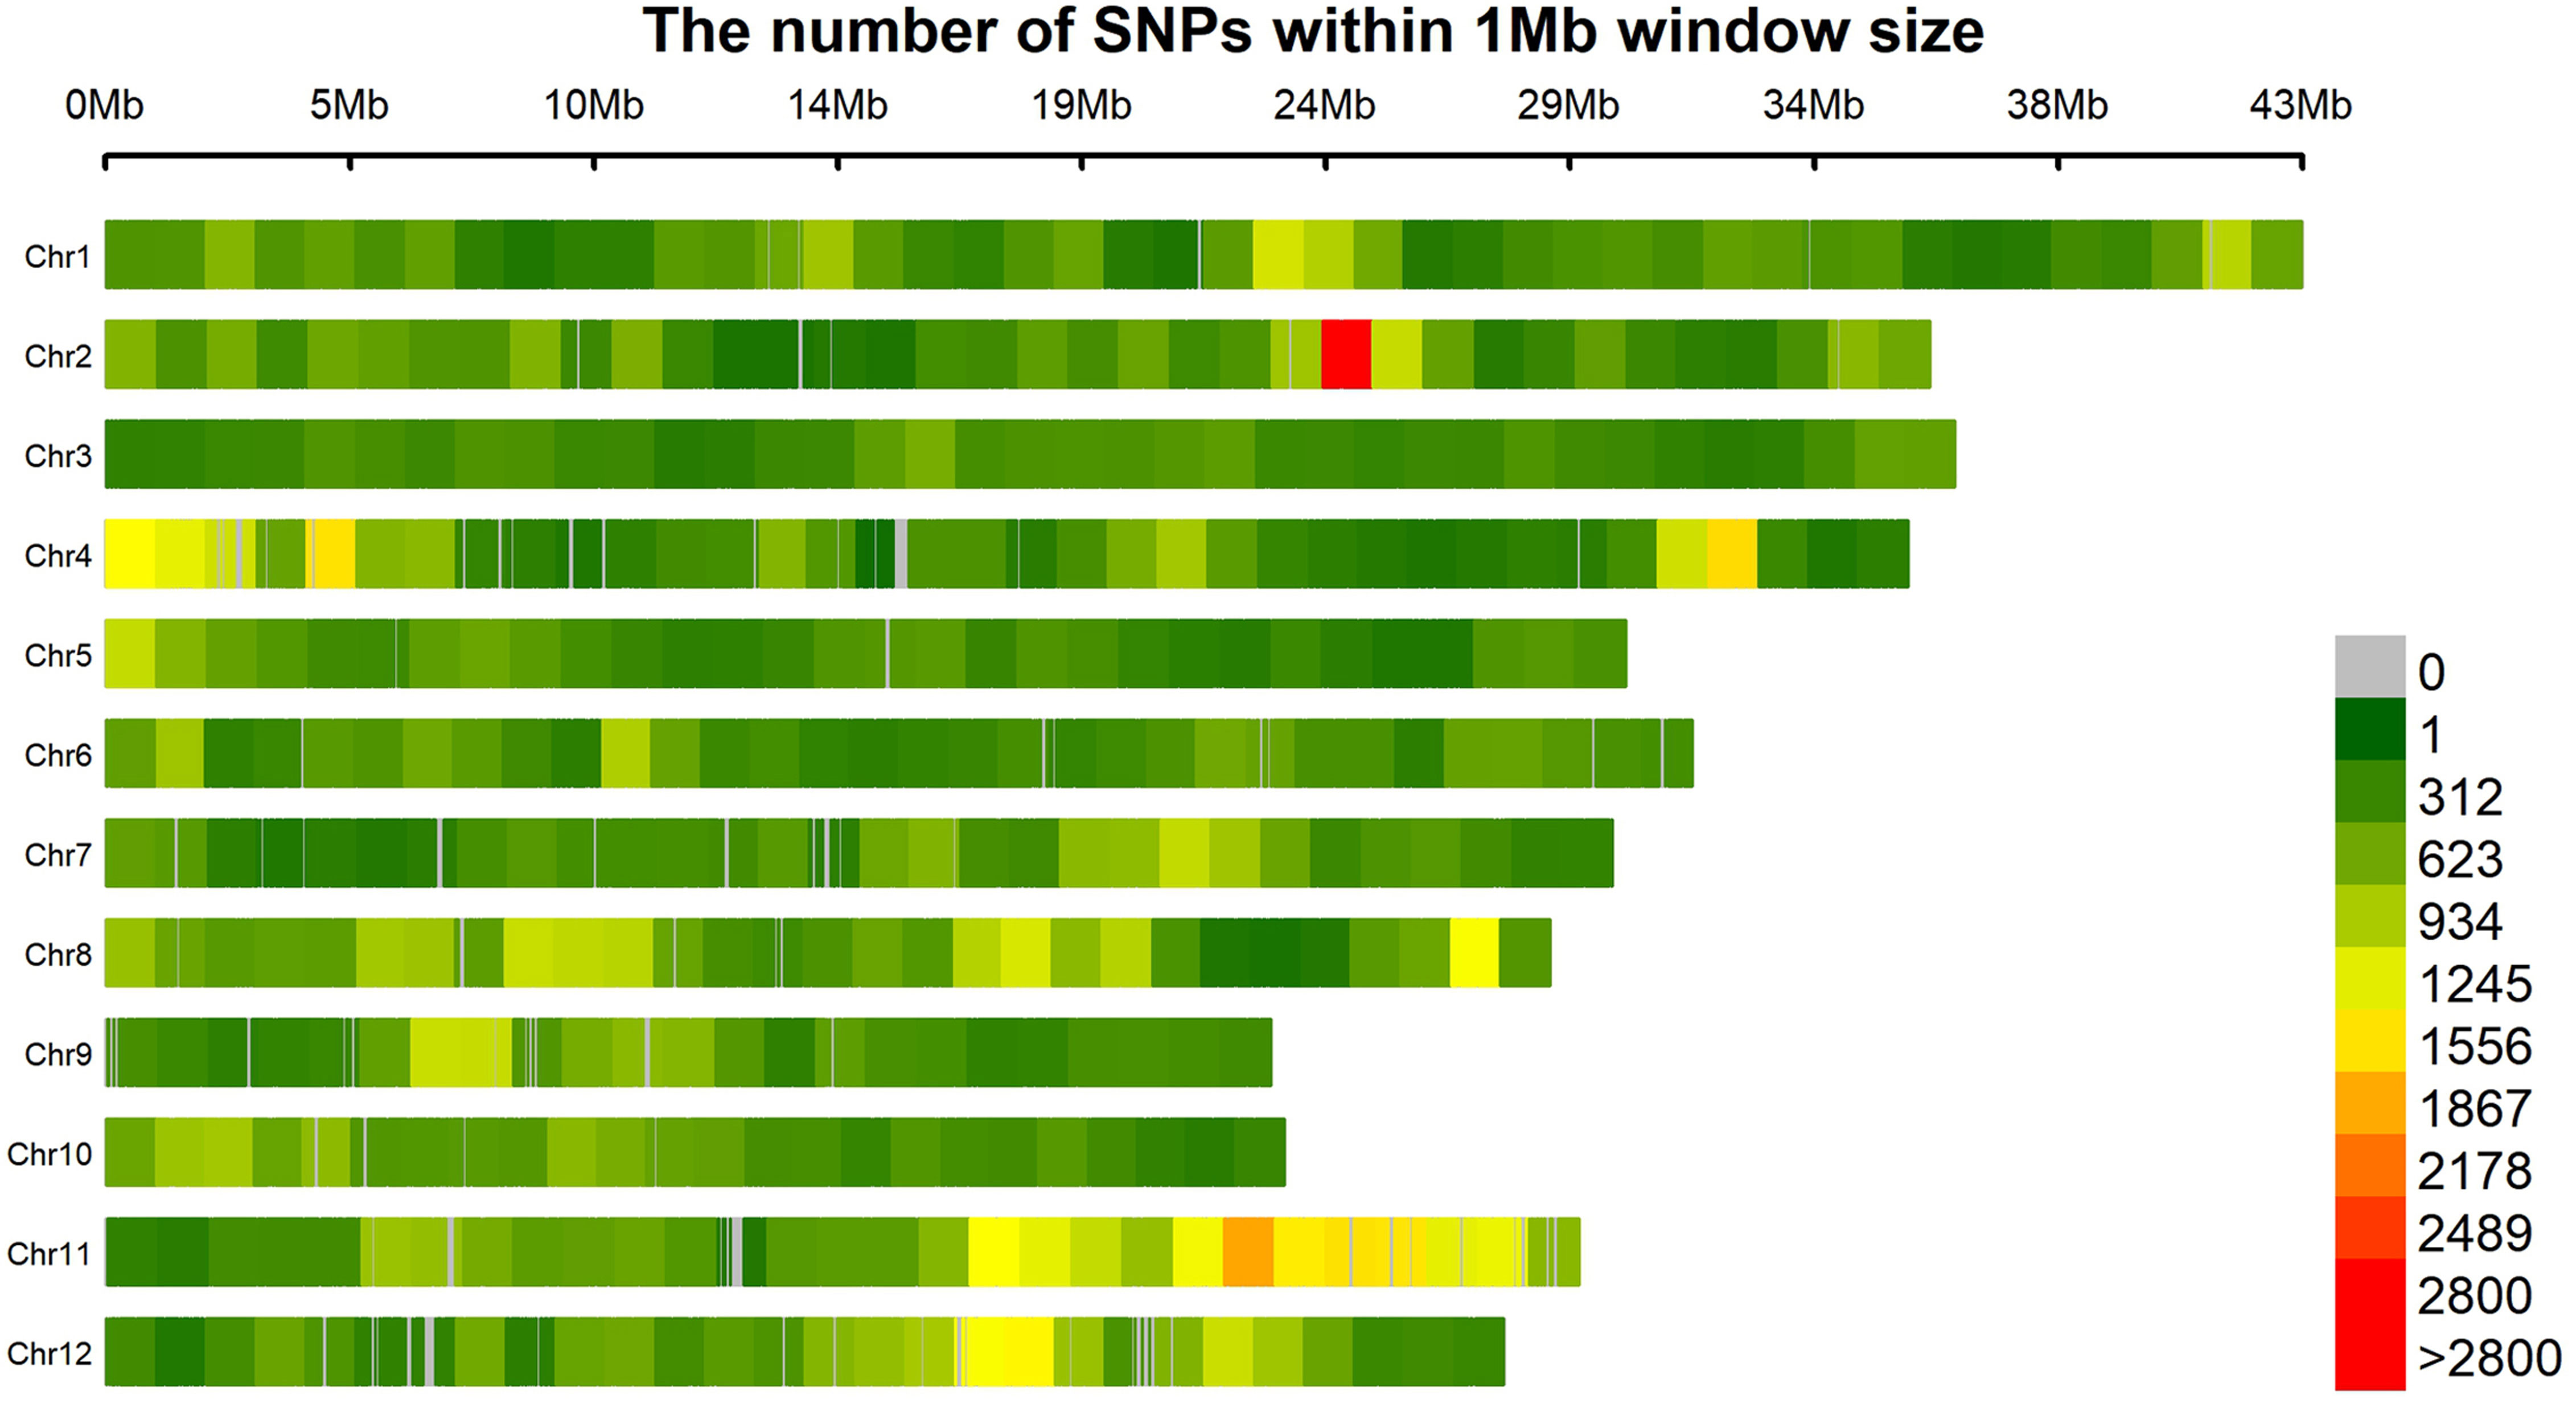
Figure 2 Distribution of 193,582 SNPs in the rice genome.
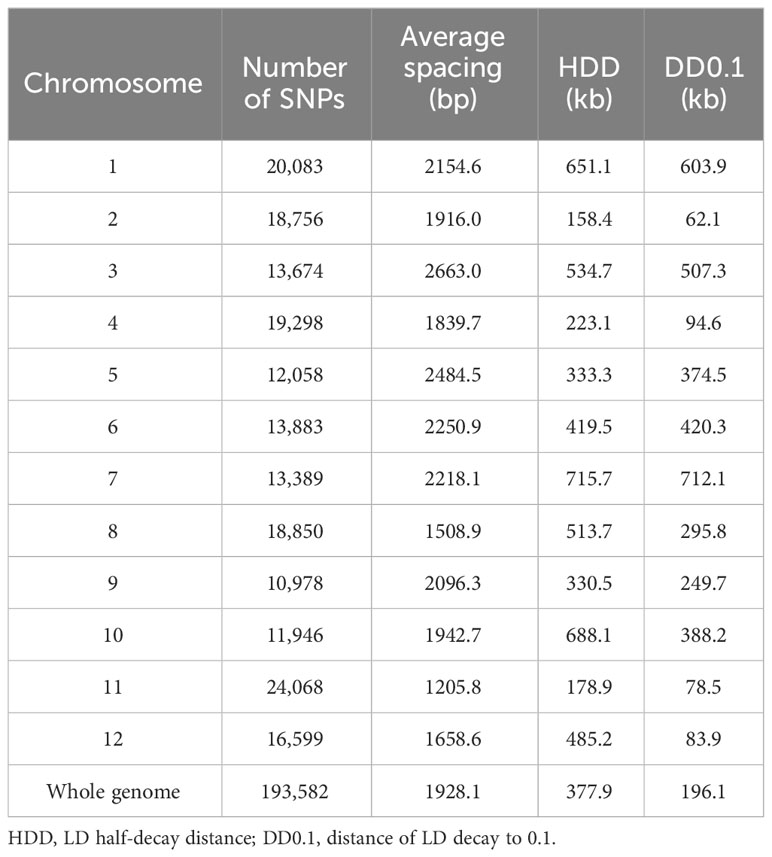
Table 3 Number and density of SNPs and LD decay distances in the rice genome.
The results of phylogenetic analysis (Figure 3A), PCA (Figure 3B), and admixture analysis (Figures 3C, D) all indicated that the population of the 345 rice accessions could be basically divided into three distinct groups (subpopulations), namely, indica group, japonica group, and aus group (Figures 3C, D).
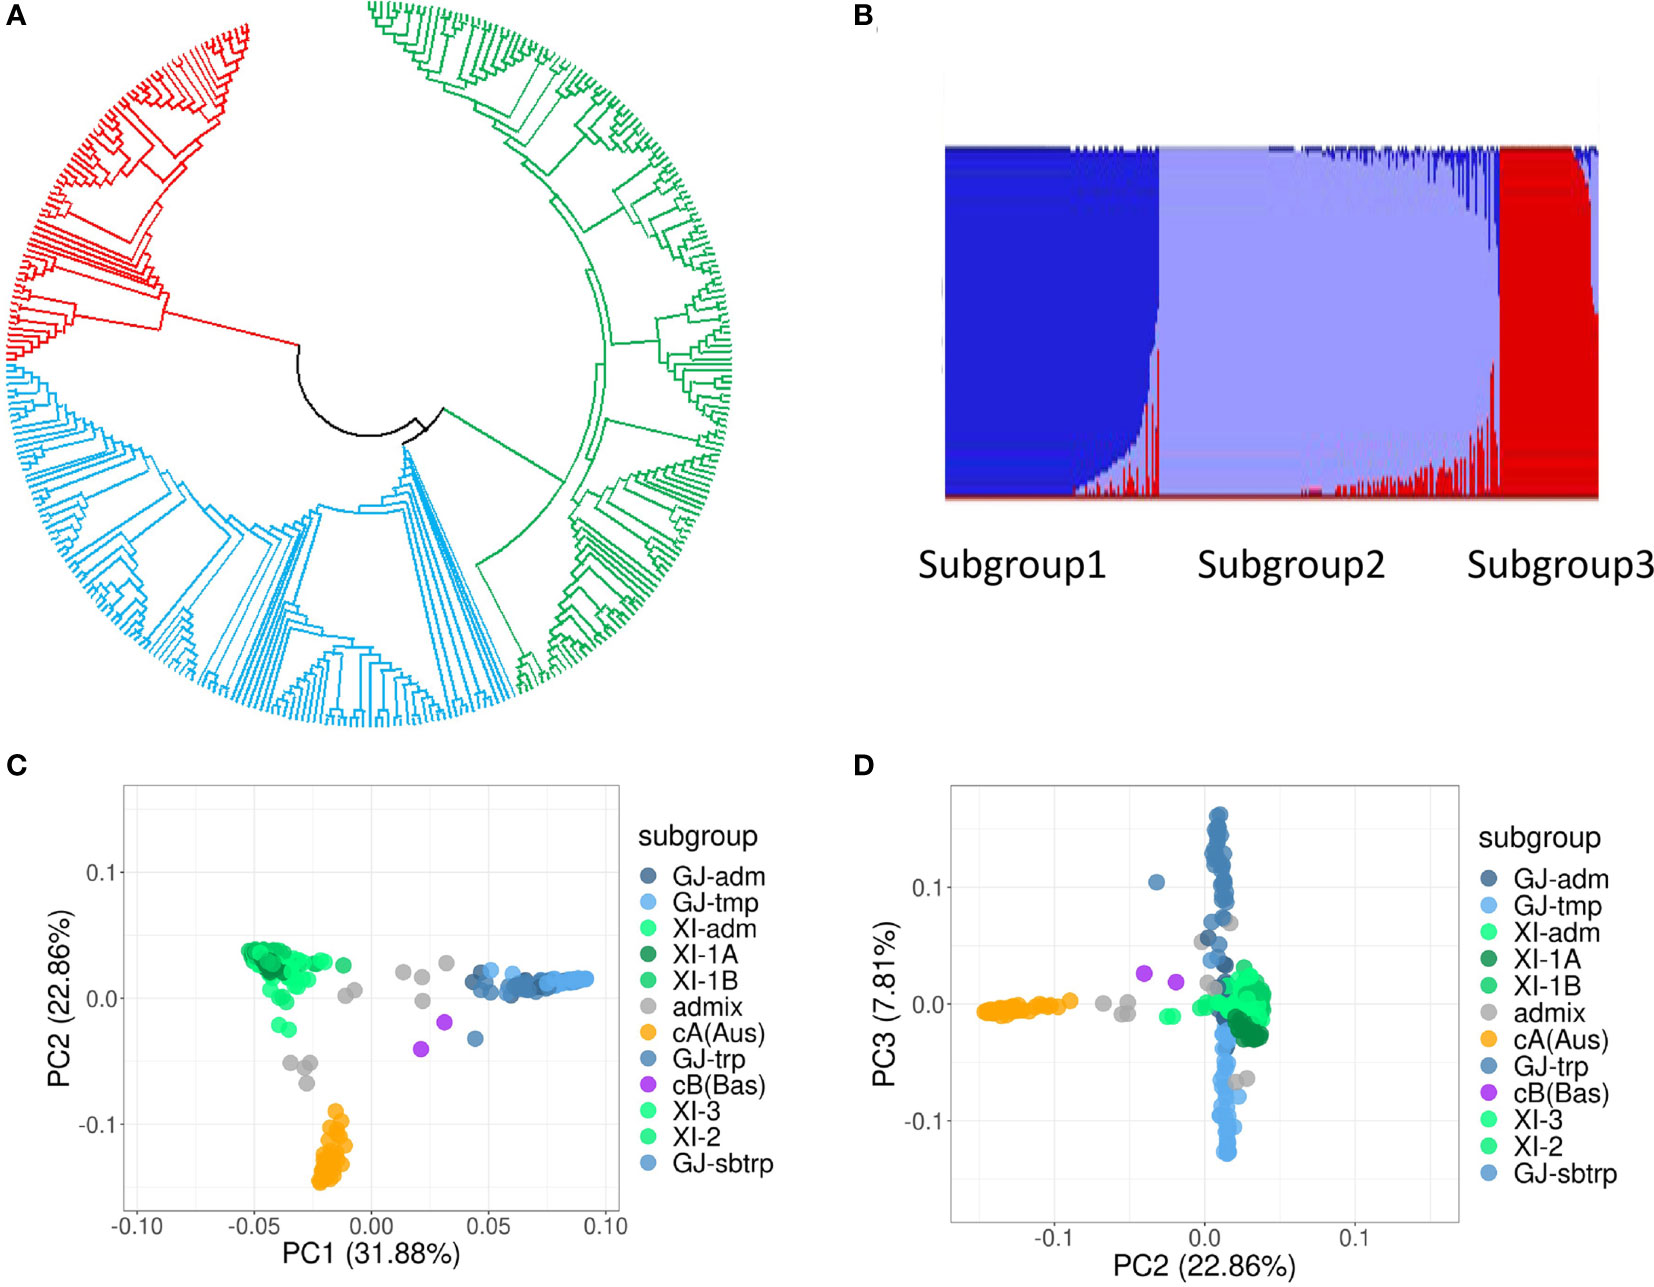
Figure 3 Genetic structure analysis of the population of 345 rice accessions. (A) Phylogenetic tree. (B) Population structure estimated by the software Admixture. (C, D) PCA plots of the first three principal components.
The average LD (mean R2) decreased with the increase of physical distance on every chromosome as well as in the whole genome (Figure 4). The average LD half-decay distance (HDD) and the average distance of LD decay to 0.1 (DD0.1) in the whole genome were about 378 kb and 196 kb, respectively (Table 3). However, the HDD and DD0.1 on different chromosomes varied greatly, ranging from 158.4 kb and 62.1 kb on chromosome 2 to 715.7 kb and 712.1 kb on chromosome 7, respectively (Table 3). Therefore, chromosome 2 had the highest LD decay rate, while chromosome 7 had the lowest.
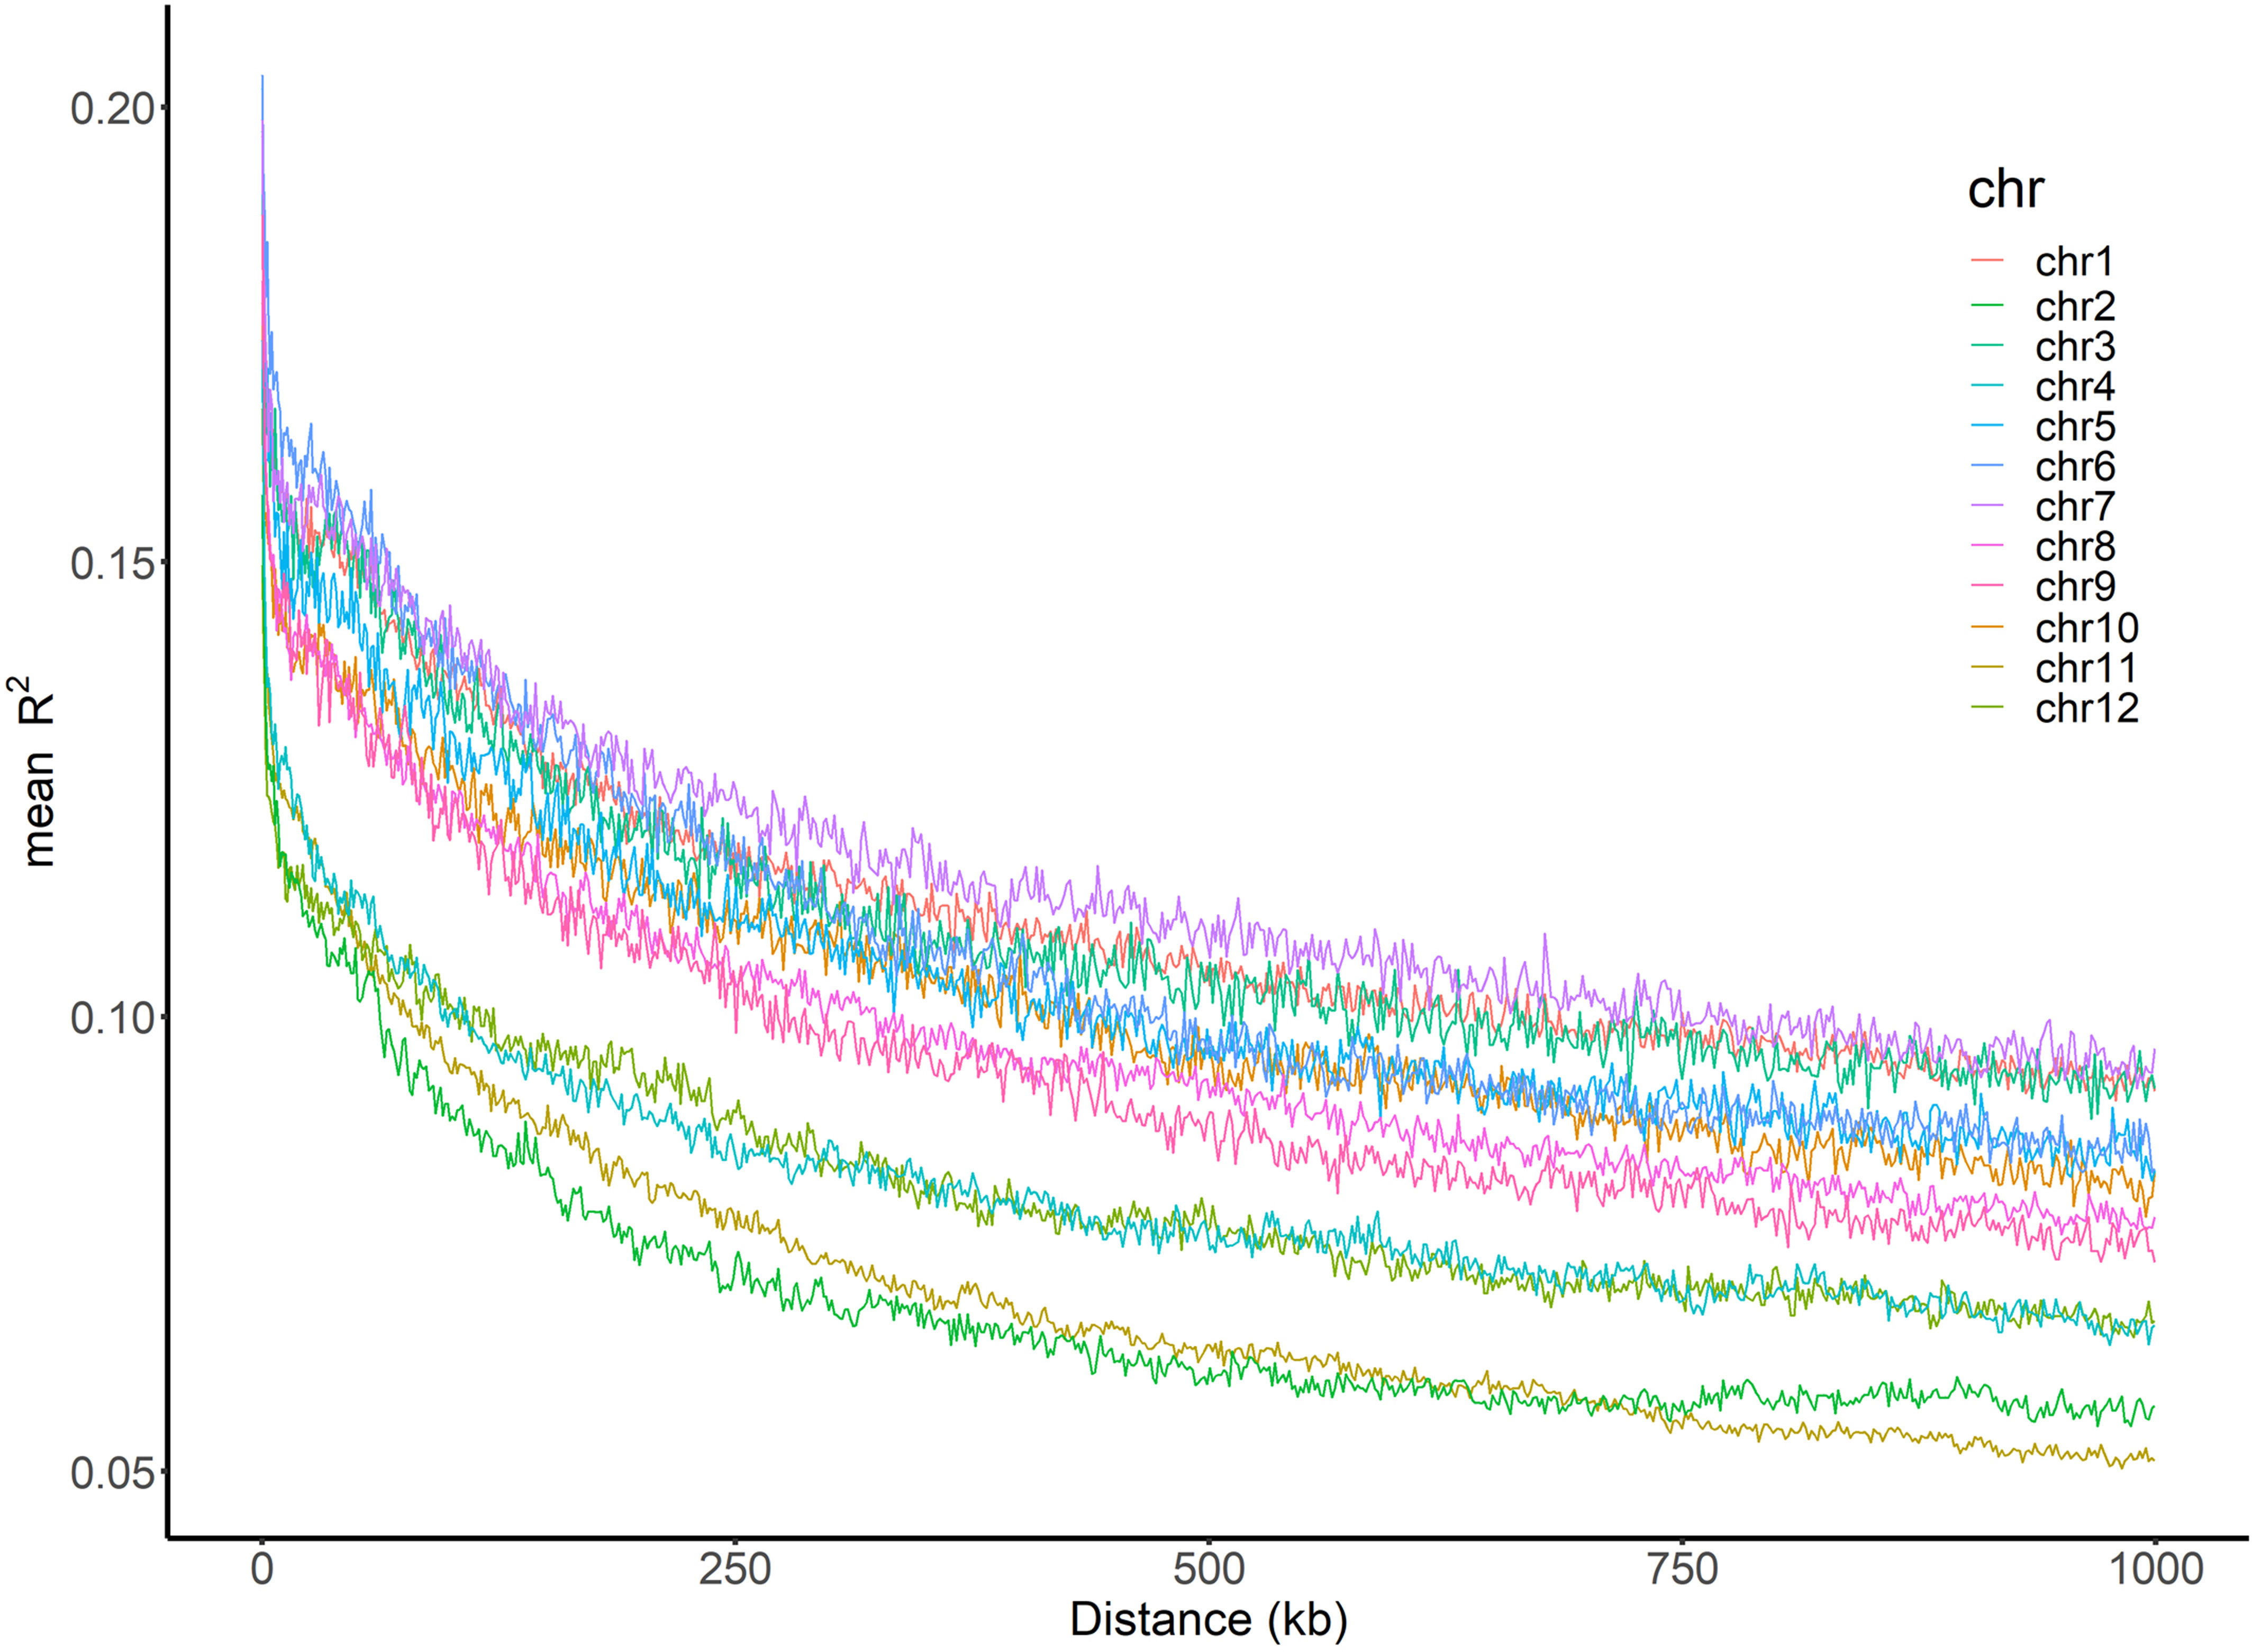
Figure 4 Genome-wide LD decay across 12 chromosomes. The x-axis represents the physical distance and the y-axis represents the average pairwise R2. The color of each chromosome was showed on the top right corner.
In total, 386 QTNs were detected by single-environment analysis using seven different methods, with 145, 127 and 128 QTNs found to be associated with GBEI, GLEI and GREI, respectively (Table 4; Figures S1, S2). However, only 78 (19.5%) QTNs were identified as reliable (Tables 4, S2). The total number of QTNs detected by each method varied greatly, ranging from 32 (FASTmrEMMA) to 131 (3VmrMLM; Table 4). The number and the percentage of reliable QTNs detected by each method also differed significantly (Table 4). Interestingly, there was a positive correlation between the number of reliable QTNs and the total number of QTNs detected by each method (correlation coefficient 80.5%), but a negative correlation between the percentage of reliable QTNs and the total number of QTNs detected by each method (correlation coefficient -88.2%). This indicates that the increase in the number of total QTNs and reliable QTNs detected by a method comes at the cost of a decrease in the percentage of reliable QTNs.
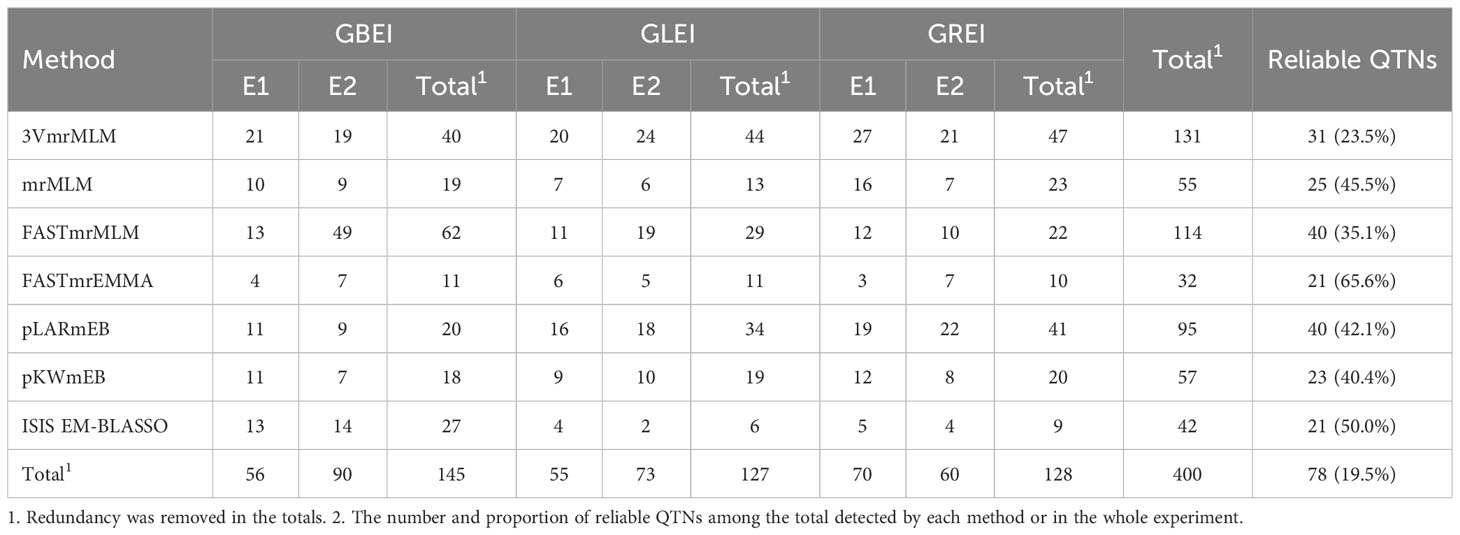
Table 4 Numbers of QTNs for GBEI, GLEI and GREI detected by seven methods in two different environments.
Among the three traits, GBEI had the most reliable QTNs, followed by GREI, and GLEI had the fewest (Table 5). Consistently, GBEI had highest proportion of phenotypic variance explained (PVE) by the reliable QTNs, followed by GREI, and GLEI had the lowest (Table 5). More reliable QTNs were detected and therefore there were higher PVEs in E1 than in E2 for GLEI and GREI, but the results in the two environments were similar for GBEI (Table 5).
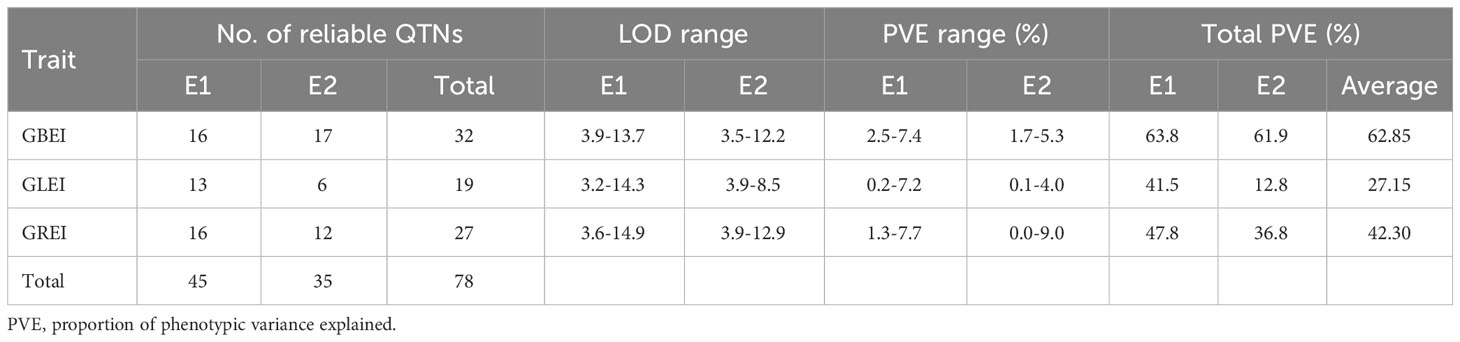
Table 5 Statistics of reliable QTNs for GBEI, GLEI and GREI detected in each environment.
Most QTNs identified in this study were found to be reliable because they were detected by multiple methods, while only four QTNs (qGBEI-5.4s, qGLEI-3.3s, qGREI-5.2s and qGREI-5.6s) were found to be stable because they were detected in the two environments simultaneously (Table S2). In addition, there were a few SNPs exhibiting pleiotropic effects in one environment, including 3:16774870 (detected as QTNs qGLEI-3.5s and qGREI-3.6s) and 6:25062099 (qGLEI-6.4s and qGREI-6.4s), both of which were associated with GLEI and GREI; and 5:5369111 (qGBEI-5.3s and qGREI-5.2s), which was associated with GBEI and GREI (Table S2).
The two-environment analysis detected 11, 14 and 19 significant QTNs (P-value ≤ 0.05/m = 2.58E-07, where m = 193,582, the number of markers) and 8, 8 and 6 suggested QTNs (P > 2.58E-07 but LOD ≥ 3.0) associated with GBEI, GLEI and GREI, respectively (Figures 5A-C; Table S3). These QTNs explained 35.41%, 46.37% and 41.49% of the total phenotypic variation in GBEI, GLEI and GREI, respectively. The SNP marker chr5:5369111 was found to be associated with both GBEI and GREI, and was named qGBEI-5.2t and qGREI-5.3t, respectively. This marker was also detected as QTNs qGBEI-5.3s and qGREI-5.2s in the single-environment analysis, indicating its reliability. Marker chr6:25000609 was associated with both GLEI and GREI, while chr11:23854971 was associated with both GBEI and GREI. Additionally, SNPs chr2:24264276, chr3:2521638, chr3:35669404 and chr5:14585838 were all detected in both single- and two-environment analyses.
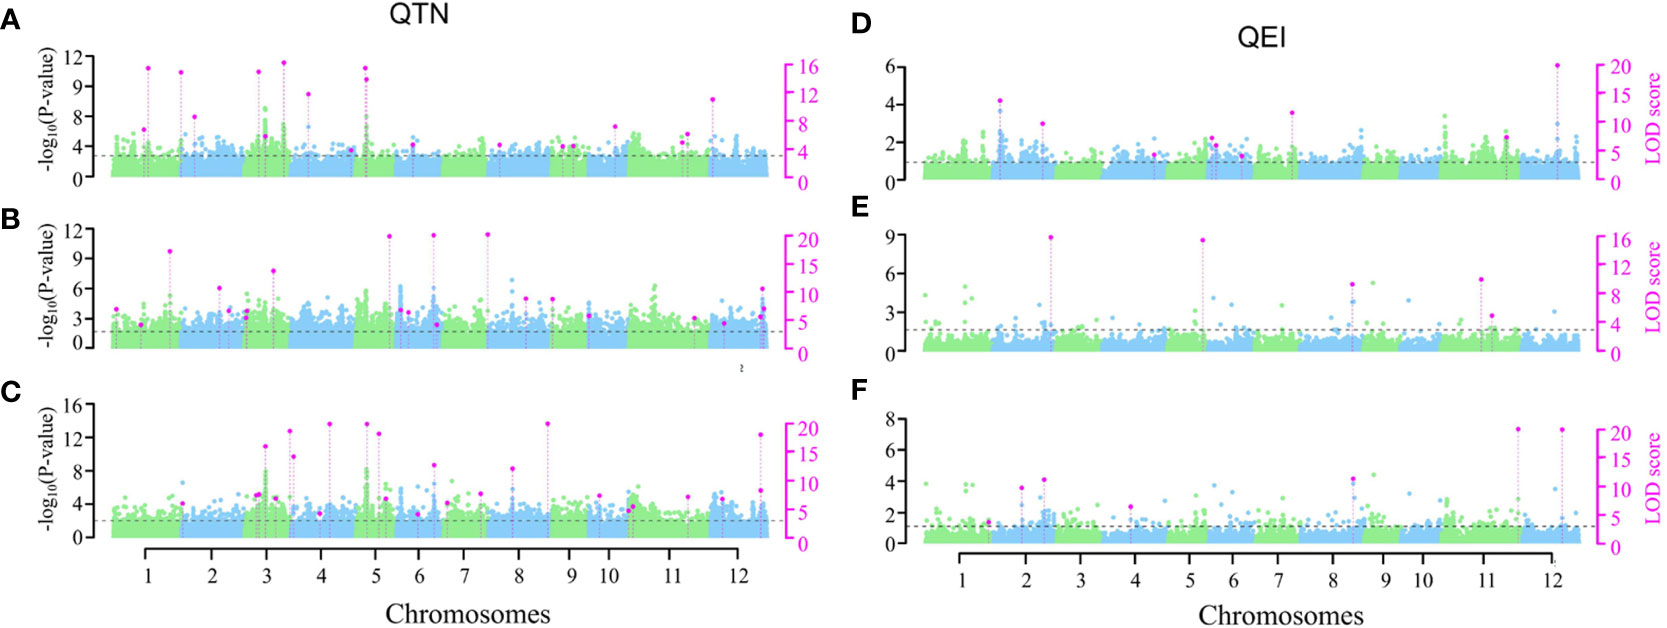
Figure 5 Manhattan plots of two-environment analyses on GBEI (A, D), GLEI (B, E) and GREI (C, F). The horizontal dashed lines indicate the LOD = 3.0 threshold. The left vertical axis is the -log10 (P-value), while the right vertical axis is the LOD score for each SNP marker. Pink dots indicate significant (-log10(P-value) ≥ 6.588) or suggested (-log10(P-value) < 6.588 but LOD ≥ 3) QTNs (A–C) or QEIs (D–F).
The two-environment analysis also detected 6, 4 and 5 significant QEIs and 3, 1 and 2 suggested QEIs associated with GBEI, GLEI and GREI, respectively. These QEIs accounted for 24.83%, 14.79% and 21.22% of the total phenotypic variation in GBEI, GLEI and GREI, respectively (Figures 5D-F; Table S4). Notably, there was no common site between the QTNs and QEIs detected, indicating that all the SNPs exhibiting significant main (additive and/or dominance) effects in the two-environment analysis did not show significant effects of interaction with the environment, and vice versa (namely, all the SNPs exhibiting significant effects of interaction with the environment did not show significant main effects). Nonetheless, the SNP markers of two QEIs, qGREI-2.3i (SNP 2:19642336) and qGLEI-5.6i (SNP 5:25726382) were also detected as QTN qGREI-2.2s and qGREI-5.8s in the single-environment analysis, respectively (Tables S2, S4). Interestingly, the targeted traits of qGLEI-5.6i and qGREI-5.8s were not the same. In addition, the interaction between SNP marker 8:22185608 and environment was found to be associated with both GLEI (as qGLEI-8.3i) and GREI (as qGREI-8.5i) simultaneously (Table S4).
In total, the two-environment analysis detected 66 QTNs and 21 QEIs for the three traits. Plus the 78 reliable QTNs detected in the single-environment analysis, this study detected a total of 165 QTNs/QEIs. These QTNs/QEIs were mainly located on chromosomes 5, 11, 12, 3 and 2, and very rare on chromosomes 1 and 10 (Figure 6).
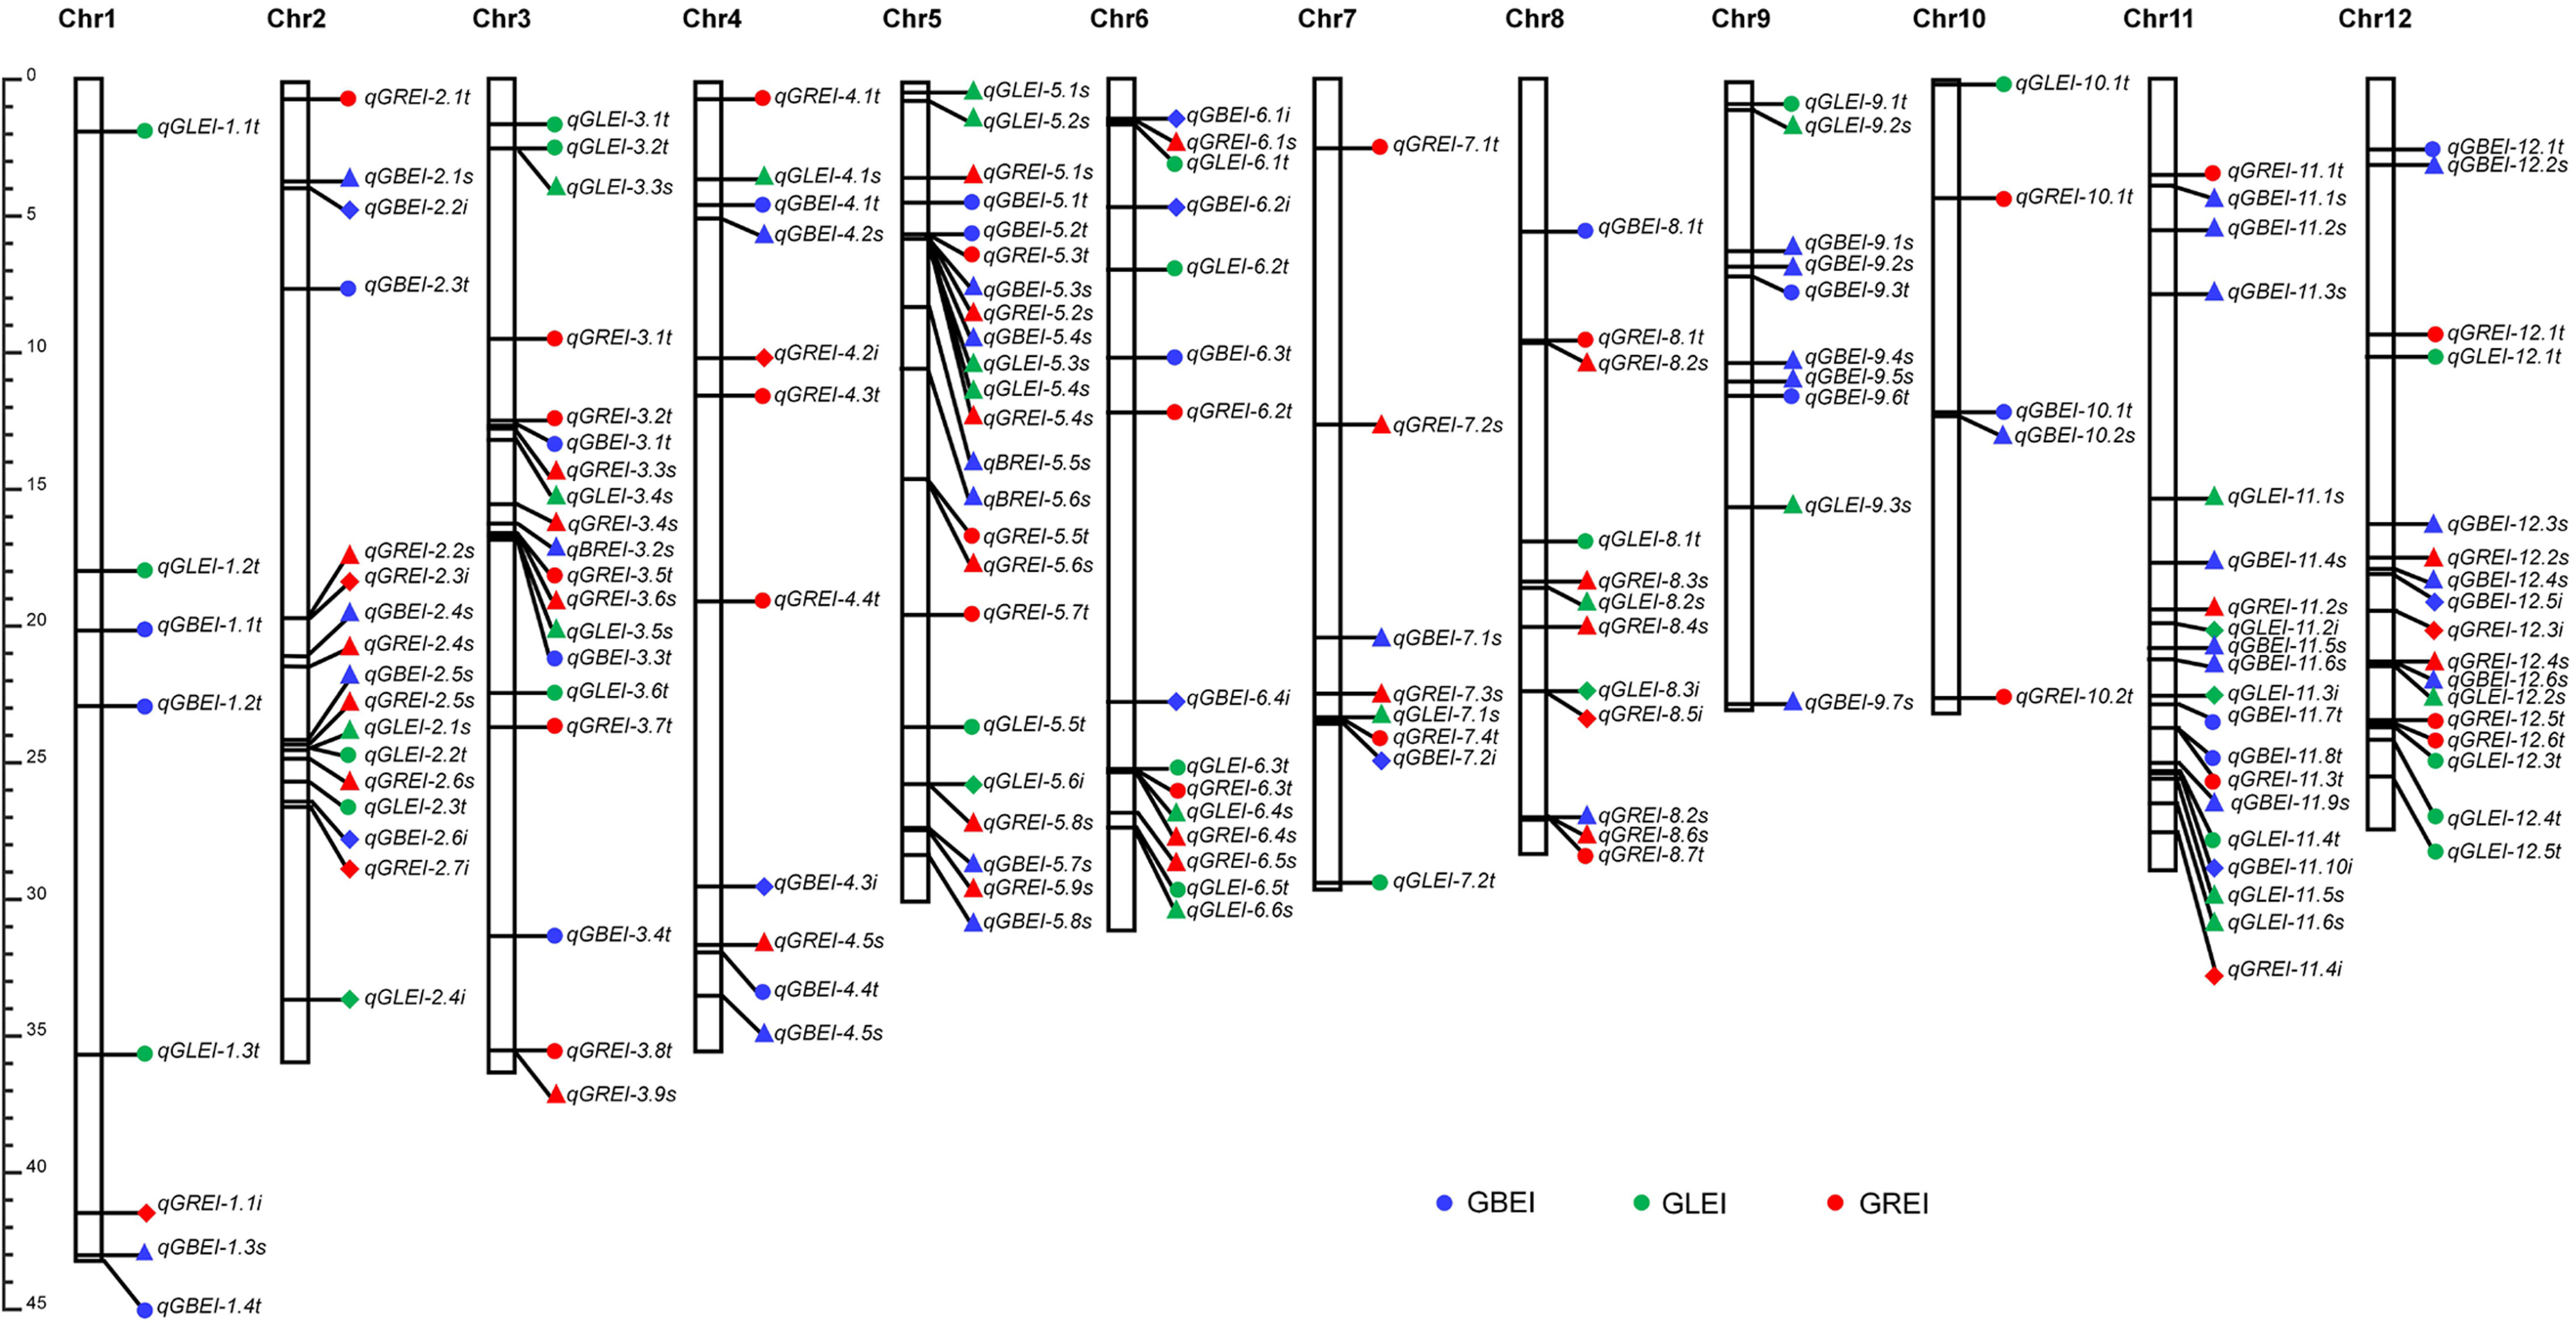
Figure 6 Locations of QTNs/QEIs for GBEI, GLEI and GREI in the rice genome. The QTNs detected by single-environment analysis are indicated by solid circles. The QTNs and QEIs detected by two-environment analysis are indicated by filled triangles and solid diamonds, respectively.
Considering that CCRGE may be largely determined by the starch in endosperm, we tried to predict the candidate genes involved in starch metabolism and endosperm development. By searching 20 related Gene Ontology/Term Ontology (GO/TO) classifications on the China Rice Data Center’s website (https://www.ricedata.cn/ontology/), 119 genes were found, of which 26 were located within the R2 half-decay distance around the detected QTNs/QEIs (Table S5). By analyzing the SNP variations in the genes with the software snpEff v1.9, five genes were found to carry effective mutations, including non-synonymous, splice site and UTR-5’ mutations (Table 6; Figure S3). So, these genes were considered to be candidate genes.
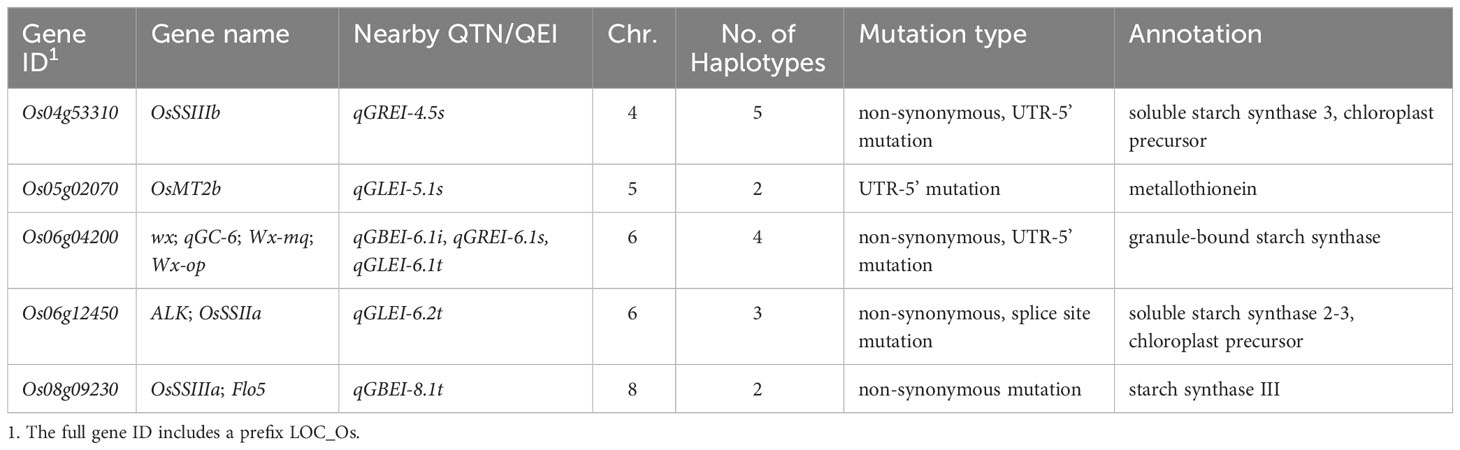
Table 6 Candidate genes for GBEI, GLEI and GREI .
We then performed haplotype analysis to assess the reliability of the candidate genes. LOC_Os04g53310 (OsSSIIIb), LOC_Os06g04200 (wx) and LOC_Os08g09230 (OsSSIIIa) exhibited significant haplotype differences for GBEI; LOC_Os04g53310, LOC_Os05g02070 (OsMT2b) and LOC_Os06g12450 (OsSSIIa) displayed significant haplotype differences for GLEI; and all of the genes except for LOC_Os06g12450 showed significant haplotype differences for GREI (Figure 7). These findings strongly suggested a close association of these five genes with the CCRGE.
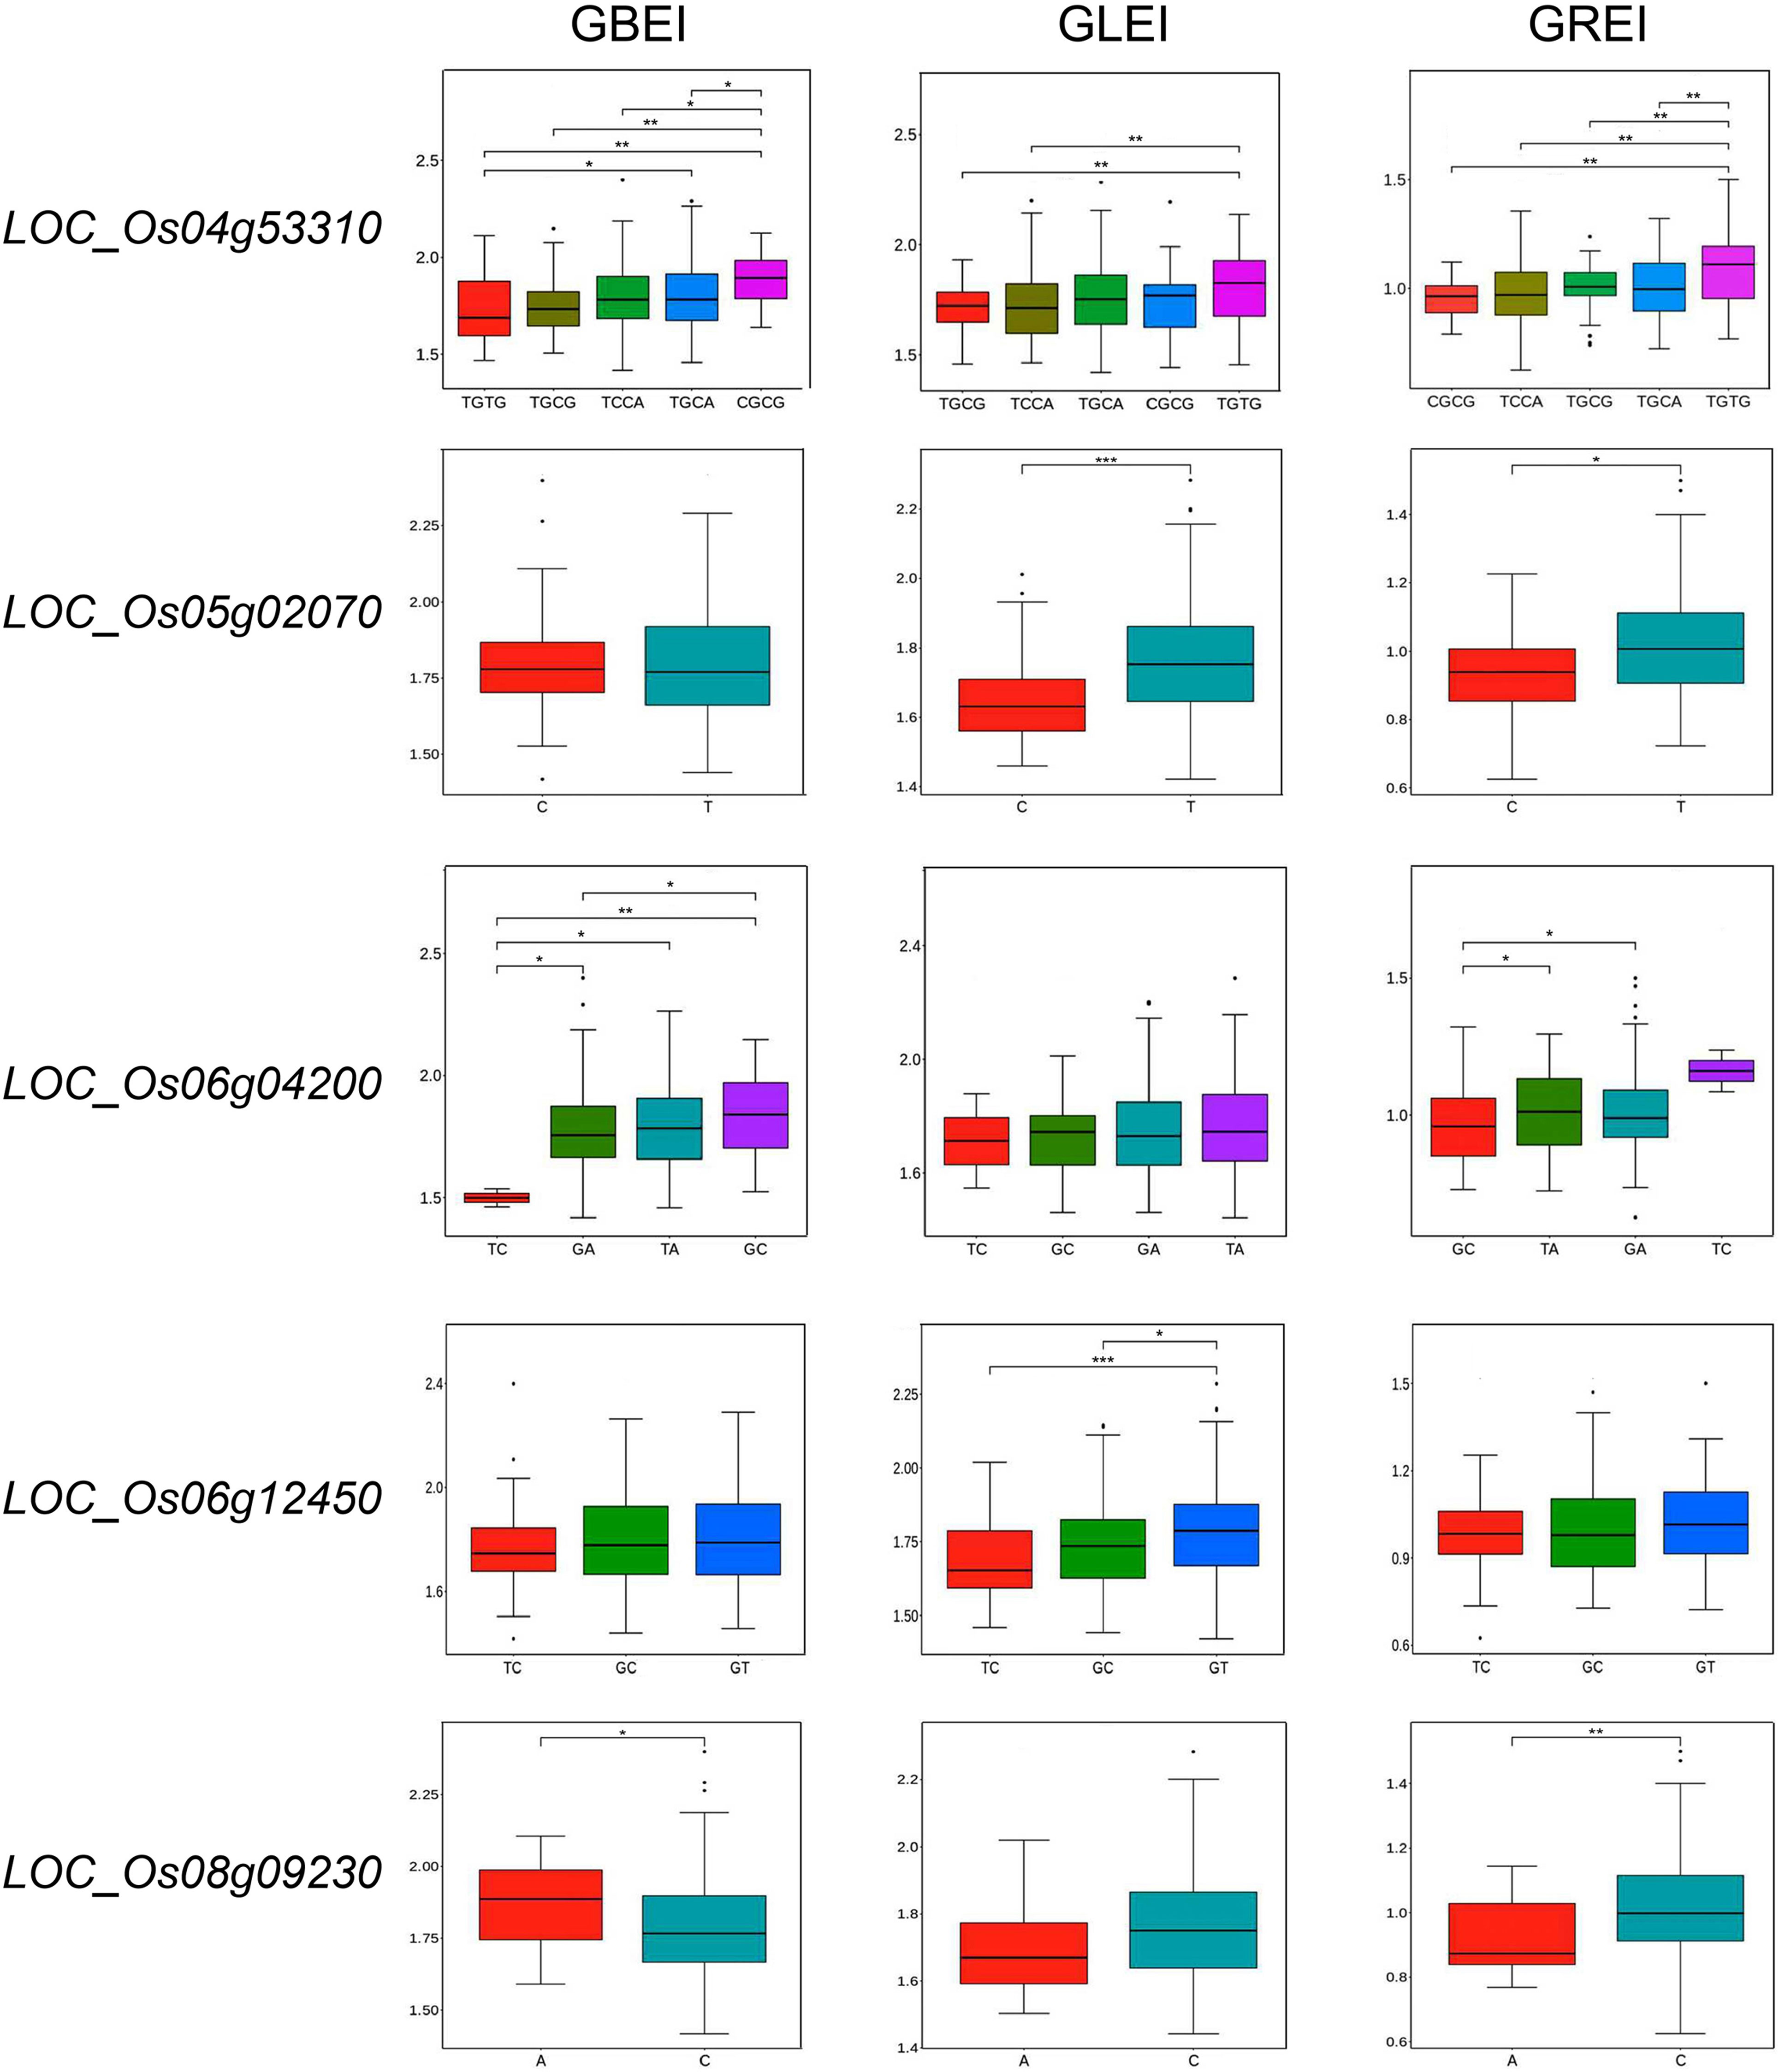
Figure 7 Haplotype analysis of candidate genes for GBEI, GLEI and GREI. *, ** and *** indicate significance at P<0.05, P<0.01 and P<0.001, respectively.
To further verify the potential impact of these candidate genes on the regulation of starch synthesis and endosperm development, we analyzed the expression patterns of the five candidate genes in various tissues based on data from the Rice Genome Annotation Project database (Figure 8). The results showed that LOC_Os04g53310 (OsSSIIIb) was expressed mainly in leaf and pre-emergence inflorescence but not in seed or endosperm; LOC_Os05g02070 (OsMT2b) was expressed mainly in post- and pre-emergence inflorescence and in embryo of 25 DAP (days after pollination), but not in endosperm. This suggests that these two genes maybe not closely or indirectly associated with endosperm development. In contrast, LOC_Os06g04200 (wx), LOC_Os06g12450 (OsSSIIa) and LOC_Os08g09230 (OsSSIIIa) exhibited high expression in 10 DAP seed, and the highest expression in 25 DAP endosperm, but no expression in embryo, indicating their potential involvement in starch synthesis or endosperm development.
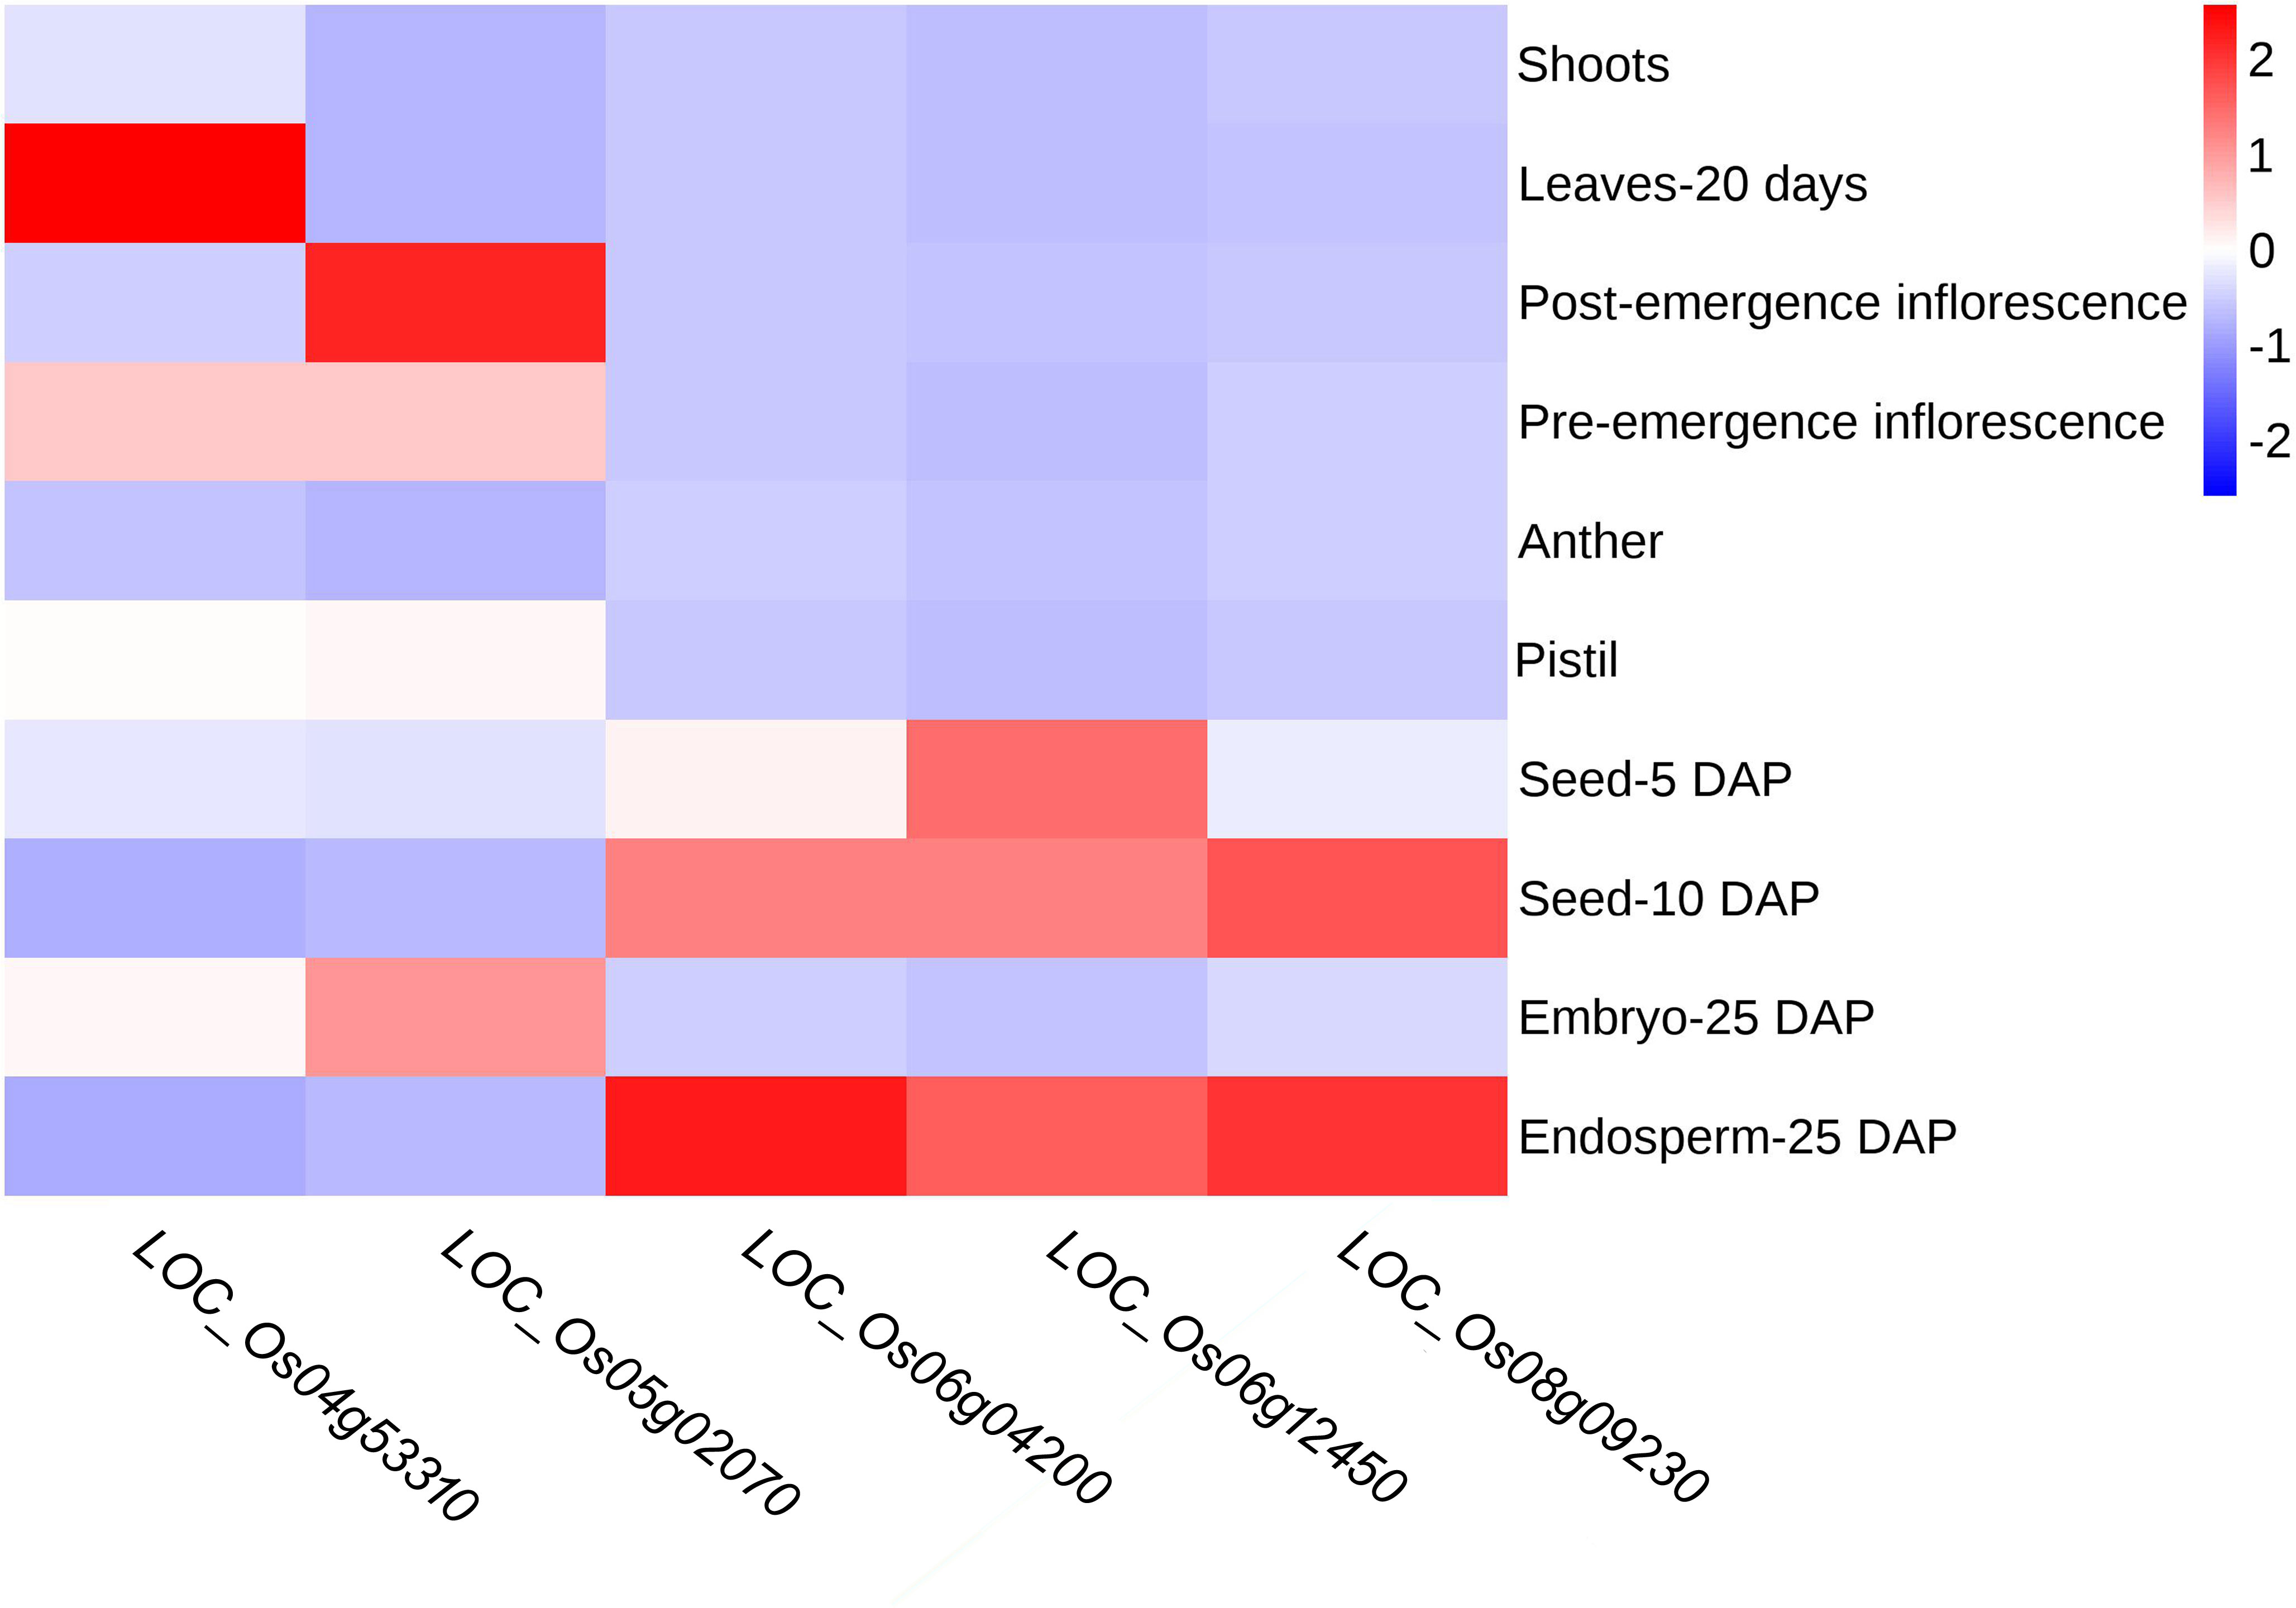
Figure 8 Heatmap of candidate gene expression analysis by RNA-seq data from RGAP database. Red boxes indicate high transcript levels and blue boxes indicate low transcript levels. DAP, days after pollination.
When analyzing single environmental data, only QTNs, qGREI-5.2s and qGREI-5.6s, were commonly detected in two environments. This may be due to changes in the relative effects of different genes for these traits in different environments, indicating that the genes controlling these traits interacted with the environments. Joint analysis of the two environmental datasets using the 3VmrMLM method revealed 21 QEIs for three traits, also indicating the interaction between QTN and environment. Actually, ANOVA results showed significant genotype-by-environment interaction in the three traits (Table 1). However, there were no overlapping sites between QEI and QTNs detected based on two environmental data, indicating that all QEIs had no significant additive or dominant effect, but only the interaction effect between additive or dominant and environment, while all the QTNs in two-environment jointly analyze were opposite. Using the same 3VmrMLM method in previous studies, the overlapping sites between QEI and QTNs were also few, ranging from 1-3 sites (Han et al., 2022; He et al., 2022; Yu et al., 2022; Zhang et al., 2022; Jiang et al., 2023; Zhao et al., 2023), except for the study of Zou et al. (2022), which found 13 overlapping sites. From the perspective of the effect of QEI, since most QEIs do not have a significant additive or dominant effect, their reliability needs to be further confirmed.
In this study, among the 78 QTNs detected by single-environment analysis, only four QTNs were detected in both environments simultaneously (Table 4; Supplemental Table 2), indicating that only a small proportion (~5%) of QTNs exhibited stable significant effects across the environments. Interestingly, these four stable QTNs appear to represent four different types in terms of the way of being detected (Supplemental Table 2). The first type is qGREI-5.6s, which was detected by the same method in both environments, and no other methods detected it in either environment. The second type is qGBEI-5.4s, which was detected by one method in one environment, but by another method in the other environment. The third type is qGREI-5.2s, which was detected by one method in one environment, but by multiple other methods in the other environment. The fourth type is qGLEI-3.3s, which was also detected by one method in one environment and by multiple methods in the other environment, but with one method being the same in the two environments. It is noticeable that three of the four stable QTNs were detected in two different environments due to the use of multiple methods. These findings highlight the advantages of employing multiple GWAS methods to analyze the data collected from diverse environmental conditions.
According to the definitions, GREI is a composite trait that comprises various levels of component traits, which exhibit correlation with grain length and grain breadth before cooking (L0 and B0) or after cooking (L1 and B1), and is directly proportional to GLEI while inversely proportional to GBEI. Evidently, genes governing GBEI and GLEI may also impact GREI in principle. In other words, the QTLs for GREI may exhibit pleiotropic effects on its component traits or correlated traits. In this study, we did identify 4 QTNs that simultaneously influence GREI and GLEI, and 2 QTNs that simultaneously affect GREI and GBEI (Table 7). This was consistent with the high correlation between GREI and GLEI and GBEI (Table 2). As expected, there were no QTNs pleiotropic on GLEI and GBEI, which is in line with the conclusion that GLEI and GBEI are independent traits and have different genetic bases. Moreover, 3 QTNs controlling GLEI and GREI respectively were detected simultaneously in single and two environments, demonstrating the stability of these QTNs.
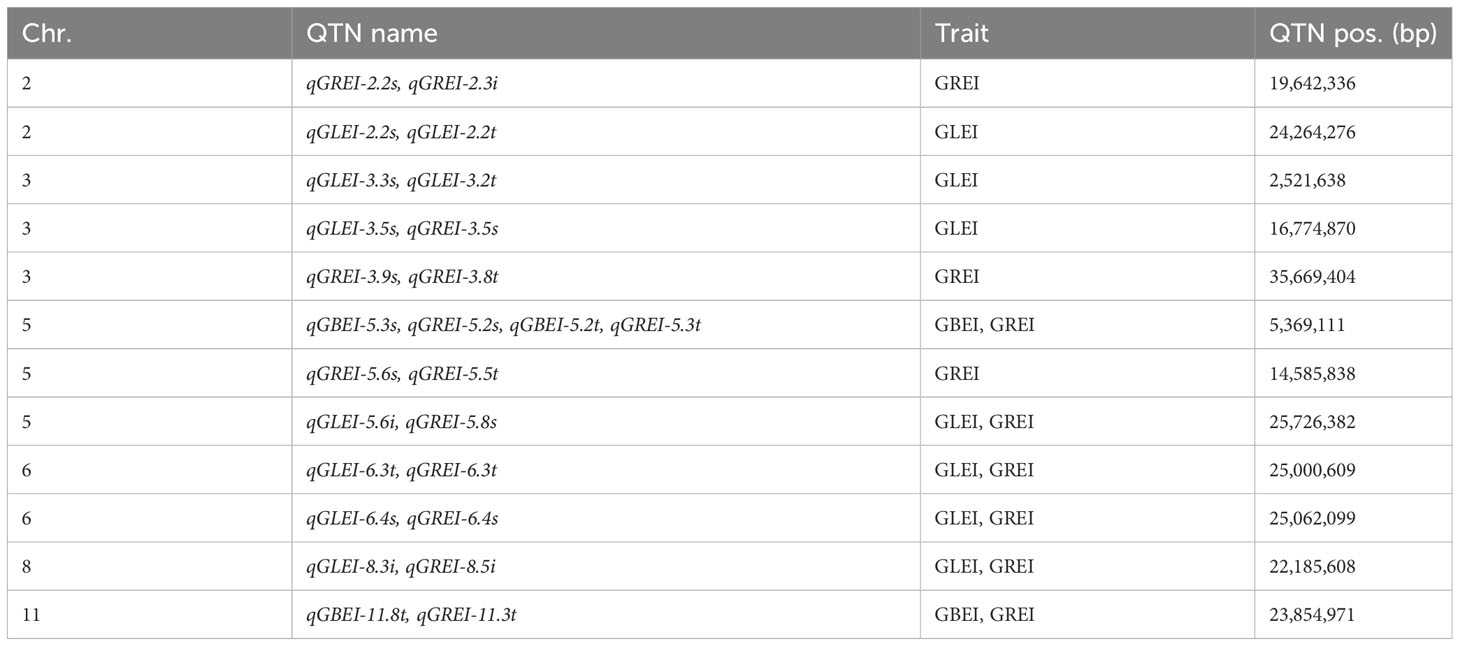
Table 7 Common QTLs between GREI, GBEI and GREI, or between different analysis aspects.
As mentioned above in the introduction, there were 10, 47 and 15 reported QTLs controlling length, width and length-width expansion caused by cooking in rice grain. Upon comparing these QTLs with the QTNs mapped in this study, we observed that 12, 9, and 15 QTNs for GBEI, GLEI, and GREI detected in this study were located within the intervals of one or more previously reported QTLs (Table S6). These comparisons provide evidence for the reliability of the QTLs detected in this study. Notably, the four putative genes (LOC_Os05g02070, LOC_Os06g04200, LOC_Os06g12450, and LOC_Os08g09230) identified in this study were found to be in close proximity to four of the aforementioned QTLs).
Due to the swelling of starch granules during cooking, rice grain cooking-caused expansion traits, such as GBEI, GLEI and GREI, is expected to be influenced by starch-related traits which include two typical traits: chalkiness rate and amylose content. Chalkiness rate is a crucial parameter for assessing the visual quality of rice, as high chalkiness rate can lead to easy breakage of grains during processing, low amylose content, and poor eating quality. Thi et al. (2020) utilized a genetic population to map GREI and discovered a positive correlation between amylose content and GREI, with high AC content leading to increased GREI. OsMT2b encodes a metallothionein that binds to metal ions and scavenges reactive oxygen species (ROS). Wu et al. (2022) reported that WCR1, a negative regulator of rice chalkiness rate, functions to regulate OsMT2b (LOC_Os05g02070) transcription level and inhibit 26S proteasome-mediated OsMT2b protein degradation, thereby facilitating ROS clearance, delaying programmed cell death (PCD) of endosperm cells, and ultimately increasing the accumulation of storage substances, and reducing chalkiness rate. In this study, a SNP site is present in the 5’-UTR region of OsMT2b near qGLEI-5.1s (Figure S3), which may disrupt the expression of OsMT2b, thereby affecting the change in rice cooking caused expansion in the analyzed population. Furthermore, considering the expression pattern of OsMT2b, it is noteworthy that its expression level exhibits a significant reduction in the endosperm. This observation implies its potential indirect influence on starch synthesis or endosperm development.
wx (LOC_Os06g04200), OsSSIIa (LOC_Os06g12450), and OsSSIIIa (LOC_Os08g09230) are crucial genes involved in the biosynthesis of starch in rice grains. wx gene encodes granule-bound starch synthase (GBSS), a major enzyme responsible for amylose synthesis (Kharshiing and Chrungoo, 2021). It exerts a direct influence on the amylose content in the endosperm and pollen of rice, as well as the gel consistency of grains (Su et al., 2011). OsSSIIa encodes a soluble starch synthase II, and mutations in this gene may affect the activity of starch synthase, which in turn affects the synthesis of medium-length branched chains of amylopectin, changes the crystal layer structure, and ultimately alters the gelatinization temperature (Gao et al., 2003). OsSSIIIa encodes soluble starch synthase III, the second key enzyme involved in rice starch synthesis (Zhou et al., 2016). Mutations in OsSSIIIa can affect the structure of amylopectin, amylose content, and physicochemical properties of starch in rice grains. Double mutants of OsSSIIa and OsSSIIIa exhibited increased chalkiness and amylose content, increased gelatinization temperature, and decreased viscosity (Zhang et al., 2011). In this study, these three genes exhibited the SNP loci with genetic effects. In haplotype analysis, significant differences in GBEI, GLEI, or GREI were observed across different haplotypes caused by SNPs within these genes. In expression pattern analysis, these three genes were highly expressed in the endosperm and seeds 10 days after pollination. All the evidence supported the hypothesis that these three genes were candidate genes controlling CCRGE.
In addition, OsSSIIIb (LOC_Os04g53310) is a gene that encodes soluble starch synthase in rice. Its expression level and activity directly impact the synthesis and quality of starch in rice endosperm. OsSSIIIb can interact coordinately with OsSSIIIa, and loss of function of both genes leads to an increase in resistant starch content in cooked rice (Wang et al., 2023). Although its protein function is redundant with OsSSIIIa, its expression pattern differs significantly from OsSSIIIa which is expressed in the endosperm. OsSSIIIb is mainly expressed in leaves but not endosperm (Figure 8). In this study, the five haplotypes generated by the four SNP loci contained in the OsSSIIIb gene exhibit significant differences in three traits. The evidence proves that OsSSIIIb may indirectly participate in starch sythesis and subsequently affect CCRGE.
In this study, data of GBEI, GLEI and GREI, three traits related to rice grain cooked expansion, were collected from 345 rice accessions in two distinct environments. Utilizing 193,582 SNP markers, seven methods were employed to identify QTNs based on single-environment data, while the 3VmrMLM method was utilized to identify QTNs and QEIs based on two-environment data. A total of 165 reliable QTNs/QEIs were detected, with 60, 46 and 59 of them being associated with GLEI, GBEI and GREI, respectively. Additionally, 26 genes related to starch synthesis or endosperm development were found to be located around these QTNs/QEIs. Further haplotype and expression pattern analyses led to the identification of five candidate genes, namely LOC_Os04g53310 (OsSSIIIb), LOC_Os05g02070 (OsMT2b), LOC_Os06g04200 (wx), LOC_Os06g12450 (OsSSIIa), and LOC_Os08g09230 (OsSSIIIa). These findings can be instrumental in identifying genes and conducting in-depth genetic research on CCRGE.
The original contributions presented in the study are included in the article/Supplementary Material. Further inquiries can be directed to the corresponding author.
YZ and WW conceived and designed the experiment. KT, LL, EK, EN, ML, WN and SA measured the phenotypes of the traits. YZ, KT and XX analyzed the data. YZ and KT wrote the draft. WW revised the manuscript. All authors contributed to the article and approved the submitted version.
This work was supported by Natural Science Foundation of Fujian Province (CN) (2020I0009, 2022J01596), Cooperation Project on University Industry-Education-Research of Fujian Provincial Science and Technology Plan (CN) (2022N5011), Lancang-Mekong Cooperation Special Fund (2017-2018), International Sci-Tech Cooperation and Communication Program of Fujian Agriculture and Forestry University (KXGH17014).
We thank Mr. Jinzhong Li for his help in field experiments. We also thank Dr. Weiqi Tang and Mr. Likun Huang for their help in data analysis.
The authors declare that the research was conducted in the absence of any commercial or financial relationships that could be construed as a potential conflict of interest.
All claims expressed in this article are solely those of the authors and do not necessarily represent those of their affiliated organizations, or those of the publisher, the editors and the reviewers. Any product that may be evaluated in this article, or claim that may be made by its manufacturer, is not guaranteed or endorsed by the publisher.
The Supplementary Material for this article can be found online at: https://www.frontiersin.org/articles/10.3389/fpls.2023.1250854/full#supplementary-material
Supplementary Figure 1 | SNP site and its resulting mutation type in five candidate genes. The blue boxes represent exons; the horizontal purple lines represent introns; the white boxes represent 5’ or 3’-UTR. The direction of a white box indicates the direction of the gene in the genome.
Supplementary Figure 2 | Manhattan plots of single environment anlalyses by six methods in mrMLM R package on GBEI (A, D), GLEI (B, E) and GREI (C, F). The horizontal dashed lines indicate the LOD = 3.0 threshold. The left vertical axis is the -log10 (P-value), while the right vertical axis is the LOD score for each SNP marker. Pink dots indicate QTNs detected by more than one method. Blue dots indicate QTNs detected by only one method.
Supplementary Figure 3 | Manhattan plots of two-environment analyses by 3VmrMLM on GBEI (A, D), GLEI (B, E) and GREI (C, F). The horizontal dashed lines indicate the LOD = 3.0 threshold. The left vertical axis is the -log10 (P-value), while the right vertical axis is the LOD score for each SNP marker. Pink dots indicate significant (-log10(P-value) ≥ 6.588) or suggested (-log10(P-value) < 6.588 but LOD ≥ 3).
Ahn, S., Bollich, C., Mcclung, A., Tanksley, S. D. (1993). RFLP analysis of genomic regions associated with cooked- kernel elongation in rice. Theor. Appl. Genet. 87 (1-2), 27–32. doi: 10.1007/BF00223739
Alexander, D. H., Lange, K. (2011). Enhancements to the ADMIXTURE algorithm for individual ancestry estimation. BMC Bioinf. 12, 246. doi: 10.1186/1471-2105-12-246
Amarawathi, Y., Singh, R., Singh, A. K., Singh, V. P., Mohapatra, T., Sharma, T. R., et al. (2008). Mapping of quantitative trait loci for basmati quality traits in rice (Oryza sativa L.). Mol. Breed. 21, 49–65. doi: 10.1007/s11032-007-9108-8
Arikit, S., Wanchana, S., Khanthong, S., Saensuk, C., Thianthavon, T., Vanavichit, A., et al. (2019). QTL-seq identifies cooked grain elongation QTLs near soluble starch synthase and starch branching enzymes in rice (Oryza sativa L.). Sci. Rep. 9 (1), 1–10. doi: 10.1038/s41598-019-44856-2
Burghardt, L. T., Young, N. D., Tiffin, P. (2017). A guide to genome-wide association mapping in plants. Curr. Protoc. Plant Biol. 2 (1), 22–38. doi: 10.1002/cppb.20041
Cheng, F., Zhong, L., Wang, F., Zhang, G. P. (2005). Differences in cooking and eating properties between chalky and translucent parts in rice grains. Food Chem. 90 (1-2), 39–46. doi: 10.1016/j.foodchem.2004.03.018
Cingolani, P., Platts, A., Wang, L. L., Coon, M., Nguyen, T., Wang, L., et al. (2012). A program for annotating and predicting the effects of single nucleotide polymorphisms, SnpEff: SNPs in the genome of Drosophila melanogaster strain w1118; iso-2; iso-3. Fly 6 (2), 80–92. doi: 10.4161/fly.19695
Eizenga, G. C., Jia, M. H., Jackson, A. K., Boykin, D. L., Ali, M. L., Shakiba, E. (2019). Validation of yield component traits identified by genome-wide association mapping in a tropical japonica×tropical japonica rice biparental mapping population. Plant Genome 12 (1), 1–18. doi: 10.3835/plantgenome2018.04.0021
Feng, F., Li, Y., Qin, X., Liao, Y., Siddique, K. H. M. (2017). Changes in rice grain quality of Indica and Japonica type varieties released in China from 2000 to 2014. Front. Plant Sci. 8. doi: 10.3389/fpls.2017.01863.eCollection.2017
Fitzgerald, M. A., McCouch, S. R., Hall, R. D. (2009). Not just a grain of rice: The quest for quality. Trends in. Plant Sci. 14, 133–139. doi: 10.1016/j.tplants.2008.12.004
Frei, M., Siddhuraju, P., Becker, K. (2003). Studies on the in vitro starch digestibility and the glycemic index of six different indigenous rice cultivars from the Philippines. Food Chem. 83, 395–402. doi: 10.1016/S0308-8146(03)00101-8
Gao, Z., Zeng, D., Cui, X., Zhou, Y., Yan, M., Huang, D., et al. (2003). Map-based cloning of the ALK gene, which controls the gelatinization temperature of rice. Sci. China C Life Sci. 46 (6), 661–668. doi: 10.1360/03yc0099
Ge, X., Xing, Y. Z., Xu, C. G., He, Y. Q. (2005). QTL analysis of cooked rice grain elongation, volume expansion, and water absorption using a recombinant inbred population. Plant Breed. 124 (2), 121–126. doi: 10.1111/j.1439-0523.2004.01055.x
Golam, F., Prodhan, Z. H. (2013). Kernel elongation in rice. J. Sci. Food Agr. 93 (3), 449–456. doi: 10.1002/jsfa.5983
Govindaraj, P., Vinod, K., Arumugachamy, S., Maheswaran, M. (2009). Analysing genetic control of cooked grain traits and gelatinization temperature in a double haploid population of rice by quantitative trait loci mapping. Euphytica 166 (2), 165–176. doi: 10.1007/s10681-008-9808-0
Han, X., Tang, Q., Xu, L., Guan, Z., Tu, J., Yi, B., et al. (2022). Genome-wide detection of genotype environment interactions for flowering time in Brassica napus. Front. Plant Sci. 13. doi: 10.3389/fpls.2022.1065766
He, L., Wang, H., Sui, Y., Miao, Y., Jin, C., Luo, J. (2022). Genome-wide association studies of five free amino acid levels in rice. Front. Plant Sci. 13. doi: 10.3389/fpls.2022.1048860
He, Y., Xing, Y., Ge, X., Li, X., Xu, C. (2003). Gene mapping for elongation index related traits on cooked rice grain quality. Mol. Plant Breed. 1 (5/6), 613–619. doi: 10.3969/j.issn.1672-416X.2003.05.004
Hossain, M. S., Singh, A. K., Zaman, F. U. (2009). Cooking and eating characteristics of some newly identified inter sub-specific (indica/japonica) rice hybrids. ScienceAsia 35 (4), 320–325. doi: 10.2306/scienceasia1513-1874.2009.35.320
Huang, X., Han, B. (2014). Natural variations and genome-wide association studies in crop plants. Annu. Rev. Plant Biol. 65, 531–551. doi: 10.1146/annurev-arplant-050213-035715
Huang, X., Wei, X., Sang, T., Zhao, Q., Feng, Q., Zhao, Y., et al. (2010). Genome-wide association studies of 14 agronomic traits in rice landraces. Nat. Genet. 42 (11), 961. doi: 10.1038/ng.695
Huang, X., Zhao, Y., Li, C., Wang, A., Zhao, Q., Li, W. (2012). Genome-wide association study of flowering time and grain yield traits in a worldwide collection of rice germplasm. Nat. Genet. 44 (1), 32. doi: 10.1038/ng
Jiang, S., Huang, C., Xu, Z., Chen, W. (2008). QTL dissection of cooked rice elongation in rice (Oryza sativa L. Japonica). Plant Physiol. Commun. 44, 1091–1094. doi: 10.13592/j.cnki.ppj.2008.06.022
Jiang, H., Lv, S., Zhou, C., Qu, S., Liu, F., Sun, H., et al. (2023). Identification of QTL, QTL-by-environment interactions, and their candidate genes for resistance HG Type 0 and HG Type 1.2.3.5.7 in soybean using 3VmrMLM. Front. Plant Sci. 14. doi: 10.3389/fpls.2023.1177345
Kharshiing, G., Chrungoo, N. K. (2021). Wx alleles in rice: relationship with apparent amylose content of starch and a possible role in rice domestication. J. Genet. 100, 65. doi: 10.1007/s12041-021-01311-4
Li, Y., Tao, H., Xu, J., Shi, Z., Ye, W., Wu, L., et al. (2015). QTL analysis for cooking traits of super rice with a high-density SNP genetic map and fine mapping of a novel boiled grain length locus. Plant Breed. 134 (5), 535–541. doi: 10.1111/pbr.12294
Li, J., Xiao, J., Grandillo, S., Jiang, L., Wan, Y., Deng, Q., et al. (2004). QTL detection for rice grain quality traits using an interspecific backcross population derived from cultivated Asian (O. sativa L.) and African (O. glaberrima S.) rice. Genome 47 (4), 697–704. doi: 10.1139/g04-029
Li, M., Zhang, Y. W., Xiang, Y., Liu, M. H., Zhang, Y. M. (2022). IIIVmrMLM: The R and C++ tools associated with 3VmrMLM, a comprehensive GWAS method for dissecting quantitative traits. Mol. Plant 15, 1251–1253. doi: 10.1016/j.molp.2022.06.002
Liu, L., Yan, X. Y., Jiang, L., Zhang, W. W., Wang, M. Q., Zhou, S. R., et al. (2008). Identification of stably expressed quantitative trait loci for cooked rice elongation in non-Basmati varieties. Genome 51 (2), 104–112. doi: 10.1139/g07-106
Malik, A., Kumar, A., Ellur, R. K., Krishnan, S. G., Dixit, D., Bollinedi, H., et al. (2022). Molecular mapping of QTLs for grain dimension traits in Basmati rice. Front. Genet. 13. doi: 10.3389/fgene.2022.932166
Misra, G., Badoni, S., Anacleto, R., Graner, A., Alexandrov, N., Sreenivasulu, N. (2017). Whole genome sequencing-based association study to unravel genetic architecture of cooked grain width and length traits in rice. Sci. Rep. 7 (1), 12478. doi: 10.1038/s41598-017-12778-6
Pang, Y., Ali, J., Wang, X., Franje, N. J., Revilleza, J. E., Xu, J., et al. (2016). Relationship of rice grain amylose, gelatinization temperature and pasting properties for breeding better eating and cooking quality of rice varieties. PloS One 11, e0168483. doi: 10.1371/journal.pone.0168483
Purcell, S., Neale, B., Todd-Brown, K., Thomas, L., Ferreira, M. A., Bender, D., et al. (2007). PLINK: a tool set for whole-genome association and population-based linkage analysis. Am. J. Hum. Genet. 81, 559–575. doi: 10.1086/519795
Ren, W. L., Wen, Y. J., Dunwell, J. M., Zhang, Y. M. (2018). pKWmEB: integration of kruskal-Wallis test with empirical bayes under polygenic background control for multi-locus genome-wide association study. Heredity 120, 208–218. doi: 10.1038/s41437-017-0007-4
Shen, N., Lai, K., Nian, J., Zeng, D., Hu, J., Gao, Z., et al. (2011). Mapping and genetic analysis of quantitative trait loci for related traits of cooked rice. Chin. J. Rice Sci. 25 (5), 475–482. doi: 10.3969/j.issn.1001-7216.2011.05.004
Shen, S., Zhuang, J., Wang, S., Shu, Q., Bao, J., Xia, Y., et al. (2005). Analysis on the QTLs with main, epistasis and genotype- environmental interaction effects for cooked rice elongation. Chin. J. Rice Sci. 19, 319–322. doi: 10.3321/j.issn:1001-7216.2005.04.006
Su, Y., Rao, Y., Hu, S., Yang, Y., Gao, Z., Zhang, G., et al. (2011). Map-based cloning proves qGC-6, a major QTL for gel consistency of japonica/indica cross, responds by Waxy in rice (Oryza sativa L.). Theor. Appl. Genet. 123 (5), 859–867. doi: 10.1007/s00122-011-1632-6
Suwannaporn, P., Linnemann, A. (2008). Rice-eating quality among consumers in different rice grain preference contries. J. Sens. Stud. 23, 1–13. doi: 10.1111/j.1745-459X.2007.00129.x
Swamy, B. P. M., Kaladhar, K., Rani, S. N., Prasad, G. S. V., Viraktamath, B. C., Reddy, G. A., et al. (2012). QTL analysis for grain quality traits in 2 BC2F2 populations derived from crosses between Oryza sativa cv. Swarna and 2 accessions of O. nivara. J. Hered. 103 (3), 442–452. doi: 10.1093/jhered/esr145
Tamba, C. L., Ni, Y., Zhang, Y. (2017). Iterative sure independence screening EM-bayesian LASSO algorithm for multi-locus genome-wide association studies. PloS Comput. Biol. 13, e1005357. doi: 10.1371/journal.pcbi.1005357
Tamba, C., Zhang, Y. M. (2018). A fast mrMLM algorithm for multi-locus genome-wide association studies. bioRxiv 7, 341784. doi: 10.1101/341784
The 3,000 rice genomes project (2014). The 3,000 rice genomes project. GigaScience 3, 7. doi: 10.1186/2047-217X-3-7
Thi, K. M., Zheng, Y., Khine, E. E., Nyein, E. E., Lin, M. H. W., Oo, K. T., et al. (2020). Mapping of QTLs conferring high grain length-breadth relative expansion during cooking in rice cultivar Paw San Hmwe. Breed. Sci. 70, 551–557. doi: 10.1270/jsbbs.20040
Tian, R., Jiang, G. H., Shen, L. H., Wang, L. Q., He, Y. Q. (2005). Mapping quantitative trait loci underlying the cooking and eating quality of rice using a DH population. Mol. Breed. 15 (2), 117–124. doi: 10.1007/s11032-004-3270-z
Wang, S. B., Feng, J. Y., Ren, W. L., Huang, B., Zhou, L., Wen, Y. J., et al. (2016). Improving power and accuracy of genome-wide association studies via a multilocus mixed linear model methodology. Sci. Rep. 6, 19444. doi: 10.1038/srep19444
Wang, A., Jing, Y., Cheng, Q., Zhou, H., Wang, L., Gong, W., et al. (2023). Loss of function of SSIIIa and SSIIIb coordinately confers high RS content in cooked rice. Proc. Natl. Acad. Sci. U. S. A. 120 (19), e2220622120. doi: 10.1073/pnas.2220622120
Wang, L. Q., Liu, W. J., Xu, Y., He, Y. Q., Luo, L. J., Xing, Y. Z., et al. (2007). Genetic basis of 17 traits and viscosity parameters characterizing the eating and cooking quality of rice grain. Theor. Appl. Genet. 115 (4), 463–476. doi: 10.1007/s00122-007-0580-7
Wang, W., Mauleon, R., Hu, Z., Chebotarov, D., Tai, S., Wu, Z., et al. (2018). Genomic variation in 3,010 diverse accessions of Asian cultivated rice. Nature 557, 43–49. doi: 10.1038/s41586-018-0063-9
Wang, Q., Tang, J., Han, B., Huang, X. (2020). Advances in genome-wide association studies of complex traits in rice. Theor. Appl. Genet. 133 (5), 1415–1425. doi: 10.1007/s00122-019-03473-3
Wen, Y. J., Zhang, H., Ni, Y. L., Huang, B., Zhang, J., Feng, J. Y., et al. (2018). Methodological implementation of mixed linear models in multi-locus genome wide association studies. Brief. Bioinform. 19, 700–712. doi: 10.1093/bib/bbw145
Wu, B., Yun, P., Zhou, H., Xia, D., Gu, Y., Li, P., et al. (2022). Natural variation in WHITE-CORE RATE 1 regulates redox homeostasis in rice endosperm to affect grain quality. Plant Cell 34, 1912–1932. doi: 10.1093/plcell/koac057
Yu, K., Miao, H., Liu, H., Zhou, J., Sui, M., Zhan, Y., et al. (2022). Genome-wide association studies reveal novel QTLs, QTL-byenvironment interactions and their candidate genes for tocopherol content in soybean seed. Front. Plant Sci. 13. doi: 10.3389/fpls.2022.1026581
Zhang, G., Cheng, Z., Zhang, X., Guo, X., Su, N., Jiang, L., et al. (2011). Double repression of soluble starch synthase genes SSIIa and SSIIIa in rice (Oryza sativa L.) uncovers interactive effects on the physicochemical properties of starch. Genome 54 (6), 448–459. doi: 10.1139/g11-010
Zhang, J., Feng, J. Y., Ni, Y. L., Wen, Y. J., Niu, Y., Tamba, C. L., et al. (2017). pLARmEB: integration of least angle regression with empirical Bayes formultilocus genome-wide association studies. Heredity 118, 517–524. doi: 10.1038/hdy.2017.8
Zhang, Y. M., Jia, Z., Dunwell, J. M. (2019). Editorial: The applications of new multi-locus GWAS methodologies in the genetic dissection of complex traits. Front. Plant Sci. 10. doi: 10.3389/fpls.2019.00100
Zhang, Y. W., Tamba, C. L., Wen, Y. J., Li, P., Ren, W. L., Ni, Y. L., et al. (2020). mrMLM v4.0.2: an R platform for multi-locus genome-wide association studies. Genomics Proteomics Bioinf. 18 (4), 481–487. doi: 10.1016/j.gpb.2020.06.006
Zhang, J., Wang, S., Wu, X., Han, L., Wang, Y., Wen, Y. (2022). Identification of QTNs, QTN-byenvironment interactions and genes for yield-related traits in rice using 3VmrMLM. Front. Plant Sci. 13. doi: 10.3389/fpls.2022.995609
Zhang, G. H., Zeng, D. L., Guo, L. B., Qian, Q., Zhang, G. P., Teng, S., et al. (2004). Genetic dissection of cooked rice elongation in rice (Oryza sativa L.). Yi Chuan 26 (6), 887–892. doi: 10.3321/j.issn:0253-9772.2004.06.021
Zhao, Q., Shi, X. S., Wang, T., Chen, Y., Yang, R., Mi, J., et al. (2023). Identification of QTNs, QTN-by-environment interactions, and their candidate genes for grain size traits in main crop and ratoon rice. Front. Plant Sci. 14. doi: 10.3389/fpls.2023.1119218
Zhao, K., Tung, C. W., Eizenga, G. C., Wright, M. H., Ali, M. L., Price, A. H., et al. (2011). Genome-wide association mapping reveals a rich genetic architecture of complex traits in Oryza sativa. Nat. Commun. 2, 467. doi: 10.1038/ncomms1467
Zhou, H., Wang, L., Liu, G., Meng, X., Jing, Y., Shu, X., et al. (2016). Critical roles of soluble starch synthase SSIIIa and granule-bound starch synthase Waxy in synthesizing resistant starch in rice. Proc. Natl. Acad. Sci. U. S. A. 113 (45), 12844–12849. doi: 10.1073/pnas.1615104113
Keywords: rice, grain breadth expansion index (GBEI), grain length expansion index (GLEI), grain length-breadth relative expansion index (GREI), Genome-wide association study (GWAS)
Citation: Zheng Y, Thi KM, Lin L, Xie X, Khine EE, Nyein EE, Lin MHW, New WW, Aye SS and Wu W (2023) Genome-wide association study of cooking-caused grain expansion in rice (Oryza sativa L.). Front. Plant Sci. 14:1250854. doi: 10.3389/fpls.2023.1250854
Received: 30 June 2023; Accepted: 14 August 2023;
Published: 30 August 2023.
Edited by:
Yuan-Ming Zhang, Huazhong Agricultural University, ChinaReviewed by:
Xiangqian Zhao, Zhejiang Agriculture and Forestry University, ChinaCopyright © 2023 Zheng, Thi, Lin, Xie, Khine, Nyein, Lin, New, Aye and Wu. This is an open-access article distributed under the terms of the Creative Commons Attribution License (CC BY). The use, distribution or reproduction in other forums is permitted, provided the original author(s) and the copyright owner(s) are credited and that the original publication in this journal is cited, in accordance with accepted academic practice. No use, distribution or reproduction is permitted which does not comply with these terms.
*Correspondence: Weiren Wu, d3V3ckBmYWZ1LmVkdS5jbg==
†These authors have contributed equally to this work
Disclaimer: All claims expressed in this article are solely those of the authors and do not necessarily represent those of their affiliated organizations, or those of the publisher, the editors and the reviewers. Any product that may be evaluated in this article or claim that may be made by its manufacturer is not guaranteed or endorsed by the publisher.
Research integrity at Frontiers
Learn more about the work of our research integrity team to safeguard the quality of each article we publish.