
94% of researchers rate our articles as excellent or good
Learn more about the work of our research integrity team to safeguard the quality of each article we publish.
Find out more
ORIGINAL RESEARCH article
Front. Plant Sci. , 25 April 2022
Sec. Plant Breeding
Volume 13 - 2022 | https://doi.org/10.3389/fpls.2022.865584
This article is part of the Research Topic Soybean Molecular Breeding and Genetics View all 25 articles
 Ruiqiong Li1†Jianan Zou1†Dongming Sun1†Yan Jing2
 Depeng Wu3Ming Lian1Weili Teng1Yuhang Zhan1
 Wenbin Li1Xue Zhao1*
 Yingpeng Han1*
Isoflavones, one of the most important secondary metabolites produced by soybeans (Glycine max (L.) Merr.), are important for a variety of biological processes, and are beneficial for human health. To identify genetic loci underlying soybean isoflavone content, a mapping population containing 119 F5:18 recombinant inbred lines, derived by crossing soybean cultivar “Zhongdou27” with “Dongong8004,” was used. We identified 15 QTLs associated with isoflavone contents. A novel loci, qISO19-1, was mapped onto soybean chromosome 19 and was fine-mapped to a 62.8 kb region using a BC2F2 population. We considered GmMT1 as a candidate gene for the qISO19-1 locus due to the significant positive correlation recovered between its expression level and isoflavone content in the seeds of 43 soybean germplasms. Overexpression of GmMT1 in Arabidopsis and soybean cultivars increased isoflavone contents. Transgenic soybeans overexpressing GmMT1 also exhibited improved resistance to pathogenic infection, while transgenic Arabidopsis resisted salt and drought stress.
Isoflavones, important secondary metabolites commonly known as phytoestrogens, are one of the most highly bioactive flavonoid classes (Wahajuddin et al., 2013). Isoflavones are primarily synthesized via the phenylalanine pathway in leguminous plants, and are especially abundant in soybean seeds (Aoki et al., 2000). These metabolites not only play important anti-pathogenic roles in plants (Dixon et al., 2002; Subramanian et al., 2005; Graham et al., 2007; Meng et al., 2011; Zhang et al., 2020), and affect plant resistance to various abiotic stressors (Caldwell et al., 2005; Wu et al., 2008; Gutierrez-Gonzalez et al., 2010; Hamayun et al., 2017), but also benefit human health by reducing the risk of several diseases (Bradbury et al., 2014; Spagnuolo et al., 2015; Malloy et al., 2018). For example, previous studies have showed that soybean isoflavones play an important role in resistance to Phytophthora sojae (P. sojae) (Subramanian et al., 2005; Graham et al., 2007). Long term water deficit condition limited the isoflavone accumulation in soybean seeds (Gutierrez-Gonzalez et al., 2010). Isoflavone contents significantly increased in leaves and seeds of soybean under salt induction and over-expression of genes involved in isoflavone accumulation could improve soybean tolerance to salt (Jia et al., 2017).
In soybean seeds, isoflavones contain 12 components: daidzein, genistein, glycitein, daidzin, genistin, glycitin, 6-o-acetyldaidzin, 6-o-acetylgenistin, 6-o-acetylglycitin, 6-o-malonyldaidzin, 6-o-malonylgenistin, and 6-o-malonylglycitin; these components are classed as aglycones, glycosides, acetylglycosides, or malonylglycosides (Funaki et al., 2015; Sugiyama et al., 2017). Malonylglycosides are typically the most abundant type of isoflavone in soybean seeds, while aglycones are the least (Sugiyama et al., 2017). Despite their relatively low abundance, aglycone isoflavones (primarily daidzein, genistein, and glycitein) are important in the human body due to their comparatively high phytoestrogen activity and bioavailability (Nielsen and Williamson, 2007). Thus, it is critical to modify isoflavone quantity and composition to increase the relative abundance of aglycone isoflavones in soybean seeds, in order to improve the nutritional qualities of soy-derived foods.
Soybean isoflavone content is greatly influenced by both genetic and environmental factors during seed development (Zhang et al., 2014; Pei et al., 2018; Azam et al., 2020). The most influential environmental factors are climate, planting location, and year-to-year differences; of these, differences among years are the most important (Hoeck et al., 2000; Lee et al., 2003; Zhang et al., 2014). Recently, Azam et al. (2020) used 2 years of data collected for 1168 soybean accessions from three locations in the major ecoregions of soybean production in China to show that isoflavone content differed significantly among soybean accessions, accession types, growth years, and growth ecoregions.
As a typical quantitative trait, isoflavone content is controlled by multiple major and minor genes or quantitative trait loci (QTL); these QTLs are strongly affected by environmental and genetic factors (Primomo et al., 2005; Gutierrez-Gonzalez et al., 2011; Azam et al., 2020). To date, more than 200 QTLs for isoflavones distributed across the 20 soybean chromosomes are available in the SoyBase databank1. For example, Li et al. (2014) used a high-density genetic map that included 9948 polymorphic markers to identify 11 QTLs associated with isoflavone concentrations; Akond et al. (2014) identified three QTLs for soybean seed isoflavones using recombinant inbred line (RIL) populations and 5376 single nucleotide polymorphisms (SNPs) from the SoySNP6K BeadChip array (Illumina); and Cai et al. (2018) fine-mapped 15 stable QTLs for both individual and total isoflavone content using a high-density genetic linkage map with 3469 recombinant bin markers. However, with the exception of these few QTLs, most of the available isoflavones-related QTLs were obtained using lower-density genetic maps and do not overlap well. Because marker-assisted selection (MAS), which is based on QTLs, is a useful method by which to cultivate soybean varieties with high or low isoflavone concentrations (Akond et al., 2014), additional high-density genetic maps, containing abundant markers that cover the whole soybean genome, are still needed to identify the QTLs or genes most highly associated with isoflavone concentrations.
Therefore, in this study, we aimed to identify and fine-map a locus associated with soybean isoflavone concentration using a high-density genetic map with 2647 bin makers constructed by 119 RILs. We then aimed to isolate the candidate gene at this locus, and verify its association with isoflavone concentration using genetic transformation assays. Finally, we aimed to preliminarily investigate the roles of the candidate gene in response to abiotic and biotic stressors, including salt, drought, and pathogen infection.
Two soybean accessions, “Zhongdou27” with high isoflavone content and “Dongong8004” with low isoflavone content, were crossed to develop RILs, using the single seed descent (SSD) method (Oldach et al., 2014). An expanded population with 119 F5:18 families was derived and used to construct a linkage map and detect the QTLs associated with isoflavone content.
For fine-mapping of the identified QTL (qISO19-1), a BC2F3 population of 500 lines was constructed by backcrossing “Zhongdou27” (donor parent) and “Dongnong8004” (receptor parent). Heterozygosity at qISO19-1 was detected using recurrent selection in the BC2F2 population, and isoflavone contents were measured in the BC2F3 seeds produced by selected BC2F2 plants.
In preliminary experiments, “Zhongdou27” (male parent) and “Dongnong8004” (female parent) were planted in chernozem soils in Xiangyang (45°72′ N, 126°68′ E) and Hulan (45°9′ N, 126°58′ E) to confirm differences in isoflavone content. Subsequently, the RIL population was planted in Xiangyang and Hulan in 2018. For fine mapping, the BC2F3 population (as a transient generation) was planted in Xiangyang only (latitude 45°80′ N, 126°53′ E) in 2019. For candidate identification, a set of soybean germplasms consisting of 43 accessions were planted at Xiangyang in 2019 (Supplementary Table 1). Field trials were conducted in single-row plots (between 3 m long and 0.65 m rows) using a randomized complete block design, with three replicates per tested environment. Field management practices were typical, and were identical across environments. From all soybean materials, 20 seeds were collected from three plants per plot for isoflavone content measurement at the R8 stage (full maturity).
Isoflavone contents in the seeds collected from the parental lines, the RILs, the BC2F3 population, and 43 soybean germplasms were measured using high-performance liquid chromatography (HPLC) as described previously (Vyn et al., 2002; Zeng et al., 2009). Briefly, 20 seeds from each soybean line were ground into a powder. Isoflavones were extracted by adding 0.1 g of this powder to 10 mL of 80% (v/v) ethanol in a 15 mL falcon tube. The mixture was slowly vortexed for 1 h and then left overnight. Next, the extraction mixture was hydrolyzed using 2 mL HCl solvent (2 mol/L). The mixture was filtered through a nylon membrane filter (0.22 μm; Thermo Fisher Scientific, United States), and isoflavone content was measured in 1.5 μl of the filtrate using an HPLC (1290 Infinity II; Agilent, United States) with reversed-phase HPLC columns (ZORBAX SB-C18, Agilent, United States; 4.6 mm × 250 mm; 5 μm). Solvent A was double-distilled water (ddH2O), and solvent B was methanol (chromatographic purity). The ratio of solvent A to solvent B ratio was 1:1, the solvent flow rate was 0.8 mL/min, and the temperature of the column was maintained at 50°C. Using an Agilent 1290 DAD detector, UV spectra were measured at 254 nm, and area responses were integrated using Agilent OpenLAB Control Panel software. The three major isoflavone components (daidzein, genistein, and glycitein) were identified and quantified based on standards purchased from the Chengdu Manster Biotechnology Co., Ltd. (China). Total isoflavone content was equivalent to the sum of the daidzein, genistein, and glycitein contents.
Genomic DNA for the RIL population and the parental lines were prepared as described By Qi et al. (2014). Sequencing libraries for these samples were constructed and sequenced on an Illumina HiSeq2500 sequencing platform, following the manufacturer’s instructions. The sequencing reads for the RIL population and the parental lines were aligned to the soybean reference genome (assembly Glycine_max_v2.1) (Schmutz et al., 2010) using Short Oligonucleotide Alignment Program 2 (SOAP2) (Li et al., 2009). GATK (McKenna et al., 2010) was used to identify polymorphic SNPs between the RIL population and the parental lines.
Co-segregating SNPs were separated into bins, and a bin map was constructed based on the recombinant breakpoints of the RIL population with HighMap (Liu et al., 2014). Genetic distances among markers were calculated using the Kosambi mapping function (Kosambi, 1944). Linkage groups were discriminated at a log-likelihood threshold of 3.0. QTL mapping were performed using IciMapping v4.1 (Meng et al., 2015). Putative QTLs were identified based on LOD threshold of 2.5.
We used 500 lines in the BC2F3 family to construct a local saturation map within qISO19-1 based on SSR markers. The SSR primers used for fine-mapping are given in Supplementary Table 2. We measured isoflavone contents in the seeds produced by these lines as described above. Recombinants were identified in the fine-mapping population based on 12 polymorphic SSR markers, and the QTLs significantly associated with isoflavone content (LOD > 2.5) were identified using IciMapping v4.1 (Meng et al., 2015). Student’s t-test was used to identify significant differences between lines of BC2F3 with high and low content of isoflavone in soybean seed.
For candidate gene identification, seeds of the 43 soybean germplasms described above were sampled at the R7 stage (yellow ripening stage); three replicate seeds were collected per accession for RNA extraction and isoflavone content measurement, to determine the correlation between isoflavone content and transcript abundance.
To analyze the relative expression dynamics of GmMT1 between high- and low- isoflavone soybean cultivars, developing seeds of “Zhongdou27” and “Dongnong8004” were sampled every 7 days from developmental stage R5 to R8 (three replicate seeds per cultivar were sampled at every time point). Plants were grown in a greenhouse under a 16 h light/8 h dark photoperiod at 25–26°C until sampling.
To determine the involvement of GmMT1 in the stress response, “Zhongdou27” was exposed to drought and salt stress. First, the roots of 3 week old “Zhongdou27” seedlings were immersed in quarter-strength (1/4) Murashige and Skoog (MS) liquid medium. We then supplemented the MS media of five seedlings with 150 mM NaCl, and the MS media of five seedlings with 8% (w/v) PEG6000 for the salt- and drought-stress response tests, respectively. The remaining five seedlings were kept in unsupplemented MS media as controls. Half of the uppermost fully extended leaf per seedling was sampled at 0, 1, 2, 4, 6, 8, 12, and 24 h after supplementation. During this period, plants were maintained in a greenhouse under a 16 h light/8 h dark photoperiod at 25–26°C. Harvested leaves were immediately frozen in liquid nitrogen and stored at −80°C. Leaves from three of the five treated plants were used for qRT-PCR.
qRT-PCRs were performed to determine the transcript abundance of GmMT1 in soybean seeds or leaves. Total RNA was isolated from leaves or seeds using RNAprep pure Plant Kits (DP432, Tiangen). First-strand cDNA was synthesized from total RNA using TIANScript RT Kits (KR104, Tiangen). qRT-PCRs were performed on an ABI 7500 Fast platform using SuperReal PreMix Plus (SYBR Green) Kits (FP205, Tiangen). Each qRT-PCR (20 μl) included 2 μl cDNA, 10 μl 2 × SuperReal PreMix Plus, 0.4 μl 50 × ROX Reference DyeΔ, 5 μl of each forward and reverse primer, and 6.6 μl ddH2O2. The qRT-PCR amplification conditions were 95°C for 2 min, followed by 40 cycles of 95°C for 10 s, 60°C for 30 s, and 72°C for 30 s. The primers used are given in Supplementary Table 3. Three technical replicates were performed per sample, and the relative levels of transcript abundance were calculated using the 2–ΔΔCT method (Livak and Schmittgen, 2001). The housekeeping gene GmActin4 (GenBank accession no. AF049106) was used as the internal standard. Student’s t-test was used to identify significant differences in transcriptional abundance of GmMT1.
We predicted the 3-D structure of the putatively encoded protein GmMT1 using Phyre 2 (Kelley et al., 2015). We identified DNA and protein sequences homologous to GmMT1 in soybeans and 15 other plant species in the Phytozome database2. We aligned these methyltransferases using DNAMAN (version 7.212, Lynnon Corp., QC, Canada). We then constructed a phylogenetic tree based on this alignment in MEGA 5 (Tamura et al., 2011).
The full-length cDNA sequence of GmMT1 was amplified from the developing seeds of the high-isoflavone cultivar “Zhongdou27” using RT-PCR. RT-PCRs were performed using the KOD One PCR Master Mix (Code No. KMM-201; Toyobo (Shanghai) Biotech Co., Ltd., China), following the manufacturer’s instructions. The primers used were GmMT1-F and GmMT1-R, which were designed based on sequences flanking GmMT1 in the Phytozome database (Goodstein et al., 2012), with the 5′ ends modified to include BglII and BstEII restriction sites (Supplementary Table 3). The RT-PCR cycling conditions were as follows: 5 min at 94°C; 35 cycles of 30 s at 94°C, 30 s at 60°C, and 45 s at 72°C; and a final 10 min at 72°C. The purified PCR products were ligated into the pGM-T vector (VK207, Tiangen). Positive clones expressing the correct sequence were further inserted into pCAMBIA3301 vector using double digestion and ligation. The bar gene was used as a selection marker in the pCAMBIA3301 vector. Two expression vectors (35S:GmMT1 or 35S:bar) were constructed for transformation using the recombinant pCAMBIA3301 plasmid.
The full-length coding region of GmMT1 was inserted into the pCAMBIA1302 vector under the control of the 35S promoter to generate a GFP-fused GmMT1 vector (35S:GmMT1-GFP). This recombinant vector and the control vector (35S:GFP) were transfected into separate groups of Arabidopsis protoplasts following Yoo et al. (2007). The transfected cells were examined and imaged under a confocal laser scanning microscope (DMi8, Leica, China). The primer sequences GmMT1-GFP-F and GmMT1-GFP-R were used for subcellular localization (Supplementary Table 3).
To verify that GmMT1 expression was associated with isoflavone content in soybeans, we overexpressed this gene in Arabidopsis and soybean plants. We selected “Dongnong50,” a low-isoflavone soybean cultivar, and A. thaliana Col-0 as the recipients of genetic transformation. The A. thaliana Col-0 mutant SALK_012168C was obtained from the Arabidopsis Biological Resource Center (ABRC). Transgenic soybean plants were grown in a greenhouse under a 16 h light/8 h dark photoperiod at 25–26°C; T0–T3 transgenic Arabidopsis plants were grown in a growth chamber with a photoperiod cycle of 16 h light/8 h dark at 22°C.
To develop transgenic Arabidopsis, the 35S:GmMT1 construct was transferred into Agrobacterium tumefaciens EHA105, and then transformed into two Arabidopsis strains (the Col-0 ecotype and the mt1 mutant) using on the floral dip method (Clough and Bent, 1998). Transgenic Arabidopsis lines were selected using phosphinothricin; bar and GmMT1 gene expression in the selected plants was verified by PCR amplification using specific primers (3301-bar-F/R and 3301-35S-GmMT1-F/R; Supplementary Table 3). We generated three independent T2 transgenic lines per strain. Isoflavone concentrations in the T2 transgenic plants were measured using HPLC as described above. T2 transgenic plants with no separation were used in subsequent experiments.
To test whether GmMT1 overexpression increased isoflavone production in the roots of low-isoflavone soybean cultivars, the 35S:GmMT1 recombinant plasmid was transformed into Agrobacterium rhizogenes strain K599, and transformed in to the hairy roots of cultivar Donong50 as previously described (Cao et al., 2009). After 2 weeks of cultivation, once the hairy roots had appeared, we removed ∼1 cm sections from the root tips of 205 plants. Using PCR and specific primers (3301-bar-F/R and 3301-35S-GmMT1-F/R; Supplementary Table 3), we confirmed bar and GmMT1 gene expression in roots. Isoflavone concentrations in the transgenic roots were measured as described above.
To determine whether the expression of GmMT1 influenced isoflavone content in soybean seeds, we then developed transgenic soybeans by introducing the recombinant plasmid into Agrobacterium tumefaciens strain EHA105, and performing stable transformation into the cotyledon nodes of soybean cultivar “Dongnong50” following Paz et al. (2004). The expression of GmMT1 in leaves of T2 transgenic soybean plants was verified using PCR amplification (3301-bar-F/R and 3301-35S-GmMT1-F/R) (Supplementary Table 3), western blotting, and qRT-PCR. Isoflavone concentrations in seeds of the T2 transgenic plants were measured as described above. T2 plants expressing GmMT1 were used for all subsequent experiments.
We tested the effects of salt and drought stress on the transgenic Arabidopsis and soybean plants. To test the effects of salt and drought on Arabidopsis, we planted wild-type (Col-0), mt1 mutant, and T3 transgenic (GmMT1-ox and GmMT1-ox mt1) Arabidopsis on MS agar plates (five plates per strain). We then treated three plates per strain with 100 Mm NaCl, and three plates per strain with 300 mM mannitol. The remaining untreated plates were used as controls. All plants were kept at 4°C for 3 days in the dark, and then transferred to a 22°C environment with a photoperiod cycle of 16 h light/8 h dark. We calculated the germination rate on the 4th day after treatment and measured the root growth of all plants using a Vernier caliper.
To explore whether isoflavone accumulation, driven by GmMT1 overexpression, improved soybean resistance to P. sojae, we measured GmMT1 transcript abundance in transgenic and wild-type hairy roots, as well as the reaction of transgenic and wild-type hairy roots to P. sojae infection. Before P. sojae infection, we removed ∼1 sections from the hairy root tips of wild-type and GmMT1-overexpressing “Donong50” that had been cultured for 15 days. The relative expression levels of GmMT1 were detected in these samples. Then, to test the effects of P. sojae infection, well-propagated cultures of P. sojae were cut into small pieces and placed on new carrot agar (CA) plates. The hairy roots were spread on the CA medium with the mycelia, and were cultured in a growth chamber under a 16 h light/8 h dark cycle at 25°C. After ∼14 days of incubation, once the hairy roots had appeared, we imaged the hairy roots to check for signs of infection.
Two soybean varieties (Glycine max (L.) Merr), one with high isoflavone content (“Zhongdou27”), and one with low isoflavone content (“Dongnong8004”), were planted in two locations GmMT1 Effects Soybean Isoflavone Content (Xiangyang and Hulan, China) to verify the difference in isoflavone content between the accessions. In both locations, isoflavone content was significantly higher in “Zhongdou27” than in “Dongnong8004” (P < 0.001) (Supplementary Table 4). Thus, these accessions were suitable for map-based QTL analysis. We therefore crossed “Zhongdou27” (male parent) with “Dongnong8004” (female parent) to derive an RIL mapping population of 119 F5:18 families. When the RIL were planted in Xiangyang and Hulan, isoflavone contents varied widely with location and population. Across the RIL population, total isoflavone content ranged from 1211.99 μg/g to 5683.43 μg/g (Supplementary Table 4). All traits of interest (i.e., total isoflavone content and content of each individual isoflavone) were continuously distributed (Supplementary Figure 1).
Genome resequencing was conducted to genotype the parental lines (“Zhongdou27” and “Dongnong8004”) and the 119 RILs in the mapping population. For “Zhongdou27,” we generated 26.18 GB of raw data, and 78.88% of the reads were successfully aligned to the soybean reference genome with an average depth of 24.54-fold; for “Dongnong8004,” we generated 25.58 GB of raw data, and 78.30% of the reads were successfully aligned to the soybean reference genome with an average depth of 22.86-fold (Supplementary Table 5). A total of 343,907 high-quality SNPs were identified between the two parents. Across all RILs, we generated 441.7 GB of raw data, with an average sequencing depth of 3.65-fold. For each of the 119 RILs, we generated an average of 3.46 GB of raw data (Supplementary Table 5). A total of 353 million SNPs were identified among the 119 RILs; all SNP sites in the RILs were integrated as recombination bin units. Finally, a genetic linkage map with 4231 bin markers was constructed along the 20 chromosomes (Supplementary Table 6). The total length of the bin map was 2172.98 centimorgans (cM), with a mean interval between markers of 0.82 cM (Supplementary Figure 2 and Supplementary Table 6).
Using linkage mapping, we identified 15 QTLs associated with daidzein (DZ), genistein (GC), glycitein (GT), and total isoflavone contents (TI), covering 10 of the 20 soybean chromosomes. Almost all QTLs were detected in both locations (Xiangyang and Hulan) or as multiple-effect QTLs, controlling the abundance of two or more isoflavones; the one exception was QTL qGC1-2, which was only associated with glycitein content in seeds from plants grown in Xiangyang (Table 1 and Supplementary Figure 3). Four of the 15 QTLs have been previously reported (Table 1). The remaining 11 QTLs were novel (Table 1). One novel locus, qISO19-1, which was detected between markers Bin2464 and Bin2465 on chromosome 19, was identified both by the inclusive composite interval mapping method (ICIM) (Figure 1A and Table 1). This QTL controlled the contents of daidzein, genistein, and total isoflavone (Figure 1B and Table 1). The genetic contribution of this QTL to each of these traits was more than 10%, indicating that qISO19-1 was an important QTL controlling individual and total content of soybean isoflavone. Thus, we selected qISO19-1 for further study.
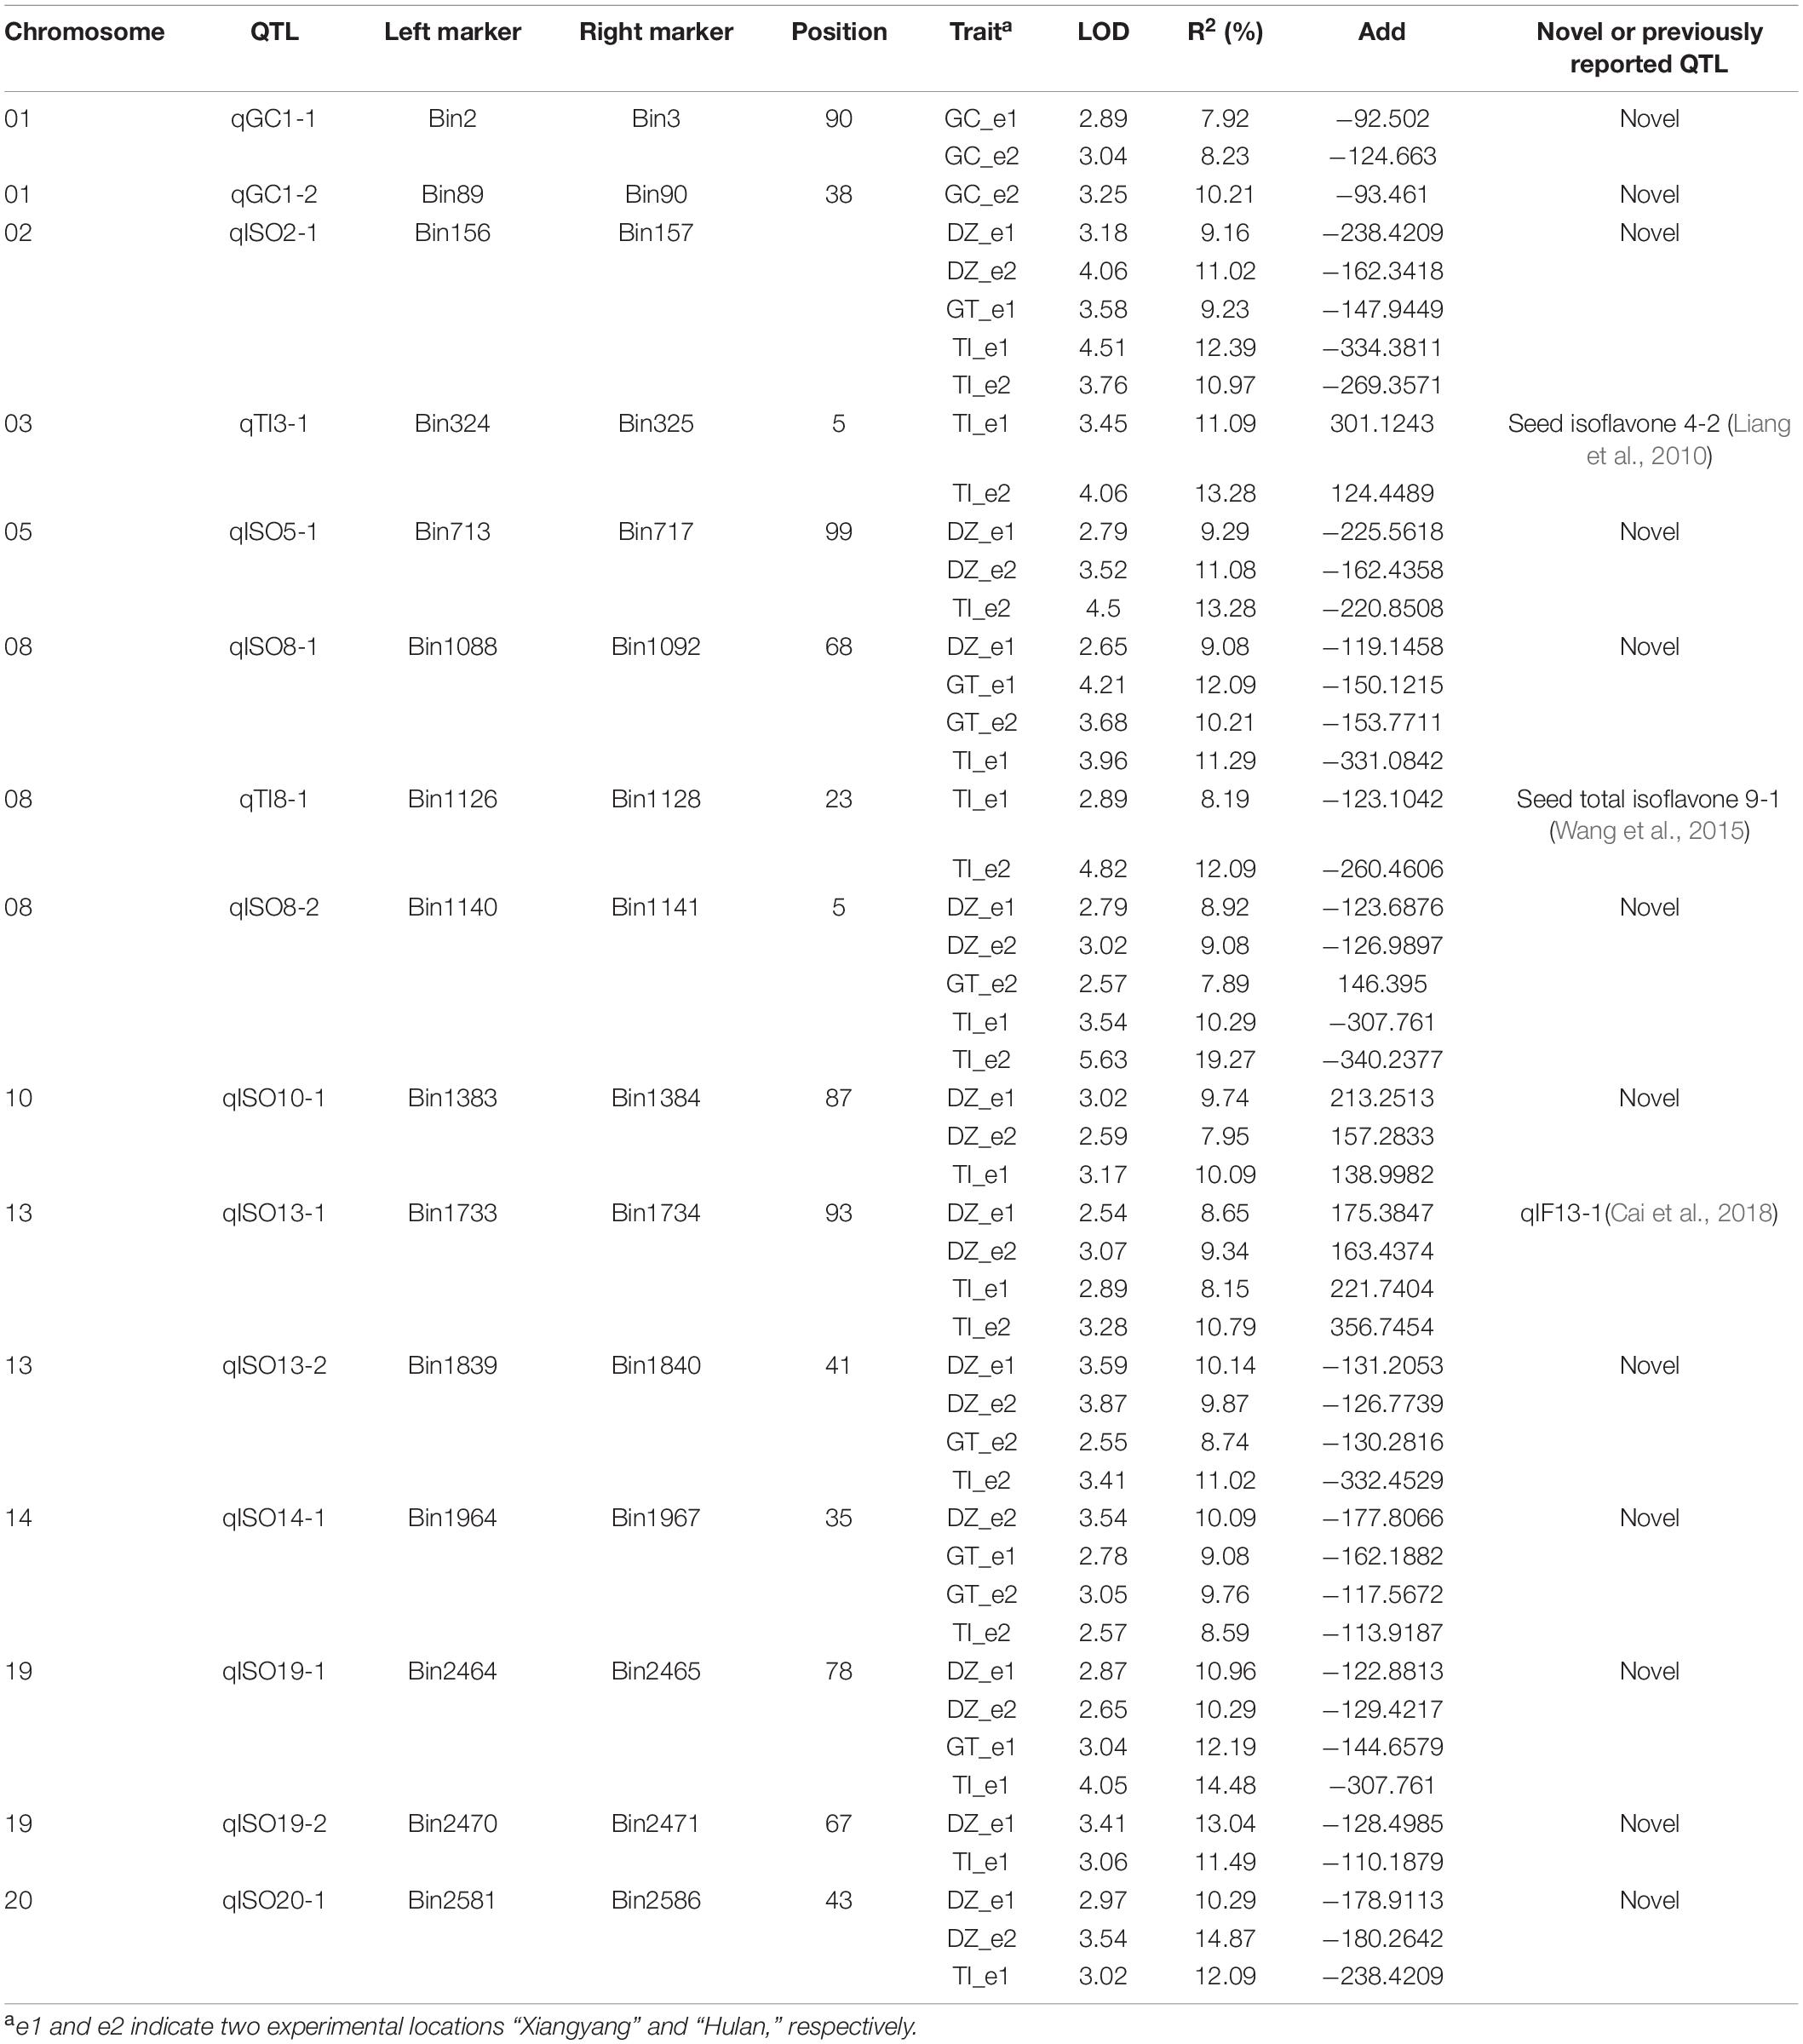
Table 1. Quantitative trait locis underlying soybean isoflavone content in two environments.
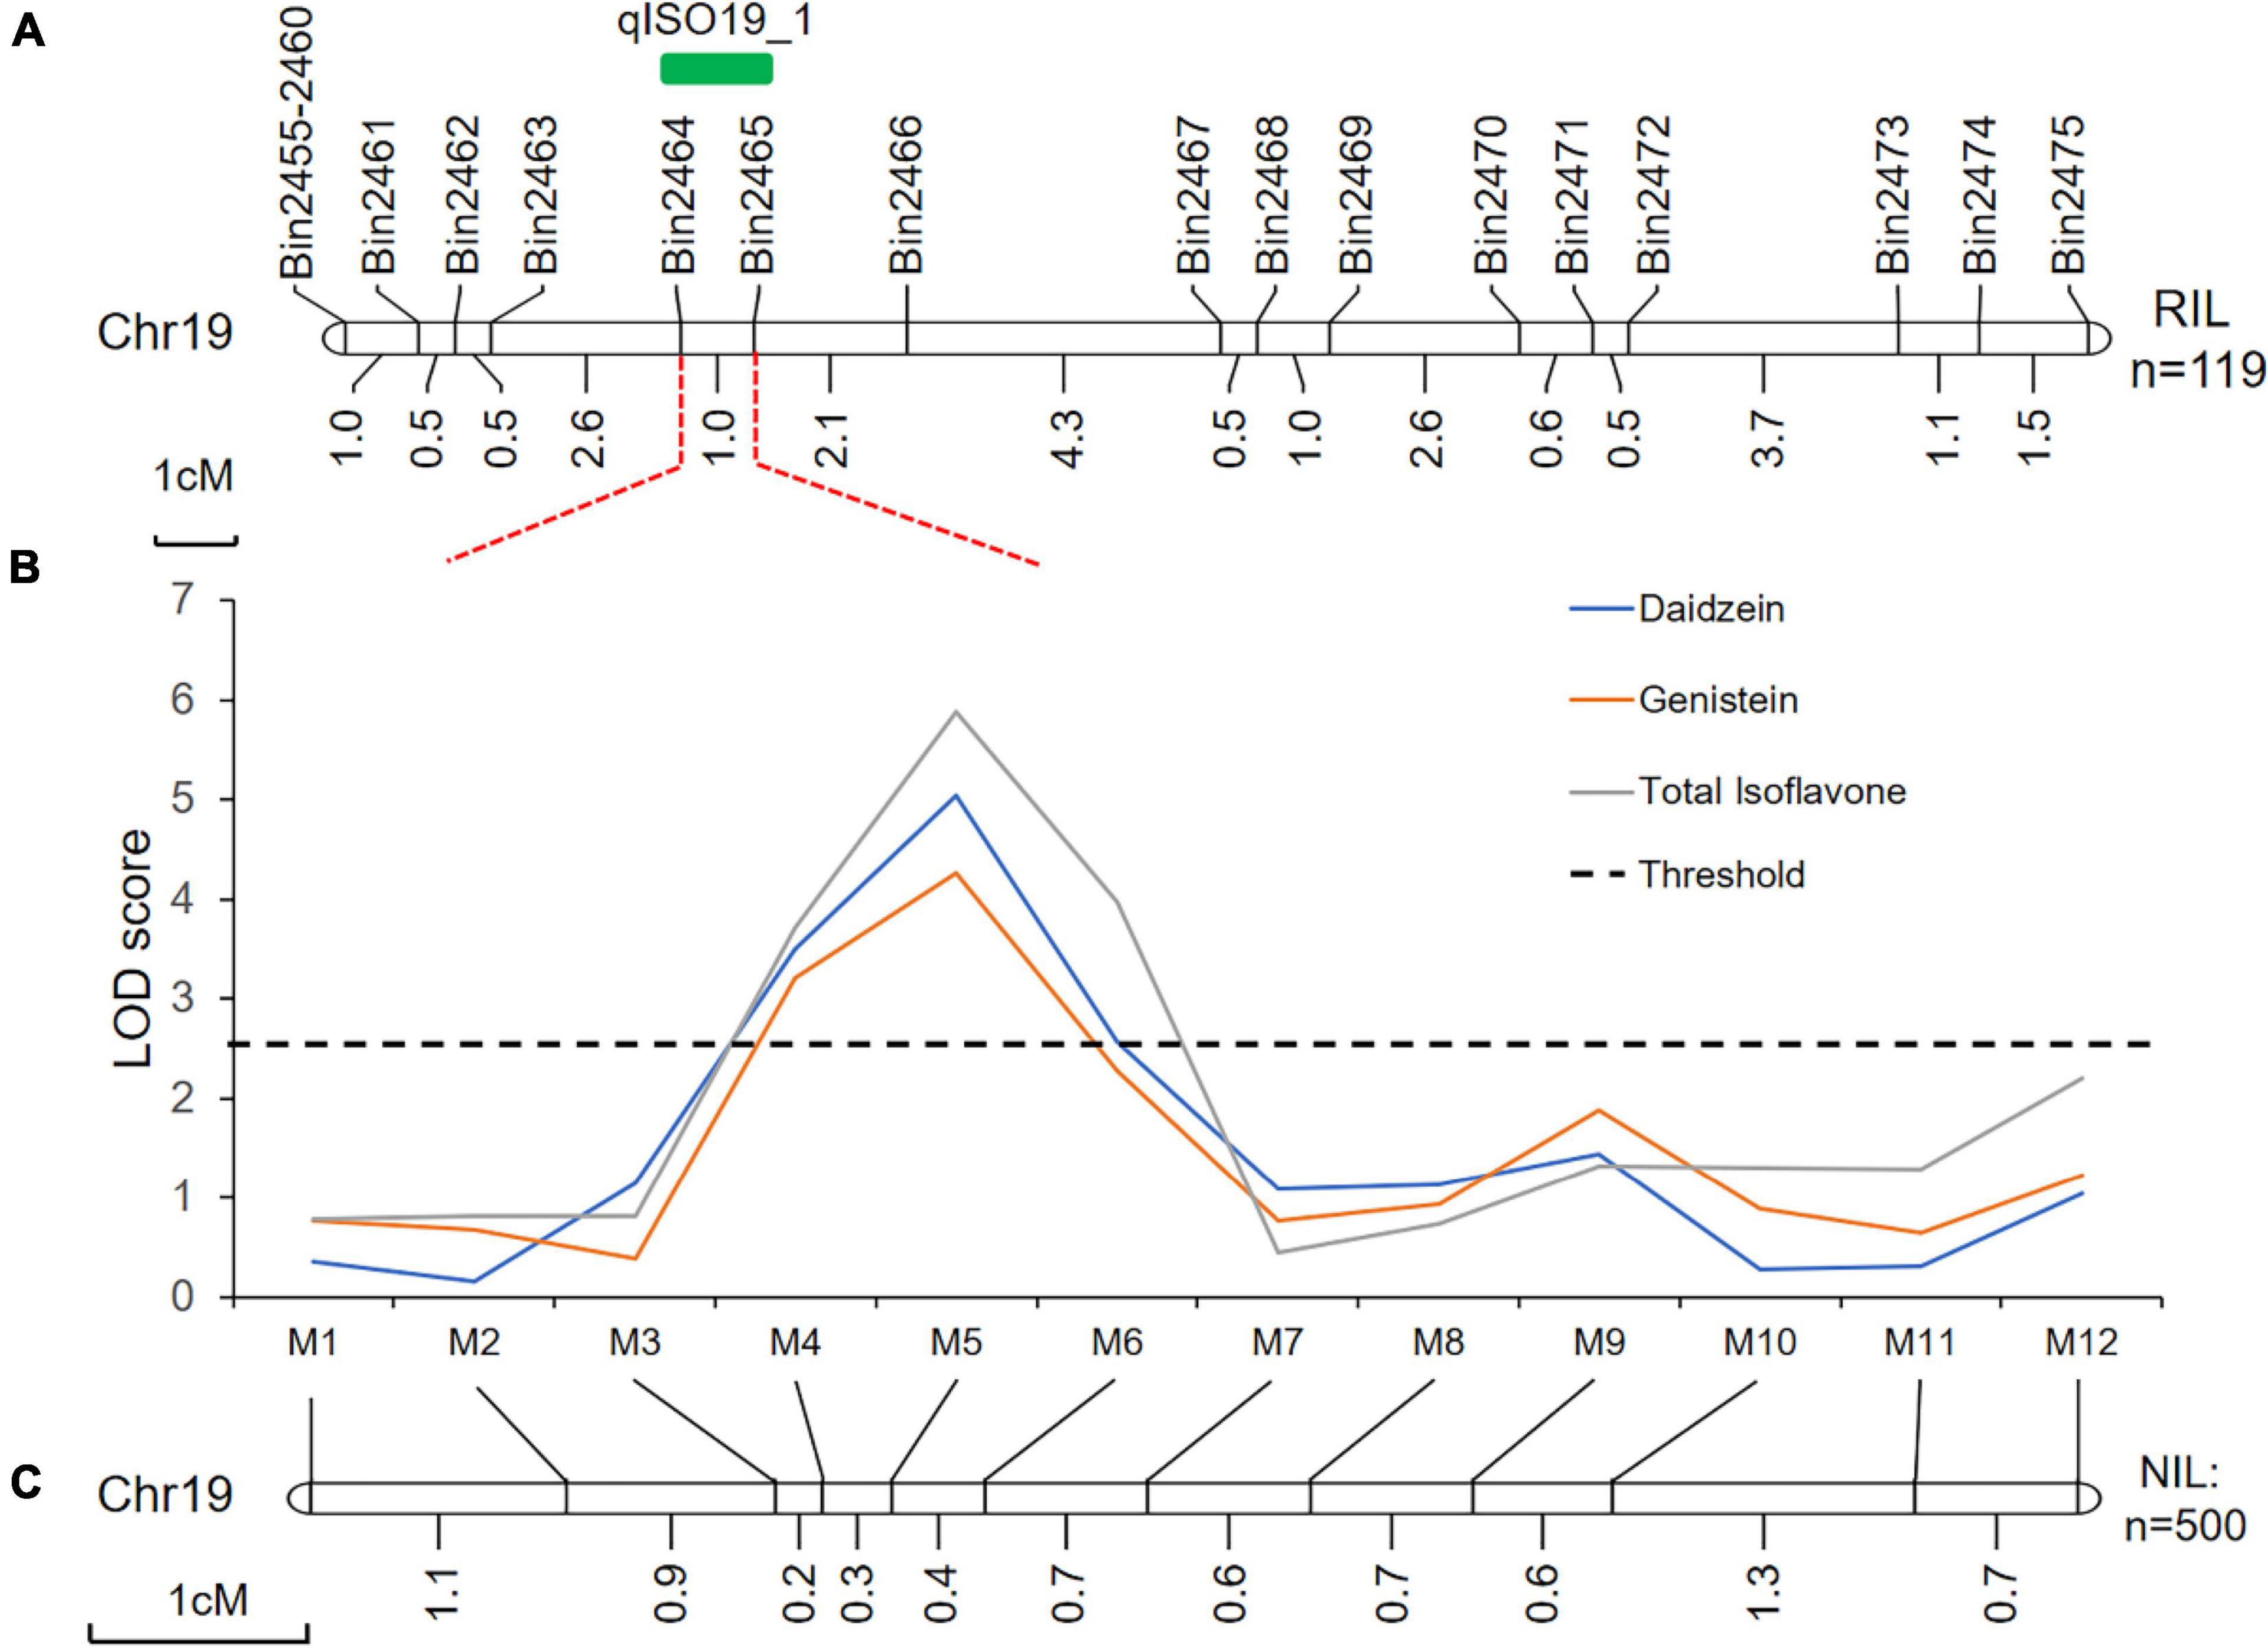
Figure 1. Genetic and physical maps of the qISO19-1 region. (A) Fine-mapping of the QTL qISO19-1 on soybean chromosome 19 using the RIL population. Genetic distances, in cM, are shown below the chromosome, and the locations of the markers and qISO19-1 are shown above. (B) LOD scores for isoflavone contents (daidzein and total isoflavone) over QTL qISO19-1 on chromosome 19. LOD scores were calculated independently by ICIM. The threshold LOD value was 2.5. (C) Genetic map showing the redefined position of qISO19-1 on chromosome 19 based on the BC2F3 population.
Quantitative trait loci qISO19-1 was fine-mapped using 75 simple sequence repeat (SSR) markers near qISO19-1 (between markers Bin2464 and Bin2465; Figure 1A). Of these SSR markers, 12 (M1–M12) were polymorphic between the parental lines, as well as within the BC2F3 population. The local saturation map of qISO19-1 for daidzein and total isoflavone contents showed that the logarithm of the odds (LOD) scores were above the threshold from M4 (SSR_19_0116) to M5 (SSR_19_0123) (Figures 1B,C). Within the fine-mapped population, we identified five recombinants that were homozygous for “Dongong8004” alleles at M4 and M5, and five recombinants that were homozygous or heterozygous for the “Zhongdou27” at these alleles (Figure 2A). Levels of daidzein and total isoflavone in the seeds produced by the lines carrying the “Zhongdou27” alleles were significantly higher (P < 0.001) than those produced by the lines carrying the “Dongong8004” alleles (Figure 2B). Thus, the qISO19-1 QTL was narrowly defined to a 62.9-kb region between markers SSR_19_0116 and SSR_19_0123 on chromosome 19. Based on comparisons with the reference genome (G. max Williams 82) (Schmutz et al., 2010), this interval harbors five putative genes (Figure 1A): Glyma.19G017200, Glyma.19G017300, Glyma.19G017400, Glyma.19G017500, and Glyma.19G017700 (Supplementary Table 7).
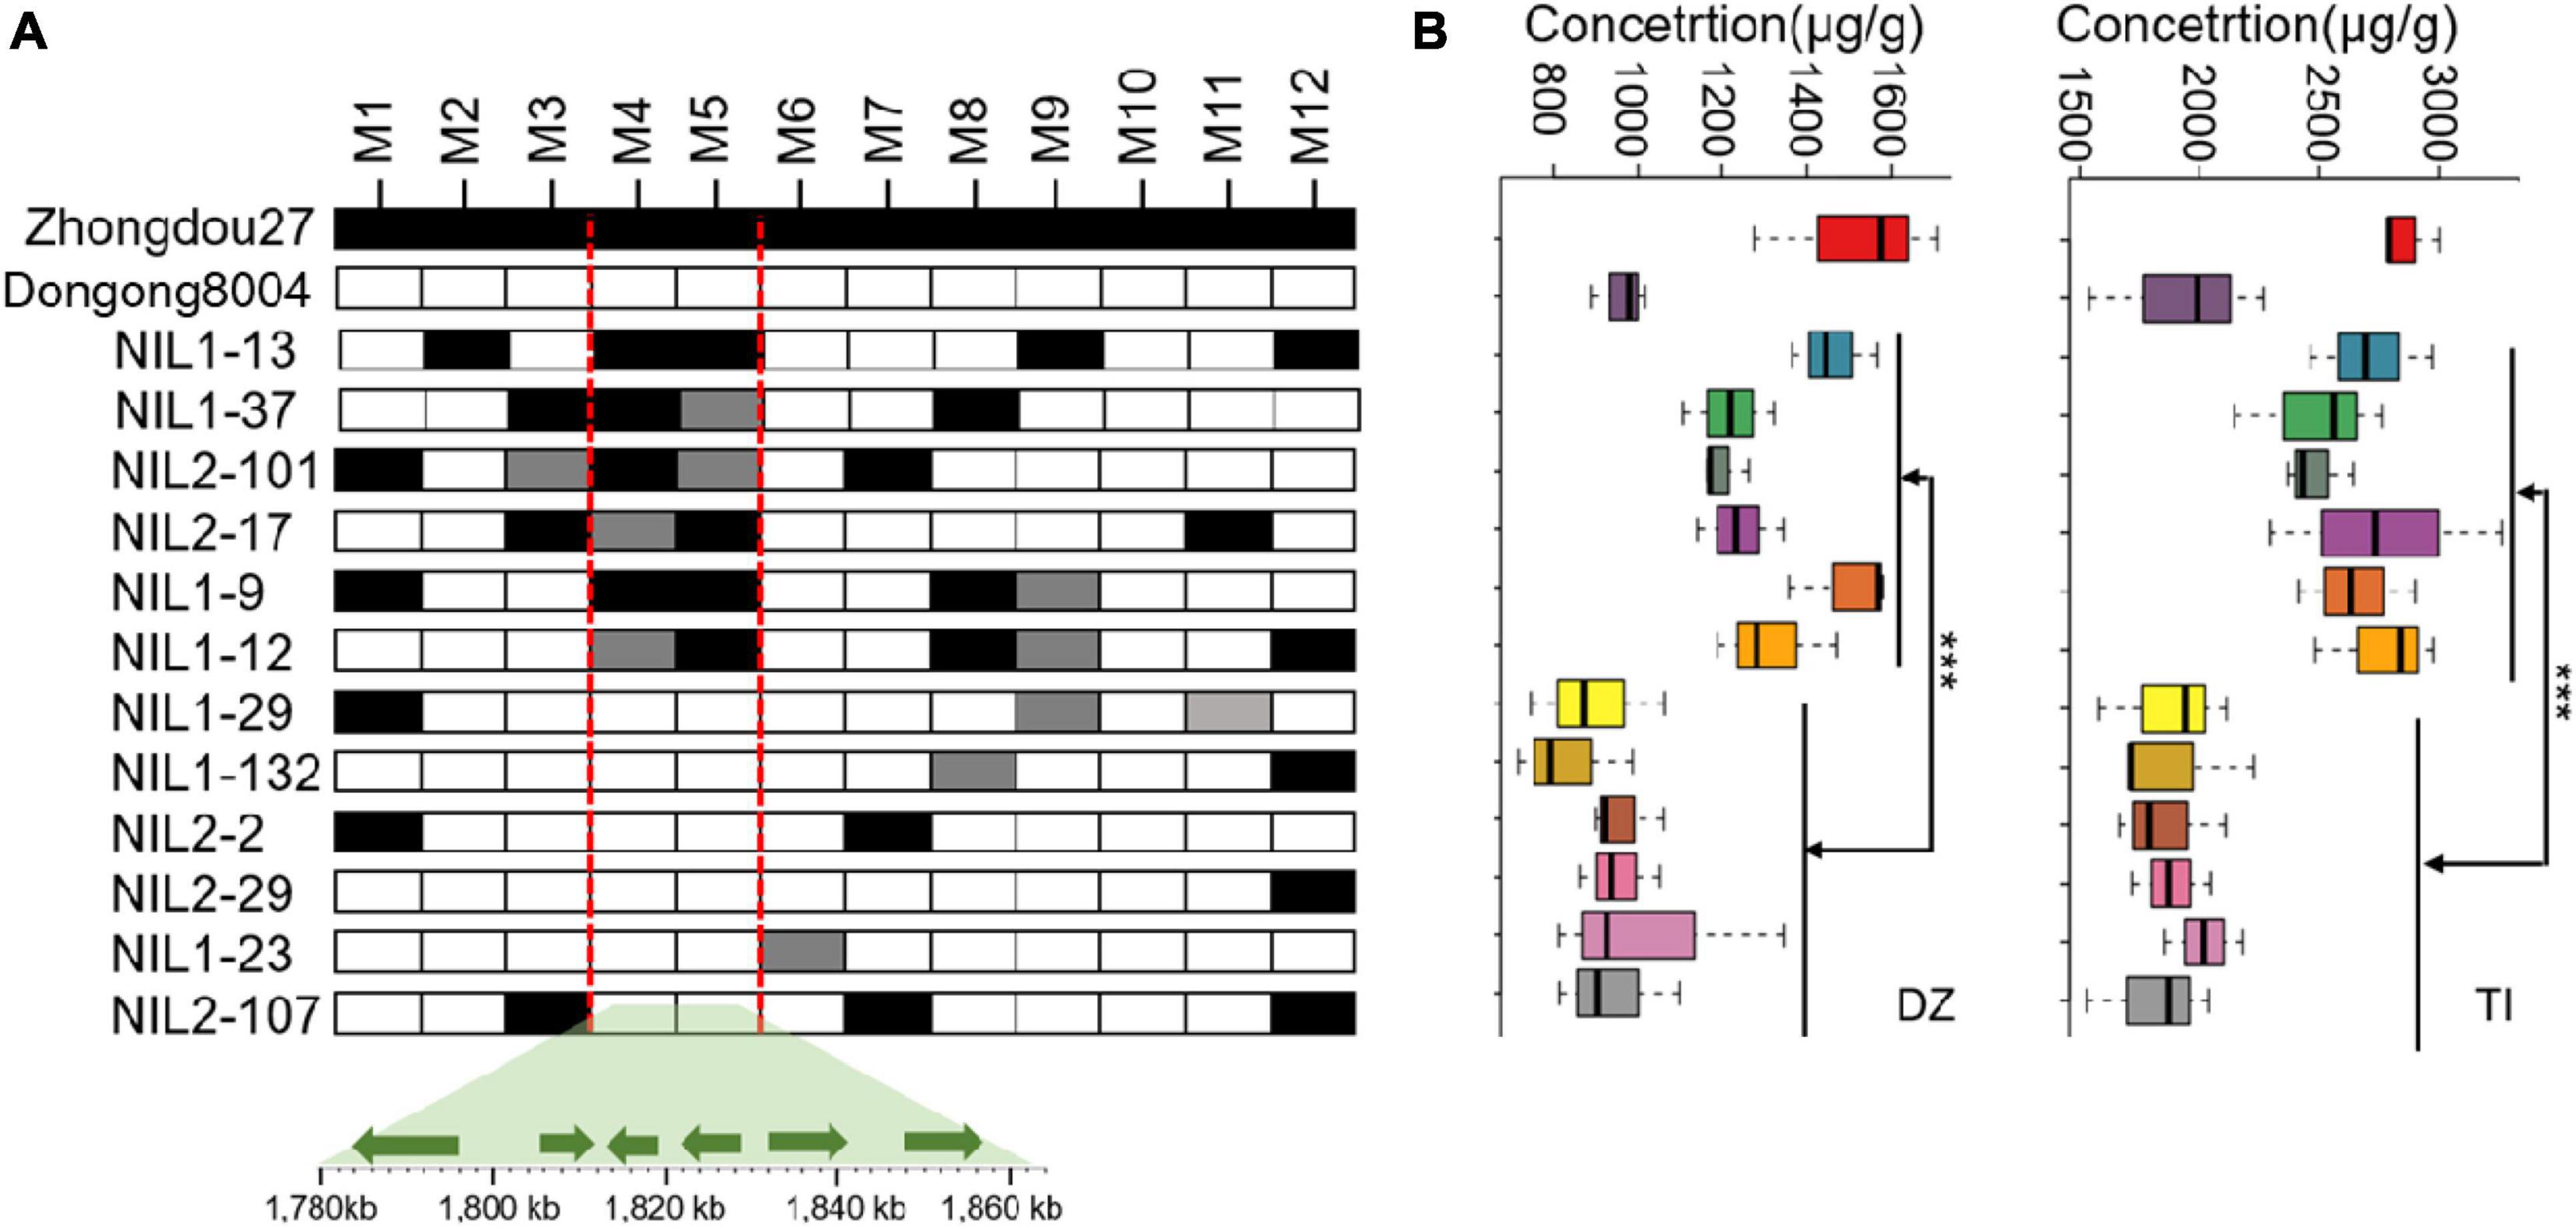
Figure 2. Refinement of the qISO19-1 region. (A) Restriction of qISO19-1 to a 62.8-kb region of chromosome 19 in the RIL population, and identification of recombinants based on 12 polymorphic markers. Black cells indicate alleles homozygous with the male parent (“Zhongdou27”); white cells indicate alleles homozygous with the female parent (“Dongnong8004”); gray cells indicate heterozygous alleles. Below are shown the positions of the six candidate genes in the qISO19-1 region, as indicated by comparisons to the reference genome. (B) Contents of daidzein (DZ) and total isoflavone (TI) in seeds produced by the recombinant lines. ***P < 0.001.
Relative expression levels of these five genes were quantified for 43 soybean germplasms: 20 germplasms with high isoflavone content (3709—5970 μg/g) and 23 germplasms with low isoflavone content (1263—2042 μg/g) (Supplementary Table 1). Four genes, Glyma.19G017200, Glyma.19G017300, Glyma.19G017400, and Glyma.19G017500, were expressed in the seeds of all accessions during the late R6 stage (Supplementary Figure 4). Glyma.19G017700 was expressed at a relatively low level in 30 accessions (Supplementary Figure 4). The relative expression level of Glyma.19G017500 was significantly positively correlated with isoflavone content in the seeds of all accessions (Supplementary Table 8). Thus, we considered Glyma.19G017500, which is a methyltransferase (MT), a candidate gene at the qISO19-1 locus. This gene was named GmMT1.
The full-length coding sequence (CDS) of GmMT1 (Glyma.19G017500) from the high-isoflavone cultivar “Zhongdou27” was 957 bp long; this sequence was 99.16% consistent with the reference genome (G. max Williams 82; Schmutz et al., 2010; Supplementary Figure 5a). GmMT1 encoded a putative protein composed of 318 amino acid with a predicted molecular mass of 35.16 kDa. This protein harbored all 20 amino acids, with the most abundant being leucine and least abundant being tryptophan. The calculated instability and aliphatic indexes of this protein were 51.94 and 89.47, respectively, suggesting that the protein was unstable. The predicted 3-D structure suggested that GmMT1 encoded an m2 G966 specific 16S rRNA methyltransferase (Lesnyak et al., 2007; Supplementary Figure 5b). Using the Phytozome database (Goodstein et al., 2012), we identified a second copy of GmMT1 on chromosome 13 (Glyma.13G066900); the amino acid sequence putatively encoded by this copy was 82.15% homologous with GmMT1 (Supplementary Figure 6). Phylogenetic analysis of GmMT1 and several other plant methyltransferases indicated that GmMT1 formed a well-supported clade with the methyltransferases of Phaseolus vulgaris, Medicago truncatula, and Trifolium pratense (Supplementary Figure 5c), suggesting that the functions of MT1 may be conserved across leguminous plants.
At developmental stage R7, GmMT1 was significantly upregulated in the seeds of the high-isoflavone cultivar “Zhongdou27” as compared to the seeds of the low-isoflavone cultivar “Dongnong8004” (Figure 3A). At all other developmental stages tested, GmMT1 expression level did not differ between cultivars. However, the stark difference in GmMT1 expression at stage R7 suggested that this gene may participate in isoflavone accumulation in soybean seeds. GmMT1 expression was also induced in the high-isoflavone cultivar “Zhongdou27” in response to salt and drought stress (Figures 3B,C). In both cases, GmMT1 was significantly upregulated at 12 h after stress initiation in comparison to the control group (Figures 3B,C).
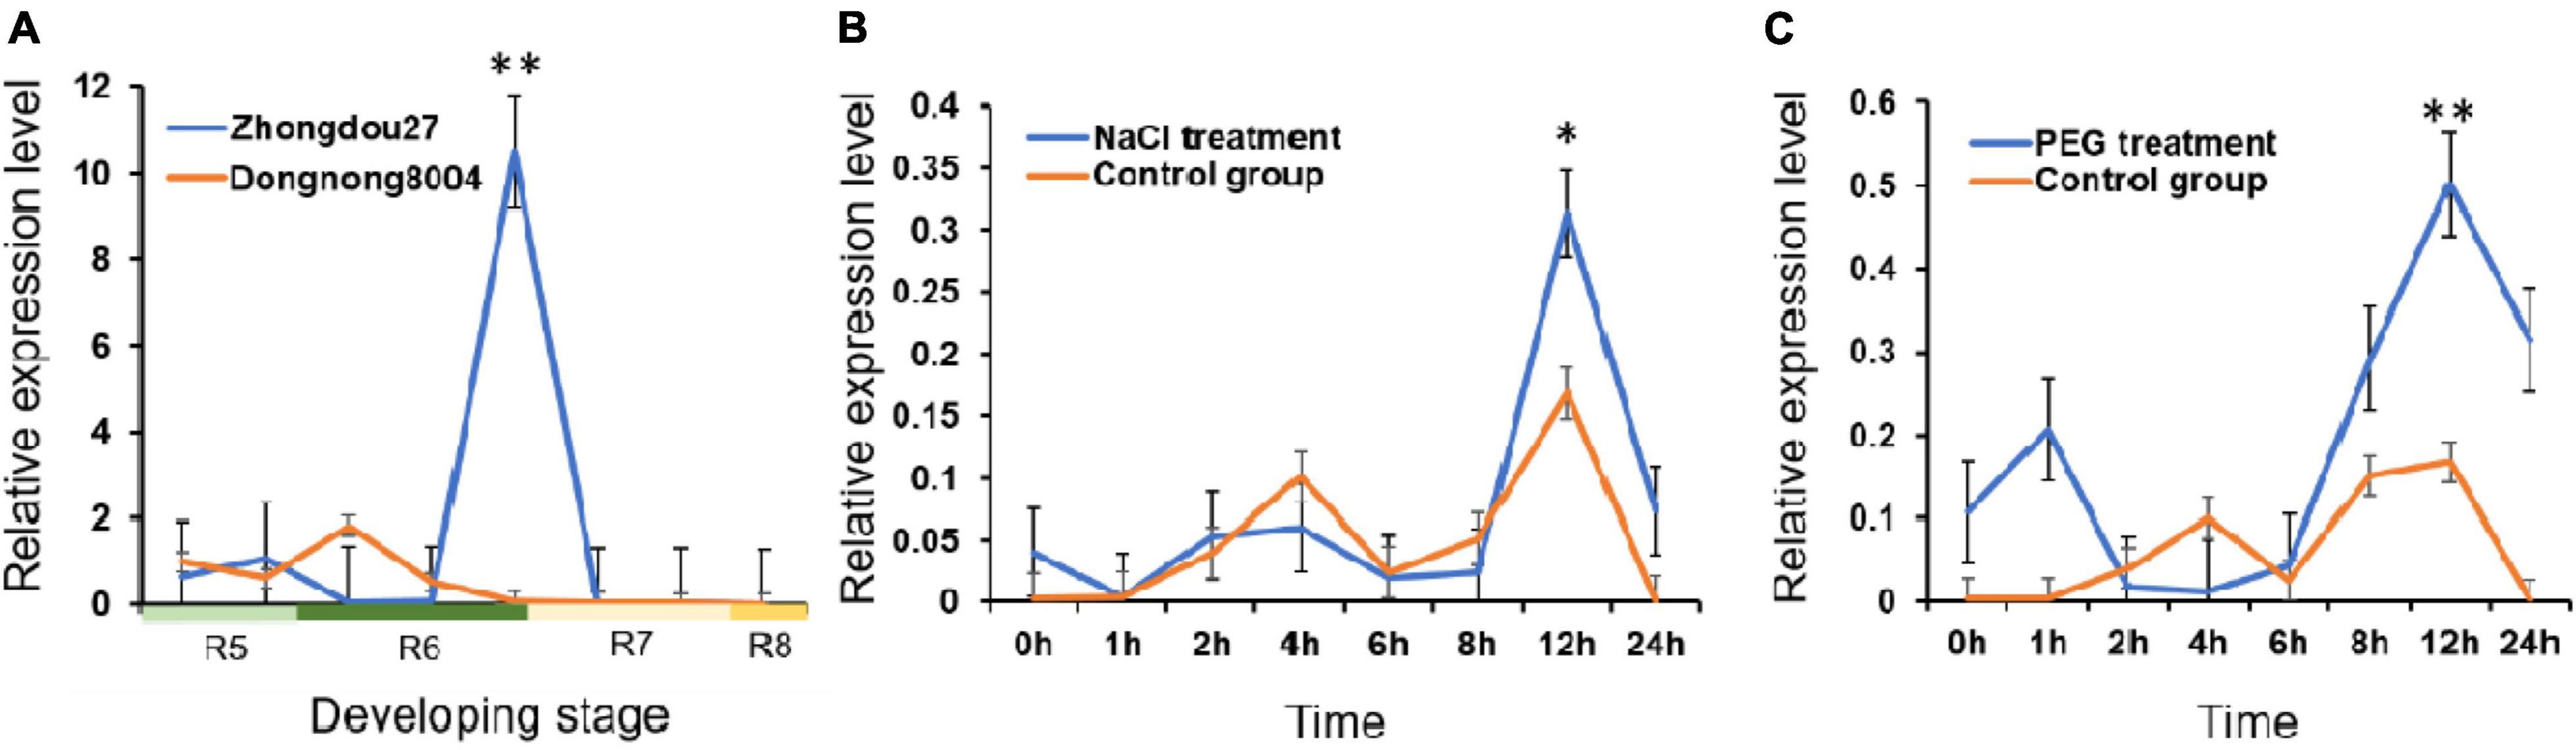
Figure 3. The expression patterns of GmMT1 in soybeans. (A) Relative expression of GmMT1 in the seeds of the high-isoflavone cultivar “Zhongdou27” and low-isoflavone cultivar “Dongnong8004” during development. Seeds were sampled every 7 days from the start of stage R5 to the end of stage R8. (B,C) Expression of GmMT1 in soybean leaves in response to panels (B) salt and (C) drought stress. Time represents the hours after stress initiation. n = 3 samples per stage or time point. “**” and “*” indicate P < 0.01 and P < 0.05 based on Student’s two-tailed t-test.
We expressed the green fluorescent protein (GFP) and the GmMT1-GFP fusion protein, both under the control of the 35S promoter, in separate Arabidopsis protoplasts. In protoplasts carrying 35S:GFP, GFP signal was dispersed throughout the cell (Figure 4). However, in protoplasts carrying 35S:GmMT1-GFP, the GFP signal was primarily observed in the chloroplasts (Figure 4), indicating that GmMT1 was a chloroplast-localized protein.
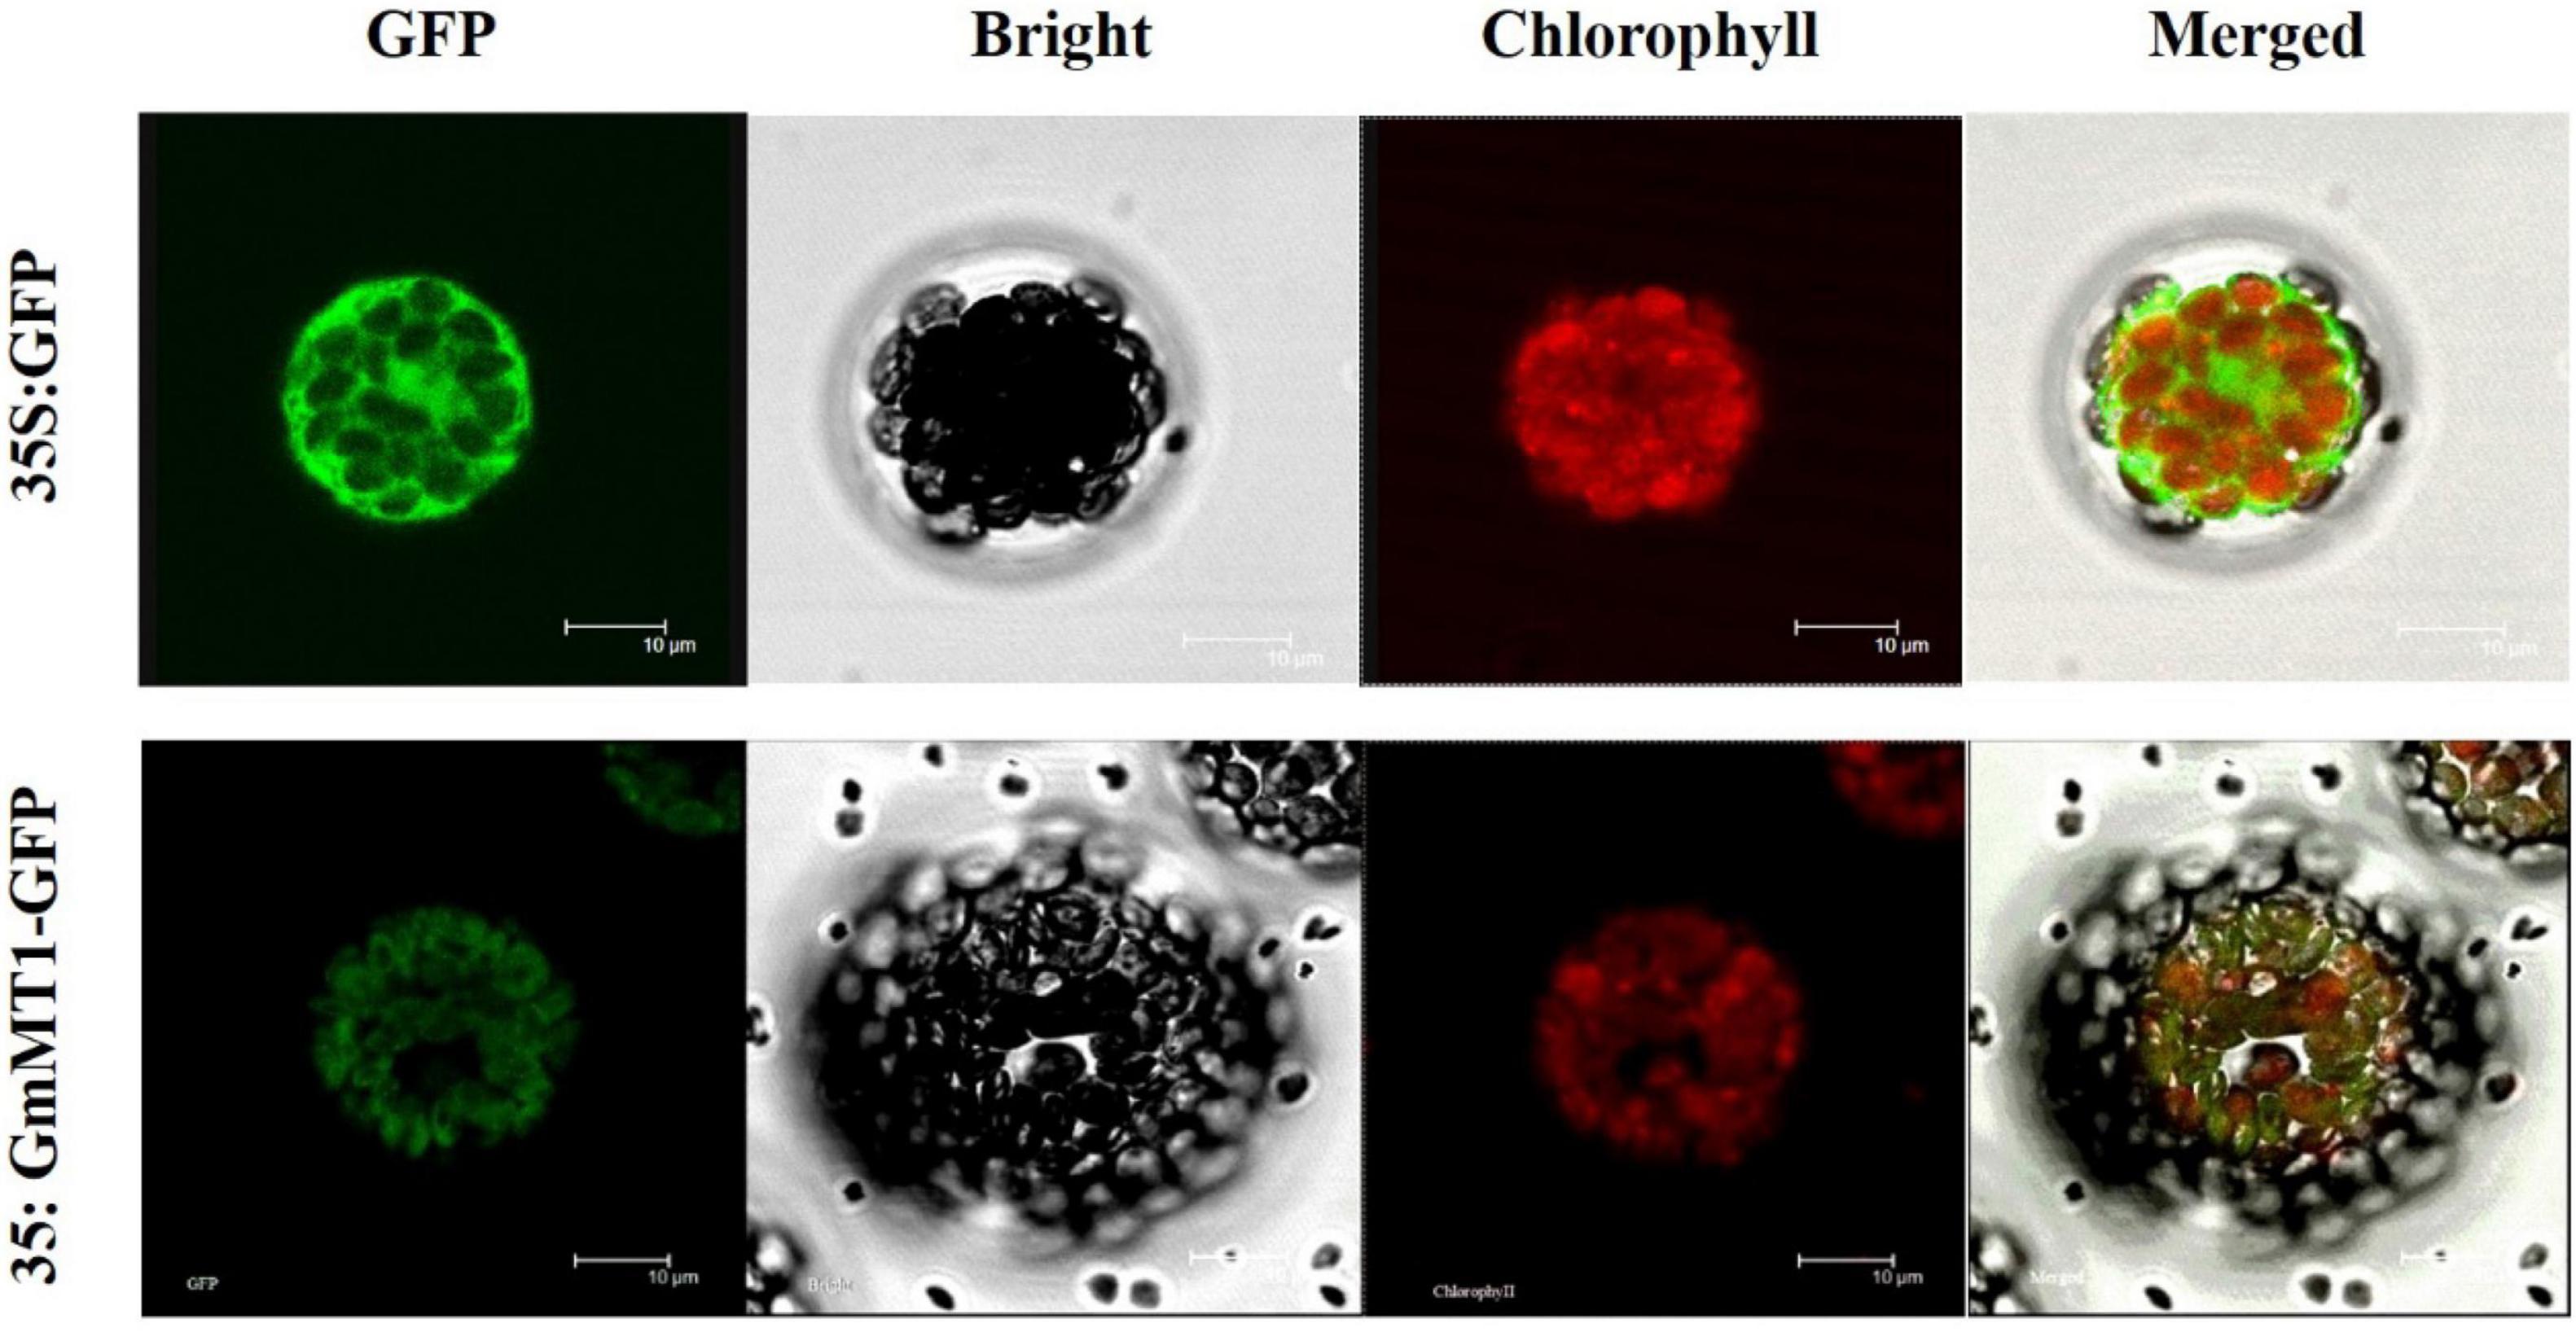
Figure 4. Sub-cellular localization of the GmMT1 protein in Arabidopsis protoplasts. GmMT1-GFP expression was driven by the cauliflower mosaic virus 35S promoter and transiently expressed in Arabidopsis protoplasts. The images shown are GFP fluorescence (green) only, bright-field, chlorophyll auto-fluorescence (red) only, and combined. Scale bars = 10 μm.
We used Agrobacterium rhizogenes-mediated transformation to overexpress GmMT1 in the hairy roots of soybean cultivar “Donong50,” a low-isoflavone cultivar. In the hairy roots overexpressing GmMT1 (Supplementary Figures 7a,b), total isoflavone concentrations were significantly greater than in the wild-type hairy roots (Supplementary Figure 7c).
We then used Agrobacterium tumefaciens-mediated transformation to co-overexpress GmMT1 and the selection marker gene bar in “Dongnong50,” a low-isoflavone cultivar that is also an excellent transgenic receptor, to generate three independent T2 transgenic soybean lines (Figure 5A). In the seeds of the T2 transgenic lines, GmMT1 was significantly upregulated as compared to non-transgenic “Dongnong50” (Figure 5B), and western blots confirmed the expression of the bar protein in the transgenic plants (Figure 5C). Isoflavone contents in the seeds of the GmMT1-overexpressing T2 transgenic lines were significantly greater than isoflavone contents in the seeds of the wild-type plants (increases of nearly 3.0-fold; Figure 5D). Thus, our results suggested that GmMT1 expression might be associated with isoflavone biosynthesis in both soybeans and Arabidopsis.
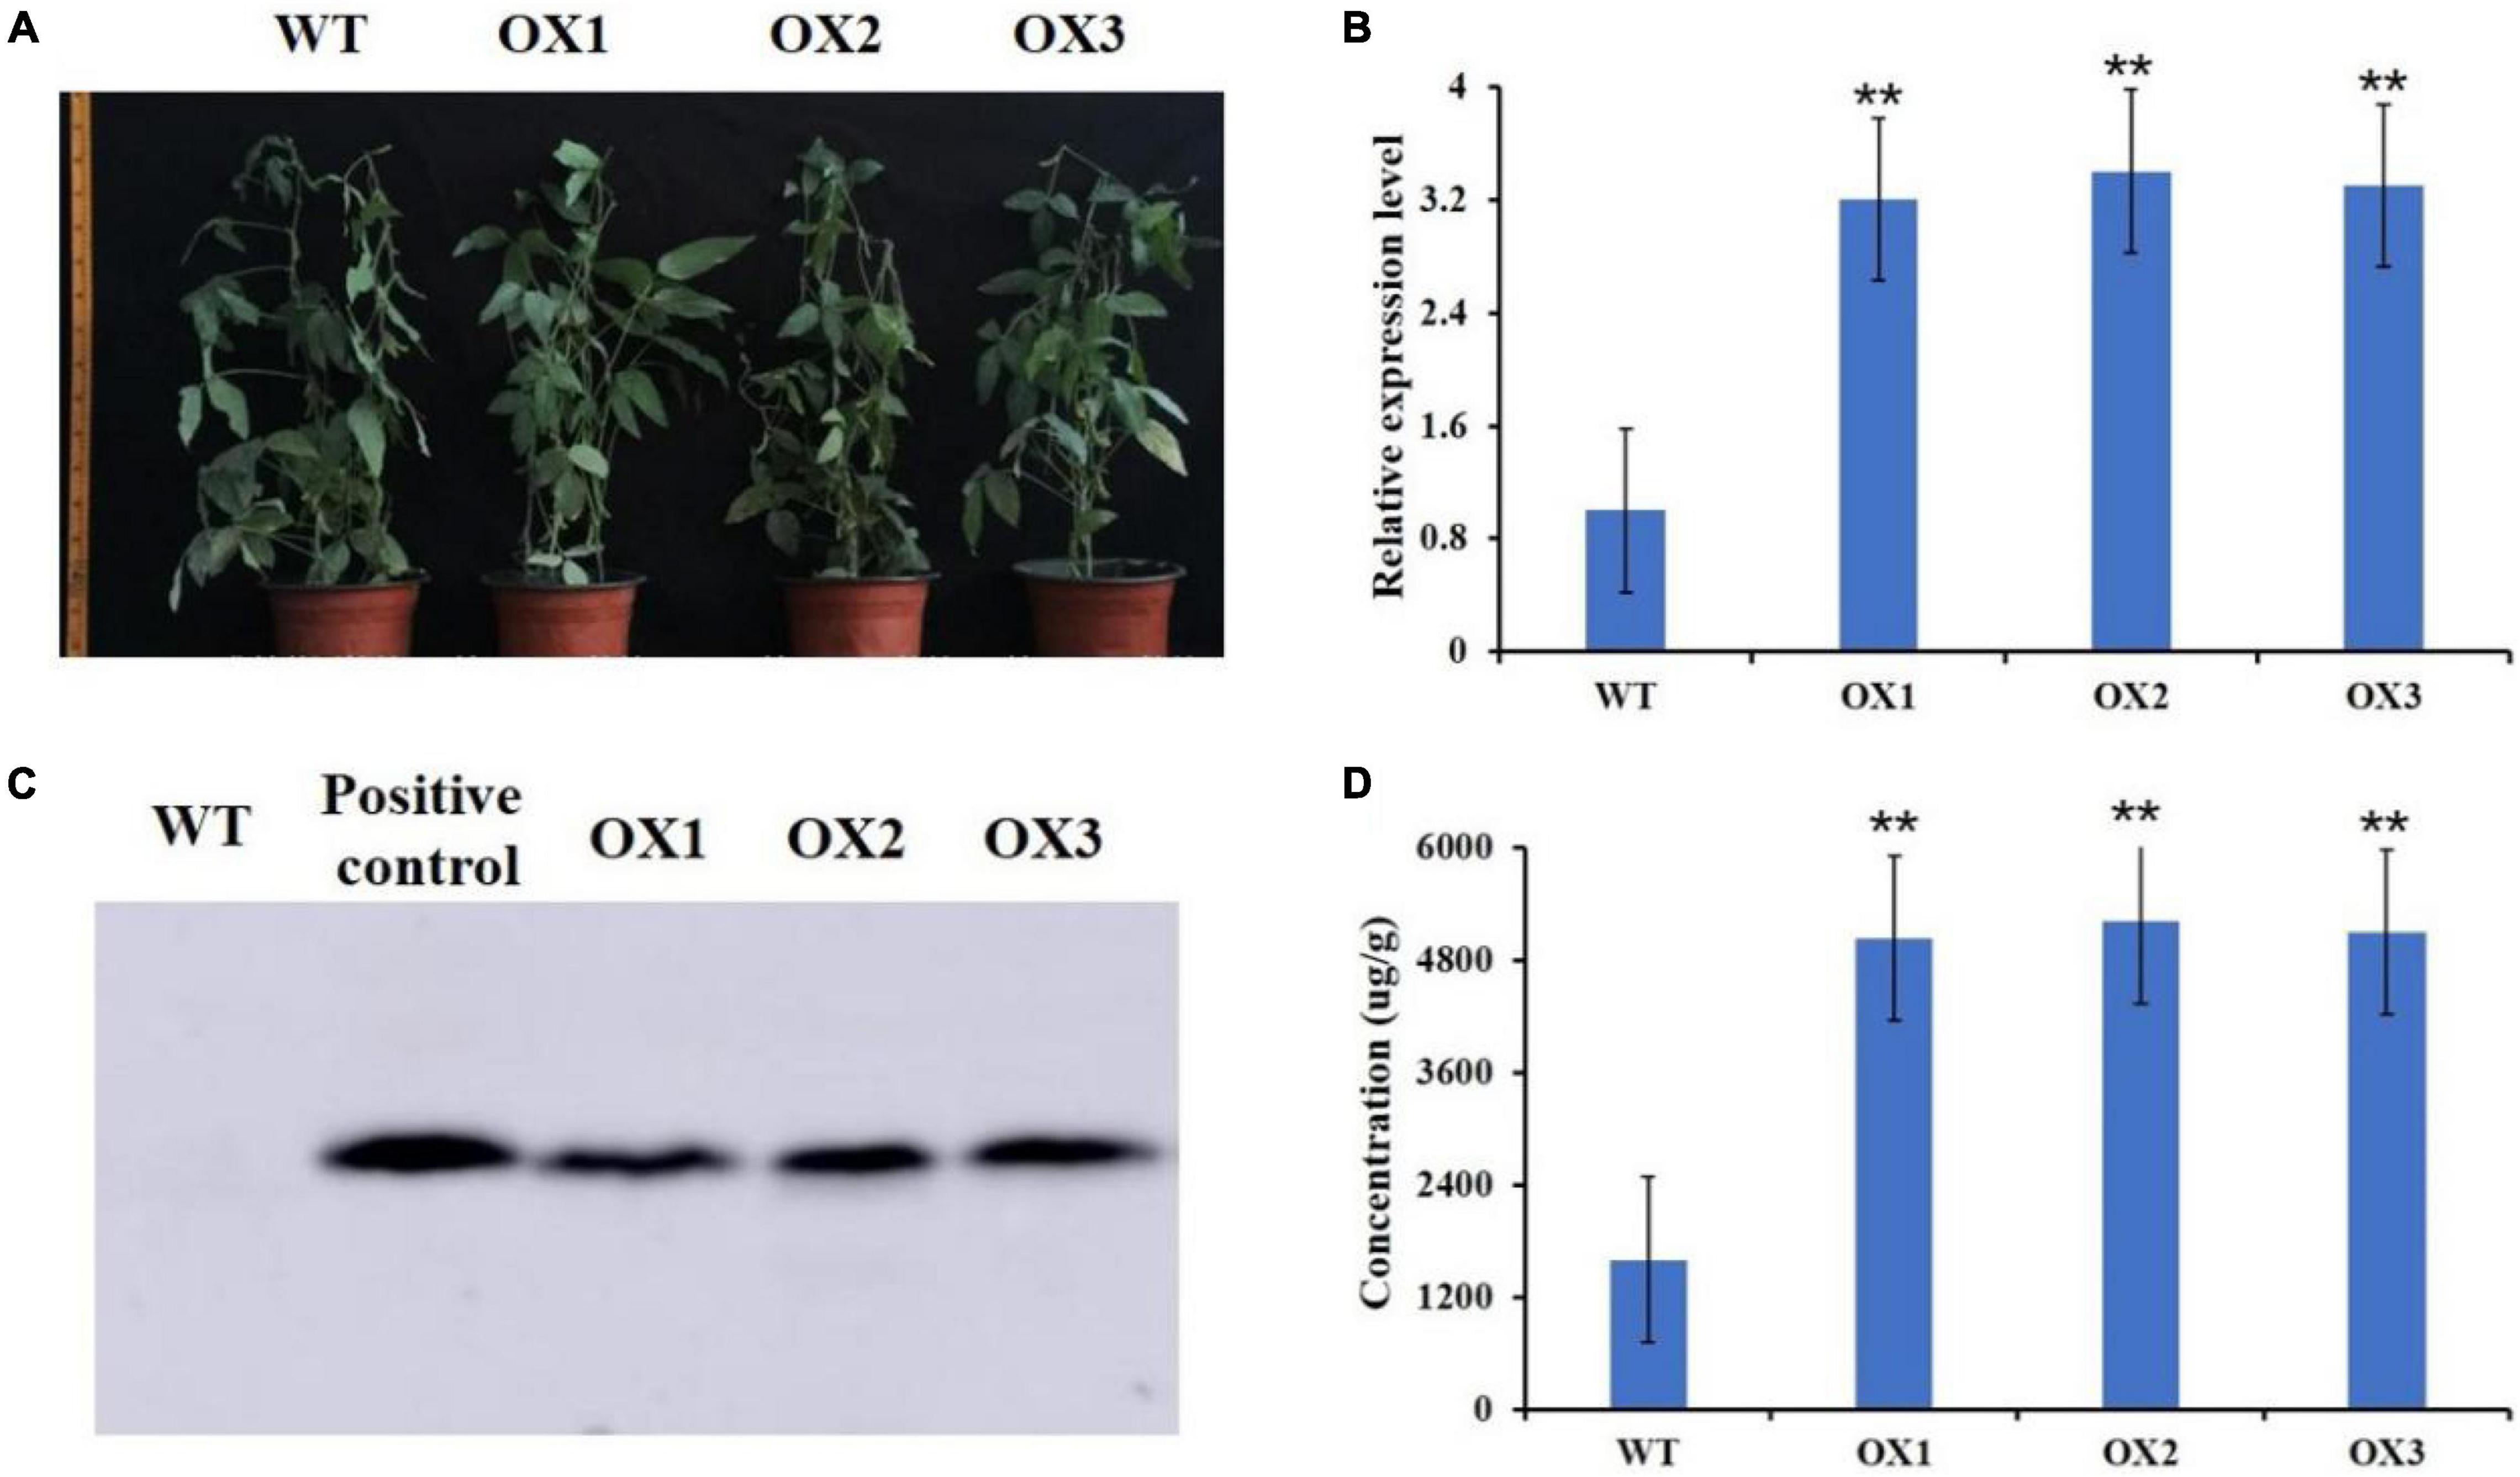
Figure 5. Overexpression GmMT1 in the soybean cultivar “Dongnong50” (WT). (A) WT Dongnong plants and T2 transgenic plants overexpressing GmMT1 (OX1–3). (B) Relative GmMT1 expression in WT and T2 transgenic plants. (C) Western blot showing the expression of the bar protein in the transgenic soybean plants. (D) Isoflavone contents in the seeds produced by the WT and transgenic soybean cultivars. ** indicates a significant difference between WT and transgenic soybean plants (P < 0.01, Student’s t-test. Error bars represent the standard error, n = 3).
Using Agrobacterium-mediated transformation, we overexpressed GmMT1 in wild-type Arabidopsis thaliana Columbia-0 (Col-0) and in A. thaliana mt1, a mutant strain in which the Arabidopsis homolog of GmMT1 (At3G28460) was silenced, to generate GmMT1-ox and of GmMT1-ox mt1; three independent T3 lines of each transgenic strain were generated (Supplementary Figures 8a–c). Under control conditions, germination rate did not differ among wild-type (Col-0), mt1 mutant, and T3 transgenic (GmMT1-ox and GmMT1-ox mt1) Arabidopsis seeds (Figures 6A,B). When exposed to salt or drought stress, seed germination rate in the wild-type and the mt1 mutant decreased significantly (Figures 6A,B). In the GmMT1-ox plants, seed germination rate decreased in response to both salt and drought stress (significantly in the latter case), but remained significantly greater than those in stressed non-GmMT1-overexpressing plants (Figures 6A,B). In contrast, in GmMT1-ox mt1 plants, seed germination rates decreased significantly in response to both salt and drought stress, and seed germination was significantly greater than stressed non-GmMT1-overexpressing plants after salt stress, but not drought stress (Figures 6A,B). Root growth measurements returned similar results to the seed germination assays. That is, after salt or drought stress, the roots of transgenic wild-type and mt1 Arabidopsis plants were longer than those of plants not overexpressing GmMT1 (Figures 6C,D).
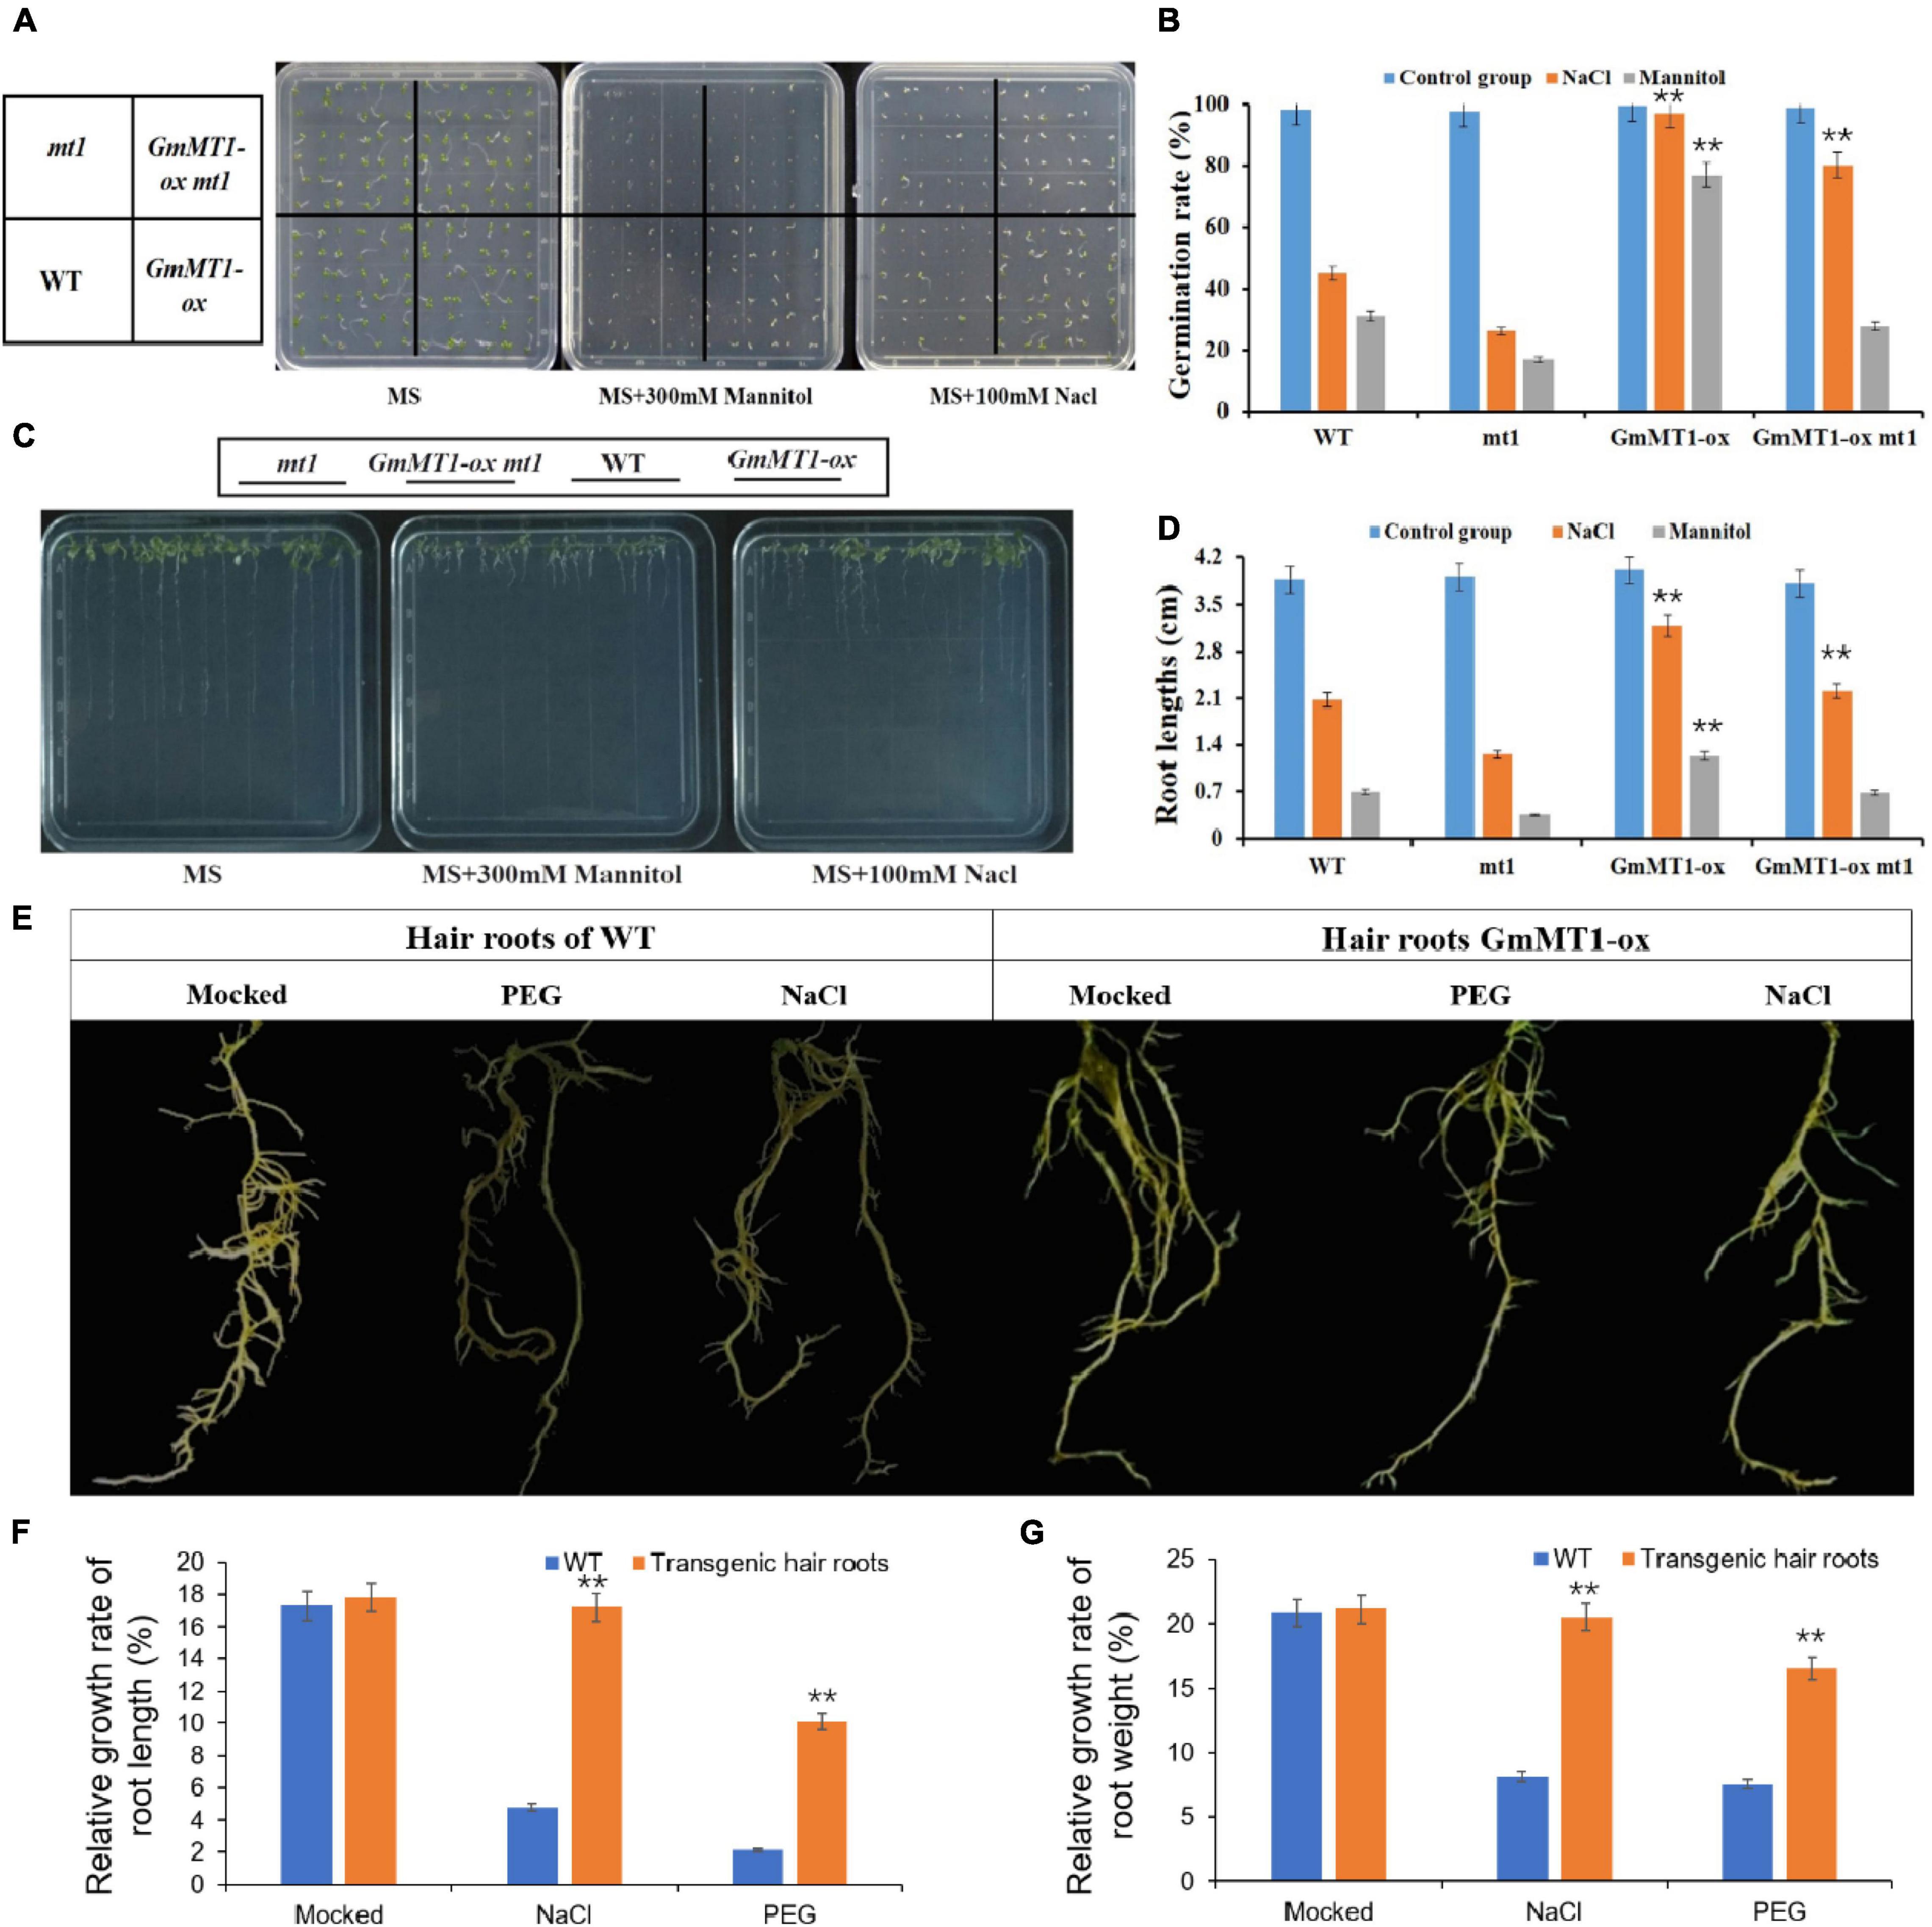
Figure 6. Effects of GmMT1 overexpression on Arabidopsis and on soybean hairy roots after exposure to salt or drought stress. (A,B) Germination and (C,D) root growth of Arabidopsis Columbia-0 (WT), Arabidopsis mt1 (a mutant strain in which the Arabidopsis homolog ofGmMT1, At3G28460, is silenced), and two T3 transgenic lines overexpressing GmMT1 (GmMT1-ox and GmMT1-ox mt1) after exposure to salt (100 mM NaCl) or drought (300 mM mannitol) stress. (E) Phenotypic differences in hairy roots of transgenic and non-transgenic soybeans after exposure to salt (NaCl) or drought (PEG) stress. (F,G) Relative rates of increase in panels (F) root length and (G) root weight for non-transgenic “Dongnong50” soybeans (WT) and transgenic soybeans overexpressing GmMT1 after exposure to salt (NaCl) or drought (PEG) stress. ** indicates a significant difference between WT and transgenic or between treatment and control groups (P < 0.01, Student’s t test). Error bars represent standard error (n = 3).
The relative growth rates of the hairy roots of low-isoflavone soybean cultivar Donong50 decreased significantly with respect to both length and weight after exposure to drought or salt stress (Figures 6E–G). However, the hairy roots of transgenic Donong50 overexpressing GmMT1 were significantly more tolerant of drought and salt stress (Figures 6E–G). Indeed, as compared to the non-transgenic cultivar, relative rates of root length and weight increase in the transgenic cultivar were respectively 12.13% and 11.78% greater after salt stress, and respectively 7.91% and 9.15% greater after drought stress (Figures 6E–G). Thus, GmMT1-driven increases in isoflavone concentrations might increase the resistance of plants to salt and drought stress.
Under control (uninfected) conditions, GmMT1 was significantly more highly expressed in the three transgenic Donong50 lines overexpressing GmMT1 than in the non-transgenic low-isoflavone soybean cultivar Donong50 (Figure 7A). Correspondingly, the symptoms of P. sojae infection, including watery and rotting lesions, were less obvious in the transgenic hairy roots as compared to the non-transgenic hairy roots after 2 weeks of treatment (Figure 7B). Thus, our results indicated that the overexpression of GmMT1 might increase the resistance of soybeans to P. sojae infection, and/or reduce the severity of the infection.
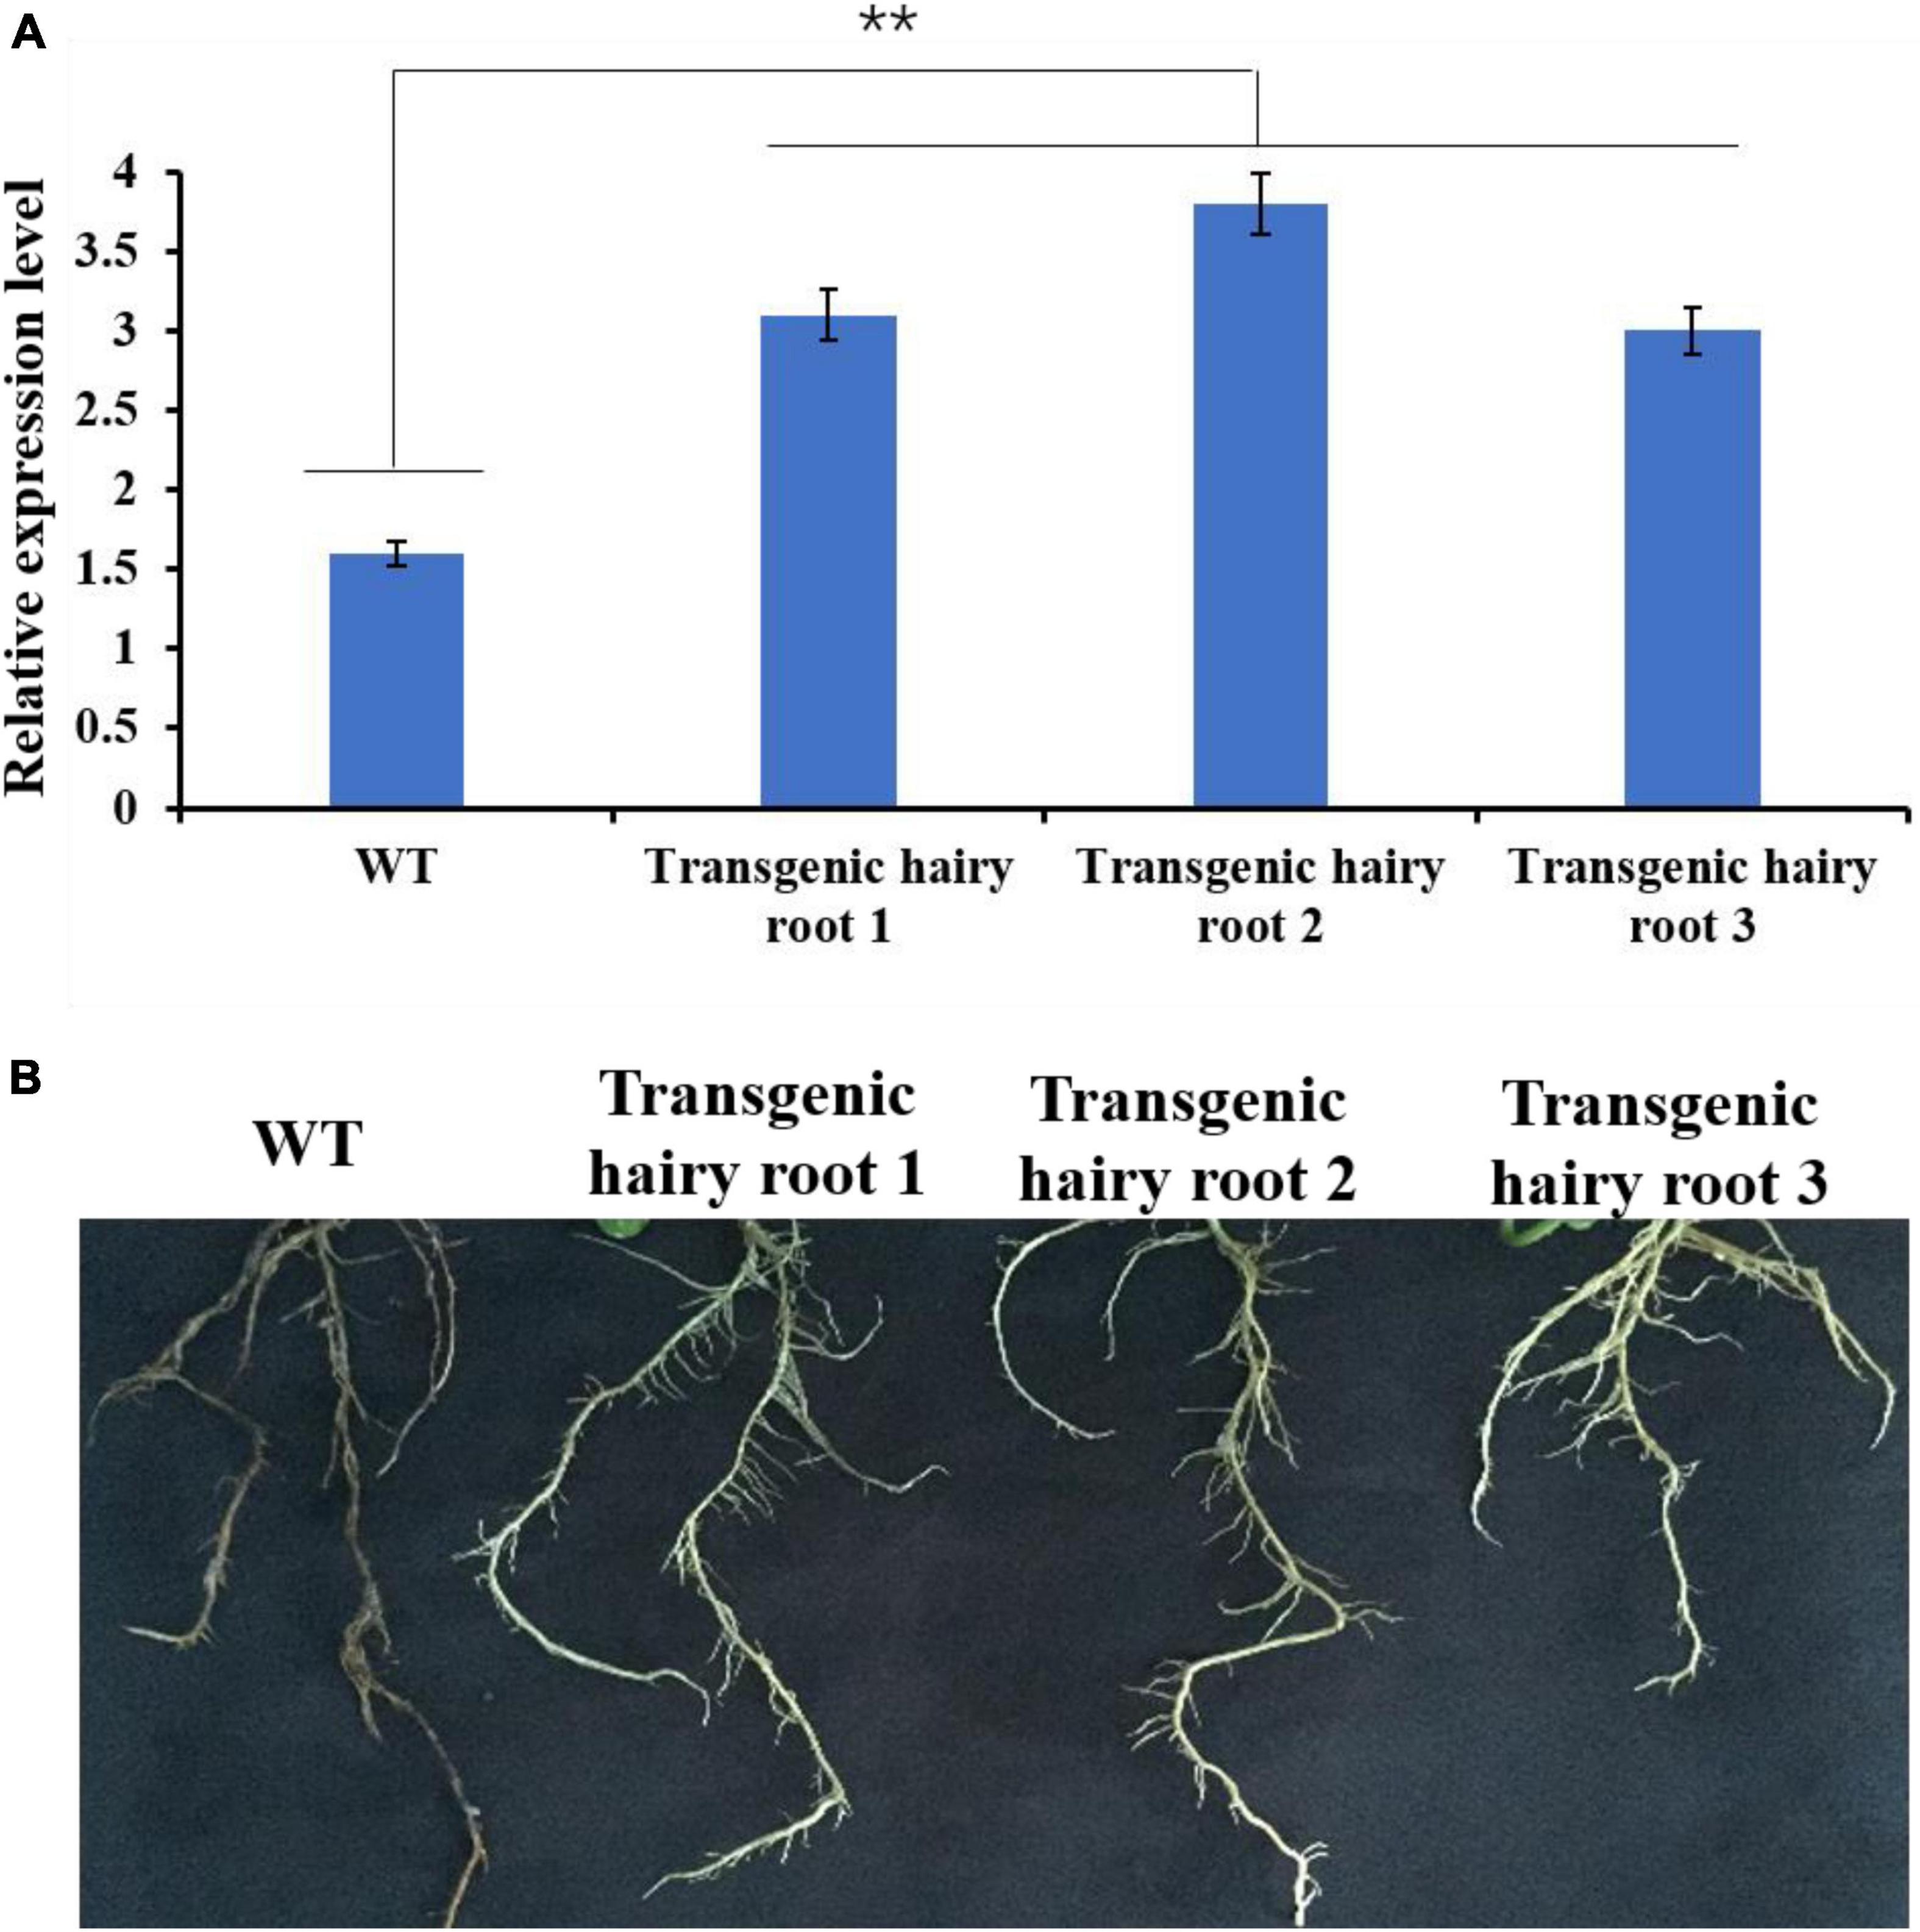
Figure 7. The effects of GmMT1 overexpression on Phytophthora sojae resistance. (A) The relative expression levels of GmMT1 in non-transgenic low-isoflavone soybean cultivar Donong50 (WT) and three transgenic Donong50 lines overexpressing GmMT1. ** indicates a significant difference between WT and transgenic hair roots (P < 0.01, Student’s t-test). (B) Phenotypic differences in hairy roots of transgenic and non-transgenic soybeans after P. sojae infection.
Quantitative trait loci mapping is the most common and effective method used to analyze agronomically important plant characteristics (Pulst, 1999; Rafalski, 2010). Soybean isoflavone content is a quantitative trait, controlled by multiple genes, which is easily affected by the environment (Zeng et al., 2009). Here, we identified 15 QTLs underlying soybean isoflavone content, of which three overlapped with previously reported QTLs in genomic regions. Of these three QTLs, qTI3-1 overlapped with the reported QTL “Seed isoflavone 4-2” associated with soybean isoflavone content (Liang et al., 2010); qTI8-1 occupied a similar genomic region to the reported QTL “Seed total isoflavone 9-1” (Wang et al., 2015); and qISO13-1 overlapped with the known QTL “qIF13-1” (Cai et al., 2018).
Using the 12 novel QTLs, we fine-mapped the important stable locus qIF19-1, and identified GmMT1 as a candidate gene associated with isoflavone content at this locus.
GmMT1 encodes an m2 G966-specific 16S rRNA methyltransferase, which falls into the S-adenosyl-L-methionine-dependent methyltransferase (SAM-Mtase) superfamily (Joshi and Chiang, 1998; Lesnyak et al., 2007; Zou et al., 2020). SAM-Mtases are key enzymes in many plant metabolic pathways, playing important roles in the biosynthesis of many plant products associated plant growth and development, as well as in the resistance to many biotic and abiotic stressors (Douglas, 1996; Ying et al., 1996; Song et al., 2009; Byeon et al., 2015; Nam et al., 2016; Choi et al., 2017; Niu et al., 2018; Zou et al., 2020). The m2 G966-specific 16S rRNA methyltransferases participate in specific methylation of the G966 base of 16S rRNA (Lesnyak et al., 2007). Recently, Zou et al. (2020) localized CMAL, a 16S rRNA methyltransferase, to the chloroplast, and showed that this protein was important for chloroplast ribosome biogenesis and plant development. However, few other studies of the biological functions of 16S rRNA methyltransferases are available.
Here, we fine-mapped and cloned a soybean methyltransferase gene, GmMT1, that was strongly associated with isoflavone accumulation in soybean seeds. Consistent with Zou et al. (2020), we localized GmMT1 to the chloroplast. Moreover, we found that the hairy roots of transgenic low-isoflavone soybean lines overexpressing GmMT1 had significantly greater isoflavone contents than the hairy roots of the same lines not overexpressing GmMT1, suggesting that GmMT1 may participate the isoflavone biosynthesis in soybeans. Additionally, we found that the heterologous expression of GmMT1 in Arabidopsis, both ecotype Col-0 and the mt1 mutant, increased isoflavone content relative to non-transgenic lines. This suggested that GmMT1 may regulate isoflavone biosynthesis in other plants as well as soybeans.
Previous studies have shown that isoflavone content may affect plant resistance to various abiotic stressors, including salt and drought (Caldwell et al., 2005; Wu et al., 2008; Gutierrez-Gonzalez et al., 2010). In addition, decreases in isoflavone content have been shown to weaken the resistance of soybeans to the pathogen P. sojae (Subramanian et al., 2005; Graham et al., 2007). Here, we found that transgenic soybean and Arabidopsis lines overexpressing GmMT1 not only contained higher levels of isoflavones than non-transgenic lines, but were less susceptible to salt and drought stress. This may be because isoflavones commonly exist as water-soluble glycosides (Pandey et al., 2014), which may play an important role in osmotic regulation under drought and salt stress (Pandey et al., 2014). In addition, when soybeans were infected with P. sojae, the hairy roots of the transgenic lines overexpressing GmMT1 exhibited milder symptoms of P. sojae infection than did the non-transgenic lines, supporting the association between soybean isoflavone content and P. sojae resistance. Similarly, Cheng et al. (2015) found that an isoflavone reductase gene, GmIFR, was related to soybean isoflavone content and P. sojae resistance. However, the functional effects of GmMT1 and GmIFR on soybean isoflavone content and P. sojae resistance differed. Unlike GmMT1, GmIFR expression decreased isoflavone content and increased P. sojae resistance.
Our results showed that GmMT1 participates in the regulation of isoflavone content in soybeans, and that biotic and abiotic stress resistance depend on isoflavone content, and, consequently, GmMT1 expression. However, further study of GmMT1 is required to better characterize the regulatory mechanisms underlying isoflavone accumulation, as well as the effects of isoflavone content on the stress responses of soybeans and other plants.
The original contributions presented in the study are included in the article/Supplementary Material, further inquiries can be directed to the corresponding author/s.
XZ and YH designed and supervised the research. RL, JZ, and DS conducted the experiment and analyzed the data. DW, ML, YZ, and WT conducted the field trial. XZ, YJ, YH, and WL wrote the manuscript. All authors read and approved the manuscript.
This study was financially supported by the National Key Research and Development Project of China (2021YFF1001204), the Chinese National Natural Science Foundation (31871650 and 31971967), the National Project (2014BAD22B01 and 2016ZX08004001-007), the Youth Leading Talent Project of the Ministry of Science and Technology in China (2015RA228), The National Ten-thousand Talents Program, The National Project (CARS-04-PS04), the Postdoctoral Foundation of Heilongjiang Province (LBH-Q20004).
The authors declare that the research was conducted in the absence of any commercial or financial relationships that could be construed as a potential conflict of interest.
All claims expressed in this article are solely those of the authors and do not necessarily represent those of their affiliated organizations, or those of the publisher, the editors and the reviewers. Any product that may be evaluated in this article, or claim that may be made by its manufacturer, is not guaranteed or endorsed by the publisher.
We thank LetPub (www.letpub.com) for its linguistic assistance and scientific consultation during the preparation of this manuscript.
The Supplementary Material for this article can be found online at: https://www.frontiersin.org/articles/10.3389/fpls.2022.865584/full#supplementary-material
Akond, M., Liu, S. M., Kantartzi, S. K., Meksem, K., Bellaloui, N., Lightfoot, D. A., et al. (2014). Quantitative trait loci for seed isoflavone contents in ‘MD96-5722’ by ‘Spencer’ recombinant inbred lines of soybean. J. Agric. Food Chem. 62, 1464–1468. doi: 10.1021/jf4040173
Aoki, T., Akashi, T., and Ayabe, S.-I. (2000). Flavonoids of leguminous plants: structure, biological activity, and biosynthesis. J. Plant Res. 113, 475–488. doi: 10.1007/PL00013958
Azam, M., Zhang, S. R., Abdelghany, A. M., Shaibu, A. S., Feng, Y., Li, Y. F., et al. (2020). Seed isoflavone profiling of 1168 soybean accessions from major growing ecoregions in China. Food Res. Int. 130:108957.
Bradbury, K. E., Appleby, P. N., and Key, T. J. (2014). Fruit, vegetable, and fiber intake in relation to cancer risk: findings from the European prospective investigation into cancer and nutrition (EPIC). Am. J. Clin. Nutr. 100, 394s–398s. doi: 10.3945/ajcn.113.071357
Byeon, Y., Choi, G. H., Lee, H. Y., and Back, K. (2015). Melatonin biosynthesis requires N-acetylserotonin methyltransferase activity of caffeic acid O-methyltransferase in rice. J. Exp. Bot. 66, 6917–6925. doi: 10.1093/jxb/erv396
Cai, Z., Cheng, Y., Ma, Z., Liu, X., Ma, Q., Xia, Q., et al. (2018). Fine-mapping of QTLs for individual and total isoflavone content in soybean (Glycine max L.) using a high-density genetic map. Theor. Appl. Genet. 131, 555–568. doi: 10.1007/s00122-017-3018-x
Caldwell, C. R., Britz, S. J., and Mirecki, R. M. (2005). Effect of temperature, elevated carbon dioxide, and drought during seed development on the isoflavone content of dwarf soybean [Glycine max (L.) Merrill] grown in controlled environments. J. Agric. Food Chem. 53, 1125–1129. doi: 10.1021/jf0355351
Cao, D., Hou, W. S., Song, S. K., Sun, H. B., Wu, C. X., Gao, Y. S., et al. (2009). Assessment of conditions affecting Agrobacterium rhizogenes-mediated transformation of soybean. Plant Cell Tissue Organ Cult. 96, 45–52. doi: 10.1007/s11240-008-9458-x
Cheng, Q., Li, N., Dong, L., Zhang, D., Fan, S., Jiang, L., et al. (2015). Overexpression of soybean isoflavone reductase (GmIFR) enhances resistance to phytophthora sojae in soybean. Front. Plant Sci. 6:1024. doi: 10.3389/fpls.2015.01024
Choi, G. H., Lee, H. Y., and Back, K. (2017). Chloroplast overexpression of rice caffeic acid O-methyltransferase increases melatonin production in chloroplasts via the 5-methoxytryptamine pathway in transgenic rice plants. J. Pineal Res. 63:e12412. doi: 10.1111/jpi.12412
Clough, S. J., and Bent, A. F. (1998). Floral dip: a simplified method for Agrobacterium-mediated transformation of Arabidopsis thaliana. Plant J. 16, 735–743. doi: 10.1046/j.1365-313x.1998.00343.x
Dixon, R. A., Achnine, L., Kota, P., Liu, C. J., Reddy, M. S., and Wang, L. (2002). The phenylpropanoid pathway and plant defence-a genomics perspective. Mol. Plant Pathol. 3, 371–390. doi: 10.1046/j.1364-3703.2002.00131.x
Douglas, C. J. (1996). Phenylpropanoid metabolism and lignin biosynthesis: from weeds to trees. Trends Plant Sci. 1, 171–178. doi: 10.1016/1360-1385(96)10019-4
Funaki, A., Waki, T., Noguchi, A., Kawai, Y., Yamashita, S., Takahashi, S., et al. (2015). Identification of a highly specific isoflavone 7-O-glucosyltransferase in the soybean (Glycine max (L.) Merr.). Plant Cell Physiol. 56, 1512–1520. doi: 10.1021/jf504778x
Goodstein, D. M., Shu, S., Russell, H., Rochak, N., Hayes, R. D., Joni, F., et al. (2012). Phytozome: a comparative platform for green plant genomics. Nuclc Acids Res. 40, D1178–D1186. doi: 10.1093/nar/gkr944
Graham, T. L., Graham, M. Y., Subramanian, S., and Yu, O. (2007). RNAi silencing of genes for elicitation or biosynthesis of 5-deoxyisoflavonoids suppresses race-specific resistance and hypersensitive cell death in Pytophthora sojae infected tissues. Plant Physiol. 144, 728–740. doi: 10.1104/pp.107.097865
Gutierrez-Gonzalez, J. J., Guttikonda, S. K., Tran, L. S. P., Aldrich, D. L., Zhong, R., Yu, O., et al. (2010). Differential expression of isoflavone biosynthetic genes in soybean during water deficits. Plant Cell Physiol. 51, 936–948. doi: 10.1093/pcp/pcq065
Gutierrez-Gonzalez, J. J., Vuong, T. D., Zhong, R., Yu, O., Lee, J. D., Shannon, G., et al. (2011). Major locus and other novel additive and epistatic loci involved in modulation of isoflavone concentration in soybean seeds. Theor. Appl. Genet. 123, 1375–1385. doi: 10.1007/s00122-011-1673-x
Hamayun, M., Hussain, A., Khan, S. A., Kim, H. Y., Khan, A. L., Waqas, M., et al. (2017). Gibberellins producing endophytic fungus porostereum spadiceum AGH786 rescues growth of salt affected soybean. Front. Microbiol. 8:686. doi: 10.3389/fmicb.2017.00686
Hoeck, J. A., Fehr, W. R., Murphy, P. A., and Welke, G. A. (2000). Influence of genotype and environment on isoflavone contents of soybean. Crop Sci. 40, 48–51. doi: 10.2135/cropsci2000.40148x
Jia, T., An, J., Liu, Z., Yu, B., and Chen, J. (2017). Salt stress induced soybean GmIFS1 expression and isoflavone accumulation and salt tolerance in transgenic soybean cotyledon hairy roots and tobacco. Plant Cell Tiss. Organ Cult. 128, 469–477. doi: 10.1007/s11240-016-1124-0
Joshi, C. P., and Chiang, V. L. (1998). Conserved sequence motifs in plant S-adenosyl-L-methionine-dependent methyltransferases. Plant Mol. Biol. 37, 663–674. doi: 10.1023/a:1006035210889
Kelley, L. A., Mezulis, S., Yates, C. M., Wass, M. N., and Sternberg, M. J. E. (2015). The Phyre2 web portal for protein modeling, prediction and analysis. Nat. Protoc. 10, 845–858. doi: 10.1038/nprot.2015.053
Kosambi, D. D. (1944). The estimation of map distance from recombination values. Ann. Eugen. 12, 172–175. doi: 10.1111/j.1469-1809.1943.tb02321.x
Lee, S. J., Yan, W. K., Ahn, J. K., and Chung, I. M. (2003). Effects of year, site, genotype and their interactions on various soybean isoflavones. Field Crops Res. 81, 181–192. doi: 10.1016/S0378-4290(02)00220-4
Lesnyak, D. V., Osipiuk, J., Skarina, T., Sergiev, P. V., Bogdanov, A. A., Edwards, A., et al. (2007). Methyltransferase that modifies guanine 966 of the 16 S rRNA – Functional identification and tertiary structure. J. Biol. Chem. 282, 5880–5887. doi: 10.1074/jbc.M608214200
Li, B., Tian, L., Zhang, J. Y., Huang, L., Han, F. X., Yan, S. R., et al. (2014). Construction of a high-density genetic map based on large-scale markers developed by specific length amplified fragment sequencing (SLAF-seq) and its application to QTL analysis for isoflavone content in Glycine max. BMC Genomics 15:1086. doi: 10.1186/1471-2164-15-1086
Li, R., Yu, C., Li, Y., Lam, T. W., Yiu, S. M., Kristiansen, K., et al. (2009). SOAP2: an improved ultrafast tool for short read alignment. Bioinformatics 25, 1966–1967. doi: 10.1093/bioinformatics/btp336
Liang, H.-Z., Wang, S.-F., Yu, Y.-L., Lian, Y., Wang, T.-F., Wei, Y.-L., et al. (2010). QTL mapping of isoflavone, oil and protein content in soybean. Sci. Agric. Sin. 9, 1108–1116. doi: 10.1016/S1671-2927(09)60197-8
Liu, D., Ma, C., Hong, W., Huang, L., Liu, M., Liu, H., et al. (2014). Construction and analysis of high-density linkage map using high-throughput sequencing data. PLoS One 9:e98855. doi: 10.1371/journal.pone.0098855
Livak, K. J., and Schmittgen, T. (2001). Analysis of relative gene expression data using real-time quantitative PCR and the 2-DDCt method. Methods 25, 402–408. doi: 10.1006/meth.2001.1262
Malloy, K. M., Wang, J. D., Clark, L. H., Fang, Z. W., Sun, W. C., Yin, Y. J., et al. (2018). Novasoy and genistein inhibit endometrial cancer cell proliferation through disruption of the AKT/mTOR and MAPK signaling pathways. Am. J. Transl. Res. 10, 784–795. doi: 10.1093/ajcn/nqy037
McKenna, A., Hanna, M., Banks, E., Sivachenko, A., Cibulskis, K., Kernytsky, A., et al. (2010). The Genome Analysis Toolkit: a MapReduce framework for analyzing next-generation DNA sequencing data. Genome Res. 20, 1297–1303. doi: 10.1101/gr.107524.110
Meng, F. L., Han, Y. P., Teng, W. L., Li, Y. G., and Li, W. B. (2011). QTL underlying the resistance to soybean aphid (Aphis glycines Matsumura) through isoflavone-mediated antibiosis in soybean cultivar ‘Zhongdou 27’. Theor. Appl. Genet. 123, 1459–1465. doi: 10.1007/s00122-011-1680-y
Meng, L., Li, H., Zhang, L., and Wang, J. (2015). QTL IciMapping: integrated software for genetic linkage map construction and quantitative trait locus mapping in biparental populations. Crop J. 3, 269–283. doi: 10.1016/j.cj.2015.01.001
Nam, K. H., Kim, D. Y., Pack, I. S., Park, J. H., Seo, J. S., Do Choi, Y., et al. (2016). Comparative analysis of chemical compositions between non-transgenic soybean seeds and those from plants over-expressing AtJMT, the gene for jasmonic acid carboxyl methyltransferase. Food Chem. 196, 236–241. doi: 10.1016/j.foodchem.2015.09.046
Nielsen, I. L. F., and Williamson, G. (2007). Review of the factors affecting bioavailability of soy isoflavones in humans. Nutr. Cancer 57, 1–10. doi: 10.1080/01635580701267677
Niu, G. L., Gou, W., Han, X. L., Qin, C., Zhang, L. X., Abomohra, A., et al. (2018). Cloning and functional analysis of phosphoethanolamine methyltransferase promoter from Maize (Zea mays L.). Int. J. Mol. Sci. 19:191. doi: 10.3390/ijms19010191
Oldach, K. H., Peck, D. M., Nair, R. M., Sokolova, M., Harris, J., Bogacki, P., et al. (2014). Genetic analysis of tolerance to the root lesion nematode Pratylenchus neglectus in the legume Medicago littoralis. BMC Plant Biol. 14:100. doi: 10.1186/1471-2229-14-100
Pandey, A., Misra, P., Khan, M. P., Swarnkar, G., Tewari, M. C., Bhambhani, S., et al. (2014). Co-expression of Arabidopsis transcription factor, AtMYB12, and soybean isoflavone synthase, GmIFS1, genes in tobacco leads to enhanced biosynthesis of isoflavones and flavonols resulting in osteoprotective activity. Plant Biotechnol. J. 12, 69–80.
Paz, M. M., Shou, H. X., Guo, Z. B., Zhang, Z. Y., Banerjee, A. K., and Wang, K. (2004). Assessment of conditions affecting Agrobacterium-mediated soybean transformation using the cotyledonary node explant. Euphytica 136, 167–179. doi: 10.1023/B:EUPH.0000030669.75809.dc
Pei, R. L., Zhang, J. Y., Tian, L., Zhang, S. R., Han, F. X., Yan, S. R., et al. (2018). Identification of novel QTL associated with soybean isoflavone content. Crop J. 6, 244–252. doi: 10.1016/j.cj.2017.10.004
Primomo, V. S., Poysa, V., Ablett, G. R., Jackson, C. J., Gijzen, M., and Rajcan, I. (2005). Mapping QTL for individual and total isoflavone content in soybean seeds. Crop Sci. 45, 2454–2464. doi: 10.2135/cropsci2004.0672
Pulst, S. M. (1999). Genetic linkage analysis. Arch. Neurol. 56, 667–672. doi: 10.1001/archneur.56.6.667
Qi, X., Li, M. W., Xie, M., Liu, X., Ni, M., Shao, G., et al. (2014). Identification of a novel salt tolerance gene in wild soybean by whole-genome sequencing. Nat. Commun. 5:4340. doi: 10.1038/ncomms5340
Rafalski, J. A. (2010). Association genetics in crop improvement. Curr. Opin. Plant. Biol. 13, 174–180. doi: 10.1016/j.pbi.2009.12.004
Schmutz, J., Cannon, S. B., Schlueter, J., Ma, J., Mitros, T., Nelson, W., et al. (2010). Erratum: genome sequence of the palaeopolyploid soybean. Nature 465, 120–120. doi: 10.1038/nature08957
Song, J. T., Koo, Y. J., Park, J. B., Seo, Y. J., Cho, Y. J., Seo, H. S., et al. (2009). The expression patterns of AtBSMT1 and AtSAGT1 encoding a salicylic acid (SA) methyltransferase and a SA glucosyltransferase, respectively, in Arabidopsis plants with altered defense responses. Mol. Cells 28, 105–109. doi: 10.1007/s10059-009-0108-x
Spagnuolo, C., Russo, G. L., Orhan, I. E., Habtemariam, S., Daglia, M., Sureda, A., et al. (2015). Genistein and cancer: current status, challenges, and future directions. Adv. Nutr. 6, 408–419. doi: 10.3945/an.114.008052
Subramanian, S., Graham, M. Y., Yu, O., and Graham, T. L. (2005). RNA interference of soybean isoflavone synthase genes leads to silencing in tissues distal to the transformation site and to enhanced susceptibility to Phytophthora sojae. Plant Physiol. 137, 1345–1353. doi: 10.1104/pp.104.057257
Sugiyama, A., Yamazaki, Y., Hamamoto, S., Takase, H., and Yazaki, K. (2017). Synthesis and secretion of isoflavones by field-grown soybean. Plant Cell Physiol. 58, 1594–1600. doi: 10.1093/pcp/pcx084
Tamura, K., Peterson, D., Peterson, N., Stecher, G., Nei, M., and Kumar, S. (2011). MEGA5: molecular evolutionary genetics analysis using maximum likelihood, evolutionary distance, and maximum parsimony methods. Mol. Biol. Evol. 28, 2731–2739. doi: 10.1093/molbev/msr121
Vyn, T. J., Xinhua, Y., Bruulsema, T. W., Jackson, C. J. C., Istvan, R., and Brouder, S. M. (2002). Potassium fertilization effects on isoflavone concentrations in soybean [Glycine max (L.) Merr.]. J. Agric. Food Chem. 50, 3501–3506. doi: 10.1021/jf0200671
Wahajuddin Taneja, I., Arora, S., Raju, K. S. R., and Siddiqui, N. (2013). Disposition of pharmacologically active dietary isoflavones in biological systems. Curr. Drug Metab. 14, 369–380. doi: 10.2174/1389200211314040002
Wang, Y., Han, Y., Zhao, X., Li, Y., Teng, W., Li, D., et al. (2015). Mapping isoflavone QTL with main, epistatic and QTL x environment effects in recombinant inbred lines of soybean. PLoS One 10:e0118447. doi: 10.1371/journal.pone.0118447
Wu, W., Zhang, Q., Zhu, Y. M., Lam, H. M., Cai, Z. W., and Guo, D. J. (2008). Comparative metabolic profiling reveals secondary metabolites correlated with soybean salt tolerance. J. Agric. Food Chem. 56, 11132–11138. doi: 10.1021/jf8024024
Ying, Z., Janney, N., and Houtz, R. L. (1996). Organization and characterization of the ribulose-1,5-bisphosphate carboxylase/oxygenase large subunit εN-methyltransferase gene in tobacco. Plant Mol. Biol. 32, 663–671. doi: 10.1007/BF00020207
Yoo, S. D., Cho, Y. H., and Sheen, J. (2007). Arabidopsis mesophyll protoplasts: a versatile cell system for transient gene expression analysis. Nat. Protoc. 2, 1565–1572. doi: 10.1038/nprot.2007.199
Zeng, G., Li, D., Han, Y., Teng, W., Wang, J., Qiu, L., et al. (2009). Identification of QTL underlying isoflavone contents in soybean seeds among multiple environments. Theor. Appl. Genet. 118, 1455–1463. doi: 10.1007/s00122-009-0994-5
Zhang, H. J., Li, J. W., Liu, Y. J., Jiang, W. Z., Du, X. L., Li, L., et al. (2014). Quantitative trait loci analysis of individual and total isoflavone contents in soybean seeds. J. Genet. 93, 331–338. doi: 10.1007/s12041-014-0371-2
Zhang, P. P., Du, H. Y., Wang, J., Pu, Y. X., Yang, C. Y., Yan, R. J., et al. (2020). Multiplex CRISPR/Cas9-mediated metabolic engineering increases soya bean isoflavone content and resistance to soya bean mosaic virus. Plant Biotechnol. J. 18, 1384–1395. doi: 10.1111/pbi.13302
Keywords: soybean, isoflavone content, quantitative trait loci, GmMT1, disease resistance, stress
Citation: Li R, Zou J, Sun D, Jing Y, Wu D, Lian M, Teng W, Zhan Y, Li W, Zhao X and Han Y (2022) Fine-Mapping and Functional Analyses of a Candidate Gene Controlling Isoflavone Content in Soybeans Seed. Front. Plant Sci. 13:865584. doi: 10.3389/fpls.2022.865584
Received: 30 January 2022; Accepted: 08 March 2022;
Published: 25 April 2022.
Edited by:
Yuan-Ming Zhang, Huazhong Agricultural University, ChinaReviewed by:
Hengyou Zhang, Northeast Institute of Geography and Agroecology (CAS), ChinaCopyright © 2022 Li, Zou, Sun, Jing, Wu, Lian, Teng, Zhan, Li, Zhao and Han. This is an open-access article distributed under the terms of the Creative Commons Attribution License (CC BY). The use, distribution or reproduction in other forums is permitted, provided the original author(s) and the copyright owner(s) are credited and that the original publication in this journal is cited, in accordance with accepted academic practice. No use, distribution or reproduction is permitted which does not comply with these terms.
*Correspondence: Xue Zhao, eHVlemhhb0BuZWF1LmVkdS5jbg==; Yingpeng Han, aHlwMjM0Mjg2QGFsaXl1bi5jb20=
†These authors have contributed equally to this work
Disclaimer: All claims expressed in this article are solely those of the authors and do not necessarily represent those of their affiliated organizations, or those of the publisher, the editors and the reviewers. Any product that may be evaluated in this article or claim that may be made by its manufacturer is not guaranteed or endorsed by the publisher.
Research integrity at Frontiers
Learn more about the work of our research integrity team to safeguard the quality of each article we publish.