- 1School of Computer and Information Technology, Xinyang Normal University, Xinyang, China
- 2Guangxi Key Laboratory of Wireless Wideband Communication and Signal Processing, Guilin University of Electronic Technology, Guilin, China
Internet of Things (IoT) realizes the real-time video monitoring of plant propagation or growth in the wild. However, the monitoring time is seriously limited by the battery capacity of the visual sensor, which poses a challenge to the long-working plant monitoring. Video coding is the most consuming component in a visual sensor, it is important to design an energy-efficient video codec in order to extend the time of monitoring plants. This article presents an energy-efficient Compressive Video Sensing (CVS) system to make the visual sensor green. We fuse a context-based allocation into CVS to improve the reconstruction quality with fewer computations. Especially, considering the practicality of CVS, we extract the contexts of video frames from compressive measurements but not from original pixels. Adapting to these contexts, more measurements are allocated to capture the complex structures but fewer to the simple structures. This adaptive allocation enables the low-complexity recovery algorithm to produce high-quality reconstructed video sequences. Experimental results show that by deploying the proposed context-based CVS system on the visual sensor, the rate-distortion performance is significantly improved when comparing it with some state-of-the-art methods, and the computational complexity is also reduced, resulting in a low energy consumption.
1. Introduction
In the Internet of Things (IoT), the plant propagation process or plant growth can be monitored by visual sensors. One benefit from the framework of IoT, a large amount of data on the plant can be gathered in a central server, and the valuable information can be achieved by analyzing the data in real-time. However, with the limited processing capabilities and power/energy budget of visual sensors, it is a challenge for video monitoring of plant to compress large-scale video sequences by using the traditional codec, e.g., H.264/AVC and HEVC (Sullivan et al., 2012), so the existing works have developed low-complexity and energy-efficient video codecs, in which Distributed Video Coding (DVC) (Girod et al., 2005) and Compressive Video Sensing (CVS) (Baraniuk et al., 2017) have attracted more attention in industry and academia. Different from DVC, CVS dispenses with the feedback and virtual channels (Unde and Pattathil, 2020), which makes the codec framework simpler. Meanwhile, CVS provides a low-complexity encoder because of its theoretic foundation, Compressive Sensing (CS) (Baraniuk, 2007), realizes the capture of video frames at a rate significantly below the Nyquist rate. Currently, many researchers recognize that CVS is a potential scheme to compress the video sequences in the IoT framework, and especially for wireless video monitoring of plants, the CVS scheme can assist visual sensors to efficiently reduce the energy consumptions, however, its rate-distortion performances are still far from satisfactory.
The objective of this article is to improve the rate-distortion performance of CVS, providing high-quality video monitoring of plants with low energy consumption. To achieve this objective, the existing works focus on how to design excellent recovery algorithms, and they are keen on mixing various advanced tools into the CVS framework, e.g., the latest popular Deep Neural Network (DNN) (Palangi et al., 2016; Zhao et al., 2020; Tran et al., 2021). Though effective, they bear a heavy computational burden. Different from these works, we try to exploit the capability of CS to capture important structures, improving the reconstruction quality only armed with some simple recovery algorithms. It is well known that the context feature (Shechtman and Irani, 2007; Romano and Elad, 2016) is a good structure for visual quality, and, therefore, in this article, we focus on how to fuse contexts into CVS for an obvious improvement of reconstruction quality.
Compressive Video Sensing consists of three essential steps including CS measurement, measurements quantization, and reconstruction. CS measurement is a process of randomly sampling each video frame, in which the block-based (Gan, 2007; Bigot et al., 2016) or structurally (Do et al., 2012; Zhang et al., 2015) random matrix is often used to ensure the small memory requirement. Output by CS measurement, all measurements are required to be quantized as bits, then transmitted to the decoder. The straightforward solution to incorporating quantization into CVS is simply to apply Scalar Quantization (SQ), but it brings a big error. For block-based sampling, Differential Pulse Code Modulation (DPCM) (Mun and Fowler, 2012) can be used, and it exploits the correlations between blocks to improve the rate-distortion performance. Based on DPCM, many works also proposed some efficient predictive schemes (Zhang et al., 2013; Gao et al., 2015) to quantize CS measurements. Reconstruction is deployed at the decoder, and it uses quantized measurements to reconstruct the video sequence by the CS recovery algorithm. At present, the reconstruction can be implemented by one of the three types: frame-by-frame (Chen Y. et al., 2020; Trevisi et al., 2020), three-dimensional (3D) (Qiu et al., 2015; Tachella et al., 2020), and distributed strategies (Zhang et al., 2020; Zhen et al., 2020). The frame-by-frame reconstruction performs a CS recovery algorithm to reconstruct each video frame independently, and it has a poor rate-distortion performance due to neglecting the correlations between frames. The 3D reconstruction designs some complex representation models to once reconstruct a whole video sequence or a Group Of Pictures (GOP), e.g., Li et al. (2020) proposed the Scalable Structured CVS (SS-CVS) framework, which learns the union of data-driven subspaces model to reconstruct GOPs. However, it has a defect in 3D reconstruction that the huge memory and high computational complexity are required to be invested at decoder. Derived from the decoding strategy of DVC, the distributed reconstruction divides the input video sequence into non-key frames and key frames and reconstructs each non-key frame by the CS recovery algorithm with the aid of its neighboring key frames. With a small memory and a low computational complexity, the distributed reconstruction improves the rate-distortion performance by exploiting the motions between frames, so many existing works focus on it to design the CVS systems, e.g., Ma et al. proposed the DIStributed video Coding Using Compressed Sampling (DISCUCS) (Prades-Nebot et al., 2009), Gan et al. proposed the DIStributeCOmpressed video Sensing (DISCOS) (Do et al., 2009), Fowler et al. proposed the Multi-Hypothesis Block CS (MH-BCS) system (Chen et al., 2011; Tramel and Fowler, 2011; Azghani et al., 2016), etc. The core of distributed reconstruction is the Multi-Hypothesis (MH) predictive technique, which uses a linear combination of blocks in key frames to interpolate the blocks in non-key frames. As one of the state-of-the-art techniques, the MH prediction is widely applied to distributed reconstruction. Recently, some works try to modify the implementation of MH prediction, e.g., Chen C. et al. (2020) added the iterative Reweighted TIKhonov-regularized scheme into MH prediction (MH-RTIK), causing a significant improvement of CVS performance. CS theory indicates that the precise recovery requires enough CS measurements. With insufficient CS measurements, the excellent CS recovery algorithm still cannot prevent the degradation of reconstruction quality, however, by adaptively allocating CS measurements based on local structures of the image, a simple recovery algorithm can also provide a good reconstruction quality (Yu et al., 2010; Taimori and Marvasti, 2018; Zammit and Wassell, 2020). Judging from the above facts, the adaptive allocation is a potential way to improve the rate-distortion performance of the CVS system with a light codec.
This article presents a context-based CVS system, of which the core is the allocation of CS measurements adapted by context structures at the encoder. Based on these adaptive measurements, by combining linear estimation and MH prediction into distributed reconstruction, the decoder provides a satisfying reconstruction quality with low memory and computational cost. The contributions of the proposed context-based CVS is to solve the following issues:
(1) How to extract the context structures from CS measurements? Traditional methods use pixels to compute the context features, but it costs lots of computations at the encoder, resulting in impracticality for CVS. Especially when the encoder is realized by Compressive Imaging (CI) devices (Liu et al., 2019; Deng et al., 2021), due to the unavailability of original pixels, it is impossible to perform the traditional methods. Considering the low dimensionality and availability of CS measurements, it is practical in CVS to extract context structures from CS measurements.
(2) How to adaptively allocate CS measurements by context structures? Contexts measure the correlations between pixels, and their distribution reveals some meaningful structures, e.g., smoothness, edges, textures, etc. With the same recovery quality, fewer necessary measurements are required for simple structures and more for complex structures. According to the distribution of contexts, an efficient allocation is designed to avoid insufficiency or redundancy of measurements.
(3) How to quantize the adaptive measurements? Adaptive allocation makes blocks have different numbers of CS measurements, as a result, the traditional prediction cannot be applied to quantization. Due to the insufficient capability of SQ, an appropriate prediction scheme is required to reduce the quantization error.
Experimental results show that the proposed context-based CVS system outputs the high-quality reconstructed video sequences when monitoring plant growth or propagation and improves the rate-distortion performances when compared with the state-of-the-art CVS systems, which demonstrates the effectiveness of context-based allocation for CVS.
The rest of this article is organized as follows. Section 2 briefly overviews Plant Monitoring System, CVS, and describes the traditional method to extract context features. Section 3 presents the proposed context based CVS system. Experimental results are provided in Section 4, and we conclude this article in Section 5.
2. Related Works
2.1. Plant Monitoring System
In modern agriculture, it is essential to monitor plant propagation or growth for guaranteeing productivity. The labor costs can be efficiently reduced by automatically capturing the architectural parameters of the plant, so more and more attention has been paid to the design of the plant monitoring system (Somov et al., 2018; Grimblatt et al., 2021; Rayhana et al., 2021). Early, lots of systems are designed to monitor the various environmental parameters on plant growth, such as humidity, temperature, solar illuminance, etc., e.g., James and Maheshwar (2016) used multiple sensors to measure the soil data of plants and transmitted these data to the mobile phone by Raspberry Pi; Okayasu et al. (2017) developed a self-powered wireless monitoring device that is equipped with some environmental sensors; Guo et al. (2018) added big-data services to analyze the environmental data on plant growth. These environmental parameters indirectly indicate the process of plant growth, and they cannot record the visual scenes on plant growth, resulting in the unavailability of the physical structure parameters on plants. To realize the visual monitoring of plants, some works have started to integrate the visual sensors into the plant monitoring system, e.g., Peng et al. (2022) used the binocular camera to capture video sequences on a plant and used the structure from motion method (Piermattei et al., 2019) to extract the 3-D information of a plant; Sajith et al. (2019) designed a complex network to derive the plant growth parameters from the monitoring images; Akila et al. (2017) extracted the plant color and texture by the visual monitoring system. From the above, it can be seen that the visual sensor or camera is used to capture the video sequences on plant growth, and these video sequences are compressed as bitstream which is transmitted to the IoT cloud for further analyzing. As the core of visual sensors, the video compression is a major energy consumer, so a challenge that we face for the visual monitoring system of the plant is to design an energy-efficient video coding scheme to extend the working time of the visual sensor. In the framework of IoT, CVS is a potential coding scheme to reduce the energy consumption of visual sensors. The following briefly overviews the CVS systems.
2.2. CVS System
Compressive Video Sensing is the marriage of CS theory and DVC, which reduces the encoding costs and enhances the robustness to noise, thus becoming a potential video codec for wireless visual sensors. At the encoder, to satisfy low complexity and fast computation, the block-based CS sampling is performed on each video frame independently, i.e., the ith video frame fi of size N1 × N2 is partitioned into non-overlapping blocks of size B × B, each block is vectorized as xi,j of length Nb, and the CS measurements yi,j of xi,j are output by
where Φi,j is called as the measurement matrix and can be constructed by some random matrices, e.g., Gaussian, Bernoulli, structural random matrix, etc. By setting the length of yi,j to be Mi,j, the size of Φi,j is fixed to be Mi,j × Nb, and the subrate Si of fi is defined as
where N is the number of total pixels in fi, Mi is the number of CS measurements for fi, and J is the number of blocks in fi. In CI application, an optical device is designed to perform Equation (1), and directly output the CS measurements. To ensure a stable recovery, L video frames are gathered to form a GOP, in which the first frame, called the key frame, is set to be a high subrate, and others, called the non-key frame, are set to be a low subrate. After quantization, all CS measurements of GOP are packaged and transmitted to decoder.
At the decoder, by using the received CS measurements, the frame-by-frame, 3D, or distributed strategy is performed to reconstruct the GOP. For frame-by-frame, the reconstruction model can be represented by
where Ψ denotes the 2D sparse representation basis, α is a regularization factor, ||·||2 denotes ℓ2 norm, and ||·||1 denotes ℓ1 norm. The model (3) can be solved by some non-linear optimization algorithms, e.g., Alternating Direction Method of Multipliers (ADMM) (Yang et al., 2020), and all reconstructed blocks are spliced into the estimated frame . The frame-by-frame model uses only the spatial correlations, so its rate-distortion performance is unsatisfactory. The 3D reconstruction model fully considers the spatial-temporal correlations and it can be represented by
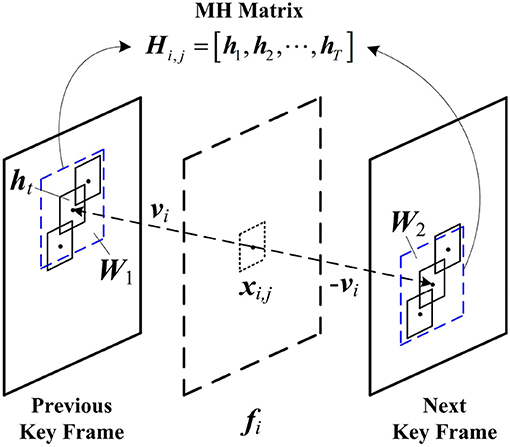
where Γ denotes the 3D sparse representation basis, and it is used to remove the spatial-temporal redundancies between blocks. Though effective, model (4) results in a heavy computational burden. Different from the 3D reconstruction, the distributed reconstruction uses the motion-compensation based prediction technique to expose the spatial-temporal redundancies between blocks. Figure 1 shows the mechanism of MH prediction, which is commonly used in distributed reconstruction. MH prediction collects the spatial-temporal neighboring blocks in key frames to construct an MH matrix Hi,j. According to the motion vector vi of xi,j, the motion-aligned windows W1 and W2 of sizes W × W are, respectively, located on the previous and the next key frames, and all candidate blocks in W1 and W2 are extracted as the hypotheses of xi,j, producing Hi,j = [h1, h2, ⋯ , hT], in which T = W2. By using MH prediction, the distributed reconstruction is modeled as a Least-Squares (LS) problem as follows:
where Θ is the Tikhonov matrix, and β is a regularization factor. Θ is a diagonal matrix and constructed by
With this structure, Θ assigns weights of small magnitude to hypotheses mostly dissimilar from xi,j. The LS problem can be fast solved by the Conjugate Gradient algorithm (Zhang et al., 2018), which significantly reduces the computational complexity of distributed reconstruction. Due to the full exploitation of spatial-temporal correlations between blocks, the MH prediction enables the distributed reconstruction to provide superior recovery. From the above, in order to realize a light decoder and ensure a good recovery at the same time, distributed reconstruction is a wise way.
2.3. Contexts
Compressive Sensing theory indicates that the sparsity K of the signal determines its required number M of CS measurements by precise recovery. An empirical rule (Becker and Bobin, 2011) is that the precise recovery can be achieved if
In the block-based CS sampling, this rule can be used to avoid the redundancy or insufficiency of CS measurements for blocks, i.e., adapted by the sparsity, each block is allocated to the appropriate number of CS measurements. The sparsity is defined as the number of coefficients with significant magnitude in a representation, and its calculation has not a strict mathematical formula. For images, the sparsity can be revealed by some features, e.g., edge, variance, gradient, etc., and these features are applied into adaptive allocation, leading to the improvement of recovery quality. The simple features only describe the correlations between pixels, but the structures of blocks are not taken into consideration, thus we require some complex features to improve the efficiency of adaptive allocation. In Ref. Romano and Elad (2016), the self-similarity descriptor (Shechtman and Irani, 2007) is used to extract the contexts of blocks, which represents how similar a central block is to its large surrounding windows. Contexts contain the internal structures and external relations among blocks, and it is a potential feature to better reveal the sparsity variation. The following briefly describes how to extract the contexts in an image.
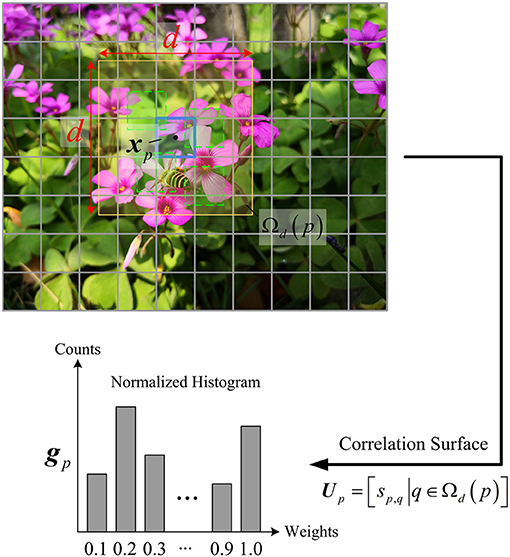
The context feature expresses the similarities between a central block and those of its large surrounding windows. As illustrated in Figure 2, for a central block xp in an image, its similarity weights are computed by
where xq denotes the qth surrounding block in a neighborhood Ωd(p) of size d × d, and σ is a normalization factor. The range of sp,q is [0, 1], in which a large value indicates that the blocks xp and xq are highly similar, and a small value indicates that the two are substantially different. All weights constitute a correlation surface Up = [sp,q|∀q ∈ Ωd(p)], of which the statistics reveal the self-similarity of xp. To measure the statistics, the correlation surface of xp is rearranged into a histogram of b bins, of which the normalization is regarded as the context feature gp of xp.
The context feature gp is an empirical distribution of the co-occurrences of xp in its large surroundings, which measures the correlations between xp to its surroundings. When gp is biased toward the left bins, it can be concluded that the majority of sp,q are small, indicating the block xp is unique, i.e., it originates from a highly textured and non-repetitive area, so its sparsity is relatively high. When gp is biased toward the right bins, it means that most of sp,q are high, indicating that the block xp has many co-occurrences in its surroundings, i.e., it originates from a large flat area, so its sparsity is low. From the above, we can see that the context feature accurately describes the geometric structure of a block with respect to its surrounding blocks, thus it is naturally sensitive to the sparsity variation. However, in CVS, the traditional method is impractical due to the unavailability of original pixels or high computational complexity. Therefore, it is challenging to extract the context feature by using CS measurements of blocks.
3. Proposed Context Based CVS System
3.1. System Architecture
As shown in Figure 3, we describe the architecture of the proposed context-based CVS system in detail. The input video sequence is divided into several GOPs of length L, and each GOPk is successively encoded as Packetk. After receiving this packet, the decoder reconstructs the corresponding , and all reconstructed GOPs are regrouped as the entire video sequence.
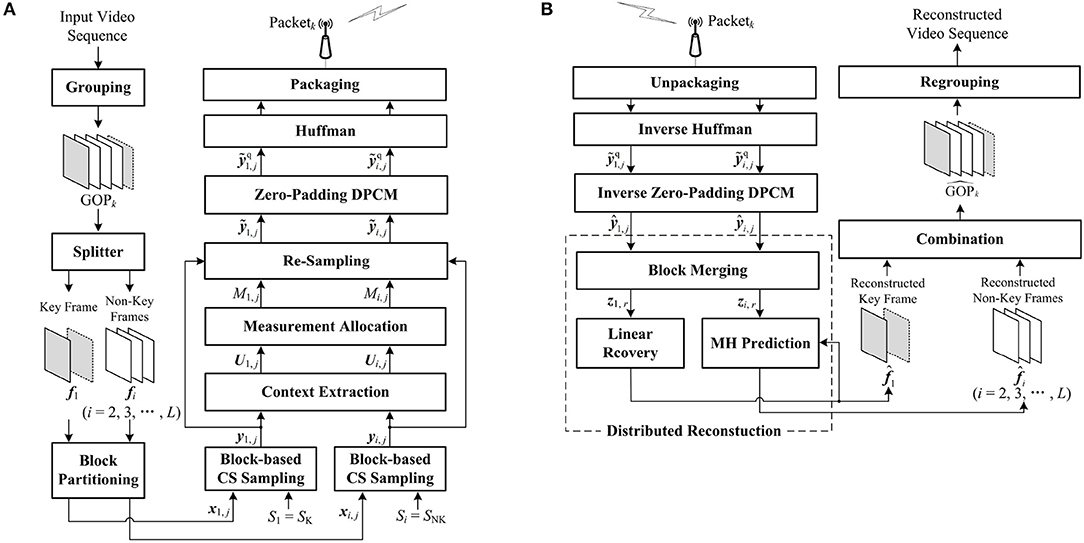
Figure 3. Architecture of the proposed context-based Compressive Video Sensing (CVS) system: (A) encoder framework, (B) decoder framework.
Figure 3A presents the process of encoding GOPk. The key frame f1 is split from GOPk, and others are regarded as the non-key frames. The key frame f1 and the ith non-key frame fi are partitioned into J non-overlapping blocks and of size B × B, respectively. For the key frame f1, we set a high subrate S1 = SK to sample the blocks and generate the CS measurements according to Equation (1). The blocks in the non-key frame fi are sampled at a low subrate Si = SNK, producing the corresponding CS measurements by Equation (1). For f1 and fi, based on the preset subrates, CS measurements are uniformly allocated to each block, however, without considering the structures of blocks, the uniform allocation results in either redundancy or insufficiency of CS measurements for some blocks. To improve the efficiency of block-based CS sampling, the core of the encoder is to perform the adaptive allocation by contexts of blocks. Different from traditional methods, the contexts U1,j and Ui,j of x1,j and xi,j are, respectively, extracted by using the CS measurements y1,j and yi,j, which makes CVS system more practical. After context extraction, according to the contexts U1,j and Ui,j, the numbers of CS measurements of x1,j and xi,j are modified as M1,j and Mi,j by adaptive allocation. According to M1,j and Mi,j, by removing the redundancy or supplementing the insufficiency in y1,j and yi,j, x1,j and xi,j are re-sampled as and , respectively. DPCM cannot be used to quantize the adaptive measurements with different numbers. To overcome this defect of DPCM, we fuse zero padding into DPCM and predictively quantize and as and . Finally, all quantized CS measurements are encoded as bits by Huffman and packaged as Packetk.
Figure 3B presents the process of decoding Packetk. After unpackaging Packetk, the inversions of Huffman and zero-padding DPCM are implemented, and the CS measurements of x1,j and xi,j are recovered as and which have some quantization errors with their originals and . The distributed reconstruction is performed to reconstruct the key frame f1 and the non-key frames . To suppress the blocking artifacts in the reconstructed frames, we realize the recovery of large blocks by merging the CS measurements of the spatially neighboring blocks, so the CS measurements of f1 and fi are updated as z1,r and zi,r for large blocks. Based on z1,r, the reconstructed key frame is produced by using a linear recovery model, which rapidly recovers each block by a matrix-vector product. Regarding the previous and the next reconstructed key frames as references, the MH prediction outputs the reconstructed non-key frame by using zi,r. Finally, all reconstructed frames are combined into . Details of the core parts, including contexts extraction, measurements allocation, zero-padding DPCM, and distribution reconstruction, are described in the following subsections.
3.2. Context Extraction
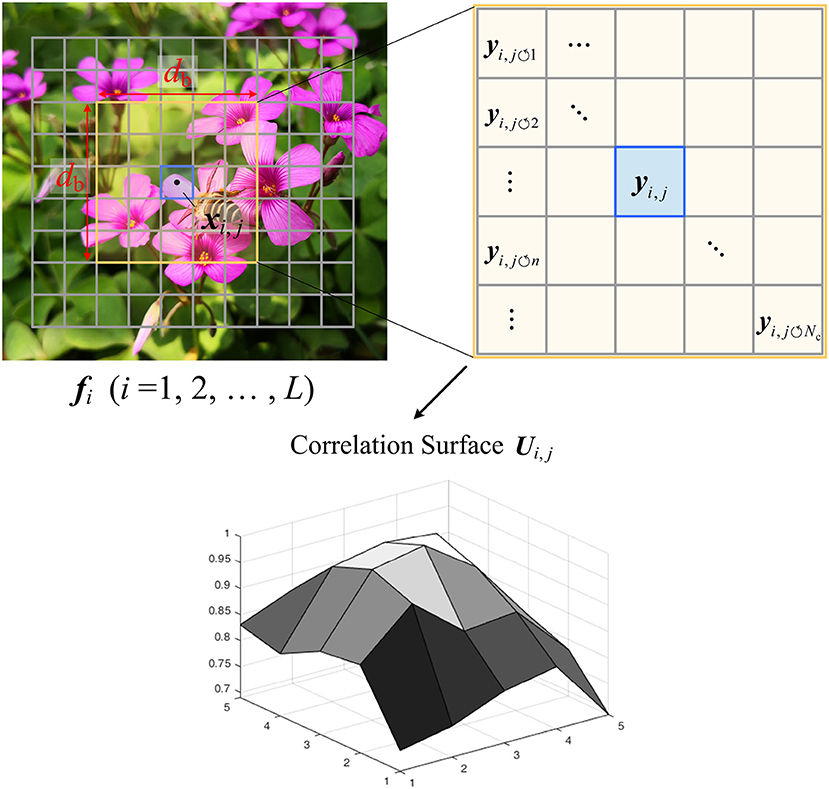
In the proposed CVS system, the context features are extracted by using the CS measurements of blocks. As illustrated in Figure 4, we compute the correlation surface Ui,j of xi,j in fi as its contexts, in which i = 1, 2, ⋯ , L. In the surrounding window of size db × db centered on xi,j, we cannot extract the original blocks pixel-by-pixel due to the unavailability of original pixels, but can only use the CS measurements of non-overlapping blocks , in which . According to CS theory, the measurement matrix Φi,j holds the Restricted Isometry Property (RIP) (Candès and Wakin, 2008) for blocks , which implies that all pairwise distances between original blocks can be well preserved in the measurement space, i.e.,
where it is noted that all blocks share the same measurement matrix Φi,j due to the uniform allocation. Based on Equation (10), the similarity weights between xi,j and xi, j↺n can be estimated by
All weights constitute the correlation surface Ui,j as follows:
To compactly represent the contexts of xi,j, we compute the mean ui,j of Ui,j as the context feature, i.e.,
3.3. Measurement Allocation
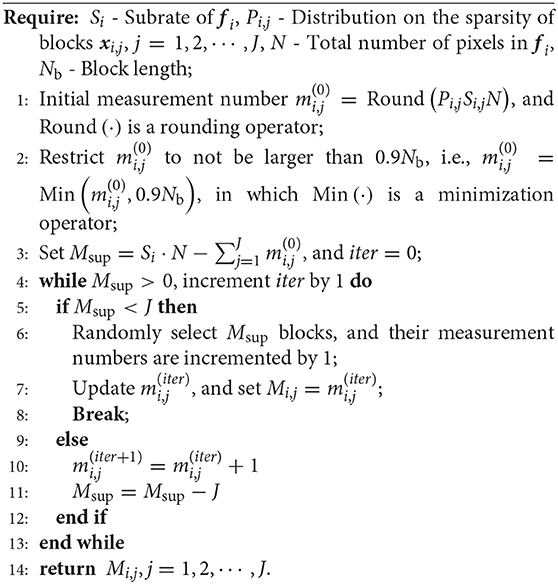
By exploiting the context feature ui,j of xi,j, we set the appropriate number of CS measurements for xi,j, and remove the redundancy or supplement the insufficiency in yi,j. The magnitudes of context features are high in smooth regions, and the magnitudes are low in the edge and texture regions, so it is found that the experience that the context feature is inversely proportional to the sparsity. Based on this experience, we can describe the distribution on the sparsity degrees of blocks by
According to the present subrate Si of fi, we construct the allocation model of CS measurements for blocks as follows:
where N is the total number of pixels in fi, Nb is the block length, mi,j is a positive integer, and its upper bound is set to be 0.9·Nb. The model (15) is solved according to Algorithm 1 and outputs the final number Mi,j of CS measurements for xi,j.
3.4. Zero-Padding DPCM
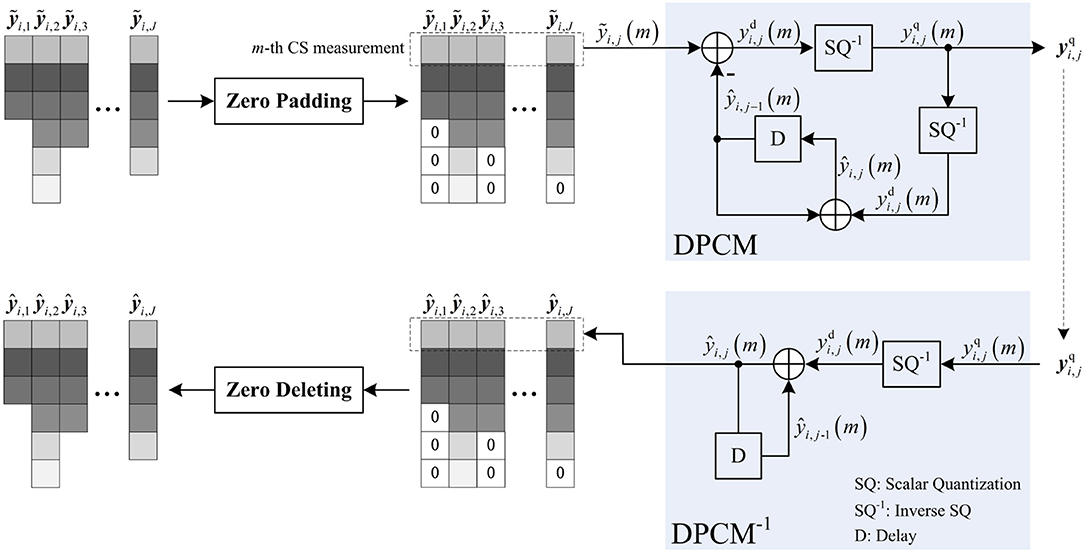
Due to the adaptive allocation, the lengths of the re-sampled CS measurements vary. Compared with SQ, DPCM provides better rate-distortion performance by adding the predictive scheme into the quantization of block-based CS measurements. However, DPCM requires that all blocks have the same number of CS measurements, as a result, DPCM cannot be used to quantize . To make DPCM adapt to the adaptive allocation, we propose zero-padding DPCM, whose implementation is shown in Figure 5. Before inputting to DCPM, we fill zeros in the last of to make its length the same as others. After obtaining the de-quantized CS measurements , we delete the zeros in the last of to recover its original length Mi,j. By zero padding, each measurement in can be used to predict the corresponding measurement in , and especially when there is predictive measurement ŷi, j−1(m) of the m-th measurement ỹi,j(m), the residual can be significantly reduced due to the intrinsic spatial correlation between and . The rate-distortion curves of the reconstructed Foreman, Mobile, and Football sequences are presented when zero-padding DPCM and SQ are, respectively, used to quantize the adaptive CS measurements (shown in Supplementary Figure 1), in which the rate-distortion curve is measured in terms of the Peak Signal-to-Noise Ratio (PSNR) in dB and bitrate in bits per pixel (bpp), and the linear recovery algorithm presented in subsection 3.5 is used to recover each video frame. It can be seen that zero-padding DPCM presents competitive performance with SQ at low bitrates but as the bitrate increases, its improvement of performance over SQ is increasingly significant. From these results, we find that the efficiency of zero-padding DPCM relies on the correlation between block-based CS measurements. With insufficient measurements, the correlation is weakened by the filling of excessive zeros, causing the performance degradation, but when measurements are sufficient, a high correlation is maintained, so the performance improvement stands out. From the above, zero-padding DPCM is more suitable for adaptive measurements compared with SQ.
3.5. Distributed Reconstruction
At decoder, the distributed strategy is performed to reconstruct the key frame f1 and the non-key frames , in which f1 is estimated by a linear recovery model, and fi is produced by MH prediction. To highlight the complex structures by contexts, a small block size is more desired at the encoder. However, the small block size causes serious blocking artifacts due to the differences of neighboring blocks in recovery quality. To suppress the blocking artifacts, we merge the CS measurements of the small blocks into those of the large blocks and realize the sampling of small blocks and the recovery of large blocks. The size Blev × Blev of large block is set to be
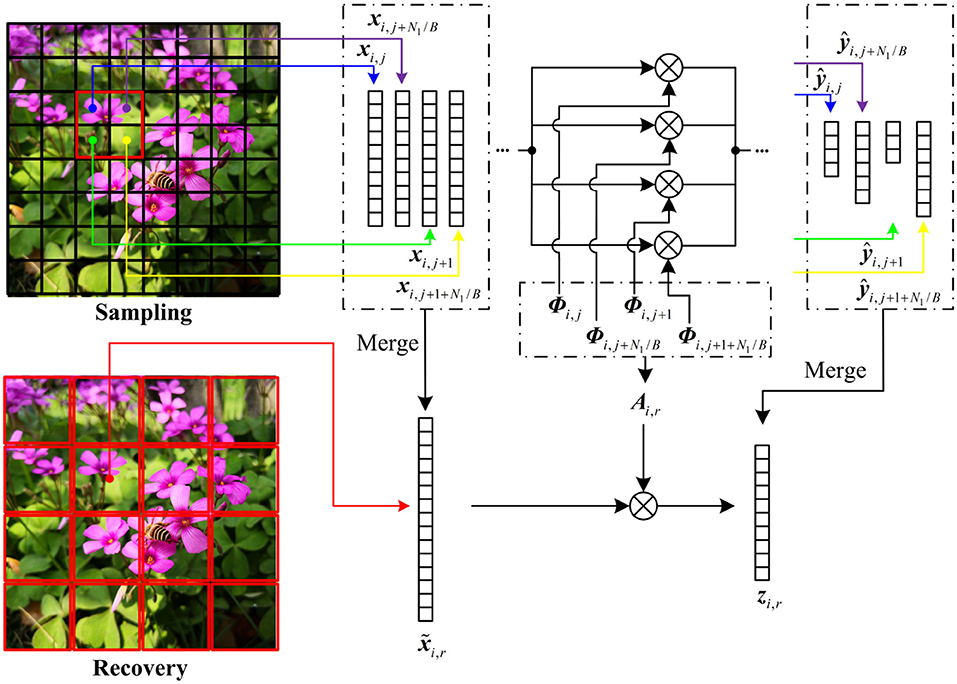
in which lev is a positive integer. The number R of large blocks is , and it is smaller than the number J of small blocks. Figure 6 illustrates the block merging when lev is set to be 1. The four neighboring blocks xi,j, xi,j+1, xi,j+N1/B, xi,j+1+N1/B are merged into a large block , and their CS measurements , , , and are spliced into zi,r in rows, i.e.,
in which Λi,r is the diagonal matrix composed of the block measurement matrices Φi,j, Φi,j+1, Φi,j+N1/B, and Φi, j+1+N1/B, N1 is the total number of rows in fi, and B is the block size of the small block. To make zi,r, the CS measurements of , we transform as
in which I is an elementary column transformation matrix. Plugging Equation (19) into Equation (17), we build the bridge between and zi,r by
in which Ai,r = Λi,r·I. According to Equation (20), the large block can be recovered by using zi,r. When lev is set to be larger than 1, the block merging can be done in manner similar to the above.
After the block merging, we use to recover the key frame f1. The block of f1 is linearly estimated by
in which P1,r is the transformation matrix produced by the following model:
in which E[·] denotes the expectation function. The model (22) outputs the optimal transformation matrix to minimize the mean square error between and its estimator , and it can be solved by making the gradient of objective function equal to 0, producing
Plugging Equation (20) into Equation (23), we get
in which Corxx is the auto-correlation matrix of , and its element Corxx[m, n] is estimated as follows:
in which δm,n is the Euclidean distance between two pixels and in . When the subrate is set to be large, the linear recovery model can provide excellent visual quality while costing fewer computations.
4. Experimental Results
We evaluate the proposed CVS system on video sequences with various resolutions, including seven CIF (352 × 288) sequences Akiyo, Bus, Container, Coastguard, Football, Foreman, Hall, one WQVGA (416 × 240) sequence BlowingBubbles, and one 1080p (1920 × 1080) sequence ParkScene. In the proposed CVS system, the window size db × db and the normalization factor σ are, respectively, set to be 11 × 11 and 10 for the context extraction, the window size W × W and the regularization factor β are, respectively, set to be 21 × 21 and 0.25 for the MH prediction, and the measurement matrix is produced by Gaussian distribution. First, we discuss the effects of different block sizes on the proposed CVS system. Second, we evaluate the performance improvement resulting from the used context extraction. Finally, we compare the proposed CVS system with two state-of-the-art CVS systems: SS-CVS (Li et al., 2020) and MH-RTIK (Chen C. et al., 2020) in terms of the rate-distortion performance. PSNR is used to evaluate the qualities of reconstructed video sequences, and the bitrate denotes the average amount of bits per pixel to encode a video sequence. The variation of PSNR with bitrate is called the rate-distortion performance. The computational complexity is measured by the execution time. Experiments are implemented with MATLAB on a workstation with 3.30-GHz CPU and 8 GB RAM.
4.1. Effects of Block Sizes
In the proposed CVS system, in order to highlight the complex structures by contexts, we desire a small block size at encoder, but at decoder, a large block size is desired to suppress the blocking artifacts in the reconstructed video frames. We set a block-size pair (B, Blev), in which B and Blev are the block sizes for sampling and recovery, respectively, and evaluate the effects of different block-size pairs on the reconstruction qualities of key frames and non-key frames.
First, we select the first frames of Foreman, BlowingBubbles, and ParkScene sequences as the key frames, which are linearly recovered, and show their rate-distortion curves at different block-size pairs in Figure 7. For Foreman and BlowingBubbles with the low resolution, the block-size pair (4, 16) achieves higher PSNR values than others with low bitrates, but the rate-distortion curve for the block-size pair (2, 16) rapidly increases as the bitrate increases and significant PSNR gains are achieved when compared with other block-size pairs. These results indicate that the small blocks used in adaptive allocation and large blocks for linear recovery fit together well. For ParkScene with high resolution, when the block size B for sampling is set to be too small, e.g., B = 2, no block can contain sufficient structures, causing the rate-distortion performance to degenerate as the bitrate increases, but a suitable block size for sampling is set, e.g., B = 8, PSNR gains can be significantly improved.
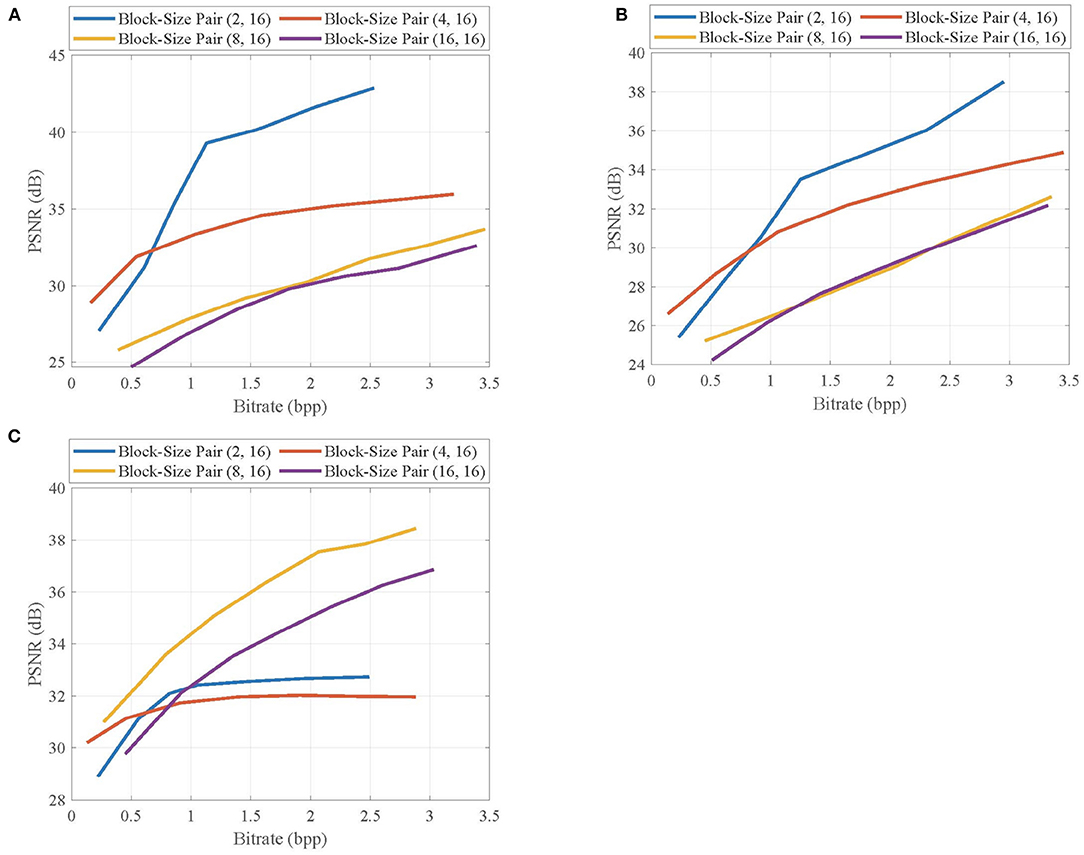
Figure 7. Rate-distortion curves of the reconstructed key frames in (A) Foreman, (B) BlowingBubbles, and (C) ParkScene sequences at different block-size pairs.
Then, we select the second frames of Foreman, BlowingBubbles, and ParkScene sequences as the non-key frames, which are recovered by MH prediction based on the reconstructed previous and next key frames at the subrate 0.7, and show their rate-distortion curves at different block-size pairs in Figure 8. Similar to the results from key frames, for Foreman and BlowingBubbles, the better rate-distortion performance is achieved when the block-size pair is set to be (2, 16), and for ParkScene, in order to prevent the loss of structures, the block size for sampling is appropriately set to be 8.
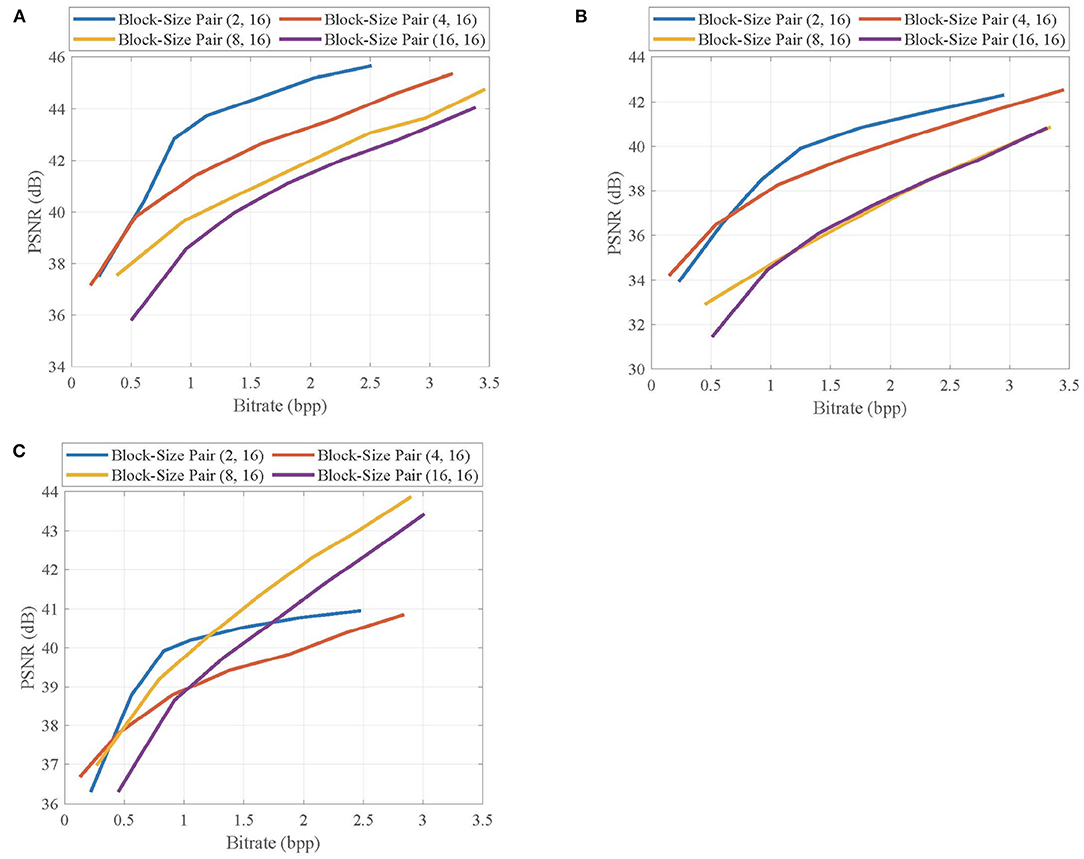
Figure 8. Rate-distortion curves of the reconstructed non-key frames in (A) Foreman, (B) BlowingBubbles, and (C) ParkScene sequences at different block-size pairs.
Given the above, we can see that the bad effects resulting from the extraction of contexts can be suppressed by the block merging, therefore, the quality improvement from contexts-based allocation is further enhanced.
4.2. Effects of Contexts
In the proposed CVS system, the contexts are extracted from CS measurements and used to adaptively allocate the CS measurements for blocks, leading to the improvement of reconstruction quality. To verify the validity of contexts from CS measurements on the quality improvement, we evaluate the effects of different allocation schemes on the rate-distortion performance of the proposed CVS system. The uniform allocation is used as a benchmark, and the adaptive allocation uses the contexts extracted from CS measurements and original pixels, respectively.
Figure 9 shows the rate-distortion curves of the reconstructed key frames when using different allocation schemes, in which the key frames are, respectively, taken from the first frames of Foreman, BlowingBubbles, and ParkScene sequences. It can be seen that adaptive allocation outperforms uniform allocation in PSNR values at any bitrate, indicating that contexts contribute to quality improvement. Importantly, the contexts from CS measurements are competitive with those from original pixels, and their performance gaps are very small, which means that CS measurements can better represent the contexts of blocks.
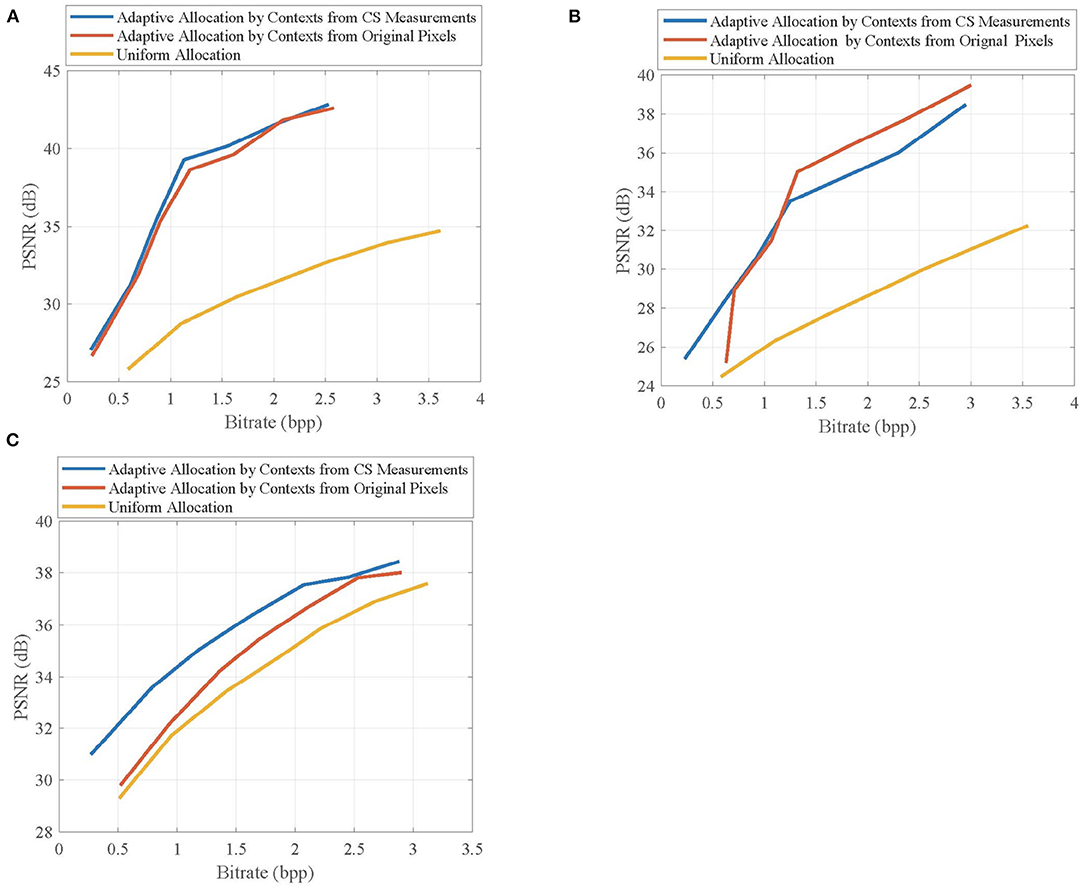
Figure 9. Rate-distortion curves of the reconstructed key frames in (A) Foreman, (B) BlowingBubbles, and (C) ParkScene sequences when using different allocation schemes. For Foreman and BlowingBubbles, the block-size pair is set to be (2, 16), and for ParkScene, the block-size is set to be (8, 16).
Figure 10 shows the rate-distortion curves of the reconstructed non-key frames when using different allocation schemes, in which the non-key frames are, respectively, taken from the second frames of Foreman, BlowingBubbles, and ParkScene sequences. It can be seen that the adaptive allocation is still effective for MH prediction, and it can significantly improve the rate-distortion performances when compared with uniform allocation. The contexts from CS measurements have similar efficiency of allocation to that of contexts from original pixels, which proves that the merits of adaptive allocation can still be maintained in the measurement domain.
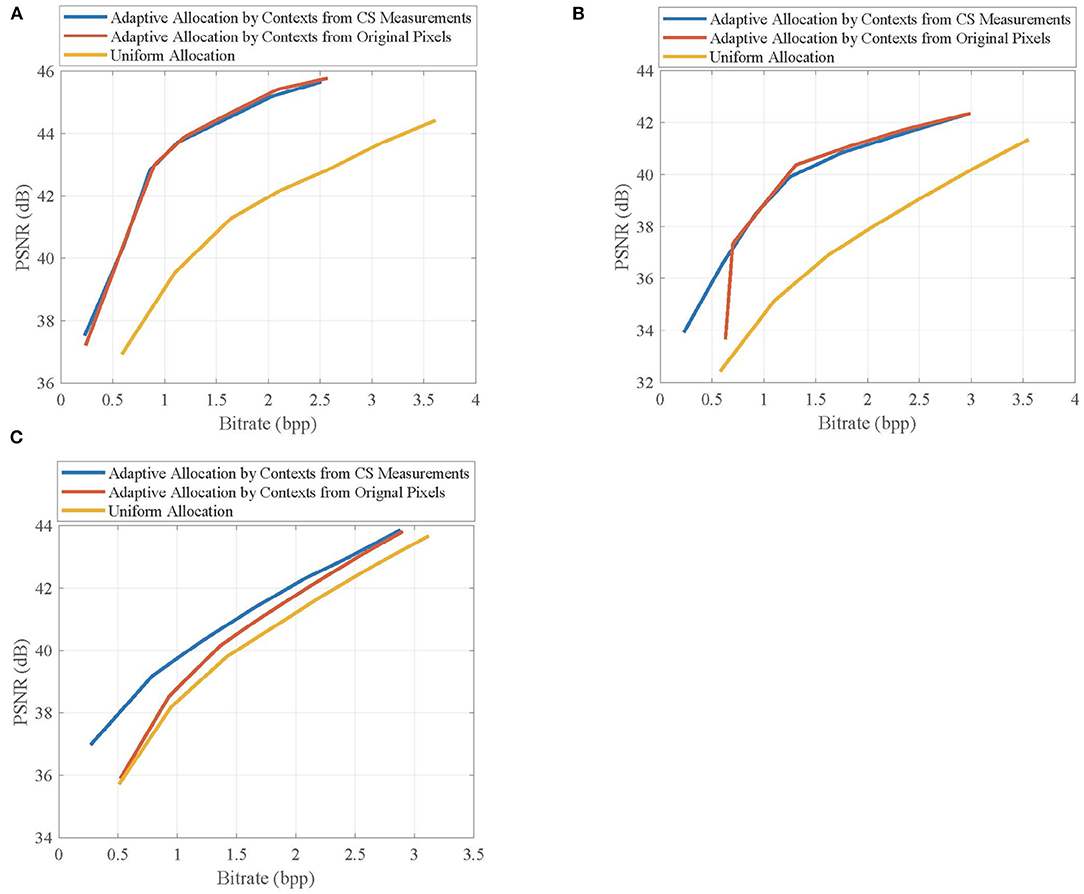
Figure 10. Rate-distortion curves of the reconstructed non-key frames in (A) Foreman, (B) BlowingBubbles, and (C) ParkScene sequences when using different allocation schemes. For Foreman and BlowingBubbles, the block-size pair is set to be (2, 16), and for ParkScene, the block-size is set to be (8, 16).
The above results indicate that the contexts extracted by CS measurements prompt the adaptive allocation to improve the reconstruction quality of CVS system, which makes the proposed CVS system more suitable to the applications with limited resources.
4.3. Performance Comparisons
We evaluate the performance of the proposed CVS system by comparing it with the two state-of-the-art CVS systems: SS-CVS (Li et al., 2020) and MH-RTIK (Chen C. et al., 2020). To make a fair comparison, we keep the parameter settings of SS-CVS and MH-RTIK in their original reports, some important details are repeated as follows:
1) SS-CVS: the system consists of one base layer and one enhancement layer; the block size is set to be 16; the length of GOP is 10; the subrate of key frame is set to be 0.9; the dimension of the subspace is 10; the number of subspaces is 50.
2) MH-RTIK: the sub-block extraction is used; the number of hypotheses is 40; the block size is set to be 16; the length of GOP is 2; the subrate of key frame is set to be 0.7.
In addition, we employ SQ and Huffman in SS-CVS and MH-RTIK to compress the CS measurements. For the proposed CVS system, the block-size pair is set to be (2, 16) for CIF and QWVGA sequences and (8, 16) for 1080P sequences, the subrate SK of key frame is set to be 0.7, the results under the GOP length L = 2 are compared with those of MH-RTIK, and the results under the GOP length L = 10 are compared with those of SS-CVS.
Table 1 lists the average PSNR values for the reconstructed video sequences by the proposed CVS system, SS-CVS, and MH-RTIK when the subrate SNK of non-key frame varies from 0.1 to 0.5. Compared with MH-RTIK, the proposed CVS system achieves obvious PSNR gains at any subrate, e.g., the average PSNR gain is 2.824 dB for the Foreman sequence. Compared with SS-CVS, the proposed CVS system also presents higher PSNR values at any subrate, and especially for low subrates, PSNR gains are significant, e.g., when the subrate is 0.1, PSNR gains are 9.82, 13.20, and 19.78 dB for ParkScene, BlowingBubble, Foreman sequences, respectively. Figures 11, 12 show the rate-distortion curves for the proposed CVS system, MH-RTIK, and SS-CVS. Due to the implementation of zero-padding DPCM, the performance improvement of the proposed CVS system is further enhanced when compared with MH-RTIK and SS-CVS. By the objective evaluation of the reconstruction quality, it can be indicated that the proposed CVS system can significantly improve the qualities of the reconstructed video sequences.
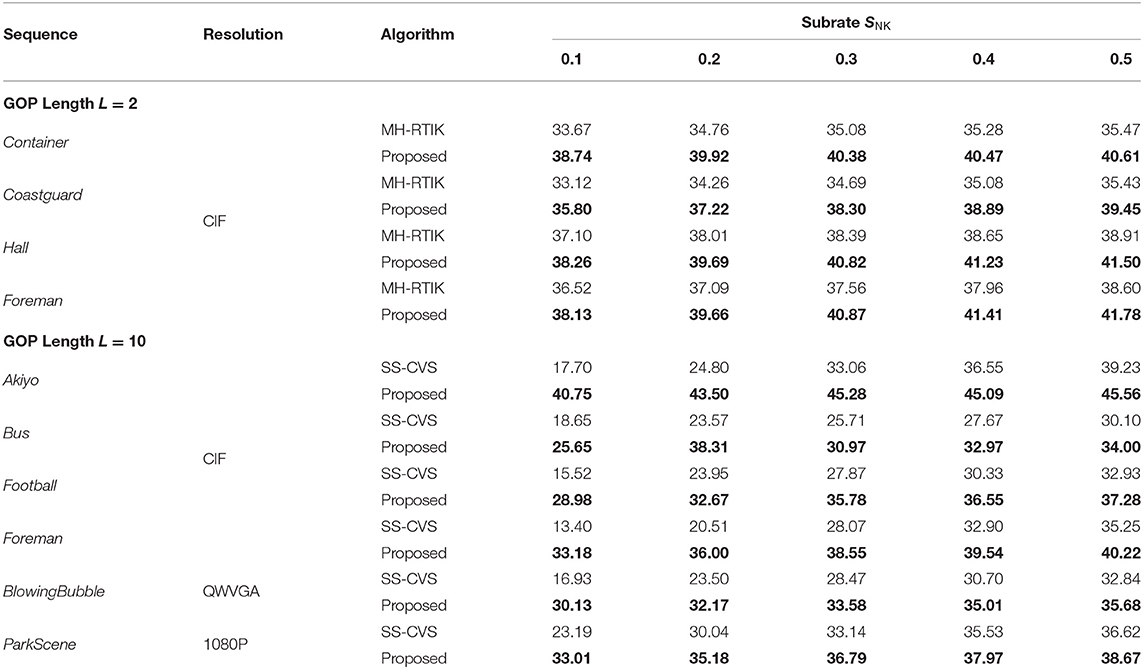
Table 1. Average Peak Signal-to-Noise Ratio (PSNR) (dB) for reconstructed video sequences by the proposed Compressive Video Sensing (CVS) system, Scalable Structured CVS (SS-CVS) (Trevisi et al., 2020), and Multi-Hypothesis Reweighted TIKhonov (MH-RTIK) (Chen C. et al., 2020) at subrates 0.1 to 0.5.
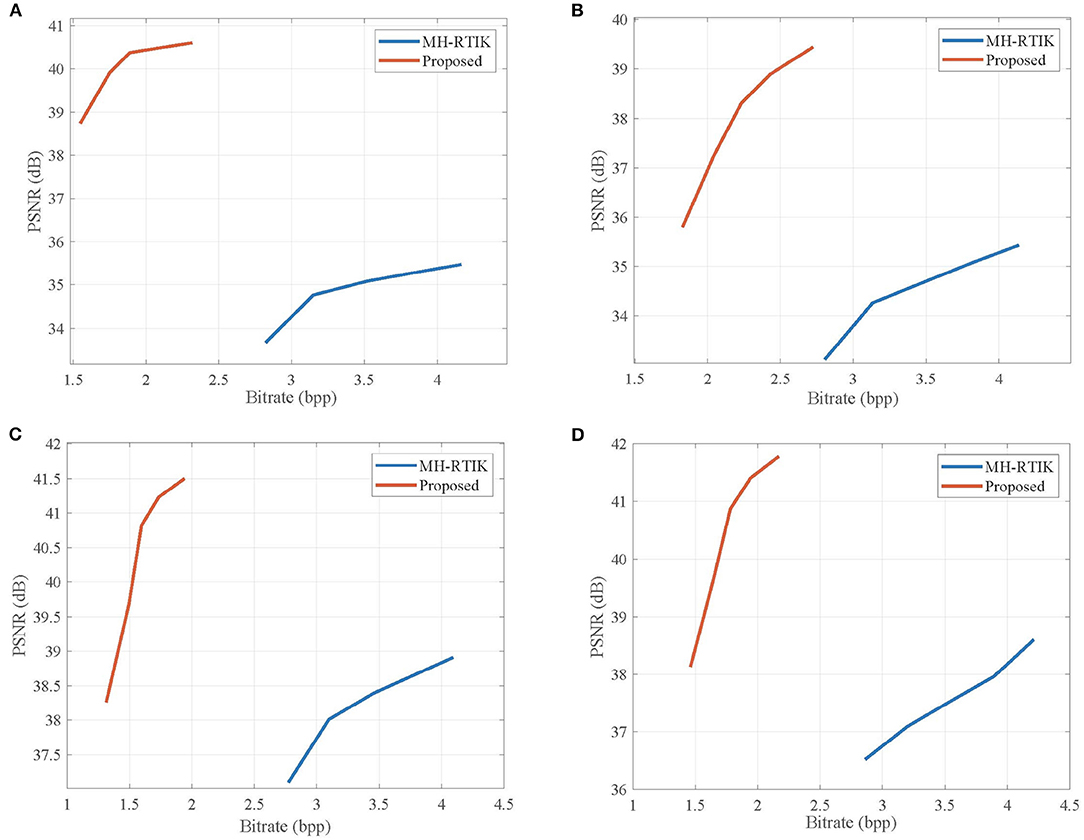
Figure 11. Rate-distortion curves obtained by the proposed CVS system and Multi-Hypothesis TIKhonov (MH-TIK) (Chen C. et al., 2020) for (A) Container, (B) Coastguard, (C) Hall, and (D) Foreman sequences. Note that the length L of GOP is set to be 2.
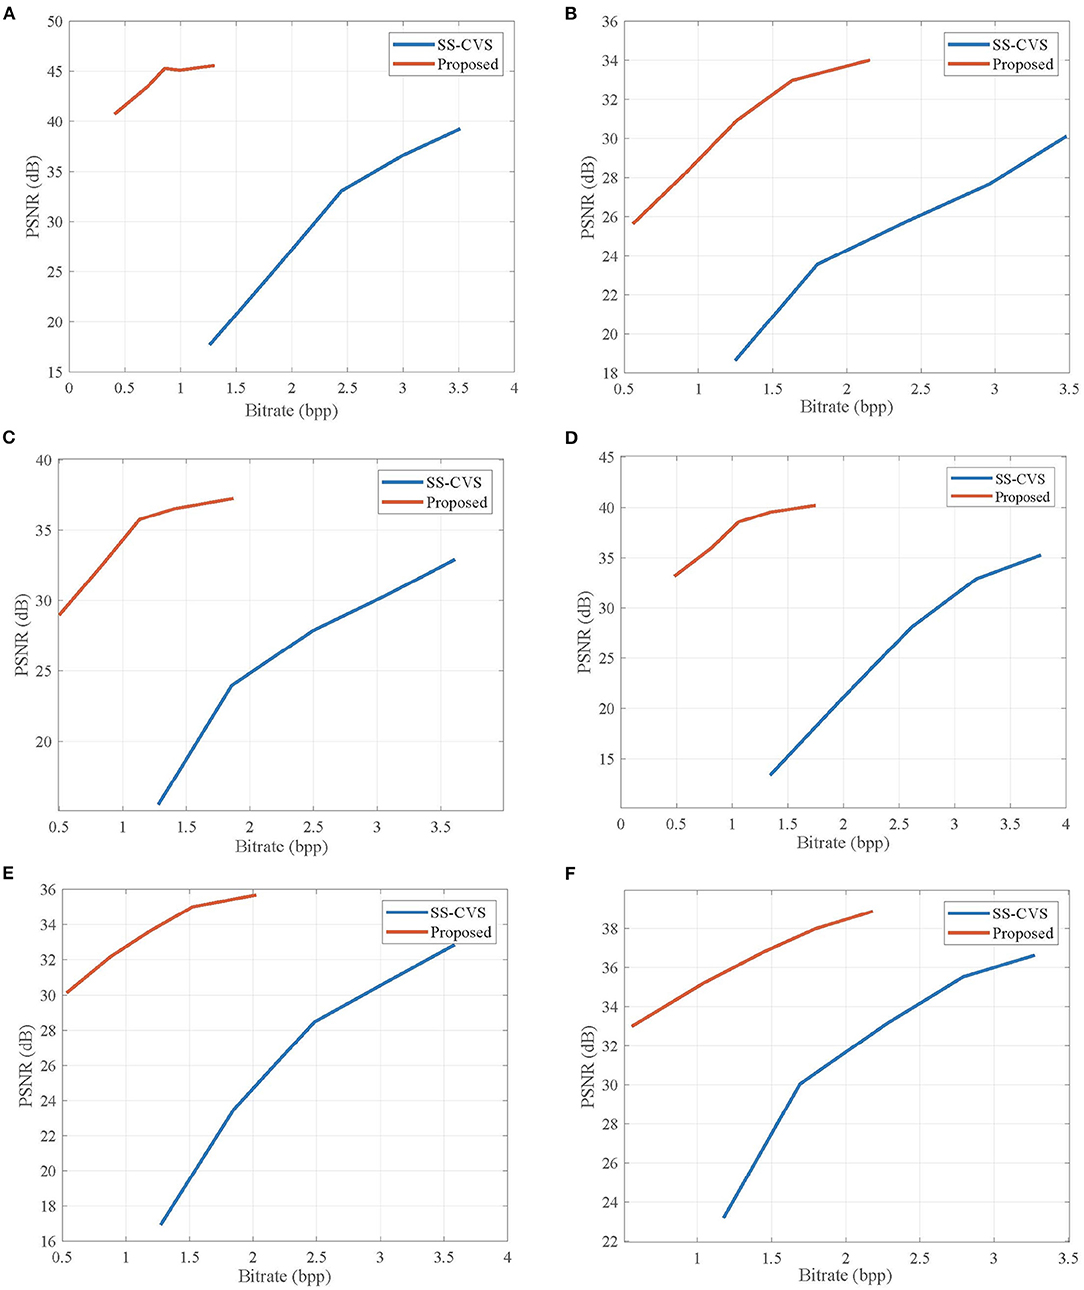
Figure 12. Rate-distortion curves obtained by the proposed CVS system and Scalable Structured CVS (SS-CVS) (Li et al., 2020) for (A) Akiyo, (B) Bus, (C) Football, (D) Foreman, (E) BlowingBubble, and (F) ParkScene sequences. Note that the length L of GOP is set to be 10.
Table 2 lists the average encoding time (s/frame) and decoding time (s/frame) on video sequences with different resolutions for the proposed CVS system, SS-CVS, and MH-RTIK. We compute the average execution time on the range [0.1, 0.5] of subrate SNK for the proposed CVS system and compare it with that of MH-RTIK for CIF sequences. The encoding speed of the proposed CVS system is slowed down due to the contexts-based adaptive allocation, and its encoding time is 0.63 s per frame, larger than that of MH-RTIK. Assisted by the simple linear recovery, the proposed CVS system reduces the decoding complexity, and only costs 4.48 s to reconstruct a video frame, however, MH-RTIK requires 19.34 s per frame. Under the subrate SNK = 0.6, the execution time of the proposed CVS algorithm is compared with that of SS-CVS for the CIF, QWVGA, and 1080P video sequences, respectively. Compared with SS-CVS, the proposed CVS system costs less encoding time, and the encoding time does not dramatically increase as the resolution increases, e.g., for 1080P sequence, the proposed CVS system only costs 1.83 s per frame, but SS-CVS costs 108.10 s. In SS-CVS, the subspace clustering and the basis derivation are implemented at the encoder, and they lead to more encoding costs than the adaptive allocation in the proposed CVS system. The proposed CVS system costs less decoding time than SS-CVS, and its decoding costs also grow more slowly when compared with SS-CVS, e.g., for 1080P sequence, the proposed CVS system costs 162.47 s per frame, and the SS-CVS costs 401.8 s. The heavy computational burdens for SS-CVS derive from the non-linear subspace learning, but the decoding complexity of the proposed CVS system is limited benefiting from the linear recovery and prediction. From the above, we can see that the proposed CVS system still keeps a low computational complexity while providing better rate-distortion performance.
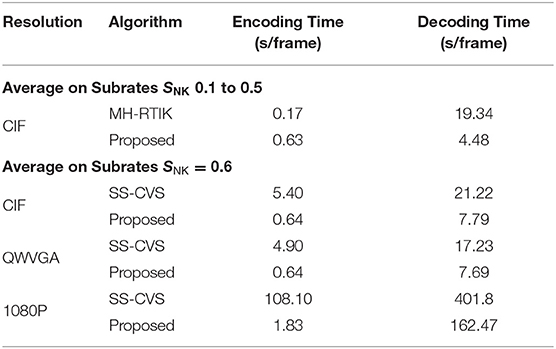
Table 2. Average encoding time (s/frame) and decoding time (s/frame) on video sequences with different resolutions for the proposed CVS system, SS-CVS (Li et al., 2020), and MH-RTIK (Chen C. et al., 2020).
5. Conclusion
In this article, a context-based CVS system is proposed to improve the visual quality of the reconstructed video sequences. At the encoder, the CS measurements are adaptively allocated for blocks according to the contexts of video frames. Innovatively, the contexts are extracted by CS measurements. Although the extraction of contexts is independent of original pixels, these contexts can still better reveal the structural complexity of each block. To guarantee better rate-distortion performance, the zero-padding DPCM is proposed to quantize these adaptive measurements. At the decoder, the key frames are reconstructed by linear recovery, and these non-key frames are reconstructed by MH prediction. Thanks to the effectiveness of context-based adaptive allocation, the simple recovery schemes also provide the comfortable visual quality. Experimental results show that the proposed CVS system improves the rate-distortion performances when compared with two state-of-the-art CVS systems, including MH-RTIK and SS-CVS, and guarantees a low computational complexity.
As the research in this article is exploratory, there are many intriguing questions that future work should consider. First, the estimation of block sparsity should be analyzed in mathematics. Second, we will investigate how to fuse the quantization into adaptive allocation. More importantly, we will deploy the adaptive CVS system on an actual hardware platform.
Data Availability Statement
The original contributions presented in the study are included in the article/Supplementary Material, further inquiries can be directed to the corresponding author/s.
Author Contributions
RL: designed the study and drafted the manuscript. YY: conducted experiments and analyzed the data. FS: critically reviewed and improved the manuscript. All authors have read and approved the final version of the manuscript.
Funding
This work was supported in part by the Project of Science and Technology, Department of Henan Province in China (212102210106), National Natural Science Foundation of China (31872704), Innovation Team Support Plan of University Science and Technology of Henan Province in China (19IRTSTHN014), and Guangxi Key Laboratory of Wireless Wideband Communication and Signal Processing of China.
Conflict of Interest
The authors declare that the research was conducted in the absence of any commercial or financial relationships that could be construed as a potential conflict of interest.
Publisher's Note
All claims expressed in this article are solely those of the authors and do not necessarily represent those of their affiliated organizations, or those of the publisher, the editors and the reviewers. Any product that may be evaluated in this article, or claim that may be made by its manufacturer, is not guaranteed or endorsed by the publisher.
Supplementary Material
The Supplementary Material for this article can be found online at: https://www.frontiersin.org/articles/10.3389/fpls.2022.849606/full#supplementary-material
References
Akila, I., Sivakumar, A., and Swaminathan, S. (2017). “Automation in plant growth monitoring using high-precision image classification and virtual height measurement techniques,” in 2017 International Conference on Innovations in Information, Embedded and Communication Systems (ICIIECS) (Coimbatore), 1–4.
Azghani, M., Karimi, M., and Marvasti, F. (2016). Multihypothesis compressed video sensing technique. IEEE Trans. Circuits Syst. Video Technol. 26, 627–635. doi: 10.1109/TCSVT.2015.2418586
Baraniuk, R. G. (2007). Compressive sensing. IEEE Signal Process. Mag. 24, 118–121. doi: 10.1109/MSP.2007.4286571
Baraniuk, R. G., Goldstein, T., Sankaranarayanan, A. C., Studer, C., Veeraraghavan, A., and Wakin, M. B. (2017). Compressive video sensing: algorithms, architectures, and applications. IEEE Signal Process. Mag. 34, 52–66. doi: 10.1109/MSP.2016.2602099
Becker, S., and Bobin, J., C. E. (2011). Nesta: a fast and accurate first-order method for sparse recovery. SIAM J. Imag. Sci. 4, 1–39. doi: 10.1137/090756855
Bigot, J., Boyer, C., and Weiss, P. (2016). An analysis of block sampling strategies in compressed sensing. IEEE Trans. Inf. Theory 62, 2125–2139. doi: 10.1109/TIT.2016.2524628
Candès, E. J., and Wakin, M. B. (2008). An introduction to compressive sampling. IEEE Signal Process. Mag. 25, 21–30. doi: 10.1109/MSP.2007.914731
Chen, C., Tramel, E. W., and Fowler, J. E. (2011). “Compressed-sensing recovery of images and video using multihypothesis predictions,” in 2011 Conference Record of the Forty Fifth Asilomar Conference on Signals, Systems and Computers (ASILOMAR) (Pacific Grove, CA), 1193–1198.
Chen, C., Zhou, C., Liu, P., and Zhang, D. (2020). Iterative reweighted tikhonov-regularized multihypothesis prediction scheme for distributed compressive video sensing. IEEE Trans. Circuits Syst. Video Technol. 30, 1–10. doi: 10.1109/TCSVT.2018.2886310
Chen, Y., Huang, T.-Z., He, W., Yokoya, N., and Zhao, X.-L. (2020). Hyperspectral image compressive sensing reconstruction using subspace-based nonlocal tensor ring decomposition. IEEE Trans. Image Process. 29, 6813–6828. doi: 10.1109/TIP.2020.2994411
Deng, C., Zhang, Y., Mao, Y., Fan, J., Suo, J., Zhang, Z., et al. (2021). Sinusoidal sampling enhanced compressive camera for high speed imaging. IEEE Trans. Pattern Anal. Mach. Intell. 43, 1380–1393. doi: 10.1109/TPAMI.2019.2946567
Do, T. T., Chen, Y., Nguyen, D. T., Nguyen, N., Gan, L., and Tran, T. D. (2009). “Distributed compressed video sensing,” in 2009 16th IEEE International Conference on Image Processing (ICIP) (Baltimore, MD), 1393–1396.
Do, T. T., Gan, L., Nguyen, N. H., and Tran, T. D. (2012). Fast and efficient compressive sensing using structurally random matrices. IEEE Trans. Signal Process. 60, 139–154. doi: 10.1109/TSP.2011.2170977
Gan, L. (2007). “Block compressed sensing of natural images,” in 2007 15th International Conference on Digital Signal Processing (Cardiff), 403–406.
Gao, X., Zhang, J., Che, W., Fan, X., and Zhao, D. (2015). “Block-based compressive sensing coding of natural images by local structural measurement matrix,” in 2015 Data Compression Conference (Snowbird, UT), 133–142.
Girod, B., Aaron, A., Rane, S., and Rebollo-Monedero, D. (2005). Distributed video coding. Proc. IEEE 93, 71–83. doi: 10.1109/JPROC.2004.839619
Grimblatt, V., Jégo, C., Ferré, G., and Rivet, F. (2021). How to feed a growing population—an iot approach to crop health and growth. IEEE J. Emerg. Sel. Top. Circuits Syst. 11, 435–448. doi: 10.1109/JETCAS.2021.3099778
Guo, L., Liu, Y., Hao, H., Han, J., and Liao, T. (2018). “Growth monitoring and planting decision supporting for pear during the whole growth stage based on pie-landscape system,” in 2018 7th International Conference on Agro-geoinformatics (Agro-geoinformatics) (Hangzhou), 1–4.
James, J., and Maheshwar P, M. (2016). “Plant growth monitoring system, with dynamic user-interface,” in 2016 IEEE Region 10 Humanitarian Technology Conference (R10-HTC) (Agra), 1–5.
Li, Y., Dai, W., Zou, J., Xiong, H., and Zheng, Y. F. (2020). Scalable structured compressive video sampling with hierarchical subspace learning. IEEE Trans. Circuits Syst. Video Technol. 30, 3528–3543. doi: 10.1109/TCSVT.2019.2939370
Liu, Y., Yuan, X., Suo, J., Brady, D. J., and Dai, Q. (2019). Rank minimization for snapshot compressive imaging. IEEE Trans. Pattern Anal. Mach. Intell. 41, 2990–3006. doi: 10.1109/TPAMI.2018.2873587
Mun, S., and Fowler, J. E. (2012). “Dpcm for quantized block-based compressed sensing of images,” in 2012 Proceedings of the 20th European Signal Processing Conference (EUSIPCO) (Bucharest), 1424–1428.
Okayasu, T., Nugroho, A. P., Sakai, A., Arita, D., Yoshinaga, T., Taniguchi, R.-I., et al. (2017). “Affordable field environmental monitoring and plant growth measurement system for smart agriculture,” in 2017 Eleventh International Conference on Sensing Technology (ICST) (Sydney, NSW), 1–4.
Palangi, H., Ward, R., and Deng, L. (2016). Distributed compressive sensing: a deep learning approach. IEEE Trans. Signal Process. 64, 4504–4518. doi: 10.1109/TSP.2016.2557301
Peng, Y., Yang, M., Zhao, G., and Cao, G. (2022). Binocular-vision-based structure from motion for 3-d reconstruction of plants. IEEE Geosci. Remote Sens. Lett. 19, 1–5. doi: 10.1109/LGRS.2021.3105106
Piermattei, L., Karel, W., Wang, D., Wieser, M., Mokros, M., Surový, P., et al. (2019). Terrestrial structure from motion photogrammetry for deriving forest inventory data. Remote Sens. 11, 950. doi: 10.3390/rs11080950
Prades-Nebot, J., Ma, Y., and Huang, T. (2009). “Distributed video coding using compressive sampling,” in 2009 Picture Coding Symposium (Chicago, IL), 1–4.
Qiu, W., Zhou, J., Zhao, H., and Fu, Q. (2015). Three-dimensional sparse turntable microwave imaging based on compressive sensing. IEEE Geosci. Remote Sens. Lett. 12, 826–830. doi: 10.1109/LGRS.2014.2363238
Rayhana, R., Xiao, G. G., and Liu, Z. (2021). Printed sensor technologies for monitoring applications in smart farming: a review. IEEE Trans. Instrum. Meas. 70, 1–19. doi: 10.1109/TIM.2021.3112234
Romano, Y., and Elad, M. (2016). Con-patch: when a patch meets its context. IEEE Trans. Image Process. 25, 3967–3978. doi: 10.1109/TIP.2016.2576402
Sajith, V. V. V., Gopalakrishnan, E. A., Sowmya, V., and Soman K. P. (2019). “A complex network approach for plant growth analysis using images,” in 2019 International Conference on Communication and Signal Processing (ICCSP) (Chennai), 0249–0253.
Shechtman, E., and Irani, M. (2007). “Matching local self-similarities across images and videos,” in 2007 IEEE Conference on Computer Vision and Pattern Recognition (Minneapolis, MN), 1–8.
Somov, A., Shadrin, D., Fastovets, I., Nikitin, A., Matveev, S., Seledets, I., et al. (2018). Pervasive agriculture: iot-enabled greenhouse for plant growth control. IEEE Pervasive Comput. 17, 65–75. doi: 10.1109/MPRV.2018.2873849
Sullivan, G. J., Ohm, J.-R., Han, W.-J., and Wiegand, T. (2012). Overview of the high efficiency video coding (hevc) standard. IEEE Trans. Circuits syst. Video Technol. 22, 1649–1668. doi: 10.1109/TCSVT.2012.2221191
Tachella, J., Altmann, Y., Márquez, M., Arguello-Fuentes, H., Tourneret, J.-Y., and McLaughlin, S. (2020). Bayesian 3d reconstruction of subsampled multispectral single-photon lidar signals. IEEE Trans. Comput. Imag. 6, 208–220. doi: 10.1109/TCI.2019.2945204
Taimori, A., and Marvasti, F. (2018). Adaptive sparse image sampling and recovery. IEEE Trans. Comput. Imag. 4, 311–325. doi: 10.1109/TCI.2018.2833625
Tramel, E. W., and Fowler, J. E. (2011). “Video compressed sensing with multihypothesis,” in 2011 Data Compression Conference (Snowbird, UT), 193–202.
Tran, D. T., Yamaç, M., Degerli, A., Gabbouj, M., and Iosifidis, A. (2021). Multilinear compressive learning. IEEE Trans. Neural Netw. Learn. Syst. 32, 1512–1524. doi: 10.1109/TNNLS.2020.2984831
Trevisi, M., Akbari, A., Trocan, M., Rodríguez-Vázquez, A., and Carmona-Galán, R. (2020). Compressive imaging using rip-compliant cmos imager architecture and landweber reconstruction. IEEE Trans. Circuits Syst. Video Technol. 30, 387–399. doi: 10.1109/TCSVT.2019.2892178
Unde, A. S., and Pattathil, D. P. (2020). Adaptive compressive video coding for embedded camera sensors: compressed domain motion and measurements estimation. IEEE Trans. Mob. Comput. 19, 2250–2263. doi: 10.1109/TMC.2019.2926271
Yang, Y., Sun, J., Li, H., and Xu, Z. (2020). Admm-csnet: a deep learning approach for image compressive sensing. IEEE Trans. Pattern Anal. Mach. Intell. 42, 521–538. doi: 10.1109/TPAMI.2018.2883941
Yu, Y., Wang, B., and Zhang, L. (2010). Saliency-based compressive sampling for image signals. IEEE Signal Process. Lett. 17, 973–976. doi: 10.1109/LSP.2010.2080673
Zammit, J., and Wassell, I. J. (2020). Adaptive block compressive sensing: Toward a real-time and low-complexity implementation. IEEE Access 8, 120999–121013. doi: 10.1109/ACCESS.2020.3006861
Zhang, J., Zhao, D., and Jiang, F. (2013). “Spatially directional predictive coding for block-based compressive sensing of natural images,” in 2013 IEEE International Conference on Image Processing (Melbourne, VIC), 1021–1025.
Zhang, M., Wang, X., Chen, X., and Zhang, A. (2018). The kernel conjugate gradient algorithms. IEEE Trans. Signal Process. 66, 4377–4387. doi: 10.1109/TSP.2018.2853109
Zhang, P., Gan, L., Sun, S., and Ling, C. (2015). Modulated unit-norm tight frames for compressed sensing. IEEE Trans. Signal Process. 63, 3974–3985. doi: 10.1109/TSP.2015.2425809
Zhang, R., Wu, S., Wang, Y., and Jiao, J. (2020). High-performance distributed compressive video sensing: Jointly exploiting the hevc motion estimation and the ℓ1-ℓ1 reconstruction. IEEE Access 8, 31306–31316. doi: 10.1109/ACCESS.2020.2973392
Zhao, Z., Xie, X., Liu, W., and Pan, Q. (2020). A hybrid-3d convolutional network for video compressive sensing. IEEE Access 8, 20503–20513. doi: 10.1109/ACCESS.2020.2969290
Keywords: Internet of Things, visual sensor, Compressive Video Sensing, context extraction, linear recovery, plant monitoring
Citation: Li R, Yang Y and Sun F (2022) Green Visual Sensor of Plant: An Energy-Efficient Compressive Video Sensing in the Internet of Things. Front. Plant Sci. 13:849606. doi: 10.3389/fpls.2022.849606
Received: 06 January 2022; Accepted: 24 January 2022;
Published: 28 February 2022.
Edited by:
Yu Xue, Nanjing University of Information Science and Technology, ChinaReviewed by:
Romany Mansour, The New Valley University, EgyptZijian Qiao, Ningbo University, China
Khan Muhammad, Sejong University, South Korea
Copyright © 2022 Li, Yang and Sun. This is an open-access article distributed under the terms of the Creative Commons Attribution License (CC BY). The use, distribution or reproduction in other forums is permitted, provided the original author(s) and the copyright owner(s) are credited and that the original publication in this journal is cited, in accordance with accepted academic practice. No use, distribution or reproduction is permitted which does not comply with these terms.
*Correspondence: Ran Li, bGlyYW5AeHludS5lZHUuY24=
 Ran Li
 Yihao Yang
 Fengyuan Sun