 Huifang Song1†
 Ake Liu
- 1Department of Life Sciences, Changzhi University, Changzhi, China
- 2Key Laboratory of State Forestry and Grassland Administration on Tropical Forestry Research, Research Institute of Tropical Forestry, Chinese Academy of Forestry, Guangzhou, China
Jasmonate ZIM-domain (JAZ) proteins act as inhibitory factors of the jasmonic acid (JA) pathway, which is involved in regulating plant development and defense responses. However, there are no extensive studies available on JAZ genes in sunflower (Helianthus annuus L.). In this study, the phylogenetic analysis of 139 putative JAZ genes from eight plants demonstrated that these JAZs could be divided into five groups (Groups I–V), and the 27 sunflower JAZs (HaJAZs) were classified into these five groups. All groups contained genes from both monocotyledons and dicotyledons, indicating that the emergence of JAZ genes predates the differentiation of monocotyledons and dicotyledons. Both segmental and tandem duplications contributed greatly to this gene family’s expansion in sunflower, especially in Group II. Moreover, the expression profiles of HaJAZ genes under normal conditions, hormone treatments or abiotic stresses were analyzed based on RNA-seq data. HaJAZ2 may be undergoing pseudogenization as a nonfunctional gene because it was not expressed in any tissue. Many HaJAZ genes in roots upregulated their expression when involved in responding to exogenous hormones, especially methyl-jasmonate. The abiotic stress treatments of sunflower showed that HaJAZ5, HaJAZ15, HaJAZ17, HaJAZ20, and HaJAZ21 tend to be sensitive to certain abiotic stresses. HaJAZs from different groups may share similar functions but also exercise their unique functions when responding to abiotic stresses. We speculated that this gene family was conserved in sequence but varied in its expression among duplicated HaJAZ genes, which implies that they may confer neofunctionalization in the adaptation to abiotic stresses; this work provides insight into the resistance of sunflowers and their adaptation to diverse environmental conditions.
Introduction
Phytohormones are the most important endogenous substances for modulating physiological and molecular responses and are thus essential for plant survival (Chini et al., 2007; Wolters and Jurgens, 2009). Among them, jasmonic acid (JA) is involved in plant responses to biotic or abiotic stresses, as well as growth and development (Garrido-Bigotes et al., 2019). The main components of the JA signaling pathway are the coronatine-insensitive 1 (COI1)-JAZ complex receptor and MYC transcription factors (TFs; Chini et al., 2007; Melotto et al., 2008; Chung et al., 2009). Among these components, the inhibitory factor JAZ (JA zinc-finger inflorescence meristem (ZIM)-domain), a key family protein of the JA pathway, comes from the TIFY family (Chung et al., 2009). The TIFY family is also known as ZIM (Vanholme et al., 2007) and can be further divided into four subfamilies (TIFY, ZML, JAZ, and PPD) based on the specific domain compositions (Bai et al., 2011; Zhang et al., 2012). Different subfamilies have varied domain distributions (Bai et al., 2011). For instance, the TIFY subfamily contains only the TIFY domain; the ZML subfamily contains the TIFY, CCT, and C2C2-GATA domains; the PPD subfamily contains TIFY domains but lacks CCT and GATA domains, while comprising N-terminal PPD domains; and the JAZ subfamily contains TIFY and Jas (also named CCT 2) domains.
JAZ proteins are repressor proteins and are the most extensively studied TIFY subfamily among plants. The JA signaling pathway can respond to JA stimulation, causing the binding MYC transcription factor to be released and initiating the transcription of downstream JA-response genes (Santner and Estelle, 2007). JAZ proteins can also bind to other proteins, thus linking the JA signaling pathway with other pathways and thereby affecting gene expression (Thines et al., 2007). Both the TIFY and Jas domains are required for JAZ proteins to function in the JA signaling pathway (Chini et al., 2007). When JA accumulates after exposure to environmental stimuli, this accumulation can accelerate the binding of the SCFCOI1 complex to perceive JA-Ile and hence degrade JAZ proteins via 26S proteasomes. This process can induce the activity of TFs (such as MYC2) to regulate the expression of JA-responsive genes (Chini et al., 2009, Guo et al., 2018a). Therefore, the COI1–JAZ–MYC2 model has been regarded as the most pivotal signal module in the JA pathway. Additionally, JAZ proteins can also recruit TPL (TOPLESS) or TPR (TPL-related protein) repressors through the Novel INteractor of JAZ (NINJA) to repress the expression of TFs without stimulation or JA accumulation (Pauwels et al., 2010).
JAZ plays a key role in the response of plants to biotic and abiotic stresses. In Arabidopsis, JAZ can promote plant growth and development by preventing unrestricted metabolic processes (Guo et al., 2018b). In wheat, JAZ can regulate gene expression and inhibit seed germination (Ju et al., 2019). In rice, OsJAZ1 can act as a transcriptional regulator to improve drought tolerance (Seo et al., 2011). OsJAZ8 is involved in the induction of monoterpene linalool, which makes rice resistant to bacterial blight (Taniguchi et al., 2014). OsJAZ9 is responsive to salt stress or potassium deficiency tolerance in rice (Wu et al., 2015; Singh et al., 2020). Overexpression of OsJAZ8 can increase the salinity tolerance of transgenic seedlings (Peethambaran et al., 2018). OsJAZ13 can suppress the expression of MYC2 and ERF1 to regulate cell death in a JA/ethylene-dependent manner and hence modulate the balance between defense and growth under environmental stresses (Feng et al., 2020). In addition, overexpression of TaJAZ1 enhances the resistance of wheat to powdery mildew (Jing et al., 2019), and overexpression of GhJAZ2 can also enhance the salinity tolerance of transgenic cotton (Sun et al., 2017). In Triticum durum, overexpression of TdTIFY11a can enhance salt tolerance (Ebel et al., 2018).
Sunflower (Helianthus annuus L.) is an annual plant from the family Asteraceae. It is one of the four major oil crops around the world and an important ornamental plant. Due to its strong resistance to abiotic stresses, sunflower can serve as an important genetic resource for determining plant resistance mechanisms and hence improving its resistance (Garrido-Bigotes et al., 2019). In this study, extensive analysis of the sunflower JAZ (HaJAZ) family was performed to understand their diversity, expansion, and evolutionary fate after duplications, as well as defense responses, which may lay a theoretical foundation for the further exploration of sunflower JAZ gene functions and provide a new perspective for sunflower resistance breeding.
Results
Twenty-seven JAZ genes identified in sunflower
In total, 27 HaJAZ genes were identified from the sunflower genome and named according to their physical positions on the chromosomes (Supplementary Figure S1). They were irregularly distributed on 17 sunflower chromosomes. For instance, chromosome 12 (Chr 12) had the highest density of HaJAZ genes (7 members), while only one HaJAZ gene was found on each of five chromosomes (Chr1, Chr2, Chr9, Chr16 and Chr17). Detailed gene information for each HaJAZ is listed in Supplementary Table S1, such as gene length, predicted molecular weight (MW) and isoelectric point (pI). Despite their close evolutionary relationship, HaJAZ proteins and their coding regions varied greatly in length. The protein lengths ranged from 124 to 345 amino acids, and the gene lengths ranged from 824 bp to 6,906 bp (Supplementary Table S1).
For the peptides, two important functional domains were identified among the JAZ-family proteins, namely, TIFY and Jas domains. Figure 1A shows that the TIFY domain was less conserved but had a core TIFYXG motif with two adjacent sites, Val (V) 14 and V16. Moreover, the Gln (Q) 5, Asp (D) 18, Ala (A) 25, and Met (M) 29 sites in the TIFY domain of sunflower were also highly conserved, which was consistent with other species, such as Arabidopsis, rice, and maize (Kynast et al., 2001; Vanholme et al., 2007). In contrast, the Jas motif seems more conserved in sunflower, particularly at the Pro (P) 3, Arg (R) 6, Ser (S) 9, Phe (F) 13, Leu (L) 14, Lys (K) 16, and Arg (R) 20 sites (Figure 1A). Additionally, the sites Pro (P) and Tyr (Y) located at the C-terminus of the Jas motif were also conserved, which can serve as symbols to distinguish the Jas motif of the JAZ subfamily from the divergent motif of the PPD subfamily.

Figure 1. Conserved domains and phylogenetic analyses of the JAZ family in sunflower. (A) The consensus sequences for TIFY and Jas were generated with WebLogo. The numbers at the bottom indicate the positions of amino acid residues in each domain. The height of each letter is proportional to the frequency of the corresponding residue at that position, and the letters are ordered such that the most frequent residue is on top. (B) Phylogenetic tree of JAZ proteins derived from sunflower and seven other plants. Members belonging to the same species are presented with the same label. (C) Numeric comparisons of five group members. The species tree was obtained from TimeTree (http://www.timetree.org/).Theimages of Arabidopsis thaliana, Solanum lycopersicum, and Helianthus annuus were obtained from a previous study (Sucher et al., 2020).
Five groups defined among the JAZ genes of eight species
To reveal the phylogenetic relationships within the JAZ family among different plants, a phylogenetic tree containing JAZ proteins was reconstructed based on the alignment of conserved TIFY and Jas domain sequences derived from eight plants (Figure 1B), including sunflower (27), Arabidopsis (Arabidopsis thaliana, 12), rice (Oryza sativa, 12), maize (Zea mays, 16), wheat (Tricicum aestivum, 36), grape (Vitis vinifera, 11), tomato (Solanum lycopersicum, 12), and Sitka spruce (Picea sitchensis, 13) (Figure 1C). The evolutionary history of these proteins was inferred using the neighbor-joining (NJ) method implemented in Molecular Evolutionary Genetics Analysis (MEGA) 7.0. The tree with the optimal branch length sum (31.45) is shown in Figure 1B. The tree was drawn to scale, and the branch lengths are in the same units as the evolutionary distances used to infer the phylogenetic tree. All ambiguous positions were removed for each sequence pair, and 101 positions were considered in the final dataset.
According to the phylogenetic tree, all 139 JAZ members could be clustered into five groups (Figure 1B; Supplementary Figure S2, Groups I–V). Group II had the maximum member number (35) and the highest percentage of sunflower JAZ proteins (12/27). In this group, 10 HaJAZs clustered together to form one clade, possibly resulting from species-specific expansion. Moreover, the JAZs from dicotyledon plants formed a cluster sister to the genes derived from monocotyledonous plants in Group II. Group I had the lowest number of members and contained only one HaJAZ. Group I contained JAZ members from sunflower, maize, rice, and wheat; sunflower was the only dicotyledonous plant in this group. Among the five groups, only Group IV contained JAZ genes from all eight investigated species. The JAZ genes from Sitka spruce, the outgroup species in this study, were classified into Groups III–V; this may indicate that genes from these groups are more ancient than other genes. Overall, most groups contained both monocotyledons and dicotyledons, indicating that JAZ proteins are distributed among defined groups and that the emergence of JAZ genes predates the differentiation of monocotyledons and dicotyledons.
Moreover, we also examined the gene structures, motif and domain distributions of the HaJAZ family members (Supplementary Figure S3). It showed that the HaJAZ genes of the same group contained more similar exon-intron structures and motif compositions than those from different groups. Among the 10 identified conserved motifs, motifs 1 and 2 were contained in the Jas and TIFY domains, respectively, and were found in all HaJAZ proteins, which may regard as core motifs. All the HaJAZ members contained TIFY and Jas domains, and the HaJAZ12, HaJAZ25 and HaJAZ26 also contained a GATA-type zinc finger located at the C-terminal of the proteins. Totally, all these results can provide further evidence for our classification scheme based only on the results of the phylogenetic analysis.
Tandem and segmental duplications contribute to the expansion of HaJAZ genes
To study the driving forces behind gene family expansion, two duplicated gene patterns were identified among JAZ family members in the sunflower genome, namely, tandem and segmental duplication. Apart from one tandem-duplicated pair (Supplementary Figure S1, HaJAZ19 and HaJAZ18), the remaining 18 pairs were classified as segmental duplications (Figure 2). Among them, many duplicated genes may result from two rounds of duplication events occurring in a chromosome segment, such as HaJAZ4, HaJAZ23, and HaJAZ27. To further determine the extent of selection pressures among duplicated genes, we calculated the synonymous substitution rate (dS) and nonsynonymous substitution rate (dN) values for the 19 duplicated gene pairs. As shown in Supplementary Table S2, the dN/dS (ω) values ranged from 0.015 to 0.549, indicating that all the analyzed gene pairs experienced purifying selection. The tandem duplicated pair possessed the greatest ω ratio values, possibly indicating that these genes experienced more relaxed purifying selection. Additionally, three duplicated gene pairs (HaJAZ9 vs. HaJAZ16, HaJAZ20 vs. HaJAZ16 and HaJAZ4 vs. HaJAZ27) had much higher dS values than the other pairs (Supplementary Table S2). These findings may provide insight into the important contributions of segmental and tandem duplications to JAZ expansion in sunflower.
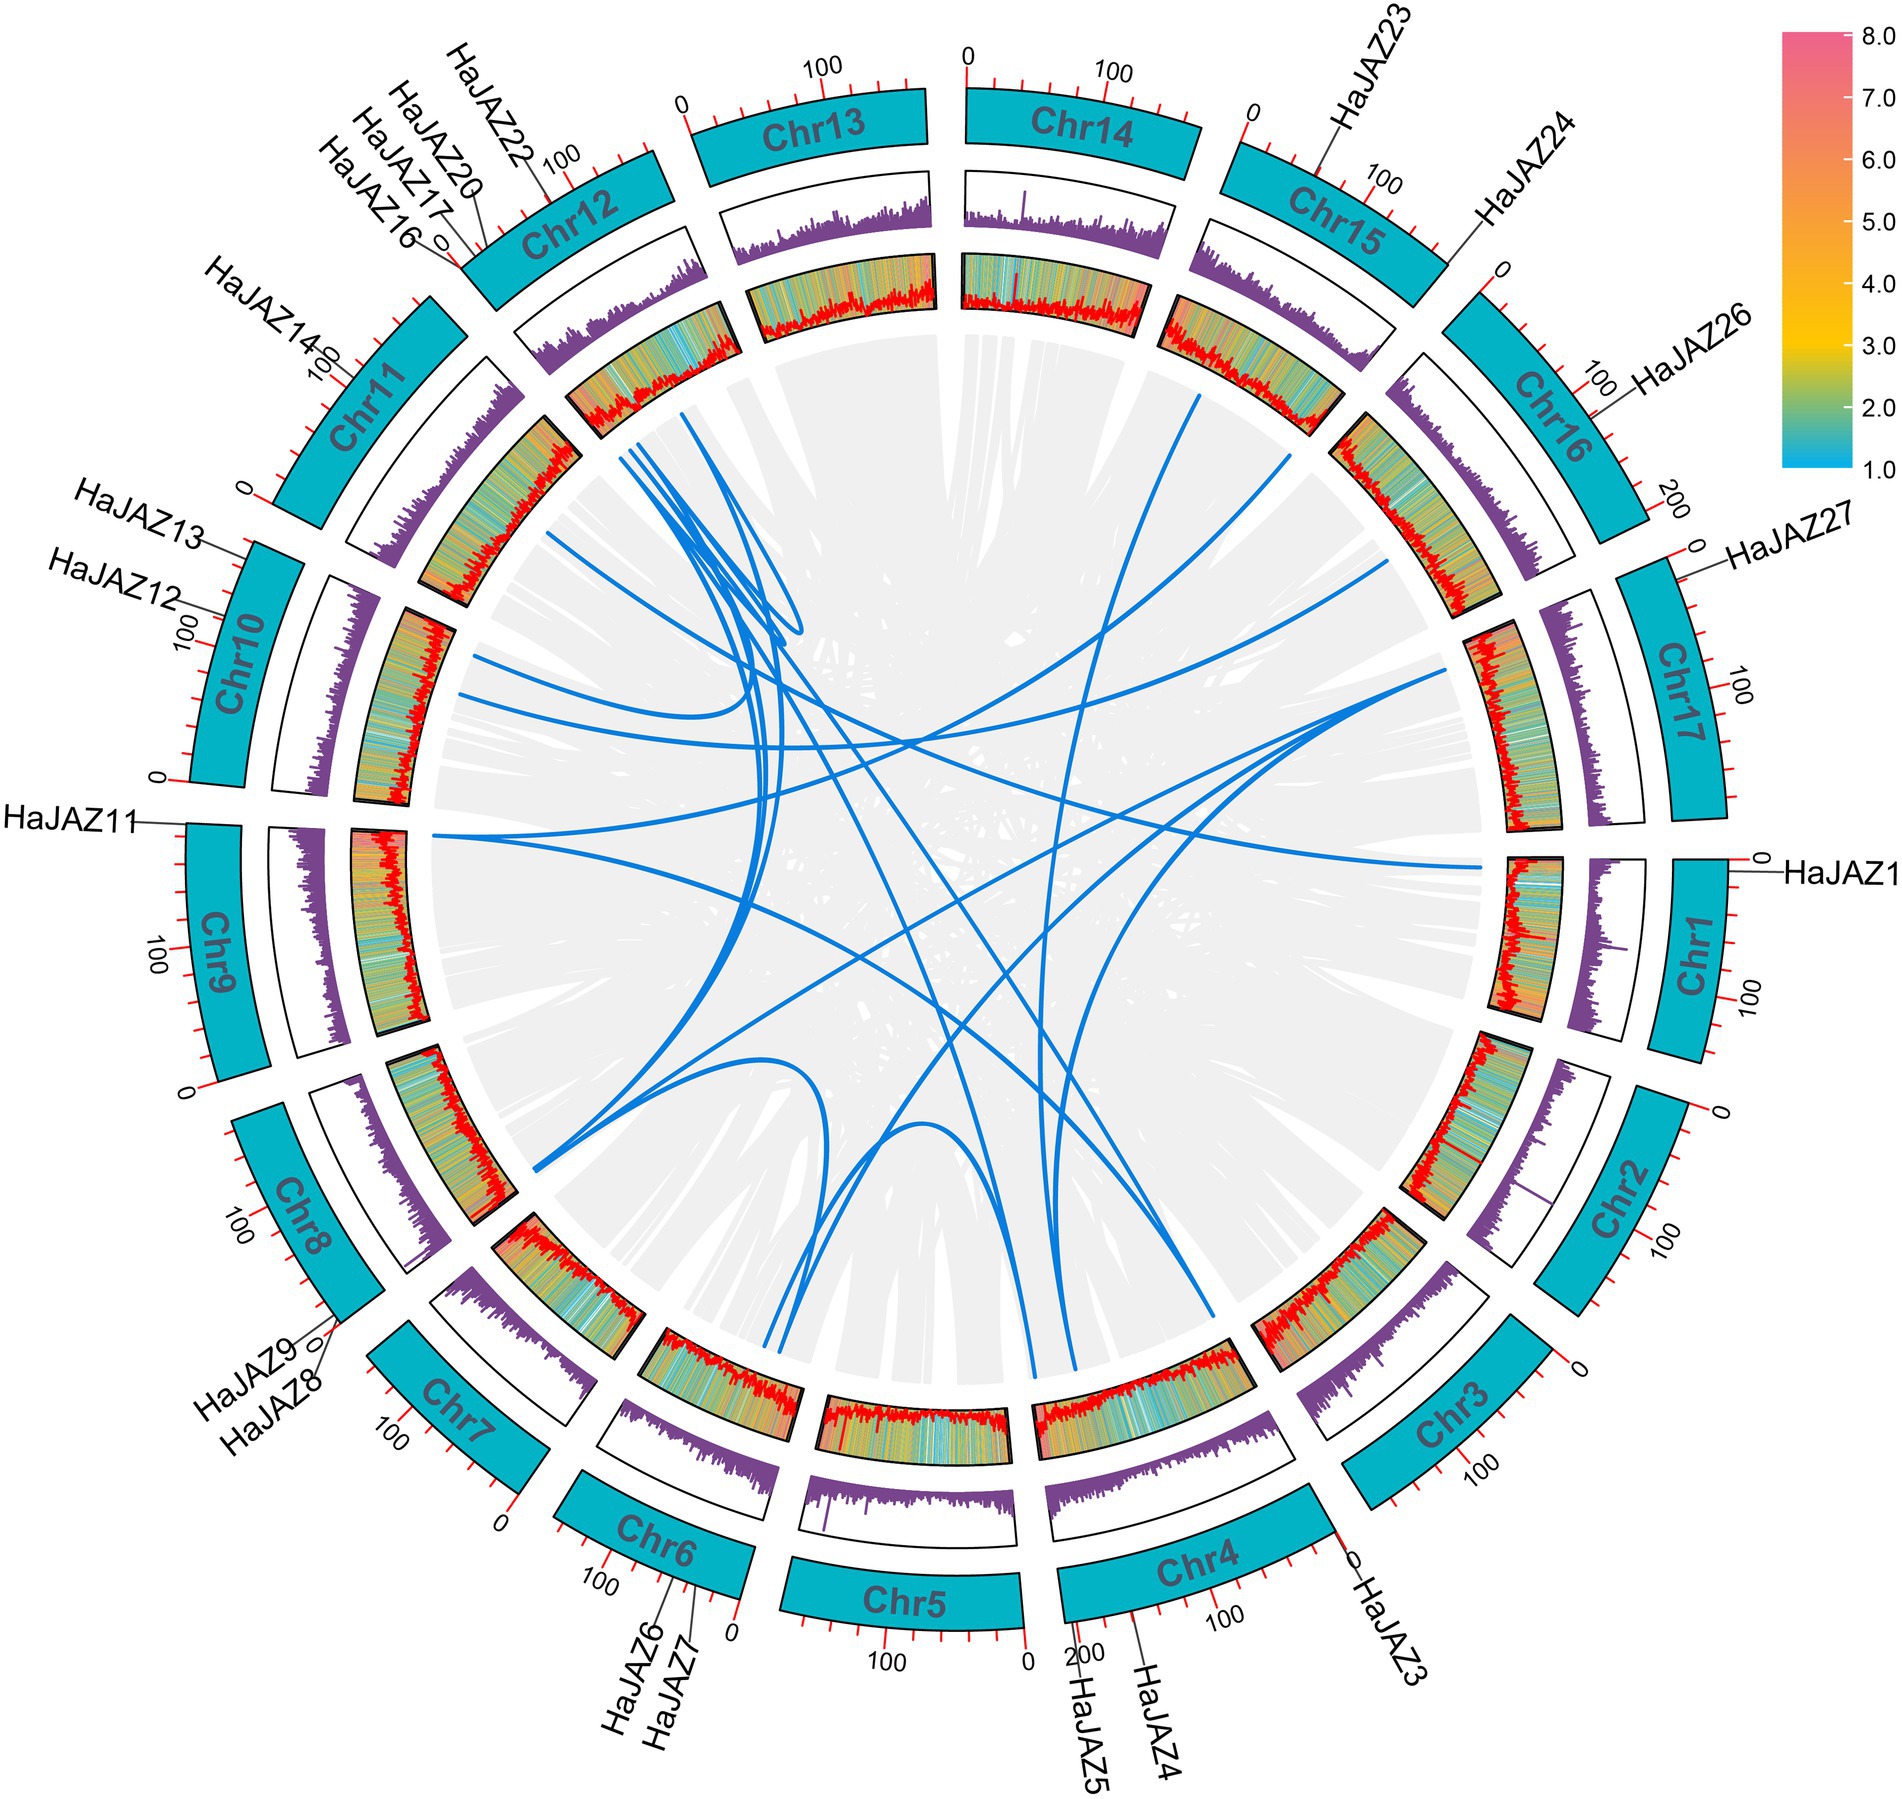
Figure 2. Schematic representation of the collinear relationships of HaJAZ genes. The blue and gray lines indicate the HaJAZs and all genes resulting from segmental duplications. The gene density on each chromosome is depicted by the heatmap next to each rectangle. Each chromosome is indicated with a turquoise rectangle, and the corresponding chromosome number is shown at the top of each chromosome.
Expression patterns of sunflower JAZs in various tissues
We analyzed the expression profiles of all HaJAZs in 11 different tissues, including leaf, root, bract, stem, stamen, pistil, pollen, RF (ray floret) ligule, RF ovary, DF (disc floret) corolla, and DF ovary tissues, using RNA-seq data obtained from a previous study (Badouin et al., 2017). As shown in Figure 3, both the hierarchical clustering analysis results and tau (τ) values showed that the expression patterns of HaJAZ genes could be divided into three clusters. First, more than half of the HaJAZ genes were highly expressed in the majority of the tested sunflower tissues. For example, HaJAZ22 was highly expressed in sunflower stems, DF ovaries, stamens, bracts, and DF corollas. Second, the expression levels of some genes (such as HaJAZ8, HaJAZ2, HaJAZ19, and HaJAZ18) were low or not expressed. In particular, the expression of HaJAZ8 and HaJAZ2 was extremely low in almost all tissues. The expression levels of HaJAZ19 and HaJAZ18 in flower tissues, such as stamens, RF ligules, DF ovaries, bracts, and DF corollas, were higher than the corresponding expression levels in other tissues, indicating that these genes may play a role in flower development in sunflowers. Third, the transcript abundance of JAZ genes was low in the pollen [Figure 3C; only HaJAZ6 and HaJAZ25 had FPKM (fragments per kilobase of exon model per million mapped fragments) values >1].
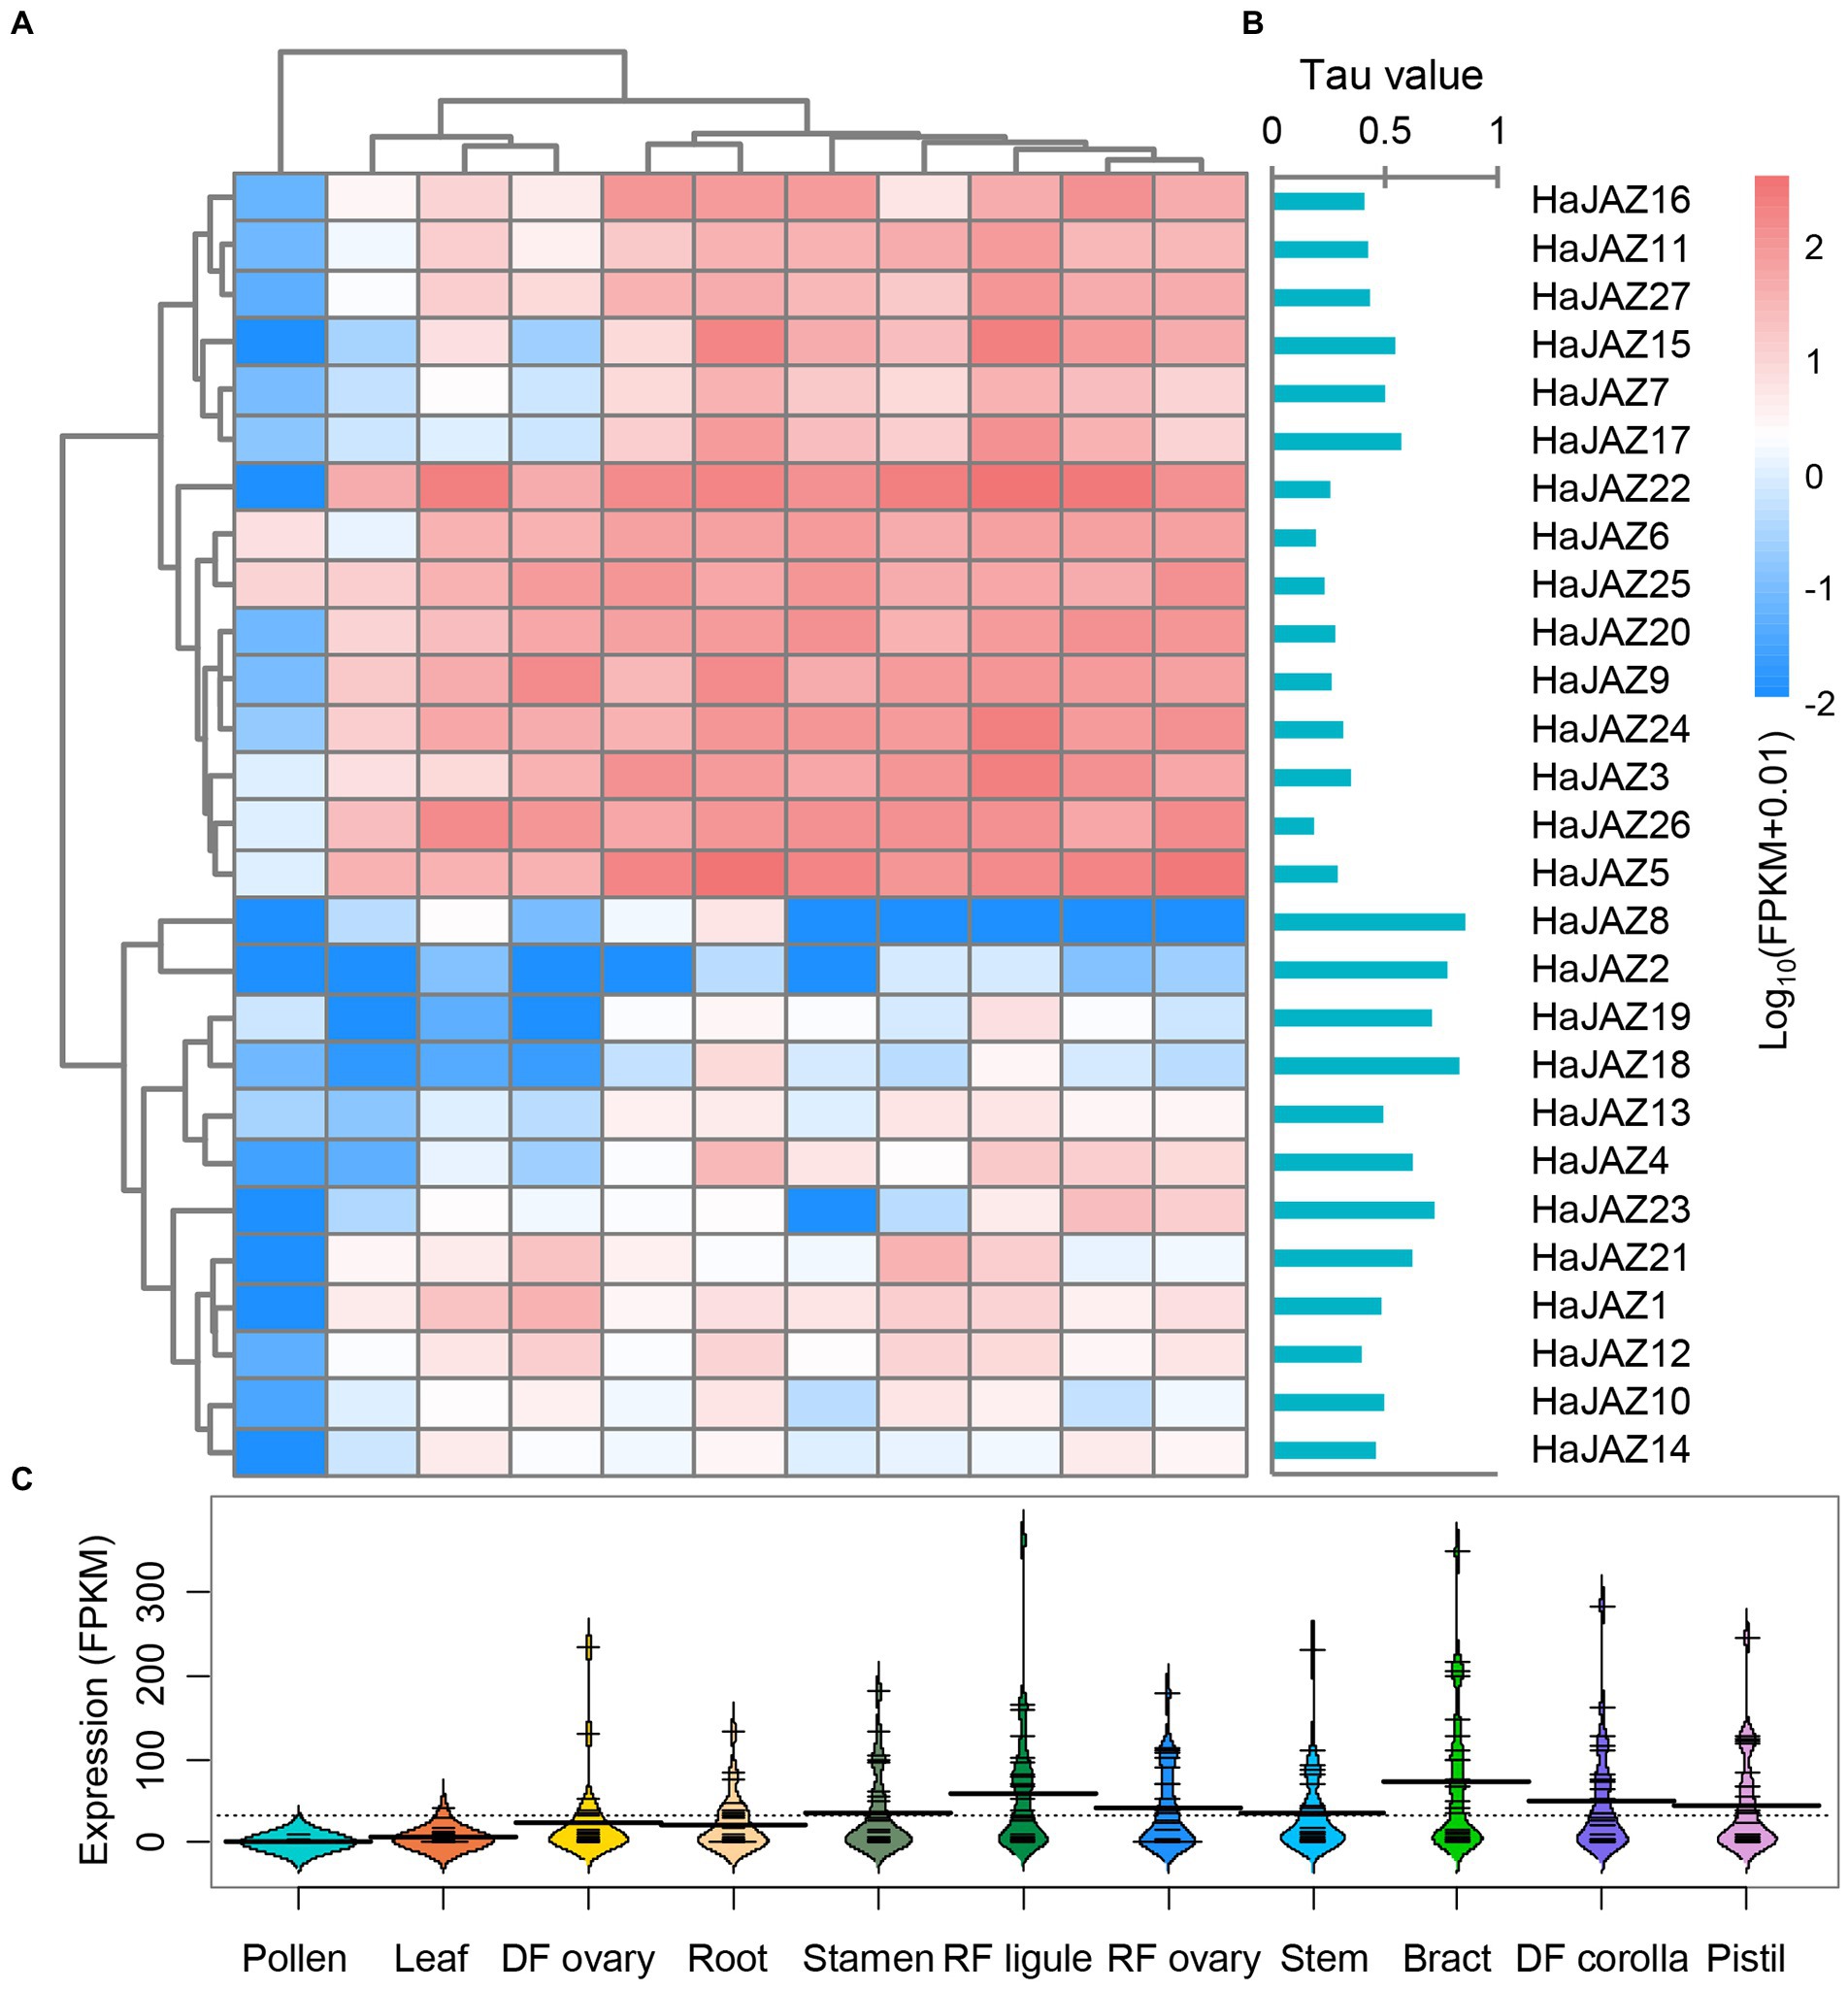
Figure 3. Expression profiles of HaJAZ genes in different tissues. (A) The normalized expression levels of the hierarchical clustering of 27 HaJAZ genes in 11 tissues. The relative expression levels corresponding to the log2-transformed FPKM values after adding a pseudocount of 0.01 are shown. The expression levels are indicated by a graded color scale from blue to red. (B) The τ values were calculated for HaJAZs to identify their tissue-specific expression. Low τ values correspond to widely expressed genes, while high values correspond to tissue-specific genes. (C) The expression values of all the HaJAZ genes in each tissue.
Expression patterns of HaJAZ genes in response to hormones
Accordingly, JAZs participate in the hormone signal transduction and crosstalk of plants, so it is necessary to study the expression patterns of JAZs under various exogenous hormonal treatments, including abscisic acid (ABA), β-indoleacetic acid (IAA), brassinosteroids (BRAS), 1-aminocyclopropane carboxylic acid (ACC), gibberellic acid 3 (GA3), kinetin, methyl-jasmonate (MeJA), and salicylic acid (SA). Figure 4A shows that HaJAZ2 and HaJAZ19 were not expressed in any of the treatment or control samples in either roots or leaves. The majority of HaJAZs expressed moderately upregulated expression under MeJA treatment in roots (such as HaJAZ13, 15, 17, and 4), especially HaJAZ8 and HaJAZ18, and several HaJAZs also had strong responses to ACC in roots. Furthermore, some genes in roots were involved in responding to other exogenous hormones, such as HaJAZ8 and HaJAZ7 to ABA, HaJAZ4 to SA and HaJAZ18 to IAA. These results indicated that the expression levels of HaJAZs were altered in response to various hormone inductions and were involved in the hormone signaling pathway in sunflower.
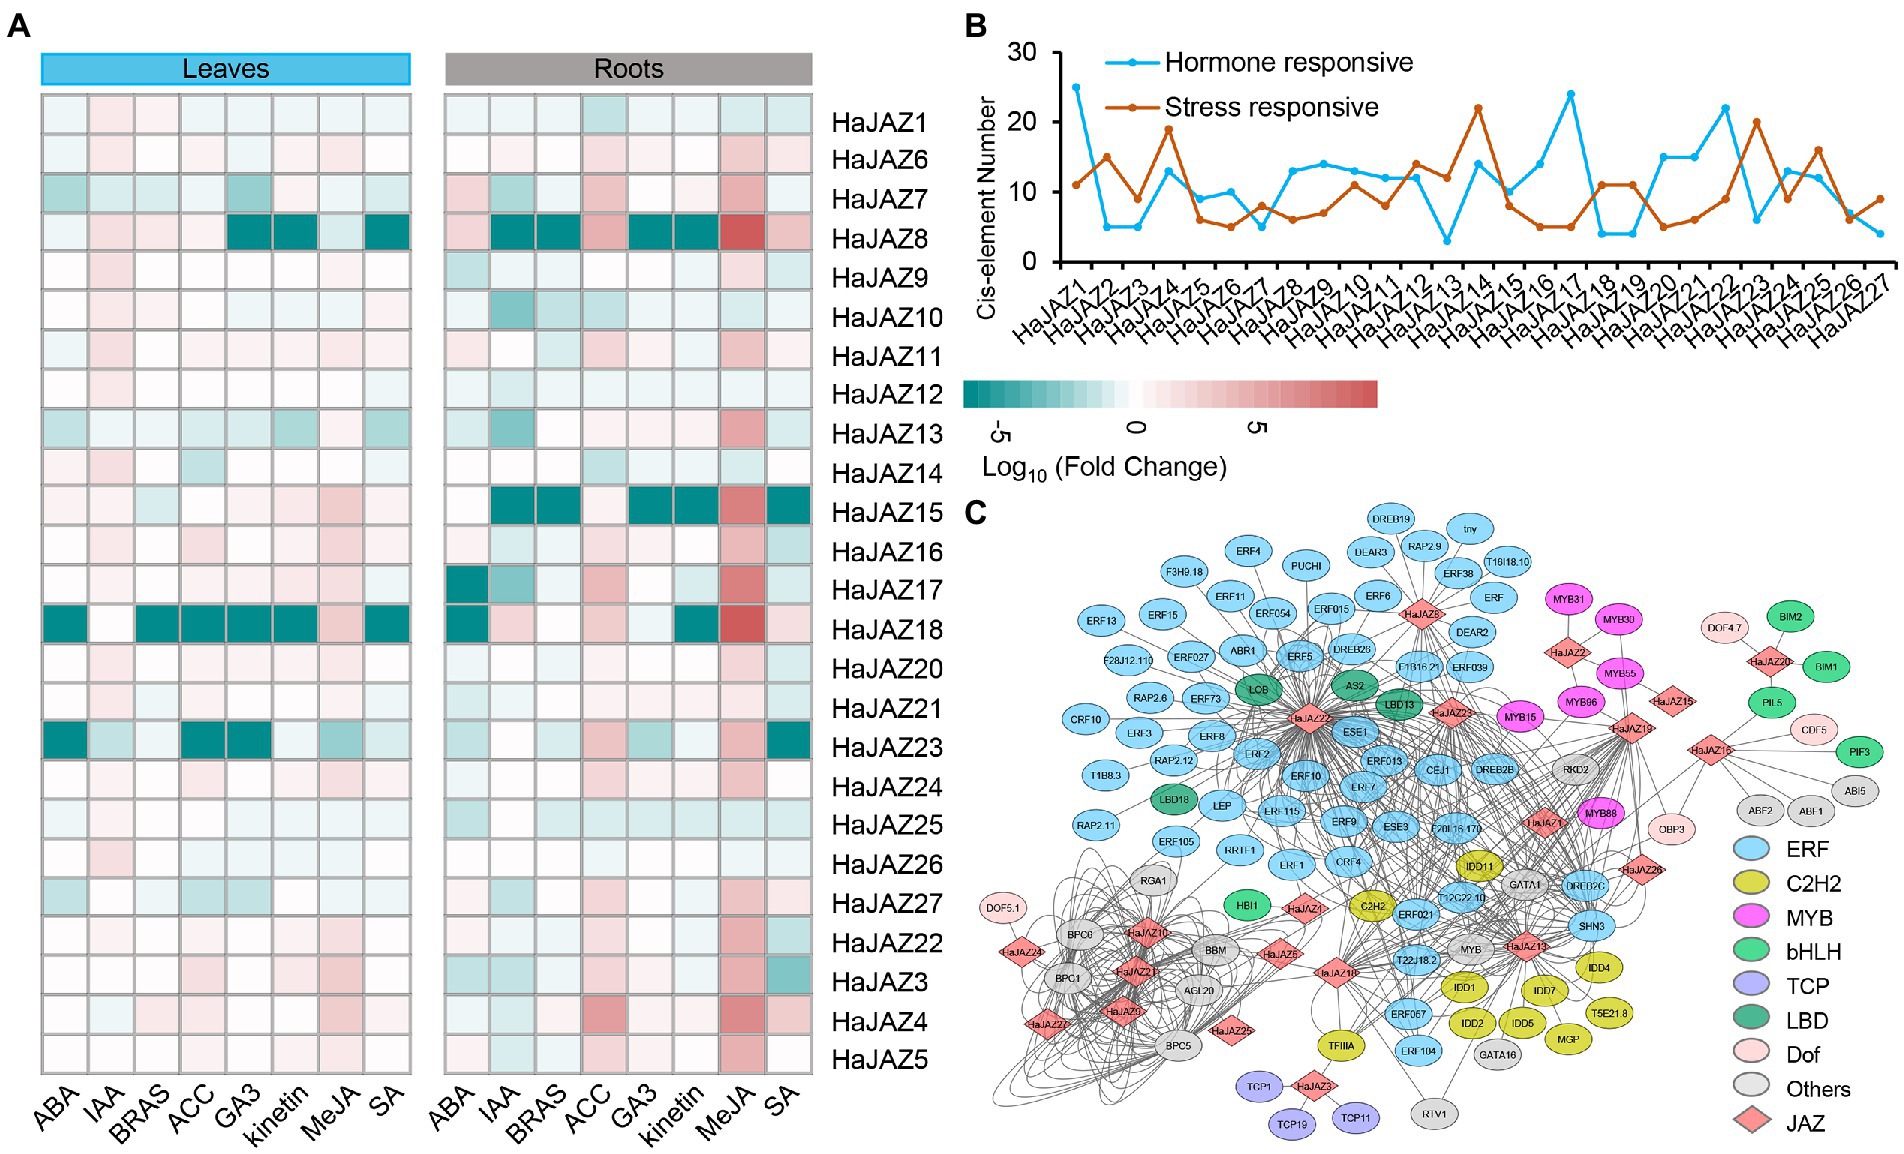
Figure 4. Expression changes in sunflower JAZ genes in response to different hormone treatments in the leaves and roots. (A) Log10-fold changes between treatments were used to present expression changes. The expression levels are illustrated by the graded color scale. (B) Two patterns of cis-elements, hormones, and salt-responsive elements, were predicted for the upstream 2 kb sequence of each HaJAZ gene. (C) The regulation network between HaJAZs and the potential TFs that bind to the HaJAZ promoters.
To explore the regulatory regions, we analyzed the cis-elements in upstream sequences of HaJAZ genes. Five hundred and seventy-six cis-elements of promoters related to environmental stress and hormone-responsive were detected (Figure 4B; Supplementary Table S3). It has been found that 21 HaJAZs (HaJAZ1-3, HaJAZ5-6, HaJAZ8-12, and HaJAZ15-25) had at least one JA-responsive element. Moreover, the promoter regions of 26 HaJAZs (except HaJAZ3) contain abscisic acid-responsive elements (ABREs). Sixteen HaJAZs contained auxin-responsive elements, 13 HaJAZs had gibberellin-responsive elements, and 10 HaJAZs contained salicylic acid-responsive elements (Supplementary Table S3). HaJAZ7, HaJAZ13, HaJAZ23, and HaJAZ27 had JA- and abscisic acid-responsive elements, and their expression was downregulated greatly when treated with ABA, ACC, GA3, kinetin or SA in leaves. For HaJAZ4, HaJAZ8, HaJAZ15, HaJAZ17, and HaJAZ23 in roots, their expression was downregulated greatly when treated with ABA, IAA, and BRAS, but the expression was upregulated greatly when treated with MeJA, especially HaJAZ8 and HaJAZ17 (Figure 4A). The hormone response elements of HaJAZs may play certain functions for their involvement in the hormone response.
We also predicted the potential TFs that bind to the HaJAZ promoters, and found that 102 TFs tend to bind to the regulatory regions of 22 HaJAZ genes (Figure 4C; Supplementary Table S4) and five HaJAZs have no predicted potential TFs (HaJAZ6, HaJAZ7, HaJAZ11, HaJAZ14, and HaJAZ17). The TFs involved in the regulation of HaJAZ22 were the most abundant, and HaJAZ5, HaJAZ12, HaJAZ15, and HaJAZ27 were the least abundant. Interestingly, different TF families have relatively strong binding tendencies to the different HaJAZs. For instance, 55 ERF TFs were mainly involved in the regulation of HaJAZ22, HaJAZ13, HaJAZ8, HaJAZ18, and HaJAZ19 (Figure 4C). Among them, majority of the ERF TFs only bind to HaJAZ22. Moreover, C2H2 members centrally regulate HaJAZ13 and coordinate the regulation of HaJAZ13, HaJAZ18, and HaJAZ19 (Figure 4C). Additionally, the families such as TCP, bHLH, MYB, and LBD can also regulate some certain HaJAZ members.
Expression patterns of HaJAZ genes in response to abiotic stresses
Plants are often subjected to multiple extreme environmental conditions during their growth periods, such as heat, drought, or other abiotic stresses. When under heat, cold, or drought stresses, the growth status of sunflower was not significantly affected. For example, the height of sunflower seedlings was not significantly different compared to those of the control group, and only the leaves showed mild wilting under severe drought, which also indicated that sunflower had strong abiotic stress resistance. Under salinity stress, the seedlings were shorter in height and the leaves wilted to some extent compared with those of the control group. To gain more insight into the role of HaJAZ genes in responding to abiotic stresses, we also analyzed the expression of HaJAZ genes under these four abiotic stress patterns. The results indicated that more than half of the genes exhibited significant expression level changes under these treatments. As shown in Figures 4B, 5, 11 HaJAZ genes were extremely temperature-sensitive (HaJAZ3, HaJAZ4, HaJAZ7, HaJAZ14, HaJAZ15, HaJAZ17, HaJAZ19, HaJAZ20, HaJAZ21, and HaJAZ27), and their expression levels were significantly downregulated following heat or cold treatment. The expression levels of three HaJAZ genes were consistently downregulated in the continuous high-temperature environment (HaJAZ19, HaJAZ21 and HaJAZ27). When under cold treatment, the expression levels of HaJAZ4, HaJAZ14, HaJAZ20, and HaJAZ21 were significantly reduced. HaJAZ15 and HaJAZ17 exhibited expression patterns that first decreased (at 8 h) and then rebounded (16 h − 32 h). In our prediction, eleven HaJAZs (HaJAZ1-3, HaJAZ6, HaJAZ11, HaJAZ15, HaJAZ17, and HaJAZ22-25) contained low-temperature responsive elements (Supplementary Table S3, LRT). Notably, only four genes were identified as differentially expressed genes (DEGs), and their expression levels were consistently downregulated following exposure to drought stress (HaJAZ5) or downregulated their expression in mild drought and then recovered somewhat in severe drought (HaJAZ7, HaJAZ15, and HaJAZ17), and all these genes were downregulated after drought stress and recovered following rehydration (Figure 5). However, twelve HaJAZs (HaJAZ4, HaJAZ7-8, HaJAZ11-13, HaJAZ16, HaJAZ20, HaJAZ22-23 and HaJAZ25-26) contained drought response elements (Figure 4B, MBS). When exposed to salt stress, HaJAZ16, HaJAZ21, and HaJAZ24 were significantly downregulated.
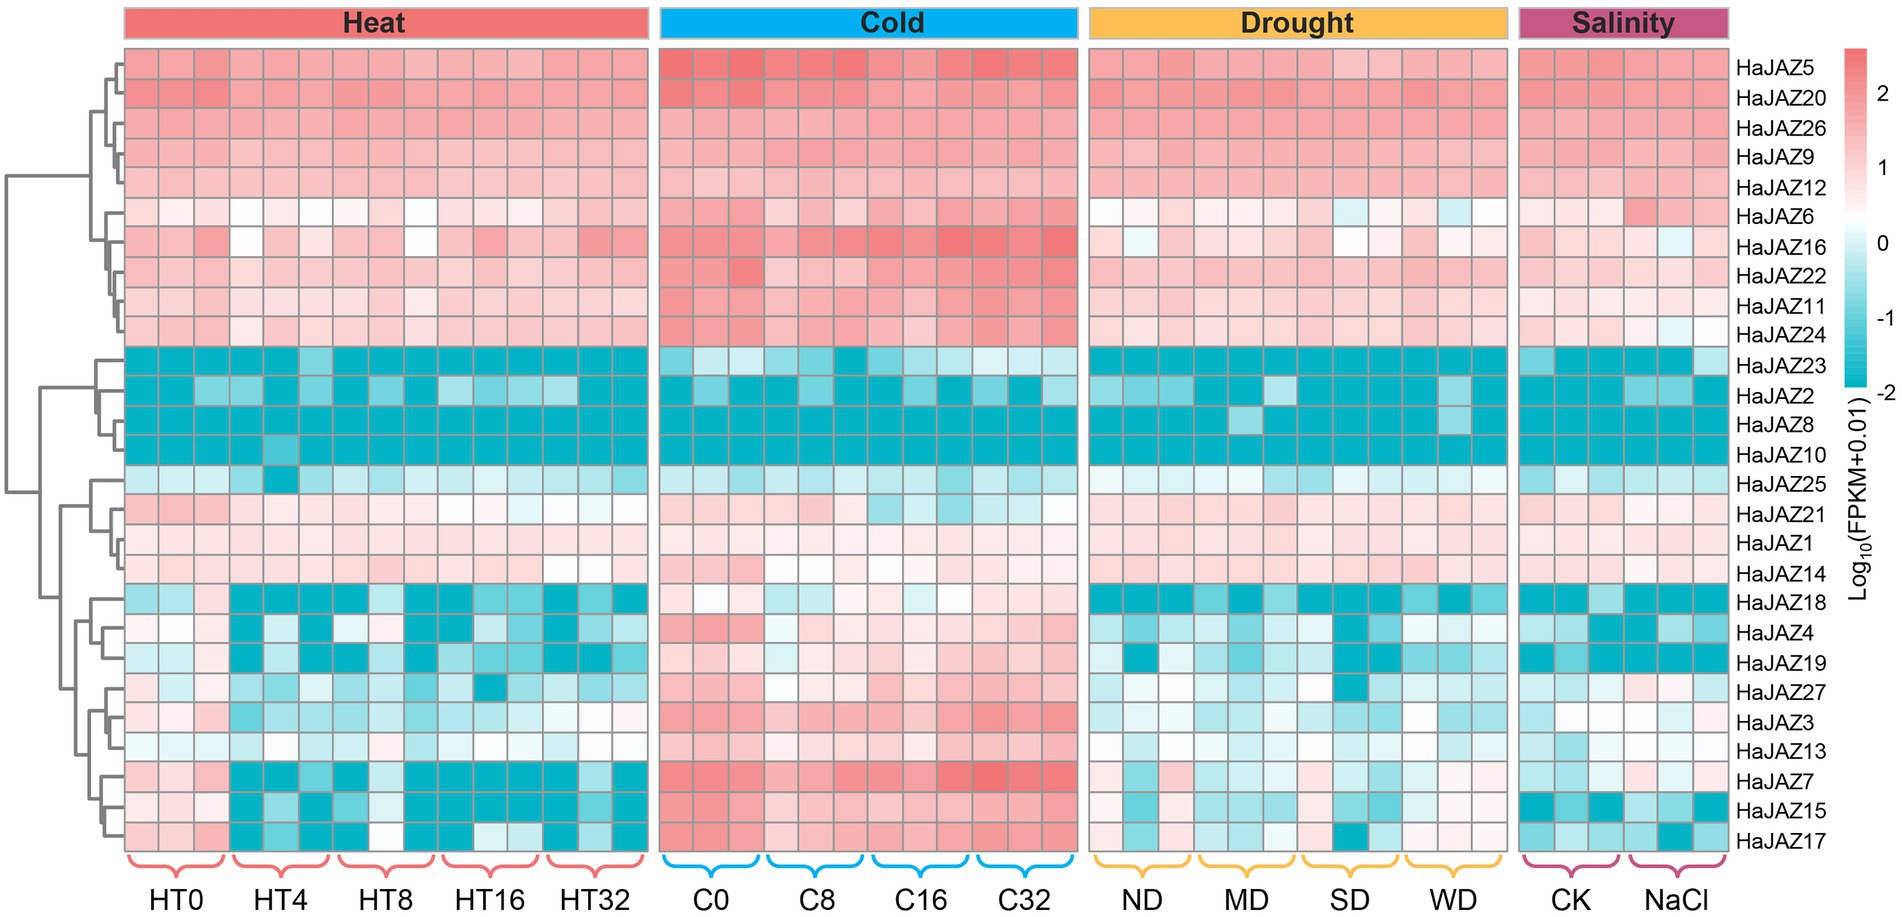
Figure 5. Expression profiles of HaJAZ genes in response to abiotic stress treatments. After sunflower seedlings grew to exhibit six true leaves, we selected uniformly growing seedlings and treated them at 39°C for 4, 8, 16, and 32 h. Seedlings not subjected to these temperature treatments were used as controls (HT0). For cold stress, seedlings with similar growth were selected and treated at 4°C for 8, 16, and 32 h (denoted C8, C16 and C32, respectively). Seedlings not subjected to this low-temperature treatment were selected as controls (C0). The different drought treatments included normal water supply (ND, no drought), mild drought stress (MD), severe drought stress (SD), and rehydration to normal water supply after 3 days of severe drought (WD). These water-control experiments commenced after the sunflower seedlings grew to exhibit new trifoliate leaves, and samples were taken after 5 days of drought stress. For the salinity stress experiments, 250 mmol L−1 NaCl was applied for 2 weeks. Seedlings not subjected to the NaCl treatment were selected as the controls (CK).
Analysis of HaJAZ coexpressed genes in response to abiotic stresses based on WGCNA
To understand the roles of HaJAZs involved in abiotic stresses, we also conducted weighted correlation network analysis (WGCNA) based on these 45 samples under four abiotic stresses using our transcriptome data and found 34 modules. In total, 2,958 genes were coexpressed with 20 HaJAZ genes (Figures 6A–C). HaJAZ3, HaJAZ6, HaJAZ7, and HaJAZ21 were associated with the greatest number of interacting genes. Among the coexpressed genes, 193 TFs were identified, and none of the TF members was found to be coexpressed with HaJAZ12, HaJAZ20, or HaJAZ26 (Figure 6B). As shown in Figure 6A, two separate coexpression networks were constructed among these 17 HaJAZ genes and 193 TFs. Most TF families were ethylene-response elements (ERE), basic helix–loop–helix (bHLH) families (including 9 MYC2 members), MYB-related or NAM, ATAF, and CUC (NAC) families, with more than 10 members in each family. It is worth mentioning that five JA receptor COI1 genes and nine MYC2 genes were significantly correlated with 11 and 18 HaJAZs among these abiotic stresses (Supplementary Table S5, |r| > 0.7, p-value <0.01). The 11 HaJAZs were included in the 18 HaJAZs.
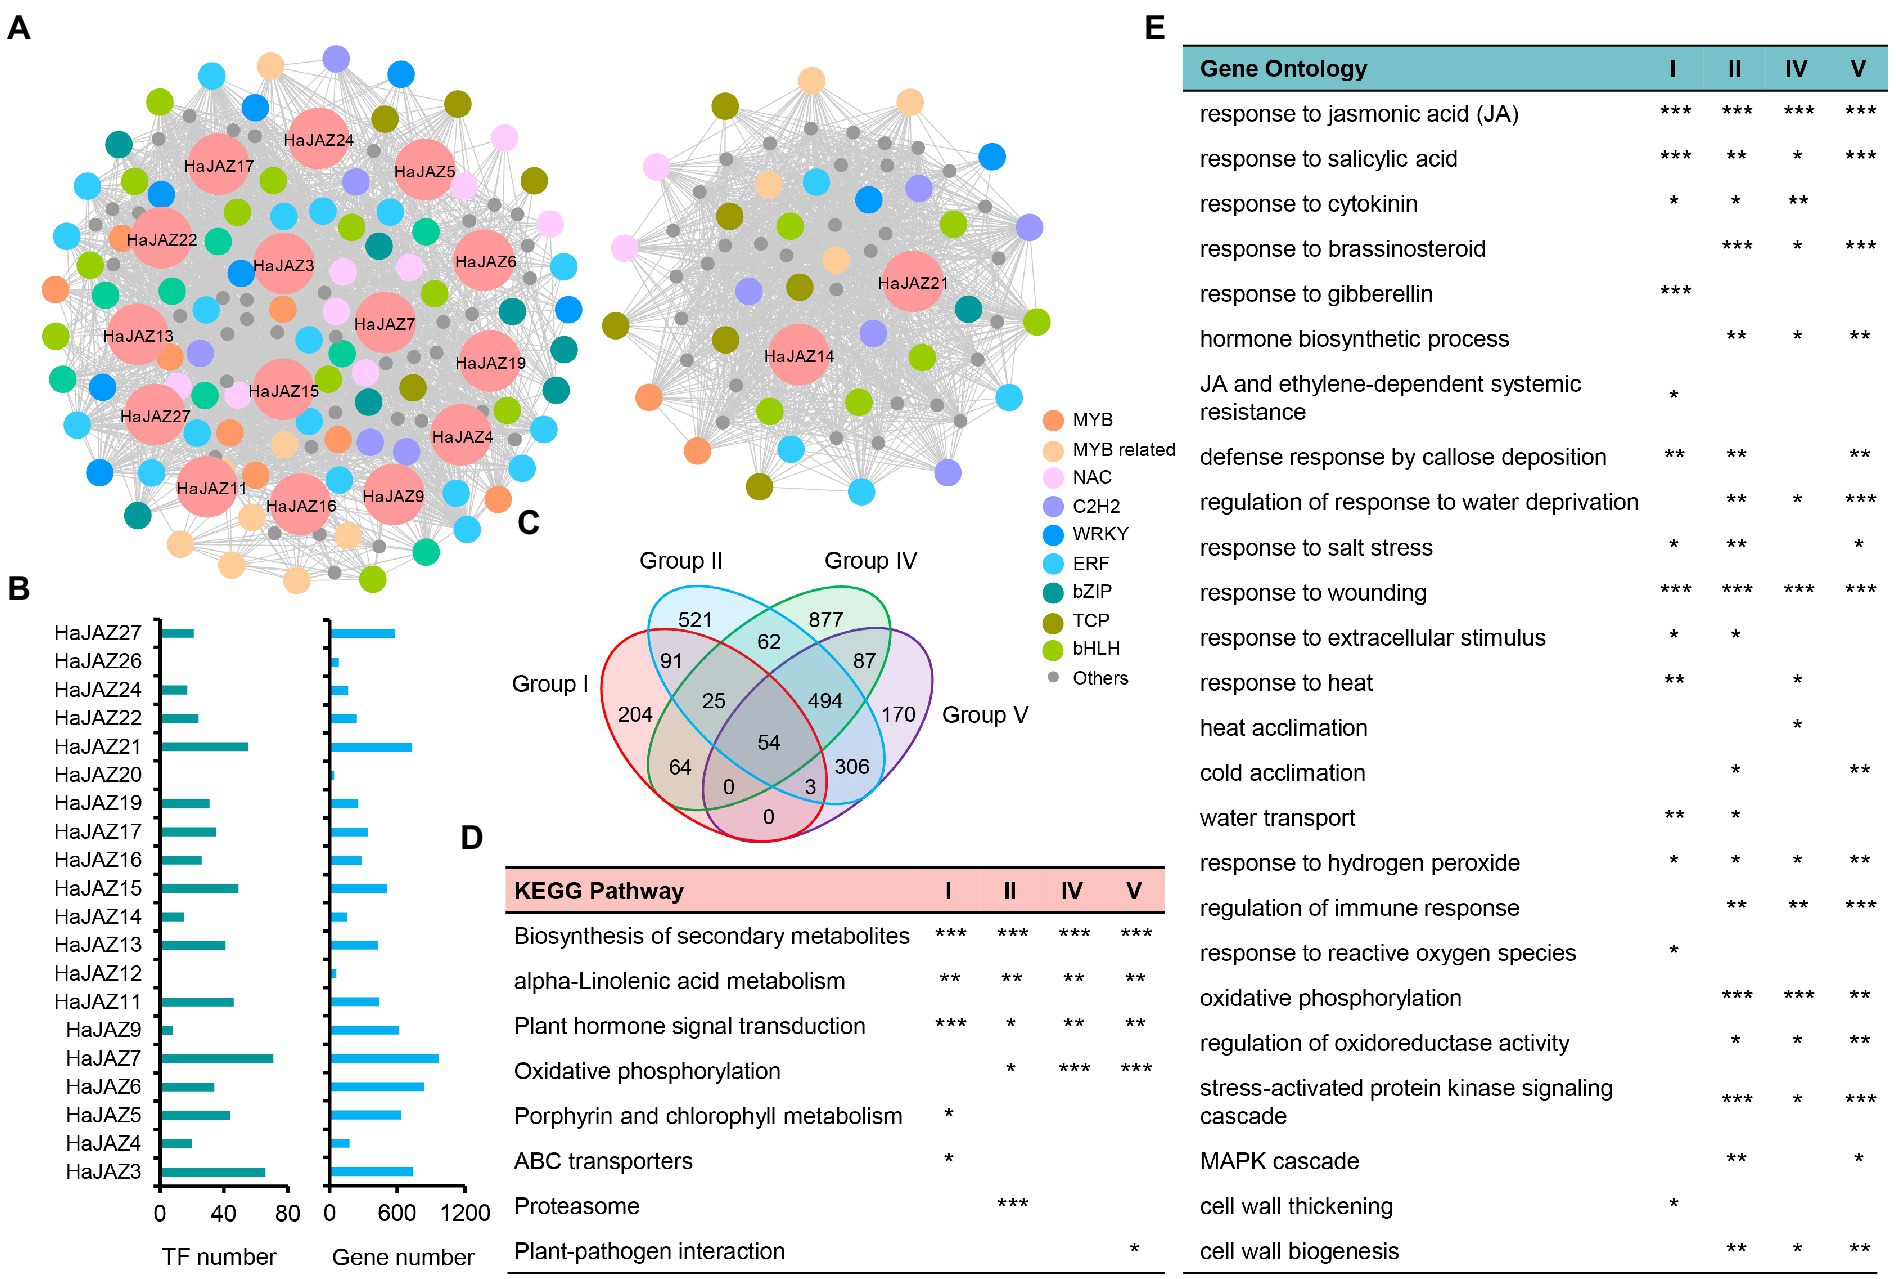
Figure 6. Functional enrichment of genes coexpressed with HaJAZ based on WGCNA. (A) The coexpression network for HaJAZs and their coexpressed genes. ERE: ethylene response elements; bHLH: basic/helix–loop–helix; MYB related; NAC: NAM, ATAF, and CUC; and bZIP: basic leucine zipper. (B) The numbers of those genes and TFs coexpressed with each HaJAZ. (C) Comparison of the coexpressed gene numbers of each JAZ group. (D) The p-values of significantly enriched KEGG pathways are shown. (E) The p-values of significantly enriched GO terms related to hormones, abiotic stress and the cell wall are presented here. *p-value < 0.05; **p-value < 0.01; ***p-value < 0.001.
We further subdivided the coexpressed genes according to the classification of HaJAZs and found that there were 441, 1,556, 1,663, and 1,114 genes coexpressed with Groups I, II, IV, and V, respectively (Figure 6B) and only 54 genes were shared among them (Figure 6C). To study the potential functions of different JAZ groups, we conducted KEGG and GO functional enrichment analyses for these four gene lists. As shown in Figure 6D, all four lists were significantly enriched in biosynthesis of secondary metabolites, alpha-linolenic acid metabolism, and plant hormone signal transduction. These genes coexpressed with II, IV and V were also enriched in oxidative phosphorylation. The genes coexpressed with Group I were also enriched in porphyrin and chlorophyll metabolism and ABC transporters; those with Group II were enriched in proteasome, and those with Group V were enriched in plant–pathogen interaction. From the GO annotation (Figure 6E), all four lists were significantly enriched in response to JA and SA, wounding, and hydrogen peroxide. Groups I, II, and V were also enriched in response to salt stress and defense response by callose deposition. Groups II, IV, and V may be involved in the response to brassinosteroids, water deprivation, hormone biosynthetic processes, regulation of the immune response, oxidative phosphorylation, stress-activated protein kinase signaling cascades, and cell wall biogenesis. However, these genes coexpressed with different groups can be involved in different biological processes. For instance, Group I was enriched in response to gibberellin, reactive oxygen species, and cell wall thickening, and Group IV was enriched in heat acclimation. These results demonstrated that HaJAZs from different groups may share similar functions but also exercise their unique functions when responding to abiotic stresses.
Discussion
Plant adaptations to environmental alterations generally rely on signaling networks. As important negative regulators impeding the JA response, JAZs have been demonstrated to play multiple roles in the growth, defense, and response to abiotic stress of plants (Garrido-Bigotes et al., 2019; Gupta et al., 2021). It has been reported that sunflower exhibits outstanding resistance to abiotic stresses (Škorić, 2016). However, limited information about the JAZ gene family in sunflower is currently known, thus hampering studies focused on resistance mechanisms. The well-annotated sunflower genome information (Badouin et al., 2017) and transcriptome technology provide fundamental materials for exploring the evolutionary relationships and expression diversity associated with the JAZ family in sunflower.
Previous studies have shown that JAZ genes can be divided into three to five groups (Xie et al., 2019; Shen et al., 2020). Combined with the JAZ proteins from seven other plants (Zhang et al., 2012; Chini et al., 2017; Xie et al., 2019; Han and Luthe, 2021), we classified these genes into five groups (Figure 1). The 27 HaJAZ genes were classified into five groups (Supplementary Table S1). Accordingly, plant genomes are less restricted in terms of genome size and chromosome number evolution, which leads to plants generally evolving more rapidly than other eukaryotes (Kejnovsky et al., 2009). Hence, the JAZ numbers varied among the tested species (Figure 1C). For instance, sunflower has twice as many JAZs as A. thaliana, which may result from the two additional genome-wide duplication event rounds that occurred during the sunflower evolution process (Badouin et al., 2017). Moreover, many JAZ genes undergo species-specific expansion, such as wheat, grape, and sunflower expansion (Figure 1). The phylogenetic and gene duplication analyses further indicated that genetic diversity and redundancy were present in this rapidly evolving gene family.
The sequestration of plants means that they are subject to greater survival risks than other eukaryotes and that they must rely on their genomic plasticity and biochemical changes to cope with different risks (Kejnovsky et al., 2009). The duplicated genes allow plants to enhance their adaptation to environmental stresses and promote plant differentiation (Leitch and Leitch, 2008). Tandem and segmental duplications are the main driving forces behind gene family expansion and gene functional differentiation in plants (Cannon et al., 2004). Among HaJAZ genes, segmental duplicates accounted for the main duplication pattern associated with HaJAZ gene amplification (Figure 2, 20/27), while the tandem duplicated gene pairs tended to experience relaxed purifying selection (Supplementary Table S2). After duplications, genes generally tend to pseudogenize or undergo neofunctionalization to breakdown functional redundancy to escape obsolescence and become fixed in the genome (Birchler and Yang, 2022). In this study, HaJAZ2 tended to be not expressed under any condition, which may imply that it is undergoing pseudogenization, while other genes (HaJAZ1 and HAJAZ14) tended to be divergently expressed among tissues or stress treatments (Figures 3–5).
Accordingly, JAZ genes play important roles in plant growth and stress responses (Li et al., 2014). We found that more than half of HaJAZs were highly expressed in most tissues, especially in the floral organs of sunflower plants (Figure 3), suggesting that JAZ family genes are involved in flower induction and stamen development (Kim et al., 2011). However, many HaJAZ genes were expressed at extremely low levels in the pollen (Figure 3C). In fact, many gene families, such as the WRKY and bHLH families, have been shown to be expressed at lower levels in sunflower pollen than in other tissues (Liu et al., 2020; Li et al., 2021). This information suggests that pollen may play a less important role than other tissues in responding to environmental stresses. Under MeJA treatment, we found that most HaJAZ genes showed significantly upregulated expression, especially HaJAZ8 and HaJAZ19 (Figure 4). Moreover, most JAZ genes in sunflower leaves were sensitive to IAA in the hormone treatment, and the HaJAZ genes in sunflower roots were highly regulated by MeJA and ACC (Figure 4). These results indicate that JAZ genes may play important roles not only in the JA signaling pathway but also in other hormone activities, such as the activities of IAA and ACC, which was shown in a previous study (Ullah et al., 2018).Previously, salinity stress can trigger the activation of the JA signaling pathway followed by the inhibition of cell elongation in the elongation zone, and salt-inhibited root growth partially involves the JA signaling pathway in Arabidopsis (Valenzuela et al., 2016). In our study, cold and salinity stress also downregulated the expression of HaJAZs (Figure 5). Moreover, many HaJAZ genes tended to downregulate their expression under the abiotic stresses. From the above results, we speculate that the sunflower JAZ gene plays a “repressor” role in response to different abiotic stresses.
COI1 can recruit JAZ family repressors to destroy the downstream MYC2 to regulate plant growth, development, and defense (Pieterse et al., 2014). In our study, the expression of JA receptor COI1 genes was significantly negatively correlated with 11 HaJAZs, and nine MYC2 genes were significantly positively correlated with 18 HaJAZs among these abiotic stresses (Supplementary Table S5). This result may indicate that these genes were involved in the response to abiotic stress through the JA pathway. Moreover, the functional analysis showed that all the coexpressed genes were enriched in response to SA and JA (Figure 6E). Accordingly, the SA and JA pathways act antagonistically on each other and provide the plant with a mechanism to fine-tune its defense response depending on the lifestyle of the enemy (Pieterse et al., 2014). Our data showed that the coexpressed genes of HaJAZs are involved in the biosynthesis of secondary metabolites, alpha-linolenic acid metabolism, and plant hormone signal transduction (Figure 6D). This can be linked with the fact that JA is biosynthesized from linolenic acid in chloroplast membranes (Sharma and Laxmi, 2015), and many secondary metabolites contribute greatly to plant environmental adaptation (Xu et al., 2022). Additionally, the enrichment analysis for each group demonstrated that different groups of HaJAZs may share similar functions but also exercise their unique functions when responding to abiotic stresses (Figures 6D,E).
In summary, 27 HaJAZ genes were identified, and some potential functions of the HaJAZ gene family and their phylogenetic information were revealed through bioinformatics analyses. This study found that HaJAZ5, HaJAZ15, HaJAZ17, HaJAZ20, and HaJAZ21 tend to be sensitive to certain abiotic stresses, and the JAZ gene plays an irreplaceable role in plant abiotic stress responses (Figure 7). When sunflower is exposed to an exogenous stress stimulus, HaJAZ downregulates their expression or degrades their abundance by ubiquitin-mediated proteolysis. Then, the MYC2 TFs were released to activate the expression of downstream stress-responsive genes. We speculated that this gene family was conserved in sequence but varied in their expression among duplicated HaJAZ genes, indicating that they may gain environmental resistance through neofunctionalization. Our results may provide insight into the resistance of sunflower plants to diverse environmental conditions.
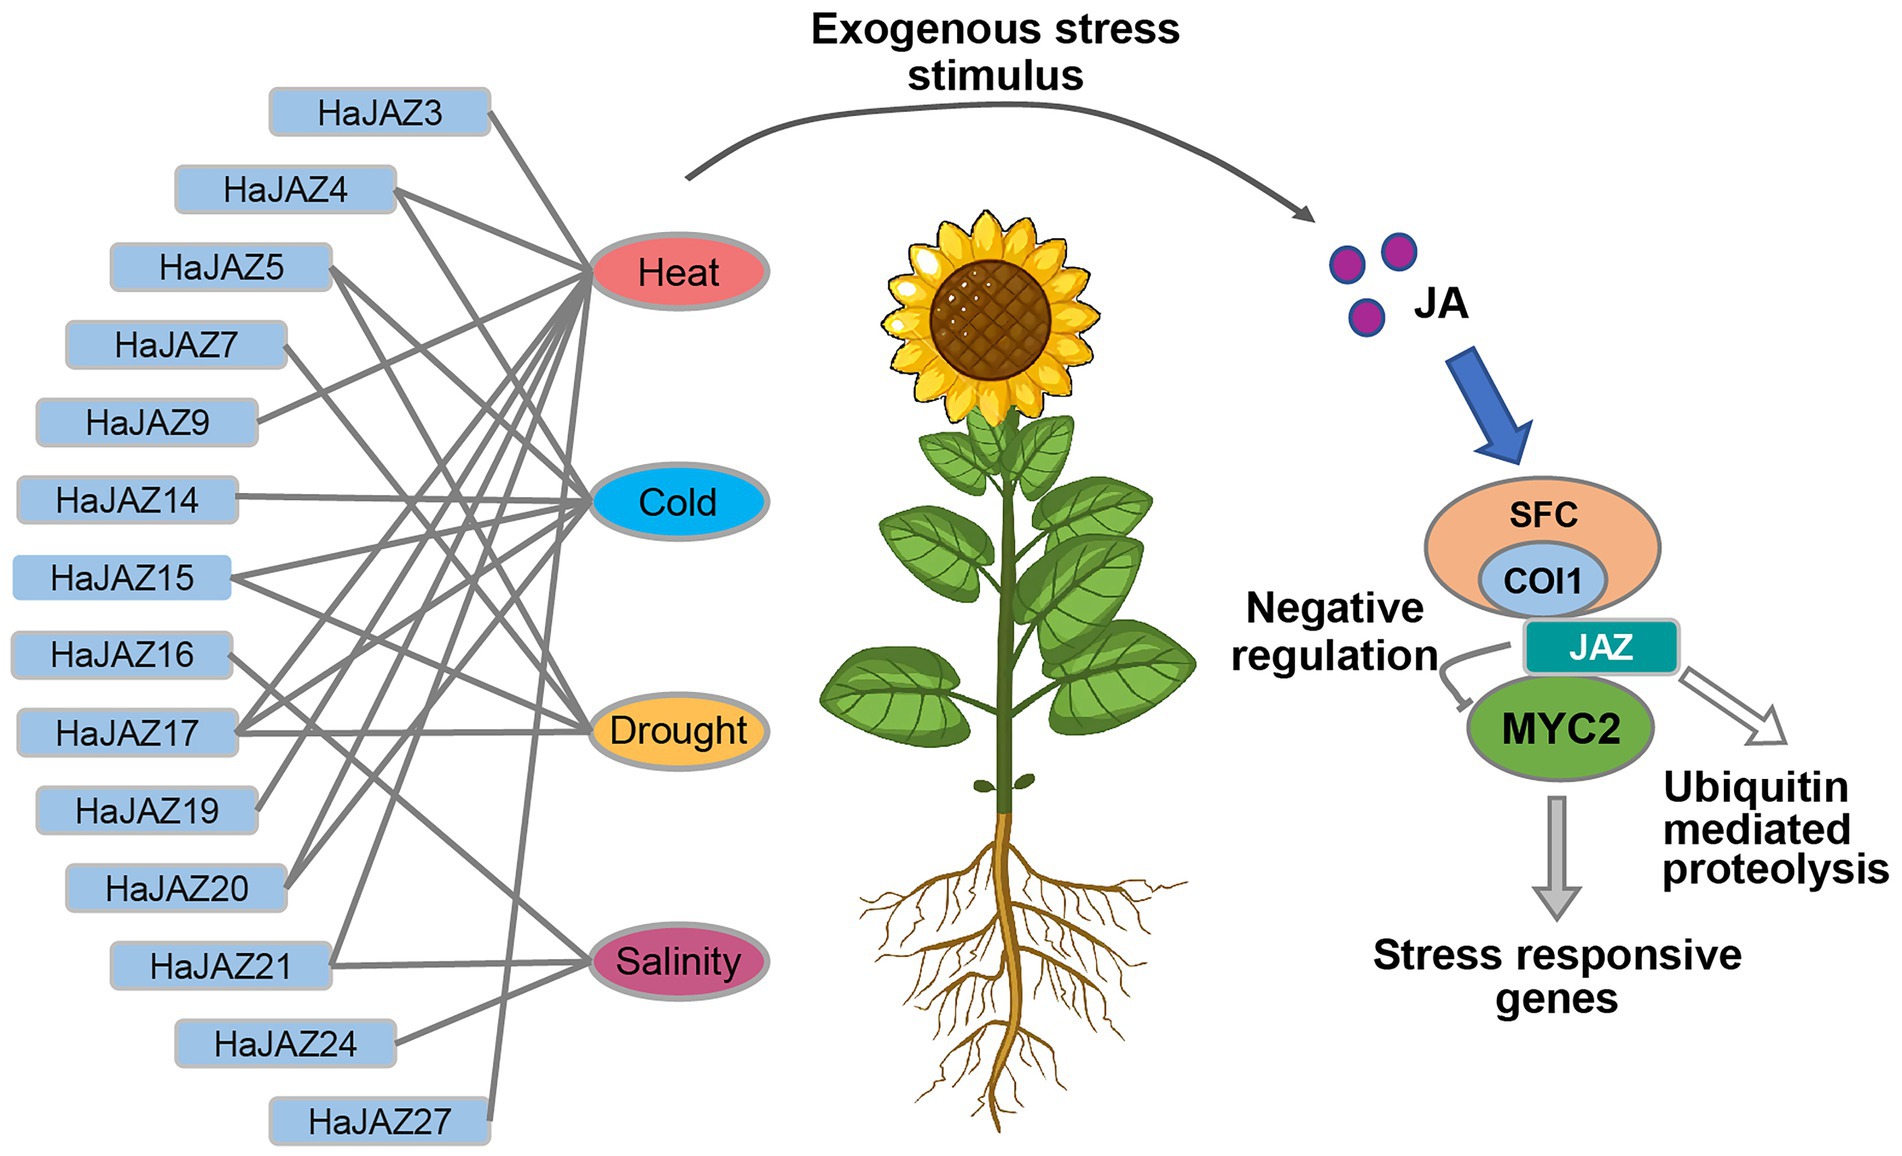
Figure 7. Model of HaJAZ genes regulating abiotic stresses. JA, jasmonic acid; COI1, coronatine-insensitive protein 1; SFC, SKP1 + Cdc53/cullin+Rbx1 + F-box protein complex; MYC2, Myeloid tissue proliferative protein in plants. The abbreviation name for each sample is shown in Figure 6.
Materials and methods
Retrieval of JAZ genes
All sunflower protein sequences were obtained from the National Center for Biotechnology Information (NCBI) database. Hidden Markov model (HMM) profiles (El-Gebali et al., 2019) containing the TIFY (PF06200) and Jas (PF09425) domains were obtained from the Pfam database1 and used to identify potential JAZ genes in the sunflower genome with HMMER 3.2.1 software,2 with an E-value threshold of 10−2 (Prakash et al., 2017). Only the nonredundant proteins predicted by the online Simple Modular Architecture Research Tool (SMART)3 (Letunic and Bork, 2018) were identified as HaJAZ protein members. The JAZ protein sequences of Arabidopsis, rice, maize, wheat, grape, tomato, and Sitka spruce were derived from previous studies (Zhang et al., 2012; Chini et al., 2017; Xie et al., 2019; Zheng et al., 2020; Han and Luthe, 2021). The Expert Protein Analysis System (ExPASy) proteomics server4 was used to predict the different physicochemical parameters of the proteins (e.g., their molecular weight, theoretical isoelectric point, and number of amino acid residues).
Sequence alignments and phylogenetic analyses
The JAZ protein sequences of sunflower, Arabidopsis, rice, maize, wheat, grape, and tomato were aligned using T-Coffee5 (Di Tommaso et al., 2011). An NJ phylogenetic tree was reconstructed using MEGA 7.0 (Kumar et al., 2016). The evolutionary distances were computed using the Poisson correction method in units of the number of amino acid substitutions per site. The other parameters were set as follows: 1,000 bootstrap replicates, pairwise deletions, and other default parameters (Kumar et al., 2016). The Weblogo3 application6 was used to visualize and analyze the conserved domains.
Cis-element prediction of HaJAZ genes
The intron/exon structure of the sunflower JAZ genes was described using TBtools (v1.0692; Chen et al., 2020) based on comparisons of the predicted coding sequences (CDSs) derived based on genome annotation (Badouin et al., 2017). The online multiple Em for Motif Elicitation (MEME, http://meme-suite.org/) program was used to analyze the conserved motif structures of the proteins encoded by the sunflower JAZ genes. The two kbp-upstream sequences of the 27 HaJAZ genes beginning from the start codon ATG were extracted from the sunflower genome and regarded as the regulatory promoter regions. The cis-elements were analyzed using the online software PlantCARE database7 (Lescot et al., 2002). The potential TFs binding to the HaJAZ promoters were predicted through Plant Transcriptional Regulatory Map (PlantRegMap; Tian et al., 2020) and visualized with Cytoscape v.3.8.2 (Otasek et al., 2019).
Chromosomal location and duplication of HaJAZ genes
The physical positions of the HaJAZ genes were obtained from the sunflower annotation file deposited in the NCBI database. We used TBtools (v1.0692) software (Chen et al., 2020) to derive the chromosomal locations of the HaJAZ genes. These genes were renamed according to their physical locations on individual chromosomes. To identify the duplication patterns of HaJAZ genes, MCScanX (Wang et al., 2012) was used under default settings to identify both segmental and tandem duplicated gene pairs encoded in the sunflower genome. The synonymous (dS) and nonsynonymous (dN) mutation rates were estimated using the online tool PAL2NAL (v14)8 (Suyama et al., 2006). The selection pressure of each duplicated gene pair was determined using the ω ratio.
Expression patterns of HaJAZ genes in various tissues and under hormone treatment
To investigate the potential functions of HaJAZ genes in different tissues of sunflower under normal conditions, we acquired transcriptomic raw data of 11 tissues from a previous study (Badouin et al., 2017; Sequence Read Archive (SRA): SRP092742). These data represented pollen, stamen, pistil, DF ovary, DF corolla, bract, RF ovary, RF ligule, leaf, stem, and root tissues. We conducted reanalyses of the collected data following Liu et al. (2020). These data were log2-transformed and used to represent the expression profiles of JAZ genes through the pheatmap package implemented in R 3.6.3. To determine the tissue expression specificity, we introduced the parameter τ (Yanai et al., 2005) to assess whether a given gene was expressed in a tissue-specific manner. To avoid computing tissue specificity too sensitively, we added a penalty constant in the formula according to a previous study. The τ values were calculated as follows for each gene among different tissues: (Liu et al., 2020).
where xi is the expression of the gene in tissue i and n is the number of tissues. The FPKM values were normalized by performing log2 transformations after adding 1 to prevent the occurrence of negative values. The τ values ranged from 0 to 1, indicating that the gene expression specificity types ranged from widely expressed to specifically expressed.
To investigate whether HaJAZ genes play a role in hormonal responses in sunflower, data representing two tissues (roots and leaves) treated with 8 different hormones, ABA, IAA, BRAS, ACC, GA3, kinetin, MeJA, and SA, were obtained from a previous study (Badouin et al., 2017). All the transcriptome data obtained herein were analyzed following our previous study (Liu et al., 2020), and the expression fold change (FC) was derived for each of the treatments compared to the control.
Plant materials and abiotic stress treatments
Heat, drought, cold and salinity stress experiments were carried out with the sunflower cultivar MH8361. The plants were grown under normal culture conditions following the above method until the sunflower seedlings grew to express six true leaves. For the heat and drought stress experiments, the treatments were conducted following the methods outlined in our previous study (Niu et al., 2022). For the cold stress experiment, seedlings with similar growth characteristics were selected and treated at 4°C for 8, 16, and 32 h (denoted C8, C16, and C32, respectively). Seedlings that were not subjected to the low-temperature treatment were selected as the control (C0). For the salinity stress experiment, 250 mmol L−1 sodium chloride (NaCl) was applied for 2 weeks. Seedlings not exposed to the NaCl treatment were selected as the control (CK). Each treatment was performed in triplicate. After the treatments were complete, the sunflower leaves were immediately collected and frozen in liquid nitrogen and then stored at −80°C until further use.
RNA-seq and coexpression analyses of sunflower under various abiotic stresses
Total RNA was obtained from the above-mentioned samples using a Total Miniprep Kit following the manufacturer’s instructions (Axygen Bioscience, US). Then, 1 μg of RNA was reverse transcribed in total using PrimeScript RT Master Mix (TaKaRa) to synthesize cDNA. After constructing the cDNA library, polymerase chain reaction (PCR) amplification was conducted to enlarge the library fragments. Library selection was performed according to the fragment size (~450 bp). We then detected the total and effective concentrations using an Agilent 2,100 BioAnalyzer. For the qualified samples, high-throughput sequencing technology was adopted using the Illumina HiSeq™ 2000 sequencing platform, and paired-end (PE) sequencing was performed on these libraries.
After processing the RNA-Seq raw data using the FastQC and Cutadapt programs,9 the resulting high-quality reads were further mapped to the sunflower reference genome using HISAT210 (Kim et al., 2019). The expression levels were normalized to fragments per kilobase of exon model per million mapped fragments (FPKM) to quantify the expression of each gene. Genes with |log2 FC| criteria >1.0 and p-values < 0.05 were regarded as differentially expressed genes (DEGs) between any two groups derived using DESeq11 (Wang et al., 2010).
Weighted gene coexpression networks were constructed using the WGCNA (v1.69) package in R (Langfelder and Horvath, 2008). All 14,610 genes derived from 45 samples were used to construct a signed coexpression network. The soft thresholding power (β) of 26 was selected to cause the networks to exhibit approximately scale-free topological conditions. Afterward, the adjacency matrix was transformed into a topological overlap matrix (TOM) to calculate the corresponding dissimilarity. All genes were hierarchically clustered using the topological overlap-based dissimilarity measure, and a gene dendrogram was generated based on TOM. The gene expression profile of each module identified from the gene dendrogram was calculated to test its association with each plant effective component. In the coexpression network, the edge weight (ranging from 0 to 1, corresponding to the interaction strength) of any two connected genes was determined based on their topology overlap measure. The networks were visualized using Cytoscape v.3.8.2 (Otasek et al., 2019). All statistical analyses and significance tests were performed using R project version 3.6.3.
Data availability statement
The original contributions presented in the study are publicly available. This data can be found here: NCBI, PRJNA869183.
Author contributions
AL and HS conceived the study. HS, XW, and JS performed the experiments. HS, XF, and AL contributed to the data analysis, bioinformatics analysis, and manuscript preparation. XF, JL, YL, and QH collected the public dataset of the studied species. All authors have read and approved the final version of the manuscript.
Funding
This study was supported by the Scientific and Technological Innovation Programs of Higher Education Institutions in Shanxi (2021L514 and 2020L0620), and the National Natural Science Foundation of China (31901953). The funders had no role in the study design, data collection and analysis, decision to publish, or preparation of the manuscript.
Acknowledgments
We thank Jiahao Xu for his technical support and constructive suggestions.
Conflict of interest
The authors declare that the research was conducted in the absence of any commercial or financial relationships that could be construed as a potential conflict of interest.
Publisher’s note
All claims expressed in this article are solely those of the authors and do not necessarily represent those of their affiliated organizations, or those of the publisher, the editors and the reviewers. Any product that may be evaluated in this article, or claim that may be made by its manufacturer, is not guaranteed or endorsed by the publisher.
Supplementary material
The Supplementary material for this article can be found online at: https://www.frontiersin.org/articles/10.3389/fpls.2022.1010404/full#supplementary-material
SUPPLEMENTARY FIGURE S1
Chromosomal locations of sunflower JAZ genes. The HaJAZ members are named according to their physical position on the chromosomes.
SUPPLEMENTARY FIGURE S2
The tree was constructed using amino acid sequences under neighbor-joining (NJ) methods in MEGA 7.0. The numbers on the nodes indicate the bootstrap values derived from 1,000 replicates performed to test the reliability; values <70% are not shown.
SUPPLEMENTARY FIGURE S3
Conserved gene structures, motif and domain distribution of the sunflower JAZ gene family. The gene structure graph was drawn based on the genome annotation results. The MEME online tool was used to predict the motifs and identify the ten motifs present in the JAZ protein sequence. The domain distributions were predicted with the SMART online tool.
SUPPLEMENTARY FIGURE S4
The expression profiles of COI1 and MYC2 genes in response to abiotic stress treatments. The abbreviation name for each sample is shown in Figure 6E.
SUPPLEMENTARY TABLE S1
Detailed information on the sunflower JAZ gene family.
SUPPLEMENTARY TABLE S2
Synonymous and nonsynonymous substitution rates and Pearson correlation coefficient of expression for the duplicated gene pairs among sunflower JAZ genes. N, number of nonsynonymous sites; S, number of synonymous sites; dN, nonsynonymous substitution rate; and dS, synonymous substitution rate. The dS and dN values were calculated using codeml in the PAML package.
SUPPLEMENTARY TABLE S3
The cis-element patterns of each HaJAZ gene predicted for two kbp-upstream sequences from the start codon.
SUPPLEMENTARY TABLE S4
The potential TFs binding to the promoters of HaJAZs predicted through PlantRegMap.
SUPPLEMENTARY TABLE S5
Correlation test between the expression levels of COI1 genes, MYC2 genes and HaJAZ genes.
Footnotes
3. ^http://smart.embl-heidelberg.de/
4. ^https://web.expasy.org/compute_pi
5. ^https://tcoffee.crg.eu/apps/tcoffee/index.html
6. ^http://weblogo.berkeley.edu/logo.cgi
7. ^http://bioinformatics.psb.ugent.be/webtools/plantcare/html/
8. ^http://www.bork.embl.de/pal2nal/
9. ^http://cutadapt.readthedocs.io/en/stable/
10. ^http://ccb.jhu.edu/software/hisat2/index.shtml
11. ^https://www.bioconductor.org/packages//2.10/bioc/html/DESeq.html
References
Badouin, H., Gouzy, J., Grassa, C. J., Murat, F., Staton, S. E., Cottret, L., et al. (2017). The sunflower genome provides insights into oil metabolism, flowering and Asterid evolution. Nature 546, 148–152. doi: 10.1038/nature22380
Bai, Y., Meng, Y., Huang, D., Qi, Y., and Chen, M. (2011). Origin and evolutionary analysis of the plant-specific TIFY transcription factor family. Genomics 98, 128–136. doi: 10.1016/j.ygeno.2011.05.002
Birchler, J. A., and Yang, H. (2022). The multiple fates of gene duplications: deletion, hypofunctionalization, subfunctionalization, neofunctionalization, dosage balance constraints, and neutral variation. Plant Cell 34, 2466–2474. doi: 10.1093/plcell/koac076
Cannon, S. B., Mitra, A., Baumgarten, A., Young, N. D., and May, G. (2004). The roles of segmental and tandem gene duplication in the evolution of large gene families in Arabidopsis thaliana. BMC Plant Biol. 4:10. doi: 10.1186/1471-2229-4-10
Chen, C., Chen, H., Zhang, Y., Thomas, H. R., Frank, M. H., He, Y., et al. (2020). TBtools: an integrative toolkit developed for interactive analyses of big biological data. Mol. Plant 13, 1194–1202. doi: 10.1016/j.molp.2020.06.009
Chini, A., Ben-Romdhane, W., Hassairi, A., and Aboul-Soud, M. A. M. (2017). Identification of TIFY/JAZ family genes in Solanum lycopersicum and their regulation in response to abiotic stresses. PLoS One 12:e0177381. doi: 10.1371/journal.pone.0177381
Chini, A., Boter, M., and Solano, R. (2009). Plant oxylipins: COI1/JAZs/MYC2 as the core jasmonic acid-signalling module. FEBS J. 276, 4682–4692. doi: 10.1111/j.1742-4658.2009.07194.x
Chini, A., Fonseca, S., Fernandez, G., Adie, B., Chico, J. M., Lorenzo, O., et al. (2007). The JAZ family of repressors is the missing link in jasmonate signalling. Nature 448, 666–671. doi: 10.1038/nature06006
Chung, H. S., Niu, Y., Browse, J., and Howe, G. A. (2009). Top hits in contemporary JAZ: an update on jasmonate signaling. Phytochemistry 70, 1547–1559. doi: 10.1016/j.phytochem.2009.08.022
Di Tommaso, P., Moretti, S., Xenarios, I., Orobitg, M., Montanyola, A., Chang, J. M., et al. (2011). T-coffee: a web server for the multiple sequence alignment of protein and RNA sequences using structural information and homology extension. Nucleic Acids Res. 39, W13–W17. doi: 10.1093/nar/gkr245
Ebel, C., Ben Feki, A., Hanin, M., Solano, R., and Chini, A. (2018). Characterization of wheat (Triticum aestivum) TIFY family and role of Triticum Durum TdTIFY11a in salt stress tolerance. PLoS One 13:e0200566. doi: 10.1371/journal.pone.0200566
El-Gebali, S., Mistry, J., Bateman, A., Eddy, S. R., Luciani, A., Potter, S. C., et al. (2019). The Pfam protein families database in 2019. Nucleic Acids Res. 47, D427–D432. doi: 10.1093/nar/gky995
Feng, X., Zhang, L., Wei, X., Zhou, Y., Dai, Y., and Zhu, Z. (2020). OsJAZ13 negatively regulates Jasmonate signaling and activates hypersensitive cell death response in rice. Int. J. Mol. Sci. 21:4379. doi: 10.3390/ijms21124379
Garrido-Bigotes, A., Valenzuela-Riffo, F., and Figueroa, C. R. (2019). Evolutionary analysis of JAZ proteins in plants: an approach in search of the ancestral sequence. Int. J. Mol. Sci. 20:5060. doi: 10.3390/ijms20205060
Guo, Q., Major, I. T., and Howe, G. A. (2018a). Resolution of growth-defense conflict: mechanistic insights from jasmonate signaling. Curr. Opin. Plant Biol. 44, 72–81. doi: 10.1016/j.pbi.2018.02.009
Guo, Q., Yoshida, Y., Major, I. T., Wang, K., Sugimoto, K., Kapali, G., et al. (2018b). JAZ repressors of metabolic defense promote growth and reproductive fitness in Arabidopsis. Proc. Natl. Acad. Sci. U. S. A. 115, E10768–E10777. doi: 10.1073/pnas.1811828115
Gupta, A., Bhardwaj, M., and Tran, L. P. (2021). The JASMONATE ZIM-DOMAIN family proteins are the important node in jasmonic acid-abscisic acid crosstalk in regulating plant response to drought. Curr. Protein Pept. Sci. 22, 759–766. doi: 10.2174/1389203722666211018114443
Han, Y., and Luthe, D. (2021). Identification and evolution analysis of the JAZ gene family in maize. BMC Genomics 22:256. doi: 10.1186/s12864-021-07522-4
Jing, Y., Liu, J., Liu, P., Ming, D., and Sun, J. (2019). Overexpression of TaJAZ1 increases powdery mildew resistance through promoting reactive oxygen species accumulation in bread wheat. Sci. Rep. 9:5691. doi: 10.1038/s41598-019-42177-y
Ju, L., Jing, Y., Shi, P., Liu, J., Chen, J., Yan, J., et al. (2019). JAZ proteins modulate seed germination through interaction with ABI5 in bread wheat and Arabidopsis. New Phytol. 223, 246–260. doi: 10.1111/nph.15757
Kejnovsky, E., Leitch, I. J., and Leitch, A. R. (2009). Contrasting evolutionary dynamics between angiosperm and mammalian genomes. Trends Ecol. Evol. 24, 572–582. doi: 10.1016/j.tree.2009.04.010
Kim, K. C., Han, J.-A., Lee, J., Maeng, J., and Hur, Y. (2011). Gene encoding PnFL-2 with TIFY and CCT motifs may control floral induction in Pharbitis nil. Genes Genomics 33, 229–236. doi: 10.1007/s13258-010-0174-7
Kim, D., Paggi, J. M., Park, C., Bennett, C., and Salzberg, S. L. (2019). Graph-based genome alignment and genotyping with HISAT2 and HISAT-genotype. Nat. Biotechnol. 37, 907–915. doi: 10.1038/s41587-019-0201-4
Kumar, S., Stecher, G., and Tamura, K. (2016). MEGA7: molecular evolutionary genetics analysis version 7.0 for bigger datasets. Mol. Biol. Evol. 33, 1870–1874. doi: 10.1093/molbev/msw054
Kynast, R. G., Riera-Lizarazu, O., Vales, M. I., Okagaki, R. J., Maquieira, S. B., Chen, G., et al. (2001). A complete set of maize individual chromosome additions to the oat genome. Plant Physiol. 125, 1216–1227. doi: 10.1104/pp.125.3.1216
Langfelder, P., and Horvath, S. (2008). WGCNA: an R package for weighted correlation network analysis. BMC Bioinformatics 9:559. doi: 10.1186/1471-2105-9-559
Leitch, A. R., and Leitch, I. J. (2008). Genomic plasticity and the diversity of Polyploid plants. Science 320, 481–483. doi: 10.1126/science.1153585
Lescot, M., Déhais, P., Thijs, G., Marchal, K., Moreau, Y., Van de Peer, Y., et al. (2002). Plant CARE, a database of plant cis-acting regulatory elements and a portal to tools for in silico analysis of promoter sequences. Nucleic Acids Res. 30, 325–327. doi: 10.1093/nar/30.1.325
Letunic, I., and Bork, P. (2018). 20 years of the SMART protein domain annotation resource. Nucleic Acids Res. 46, D493–D496. doi: 10.1093/nar/gkx922
Li, J., Li, X., Han, P., Liu, H., Gong, J., Zhou, W., et al. (2021). Genome-wide investigation of bHLH genes and expression analysis under different biotic and abiotic stresses in Helianthus annuus L. Int. J. Biol. Macromol. 189, 72–83. doi: 10.1016/j.ijbiomac.2021.08.072
Li, X., Yin, X., Wang, H., Li, J., Guo, C., Gao, H., et al. (2014). Genome-wide identification and analysis of the apple (Malus × domestica Borkh.) TIFY gene family. Tree Genet. Genomes 11:808. doi: 10.1007/s11295-014-0808-z
Liu, A., Liu, C., Lei, H., Wang, Z., Zhang, M., Yan, X., et al. (2020). Phylogenetic analysis and transcriptional profiling of WRKY genes in sunflower (Helianthus annuus L.): genetic diversity and their responses to different biotic and abiotic stresses. Ind. Crop. Prod. 148:112268. doi: 10.1016/j.indcrop.2020.112268
Melotto, M., Mecey, C., Niu, Y., Chung, H. S., Katsir, L., Yao, J., et al. (2008). A critical role of two positively charged amino acids in the Jas motif of Arabidopsis JAZ proteins in mediating coronatine- and jasmonoyl isoleucine-dependent interactions with the COI1 F-box protein. Plant J. 55, 979–988. doi: 10.1111/j.1365-313X.2008.03566.x
Niu, T., Wang, X., Abbas, M., Shen, J., Liu, R., Wang, Z., et al. (2022). Expansion of CONSTANS-like genes in sunflower confers putative neofunctionalization in the adaptation to abiotic stresses. Ind. Crop. Prod. 176:114400. doi: 10.1016/j.indcrop.2021.114400
Otasek, D., Morris, J. H., Boucas, J., Pico, A. R., and Demchak, B. (2019). Cytoscape automation: empowering workflow-based network analysis. Genome Biol. 20:185. doi: 10.1186/s13059-019-1758-4
Pauwels, L., Barbero, G. F., Geerinck, J., Tilleman, S., Grunewald, W., Perez, A. C., et al. (2010). NINJA connects the co-repressor TOPLESS to jasmonate signalling. Nature 464, 788–791. doi: 10.1038/nature08854
Peethambaran, P. K., Glenz, R., Honinger, S., Shahinul Islam, S. M., Hummel, S., Harter, K., et al. (2018). Salt-inducible expression of OsJAZ8 improves resilience against salt-stress. BMC Plant Biol. 18:311. doi: 10.1186/s12870-018-1521-0
Pieterse, C. M., Pierik, R., and Van Wees, S. C. (2014). Different shades of JAZ during plant growth and defense. New Phytol. 204, 261–264. doi: 10.1111/nph.13029
Prakash, A., Jeffryes, M., Bateman, A., and Finn, R. D. (2017). The HMMER web server for protein sequence similarity search. Curr. Protoc. Bioinformatics 60, 3.15.1–3.15.23. doi: 10.1002/cpbi.40
Santner, A., and Estelle, M. (2007). The JAZ proteins link jasmonate perception with transcriptional changes. Plant Cell 19, 3839–3842. doi: 10.1105/tpc.107.056960
Seo, J. S., Joo, J., Kim, M. J., Kim, Y. K., Nahm, B. H., Song, S. I., et al. (2011). Osb HLH148, a basic helix-loop-helix protein, interacts with OsJAZ proteins in a jasmonate signaling pathway leading to drought tolerance in rice. Plant J. 65, 907–921. doi: 10.1111/j.1365-313X.2010.04477.x
Sharma, M., and Laxmi, A. (2015). Jasmonates: emerging players in controlling temperature stress tolerance. Front. Plant Sci. 6:1129. doi: 10.3389/fpls.2015.01129
Shen, J., Zou, Z., Xing, H., Duan, Y., Zhu, X., Ma, Y., et al. (2020). Genome-wide analysis reveals stress and hormone responsive patterns of JAZ family genes in camellia Sinensis. Int. J. Mol. Sci. 21:2433. doi: 10.3390/ijms21072433
Singh, A. P., Pandey, B. K., Mehra, P., Heitz, T., and Giri, J. (2020). OsJAZ9 overexpression modulates jasmonic acid biosynthesis and potassium deficiency responses in rice. Plant Mol. Biol. 104, 397–410. doi: 10.1007/s11103-020-01047-2
Škorić, D. (2016). “Sunflower breeding for resistance to abiotic and biotic stresses,” in Abiotic and biotic stress in plants-recent advances and future perspectives. eds. A. K. Shanker and C. Shanker (London: Intech Open), 585–635.
Sucher, J., Mbengue, M., Dresen, A., Barascud, M., Didelon, M., Barbacci, A., et al. (2020). Phylotranscriptomics of the Pentapetalae reveals frequent regulatory variation in plant local responses to the fungal pathogen Sclerotinia sclerotiorum. Plant Cell 32, 1820–1844. doi: 10.1105/tpc.19.00806
Sun, H., Chen, L., Li, J., Hu, M., Ullah, A., He, X., et al. (2017). The JASMONATE ZIM-domain gene family mediates JA signaling and stress response in cotton. Plant Cell Physiol. 58, 2139–2154. doi: 10.1093/pcp/pcx148
Suyama, M., Torrents, D., and Bork, P. (2006). PAL2NAL: robust conversion of protein sequence alignments into the corresponding codon alignments. Nucleic Acids Res. 34, W609–W612. doi: 10.1093/nar/gkl315
Taniguchi, S., Hosokawa-Shinonaga, Y., Tamaoki, D., Yamada, S., Akimitsu, K., and Gomi, K. (2014). Jasmonate induction of the monoterpene linalool confers resistance to rice bacterial blight and its biosynthesis is regulated by JAZ protein in rice. Plant Cell Environ. 37, 451–461. doi: 10.1111/pce.12169
Thines, B., Katsir, L., Melotto, M., Niu, Y., Mandaokar, A., Liu, G., et al. (2007). JAZ repressor proteins are targets of the SCFCOI1 complex during jasmonate signalling. Nature 448, 661–665. doi: 10.1038/nature05960
Tian, F., Yang, D. C., Meng, Y. Q., Jin, J., and Gao, G. (2020). Plant Reg map: charting functional regulatory maps in plants. Nucleic Acids Res. 48:D1104-D 1113. doi: 10.1093/nar/gkz1020
Ullah, A., Manghwar, H., Shaban, M., Khan, A. H., Akbar, A., Ali, U., et al. (2018). Phytohormones enhanced drought tolerance in plants: a coping strategy. Environ. Sci. Pollut. Res. Int. 25, 33103–33118. doi: 10.1007/s11356-018-3364-5
Valenzuela, C. E., Acevedo-Acevedo, O., Miranda, G. S., Vergara-Barros, P., Holuigue, L., Figueroa, C. R., et al. (2016). Salt stress response triggers activation of the jasmonate signaling pathway leading to inhibition of cell elongation in Arabidopsis primary root. J. Exp. Bot. 67, 4209–4220. doi: 10.1093/jxb/erw202
Vanholme, B., Grunewald, W., Bateman, A., Kohchi, T., and Gheysen, G. (2007). The tify family previously known as ZIM. Trends Plant Sci. 12, 239–244. doi: 10.1016/j.tplants.2007.04.004
Wang, L., Feng, Z., Wang, X., Wang, X., and Zhang, X. (2010). DEGseq: an R package for identifying differentially expressed genes from RNA-seq data. Bioinformatics 26, 136–138. doi: 10.1093/bioinformatics/btp612
Wang, Y., Tang, H., Debarry, J. D., Tan, X., Li, J., Wang, X., et al. (2012). MCScanX: a toolkit for detection and evolutionary analysis of gene synteny and collinearity. Nucleic Acids Res. 40:e49. doi: 10.1093/nar/gkr1293
Wolters, H., and Jurgens, G. (2009). Survival of the flexible: hormonal growth control and adaptation in plant development. Nat. Rev. Genet. 10, 305–317. doi: 10.1038/nrg2558
Wu, H., Ye, H., Yao, R., Zhang, T., and Xiong, L. (2015). OsJAZ9 acts as a transcriptional regulator in jasmonate signaling and modulates salt stress tolerance in rice. Plant Sci. 232, 1–12. doi: 10.1016/j.plantsci.2014.12.010
Xie, S., Cui, L., Lei, X., Yang, G., Li, J., Nie, X., et al. (2019). The TIFY gene family in wheat and its progenitors: genome-wide identification, evolution and expression analysis. Curr. Genomics 20, 371–388. doi: 10.2174/1389202920666191018114557
Xu, L., Cao, M., Wang, Q., Xu, J., Liu, C., Ullah, N., et al. (2022). Insights into the plateau adaptation of Salvia castanea by comparative genomic and WGCNA analyses. J. Adv. Res. doi: 10.1016/j.jare.2022.02.004
Yanai, I., Benjamin, H., Shmoish, M., Chalifa-Caspi, V., Shklar, M., Ophir, R., et al. (2005). Genome-wide midrange transcription profiles reveal expression level relationships in human tissue specification. Bioinformatics 21, 650–659. doi: 10.1093/bioinformatics/bti042
Zhang, Y., Gao, M., Singer, S. D., Fei, Z., Wang, H., and Wang, X. (2012). Genome-wide identification and analysis of the TIFY gene family in grape. PLoS One 7:e44465. doi: 10.1371/journal.pone.0044465
Keywords: sunflower, JAZ, phylogenetic analysis, hormone, abiotic stress, WGCNA
Citation: Song H, Fu X, Li J, Niu T, Shen J, Wang X, Li Y, Hou Q and Liu A (2022) Phylogenetic analysis and expression profiles of jasmonate ZIM-domain gene family provide insight into abiotic stress resistance in sunflower. Front. Plant Sci. 13:1010404. doi: 10.3389/fpls.2022.1010404
Edited by:
Ting Zhao, Zhejiang University, ChinaReviewed by:
Tao Yan, Hunan Agricultural University, ChinaJunfeng Cao, Chinese Academy of Sciences, China
Shouli Feng, Zhejiang University, China
Copyright © 2022 Song, Fu, Li, Niu, Shen, Wang, Li, Hou and Liu. This is an open-access article distributed under the terms of the Creative Commons Attribution License (CC BY). The use, distribution or reproduction in other forums is permitted, provided the original author(s) and the copyright owner(s) are credited and that the original publication in this journal is cited, in accordance with accepted academic practice. No use, distribution or reproduction is permitted which does not comply with these terms.
*Correspondence: Ake Liu, YWtlbGl1QDEyNi5jb20=
†These authors have contributed equally to this work