 Ruiping Jiang†
 Hai Liao
- School of Life Sciences and Engineering, Southwest Jiaotong University, Chengdu, China
Fritillaria species, a well-known Chinese traditional medicine for more than 2,000 years, have become rare resources due to excessive harvesting. In order to balance the economical requirement and ecological protection of Fritillaria species, it is necessary to determine (1) the important environmental variables that were responsible for the spatial distribution, (2) distribution change in response to climate change in the future, (3) ecological niche overlap between various Fritillaria species, and (4) the correlation between spatial distribution and phylogenies as well. In this study, the areas with potential ecological suitability for Fritillaria cirrhosa, Fritillaria unibracteata, and Fritillaria przewalskii were predicted using MaxEnt based on the current occurrence records and bioclimatic variables. The result indicated that precipitation and elevation were the most important environmental variables for the three species. Moreover, the current suitable habitats of F. cirrhosa, F. unibracteata, and F. przewalskii encompassed 681,951, 481,607, and 349,199 km2, respectively. Under the scenario of the highest concentration of greenhouse gas emission (SSP585), the whole suitable habitats of F. cirrhosa and F. przewalskii reach the maximum from 2021 to 2100, while those of F. unibracteata reach the maximum from 2021 to 2100 under the scenario of moderate emission (SSP370) from 2021 to 2100. The MaxEnt data were also used to predict the ecological niche overlap, and thus high overlap occurring among three Fritillaria species was observed. The niche overlap of three Fritillaria species was related to the phylogenetic analysis despite the non-significance (P > 0.05), indicating that spatial distribution was one of the factors that contributed to the speciation diversification. Additionally, we predicted species-specific habitats to decrease habitat competition. Overall, the information obtained in this study provided new insight into the potential distribution and ecological niche of three species for the conservation and management in the future.
Introduction
The Fifth Assessment Report (AR5) produced by the Intergovernmental Panel on Climate Change (IPCC) stated that, with global warming, the average temperature of the earth continuously increased by 0.78°C from 2003 to 2013 compared with that from 1885 to 1990 (Stocker, 2013). The concentration of CO2, CH4, and N2O reached the highest level since 1200 AD. Climate change has caused substantial changes in the geographical distribution of many species. Conversely, changes in species’ ranges will affect how climate change is experienced across the landscape because surface vegetation strongly affects atmospheric properties (Fitzpatrick, 2008; Lawler, 2009; Thuiller et al., 2015). Taking the factors of population, economy, technological progress, and resource utilization into account, IPCC put forward the shared socioeconomic pathways (SSPs), in which SSP1, SSP2, SSP3, SSP4, and SSP5 represented pathway of global sustainable development, medium sustainable development, local sustainable development, unbalanced development, and routine development, respectively. SSP is an alternative and updated mode of representative concentration pathways (RCPs), providing more accurate information on climate change.
Species distribution models (SDMs), also known as ecological niche models (ENM), were applied extensively to predict potentially suitable habitats in various special and temporal ranges based on the current species distribution, richness, and environmental agents. Various SDMs, such as CLIMEX, Domain, genetic algorithm for rule-set production (GARP), Bayesian network, and maximum entropy (MaxEnt), have been used to evaluate the ecological requirements, ecological responses, and distribution areas (Midgley and Thuiller, 2005). Among these modeling approaches, MaxEnt is widely used since it performs better with small sample sizes compared with other modeling methods (Ma and Sun, 2018; Perkins-Taylor and Frey, 2020). For example, Ma and Sun (2018) analyzed the distribution of Stipa purpurea across the Tibet using MaxEnt model, and therefore provided evidence for establishing reasonable management practices. Zhang et al. (2018) predicted the potential geographical distribution of two peony species under a change of CO2 concentration. Abou-Shaara et al. (2021) speculated on the possible invasion of Oplostomus fuligineus into North Africa and South Europe from 2050 to 2070.
The genus Fritillaria has attracted much attention because of its commercial value, partly as ornamental plants, but mostly as medicinal plants in traditional Chinese medicine (TCM). The bulbs of Fritillaria species, called as Beimu, were used by humans for >2,000 years to treat cough and phlegm. According to the Chinese Pharmacopeia 2015, the bulbs of F. cirrhosa, F. unibracteata, F. przewalskii, F. delavayi, F. unibracteata var wabuensis, and F. taipaiensis were used as Chuan-Bei-mu in Chinese medicine markets (Chen et al., 2020). In recent years, high market prices of Chuan-Bei-mu had led to excessive harvesting and unsustainable decline in plant distribution of wild Fritillaria populations. Moreover, the Fritillaria bulbus became smaller and deeper in response to heavy collecting (Li X. et al., 2017). At present, F. cirrhosa, F. unibracteata, and F. prewalskii, distributed in the alpine areas of the Himalayan–Hengduan Mountains, have been classified as endangered species and those wild resources were rarely found in China. During the past decades, the Himalayan–Hengduan Mountains experienced an increase in average temperature (0.03–0.05°C year–1) (Salick et al., 2019). The alpine plants in the Himalayan–Hengduan Mountains region were expected to be sensitive to anthropogenic climate change since their biota was generally cold-adapted (Wang et al., 2020). However, the adaptive rate of species may be slow compared to the rate of climate change (Quintero and Wiens, 2013), and may lead to range contractions (Giménez-Benavides et al., 2011) and/or local extinctions (Wiens, 2016). Therefore, in order to develop a scientific conservation strategy, conservative approaches, as well as artificial cultivation, it is necessary to predict the geographical distribution of Fritillaria species, especially those rare species. To date, there were at least four factors that contributed to the geographical distribution of plants. First of all, the geographical distribution of plants was undoubtedly sensitive to environmental factors (Sosef et al., 2017). For instance, Gao et al. (2019) showed that the reproductive success of F. delavayi was critically affected by the temperature and ultraviolet-B/C intensity, and as a result, F. delavayi was distributed in a narrow altitude area. Thus, both detecting the dominant environmental factors involved in the geographical distribution of various Fritillaria species and identifying ecologically suitable areas of various Fritillaria species are critical issues for designing conservation and cultivation plans for the future. Second, although the most commonly documented response of plants to climate change were distributional range shifts to higher latitudes and/or elevations (Parmesan and Yohe, 2003; Zhang et al., 2018), it was also necessary to predict how various developmental models would determine the spatial extent of their suitable habitat. Third, the ecological niche overlaps between species with close relationships might produce habitat competition to some extent (Eyres et al., 2020), and thus predicting the spatial distribution of various Fritillaria species might find species-specific habitat to decrease competition. Fourth, the distribution of a species is an expression of its evolutionary history and its ecology (Soberón and Peterson, 2005; Villegas et al., 2021). Prediction of geographic distributions is not only useful for identifying environmental factors that may limit the range of species, but also is useful for inferring patterns of speciation. Therefore, the correlation between spatial distribution and phylogenies received much attention in recent decades, despite the fact that it remained elusive (Savolainen et al., 2013).
In this study, we extensively collected the current distributing records of F. cirrhosa, F. unibracteata, and F. przewalskii. We further used MaxEnt and GARP modeling to evaluate the properties of habitat distribution and environmental variables shaping habitat. We tested the overlapping distribution of various original species. The objectives of this study were to (1) identify the most important environmental variables that contributed to the ranges of these three species, (2) examine the spatial changes in the size of suitable habitat under various developmental models in the future; (3) evaluate the overlap extent of three species and discover species-specific suitable habitat for each species; and (4) evaluate the correlation between spatial distribution and phylogenies.
Materials and Methods
The full roadmap on which analyses were based is summarized in Figure 1.
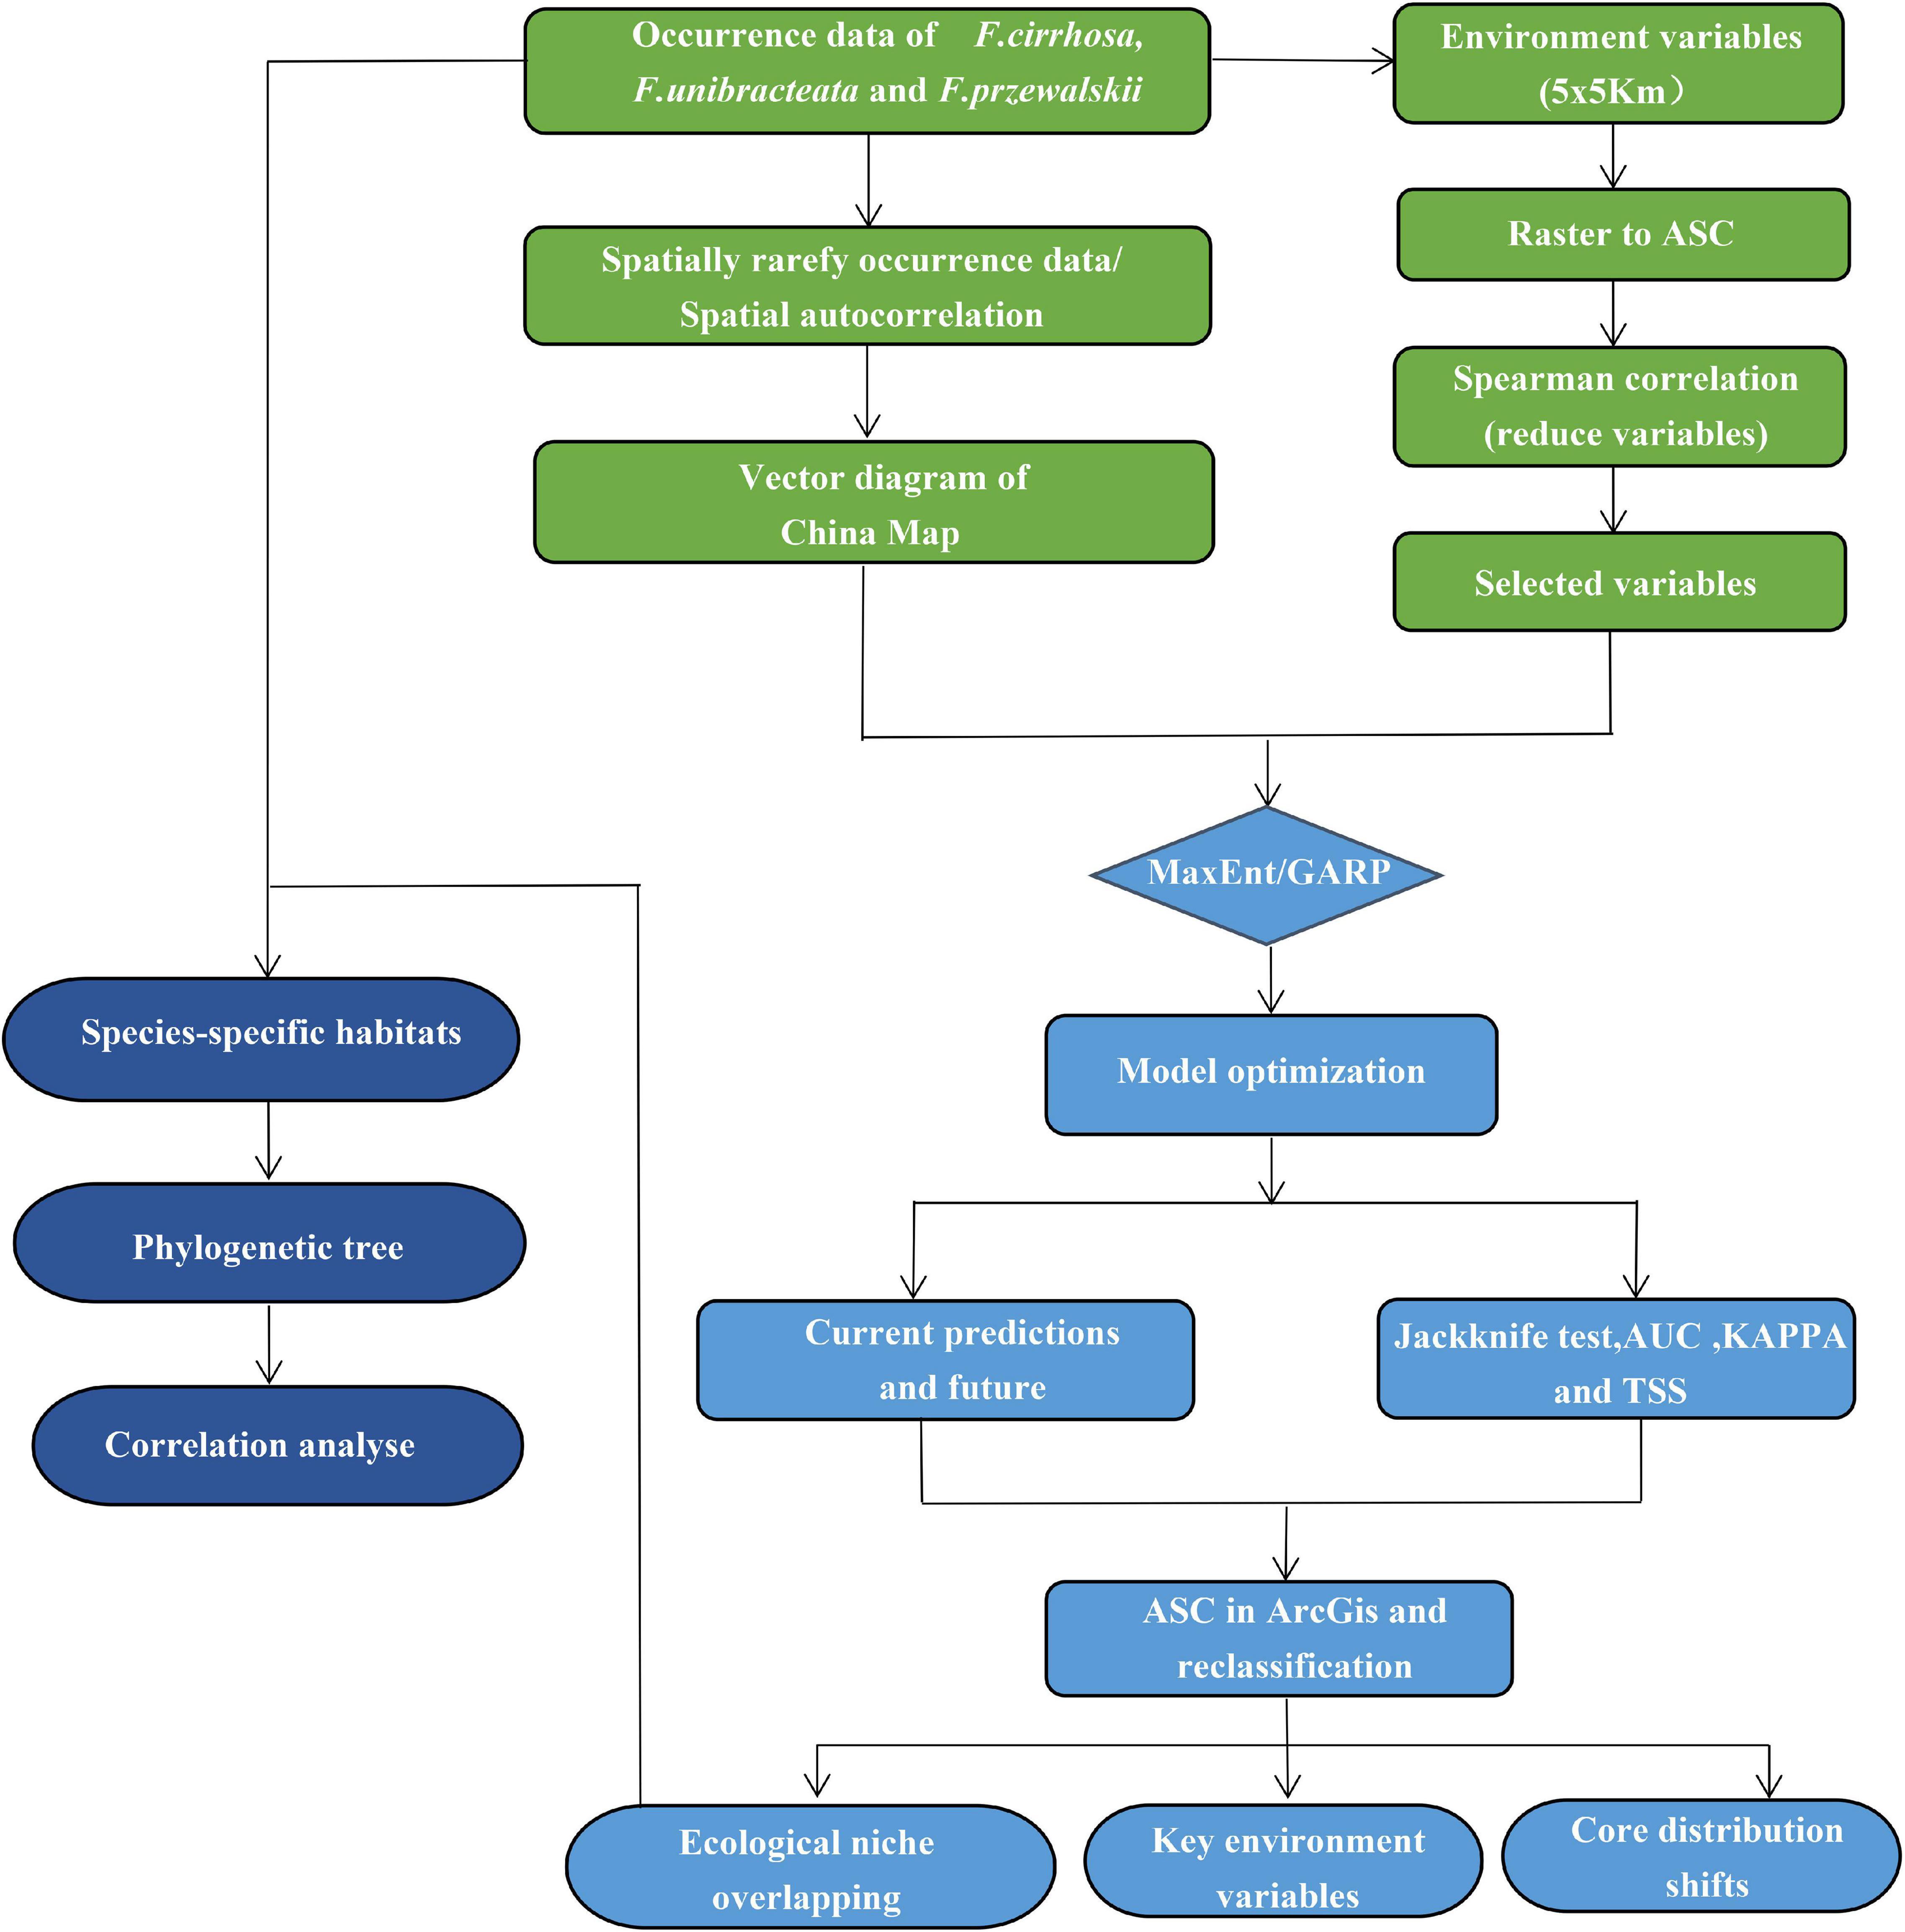
Figure 1. Processing methods in the roadmap of this study.
Occurrence Data and Processing
To collect the occurrence records of F. cirrhosa, F. unibracteata, and F. przewalskii, respectively, we conducted an extensive literature search using online databases and referred to the Chinese Virtual Herbarium database (CVH)1 and the plant photo bank of China (PPBC),2 global biodiversity information facility (GBIF),3 and field investigation as well. Then, records lacking latitude and longitude were georeferenced using Google maps module that is included in the Chinese Satellite Map.4 Using the above resources, the distributional localities of F. cirrhosa, F. unibracteata, and F. przewalskii were added to a database. After deleting the duplicated records and filtering spatially by Buffer analysis, only one point was left within each grid cell (buffer radius is 20 km). Furthermore, to avoid sampling bias, spatial autocorrelation was measured by calculating Moran‘s I using GeoDa v1.14 software (Wu et al., 2021). Finally, the remaining records were used for constructing the models. With the help of ArcGIS 10.2, the sighting point map was obtained (Figure 2).
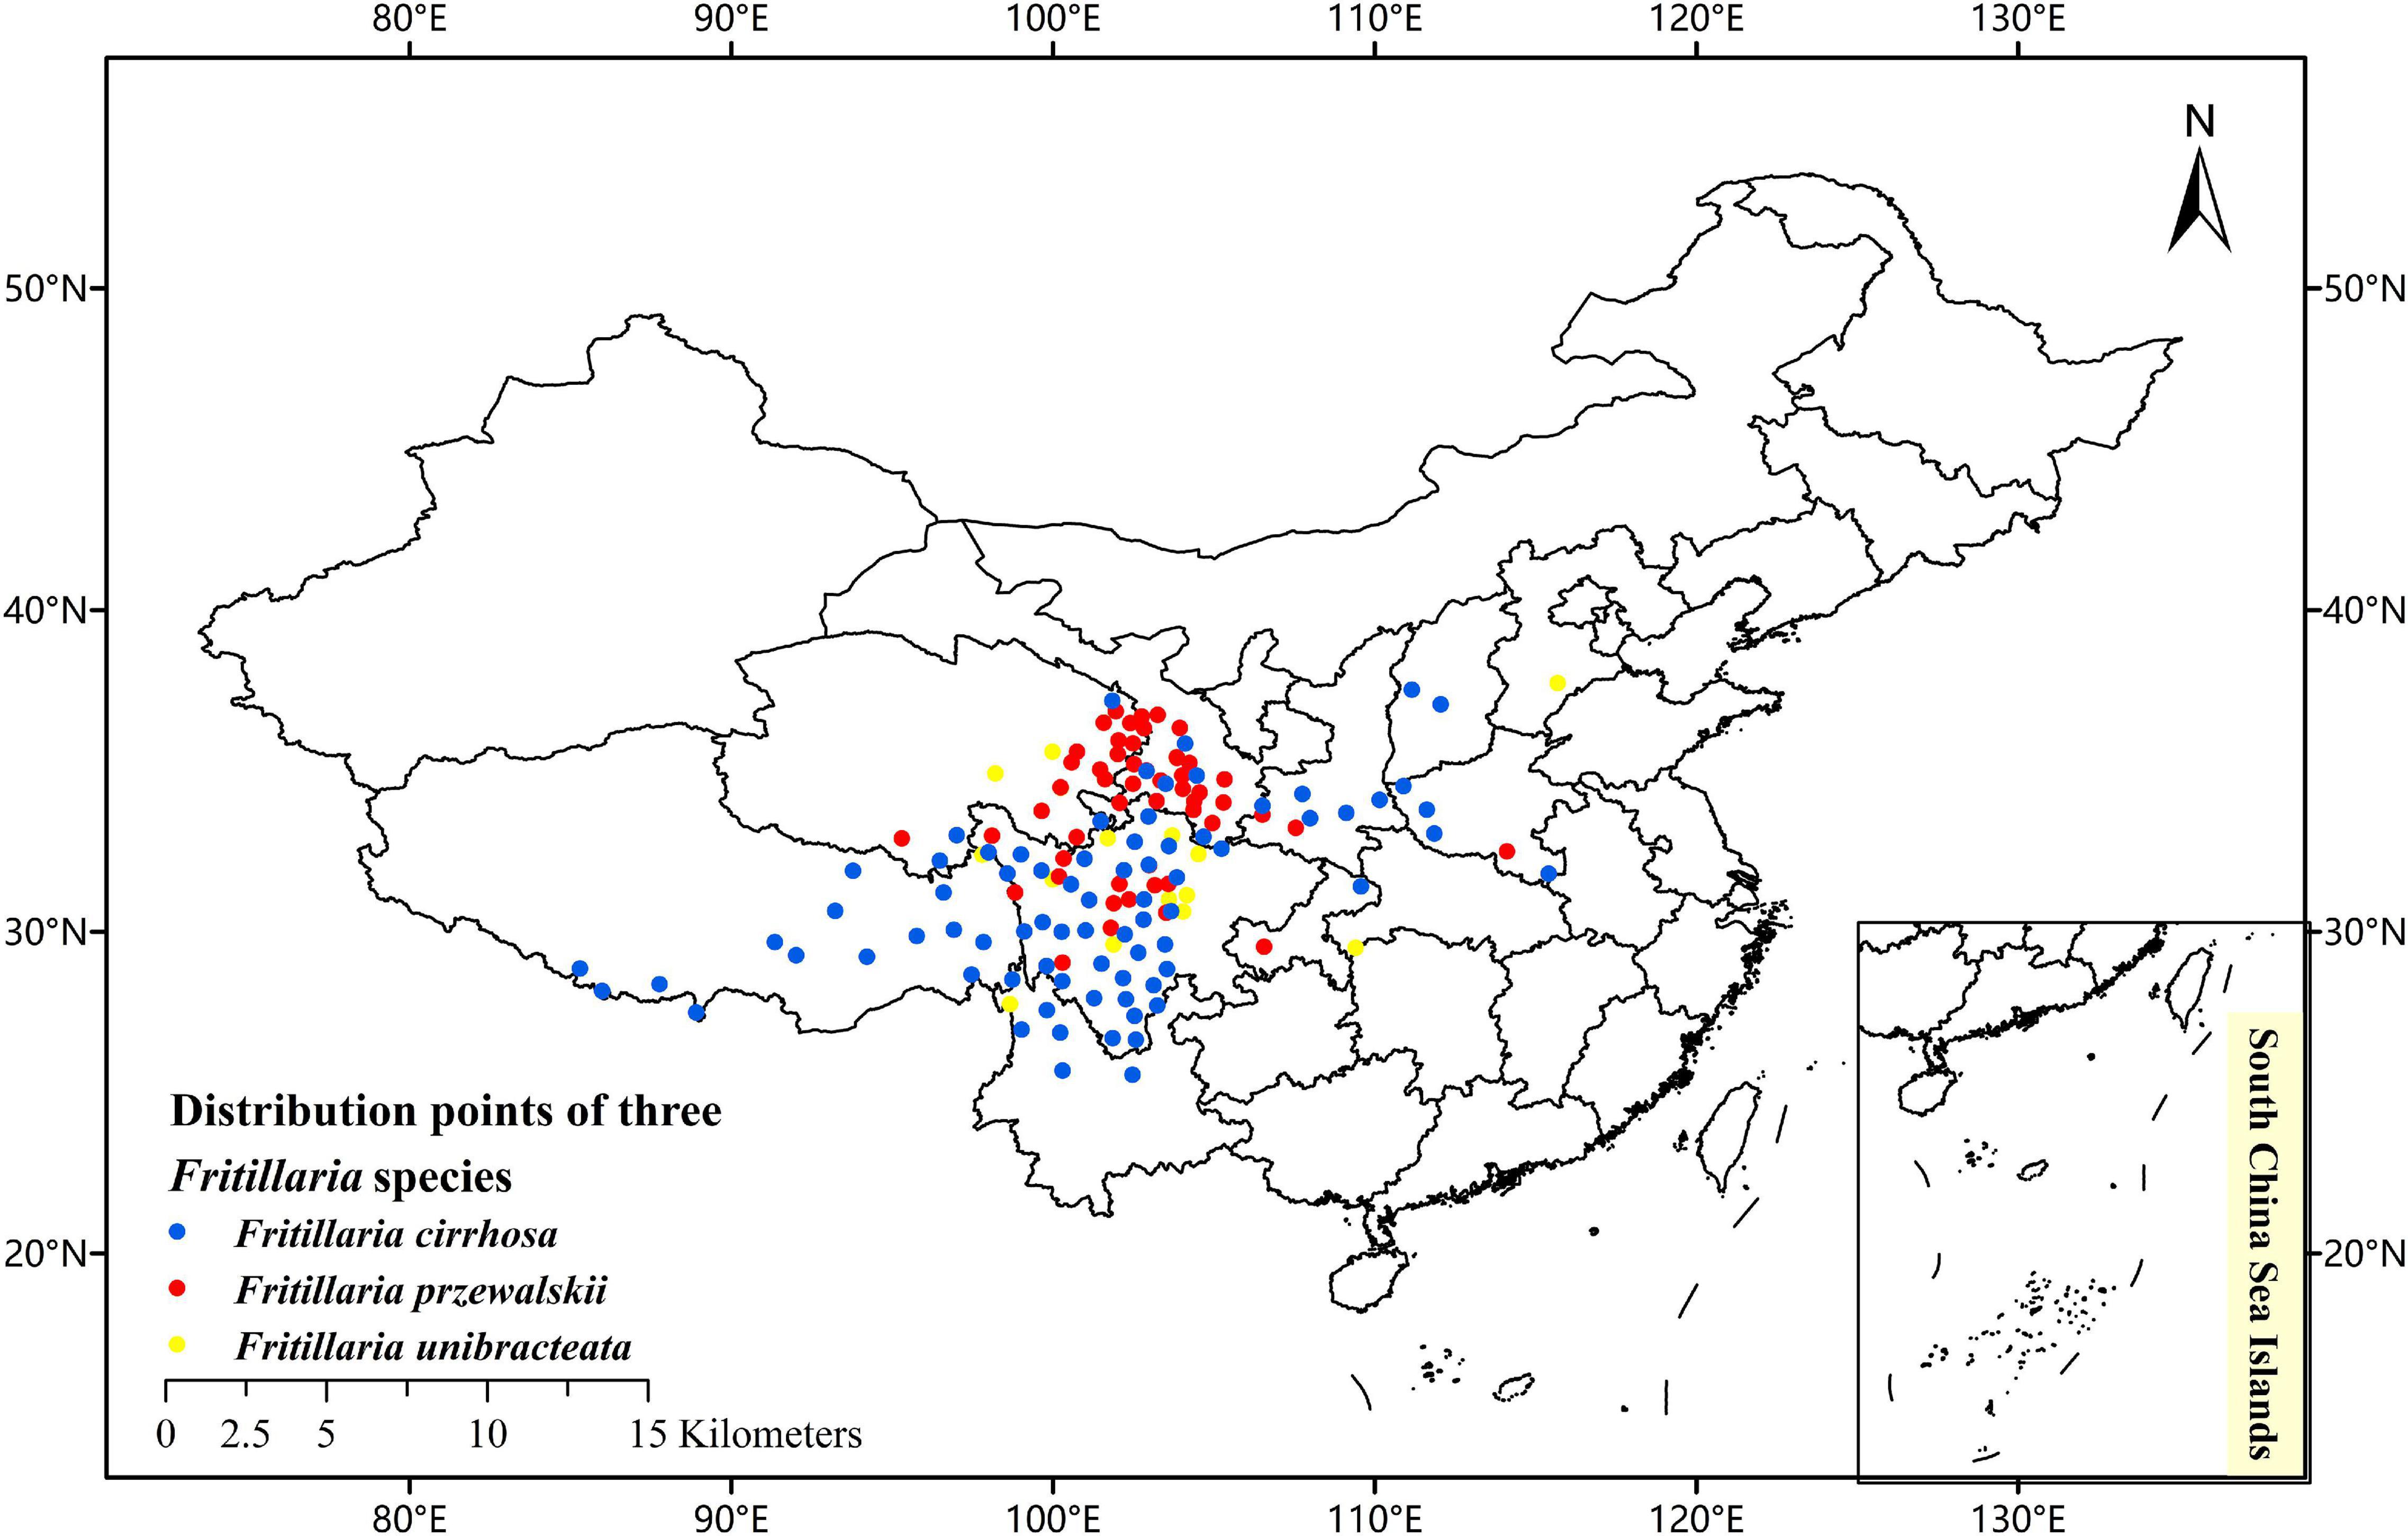
Figure 2. Current occurrence of Fritillaria cirrhosa, Fritillaria unibracteata, and Fritillaria przewalskii in China.
Environment Variables
Initially, 22 environmental variables (Supplementary Table 1) that might influence the distribution of F. unibracteata, F. cirrhosa, and F. przewalskii were selected to model the current species distribution patterns. These variables included 19 bioclimatic variables that described annual and seasonal temperature and rainfall trends (WorldClim version 2.0, Fick and Hijmans, 2017) and three topographic variables (slope, altitude, and aspect extracted from elevation data through the spatial analysis module in ArcMap 10.2.). The 19 WorldClim variables have been broadly used for generating ENMs, including successful use with plants in the Himalayan–Hengduan Mountains (Ma and Sun, 2018; Zheng et al., 2021). These three topographic variables have been indicated to play a role in the distribution and density of Fritillaria species (Lakey and Dorji, 2016).
For future climate scenarios, we used BCC-CSM1.1 climate change modeling data underlying the shared socioeconomic pathways SSP126, SSP245, SSP370, and SSP585 scenarios released by the CMIP6 and IPCC Assessment Report 6 (AR6). BCC-CSM 1.1 is among the most-used models currently available for simulating the global climate response to increasing greenhouse gas concentration. Our four selected future climate data sets, including 2021–2040, 2041–2060, 2061–2080, and 2081–2100, were downloaded from the World Climate Database (Abou-Shaara et al., 2021) with a spatial resolution of 2.5 arc-min. All the environmental variables were in raster format and were prepared in ArcGIS 10.2 to align in the geographic space using a WGS84 datum system with default parameters.
As the high collinearity of 22 environmental variables may lead to the model overfitting, the Spearman correlation analysis was used to test multicollinearity among these variables. Before the correlation analysis, the environmental variables with a contribution rate <0.3 were removed. According to the present distribution points of Fritillaria, the associated environmental variables were extracted and with those values, a correlation matrix in SPSS 20 software was performed. Then, following the methods of Jiang (2017) and Wang et al. (2018), we identified environmental variables that had a coefficient of correlation >0.8 with other environmental variables and eliminated the one with a smaller contribution rate (Supplementary Table 2). Thus, the remaining environmental variables were used in the further prediction of models (Feng et al., 2019).
MaxEnt and GARP Modeling
We used the MaxEnt (MaxEnt version 10.2) and GARP models. For each species, various training/testing sets (80/20, 75/25, and 70/30) were used for validating the models. The algorithm runs 500 iterations of these processes. We selected test samples by the bootstrap method. The Jackknife method was checked in the setting of environmental parameters and the response curve of environmental variables was created. The remaining settings were left at the default setting; finally, the test was repeated 10 times. The outputs were transformed into raster format using the ArcMap tool in ArcGIS software for further analysis.
The effectiveness of MaxEnt and GARP models was evaluated by three standard performance criteria, including area under the curve (AUC) of the receiver operating characteristic (ROC) curve, true skill statistics (TSS), and Kappa values. AUC of the ROC curve is the threshold-independent measure of model accuracy, which juxtaposes correct and incorrect predictions over a range of thresholds (Zhu et al., 2012). The AUC value was calculated as the area enclosed by the ROC curve and generally ranges between 0 and 1. A larger AUC value indicates better model precision. The AUC values could be grouped as failing (AUC ≤ 0.6), poor (0.6–0.7), moderate (0.7–0.8), good (0.8–0.9), and excellent (0.9–1). TSS scores range from -1 to 1, where +1 indicates a perfect ability to distinguish suitable from unsuitable habitat, while values of zero or less indicate a performance no better than random (Assefa et al., 2021). Kappa (Schatz et al., 2017; Fernández and Morales, 2019) measures how closely model predictions match the truth, controlling for random accuracy by estimating the expected accuracy. Kappa values range from -1 to 1, where 1 indicates 100% agreement, and -1 indicates 100% disagreement.
We imported prediction results into ArcGIS and then drew global maps of ecologically appropriate zones for three Fritillaria species, respectively. During the ArcGIS mapping, artificial grading was used to classify different grades based on their ecological similarity. The final potential species distribution map had a range of values from 0 to 1 which were regrouped into four classes of suitable habitats, including highly suitable habitat (0.75–1), moderately suitable habitat (0.5–0.75), low suitable habitat (0.25–0.5), and not suitable habitat (0–0.25) (Ren et al., 2020). These three levels of suitable habitats (25–100%) indicated that species have a probability of survival in these areas (Swets, 1998). The suitable ranges of the environmental variables were defined as those ranges where species inhabited survival areas with low, moderate, and high suitability (≥0.25) (Zhang et al., 2018). The range of appropriate eco-factor values was derived from the response curves of the MaxEnt model results.
Prediction on Niche Breadth and Niche Overlap of Three Fritillaria Species
The niche breadth in geographical and environmental space was calculated for each species as the mean Levins’ B1 (inverse concentration) and B2 (uncertainty) values (Levins, 1968) from habitat suitability maps of each species with the software ENMTools v1.3 (Warren et al., 2008). Levins’ B1 and B2 values range from 0 to 1, with values closer to 0 representing narrow niche breadth, and values closer to 1 representing wide niche breadth. The ENMTools package was further used to evaluate niche overlap based on the values of two indexes, Schoener’s D (Schoener, 1968) and Hellinger’s I (Warren et al., 2008). Schoener’s D and Hellinger’s I values range from 0 to 1, with values closer to 0 representing a small degree of niche overlap, while values closer to 1 representing a high degree of niche overlap.
To strengthen our speculation, the overlapping degree between highly and moderately suitable habitats of paired species is defined as follows, which is the proportion of the records in the overlapping region divided by their union.
The Aoverlap and Boverlap represent the number of records of species A and species B in the overlapping regions, respectively. While Atotal and Btotal are the numbers of all existing records that are related to the respective individual species.
DNA Sequences and Phylogenetic Analysis
Internal transcribed spacer 1 (ITS1) and internal transcribed spacer 2 (ITS2) are the internal regions between 18S and 5.8S, 5.8S, and 28S, respectively. Both have been widely used as molecular markers to explore phylogenetic relationships (Cheng et al., 2016; Khan et al., 2019). While, as a promising method, phylogenetic analysis based on the Chloroplast genome (CP) was also applied in our research. We then searched the GenBank database for DNA sequences of ITS1, ITS2, and CP data, some of which were obtained by our laboratory previously (Zheng et al., 2019). Our strategy included (1) marker sequences available for all the species; (2) sequences that could be linked for all species; (3) sequences contributing to extensive gaps in the conserved regions of the alignment were discarded; and (4) sequences that could be assigned to a set of geographic coordinates.
The ITS1+ITS2, ITS1, ITS2, and CP trees were constructed using a maximum likelihood using the MEGA 7.0 (Deng et al., 2018). To obtain statistical support on the resulting clades, a bootstrap analysis with 1,000 replicates was performed. The evolutionary distance was defined as the number of nucleotide substitutions occurring between various sequences based on the Tamura–Nei model (Tamura and Nei, 1993). In the maximum likelihood tree, the pairwise distance was exported to calculate the evolutionary distance (Kumar et al., 2018), which was used for the further correlation analysis.
Statistical Methods
A linear trend line has been drawn through the evolutionary distances and the occurrence records in the overlapping area. The R2 value indicates how well data fit the line. To test the statistical significance of the correlation results, a Pearson Product Moment Correlation test was performed using SigmaStat v3.5 software. A correlation coefficient (ρ) positive and a p-value lower than 0.05 means that the two variables tend to increase in a concerted manner (Santamaría et al., 2014).
Results
Model Performance and Contribution of Environmental Variables
In the initial step, 112, 51, and 73 native occurrence records of F. cirrhosa, F. unibracteata, and F. przewalskii, respectively, were obtained. After filtering data, the records of F. cirrhosa, F. unibraceate, and F. przewalskii were decreased to 77, 45, and 65, respectively (Supplementary Table 3). The corresponding Moran I of three Fritillaria species were 0.0621465, -0.01864, and 0.0016039, respectively. The procedure greatly reduced sampling bias and spatial autocorrelation, resulting in evenly distributed occurrence points across space, and thus the remaining records could be used for further model construction.
With the given training and testing sets (80/20, 75/25, and 70/30), the MaxEnt model performed better than the GARP model by evaluation metrics (AUC, KAPPA, and TSS). When training/testing set was 75/25, F. unibracteata (AUC = 0.972 (SD = 0.006), KAPPA = 0.913, and TSS = 0.890) and F. przewalskii (AUC = 0.981 (SD = 0.006), KAPPA = 0.871, and TSS = 0.913) had better performance, while 70/30 set was more suitable for F. cirrhosa [AUC = 0.969 (SD = 0.006), KAPPA = 0.731, and TSS = 0.730] (Supplementary Table 4). Therefore, MaxEnt was used as the final model for three Fritillaria species, in which F. unibracteata and F. przewalskii employed 75/25 set, while F. cirrhosa employed 70/30 set. The internal jackknife test in the MaxEnt software package verified the importance of various environmental variables on the three Fritillaria species, respectively (Figure 3). When used independently, Bio12 (23.7% of contribution), Bio11 (17.7% of contribution), Elev (16.5% of contribution), and Bio4 (15.5% of contribution) provided the greatest contributions to the distribution model for F. cirrhosa relative to other variables. The cumulative contributions of these four factors reached values as high as 73.4%, indicating that these variables contained more useful information than the other variables. Bio12 (28.2% of contribution), Elev (27.9% of contribution), Bio4 (22.9% of contribution), and Bio2 (10.6% of contribution) made the highest contributions to the distribution model of F. unibracteata. The cumulative contributions of the variables reached values as high as 89.6%. Furthermore, the environmental variables that provided the greatest contributions to F. przewalskii were Elev (44.3% of contribution), Bio12 (21.5% of contribution), and Bio4 (10.3% of contribution). Therefore, the important environmental factors that influenced the suitable habitat were identified as Bio12, Bio11, Elev, and Bio4 for F. cirrhosa, Bio12, Elev, Bio4, and Bio2 for F. unibracteata, and Elev, Bio12, and Bio4 for F. przewalskii, respectively.
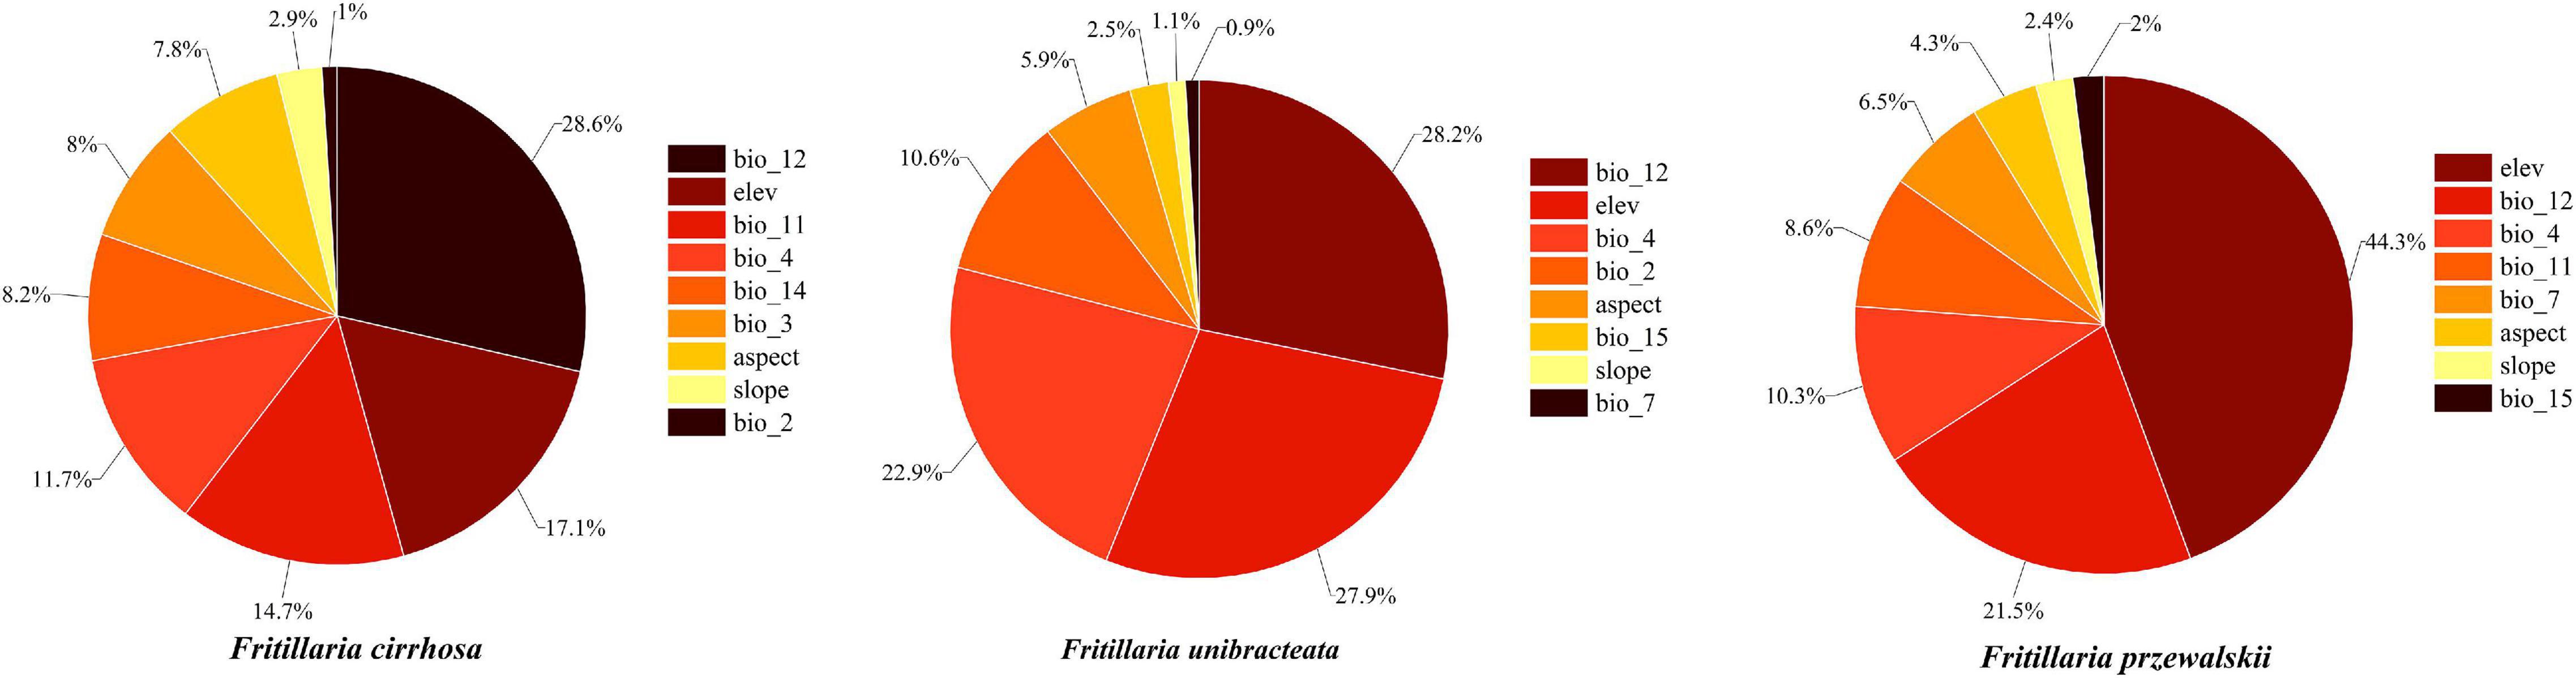
Figure 3. The contribution rate of each environment variable to the modeling of MaxEnt.
The response curve of environmental variables takes the specific value of environmental variables as Abscissa and the existence probability of species as ordinate, which reflected the suitable range of environmental variables in the study area (Figure 4). The suitable ranges of the environmental variables were defined as those ranges where three Fritillaria species inhabited survival areas with low, moderate, and high suitability (≥0.25) (Zhang et al., 2018).
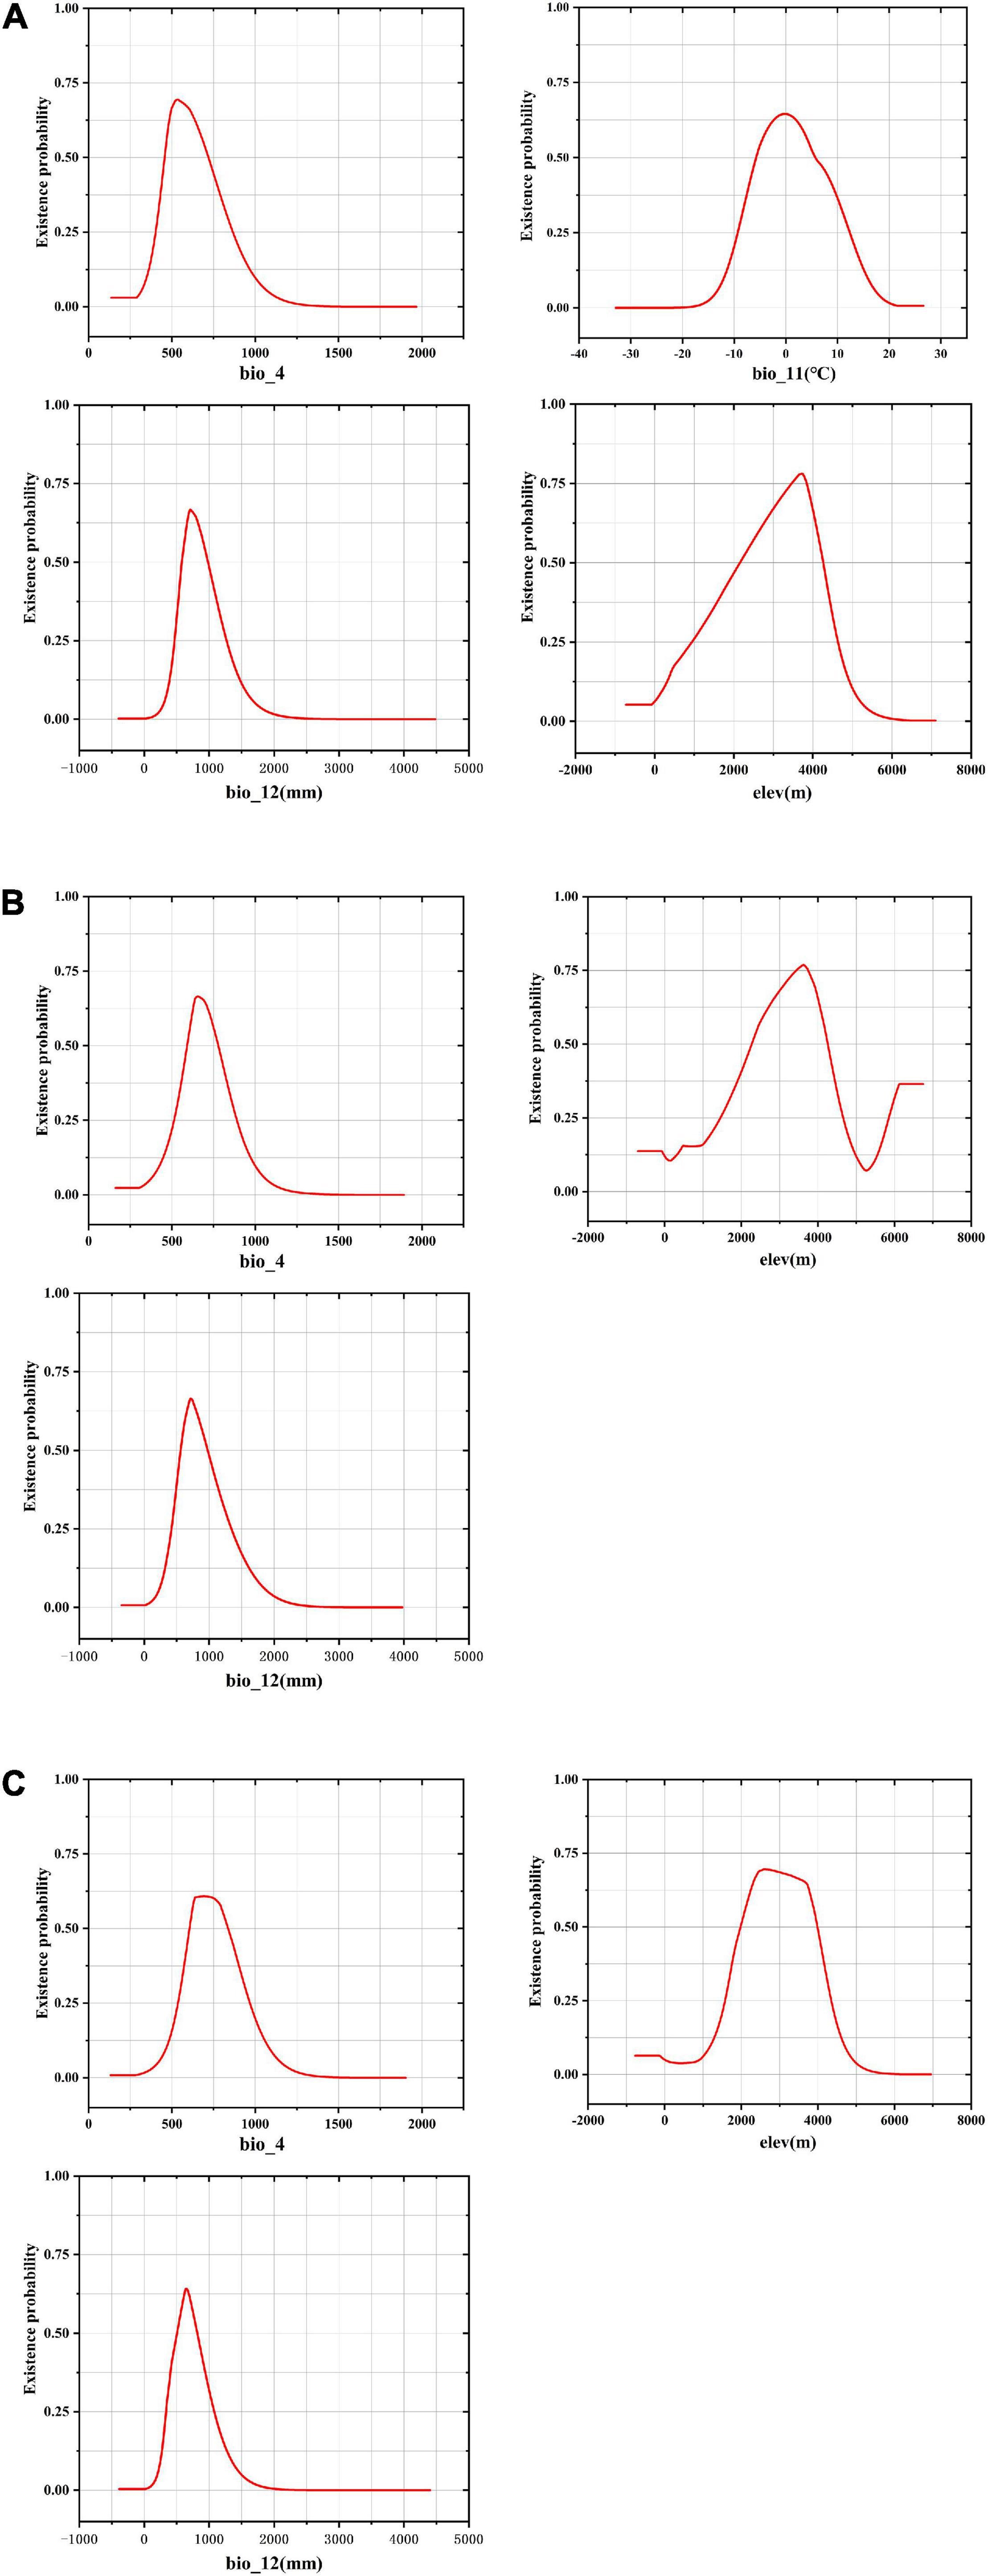
Figure 4. Response curves for dominant environmental variables in the species distribution model for Fritillaria cirrhosa (A), Fritillaria unibracteata (B), and Fritillaria przewalskii (C).
In F. cirrhosa, the suitable ranges of Bio12, Elev, Bio4, and Bio11 (see definitions in Table S1) were 468.68–1263.40 mm, 949.40–4631.11 m, 403.91–865.23, and -9.28 to 12.33°C, respectively. When Bio12 exceeded 468.68 mm, the probability for F. cirrhosa increased gradually, and reached the maximum at 707.59 mm with a probability of existence as high as 0.67. When Elev exceeded 949.40 m, the survival probability of F. cirrhosa first increased and then decreased, and reached 3716.54 m with the highest probability of existence as 0.78. When the Bio4 reached 532.05, F. cirrhosa obtained the highest probability of existence as 0.69. Finally, it achieved the top probability of existence as 0.65 once Bio11 reached -0.17°C (Figure 4A). In F. unibracteata, the optimum values of Bio12, Elev, and Bio4 ranged from 421.41 to 1338.27 mm, 1453.41 to 4653.12 m, and 513.42 to 888.86, respectively (Figure 4B). Furthermore, in F. przewalskii, the optimum ranges of Bio12, Elev, and Bio4 were from 335.98 to 1073.34 mm, from 1576.31 to 4342.94 m, from 537.14 to 967.75, respectively (Figure 4C). The existence probability of three Fritillaria species increased at first and then decreased with the increase of environmental factors. Table 1 shows the suitable range of environmental variables corresponding to the three Fritillaria species.
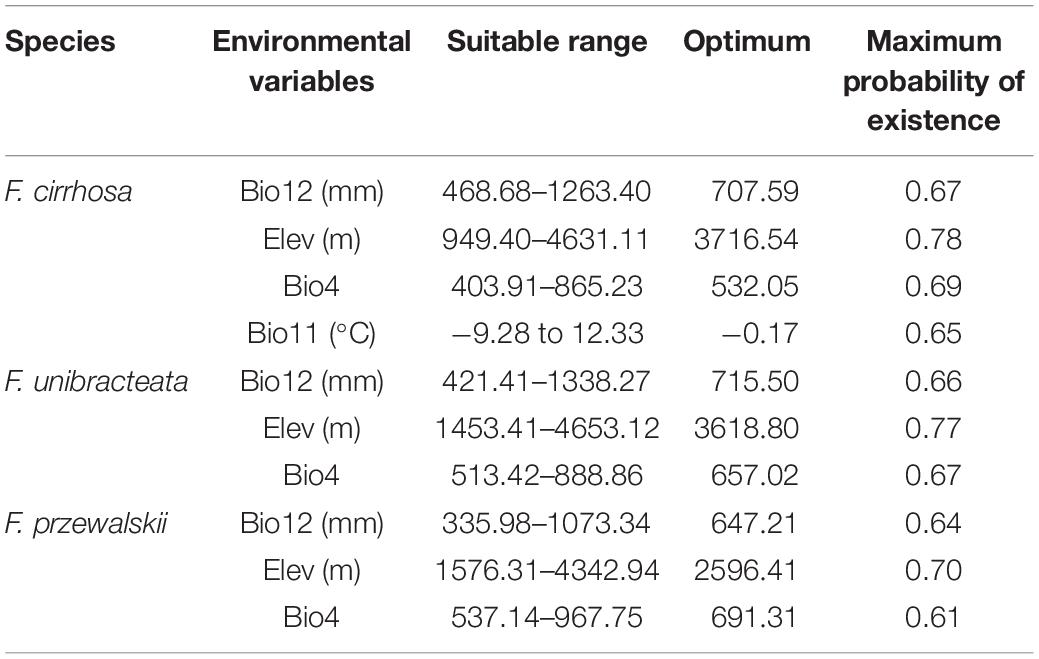
Table 1. Suitable range and optimum environmental variables of three Fritillaria species.
The Currently Suitable Habitats of Three Fritillaria Species
The prediction of current habitats for F. cirrhosa showed that the highly suitable habitat occurred in Sichuan, Tibet, Yunnan, Gansu, Shanxi, Henan, Qinghai, Guizhou, and Hubei provinces. The evaluated moderately suitable habitat distributed in Shanxi, Ningxia, Chongqing, and Hebei. The current areas of suitable habitats for F. cirrhosa were up to 0.68 million km2, accounting for 7.10% of the total area of China (Figure 5A1).
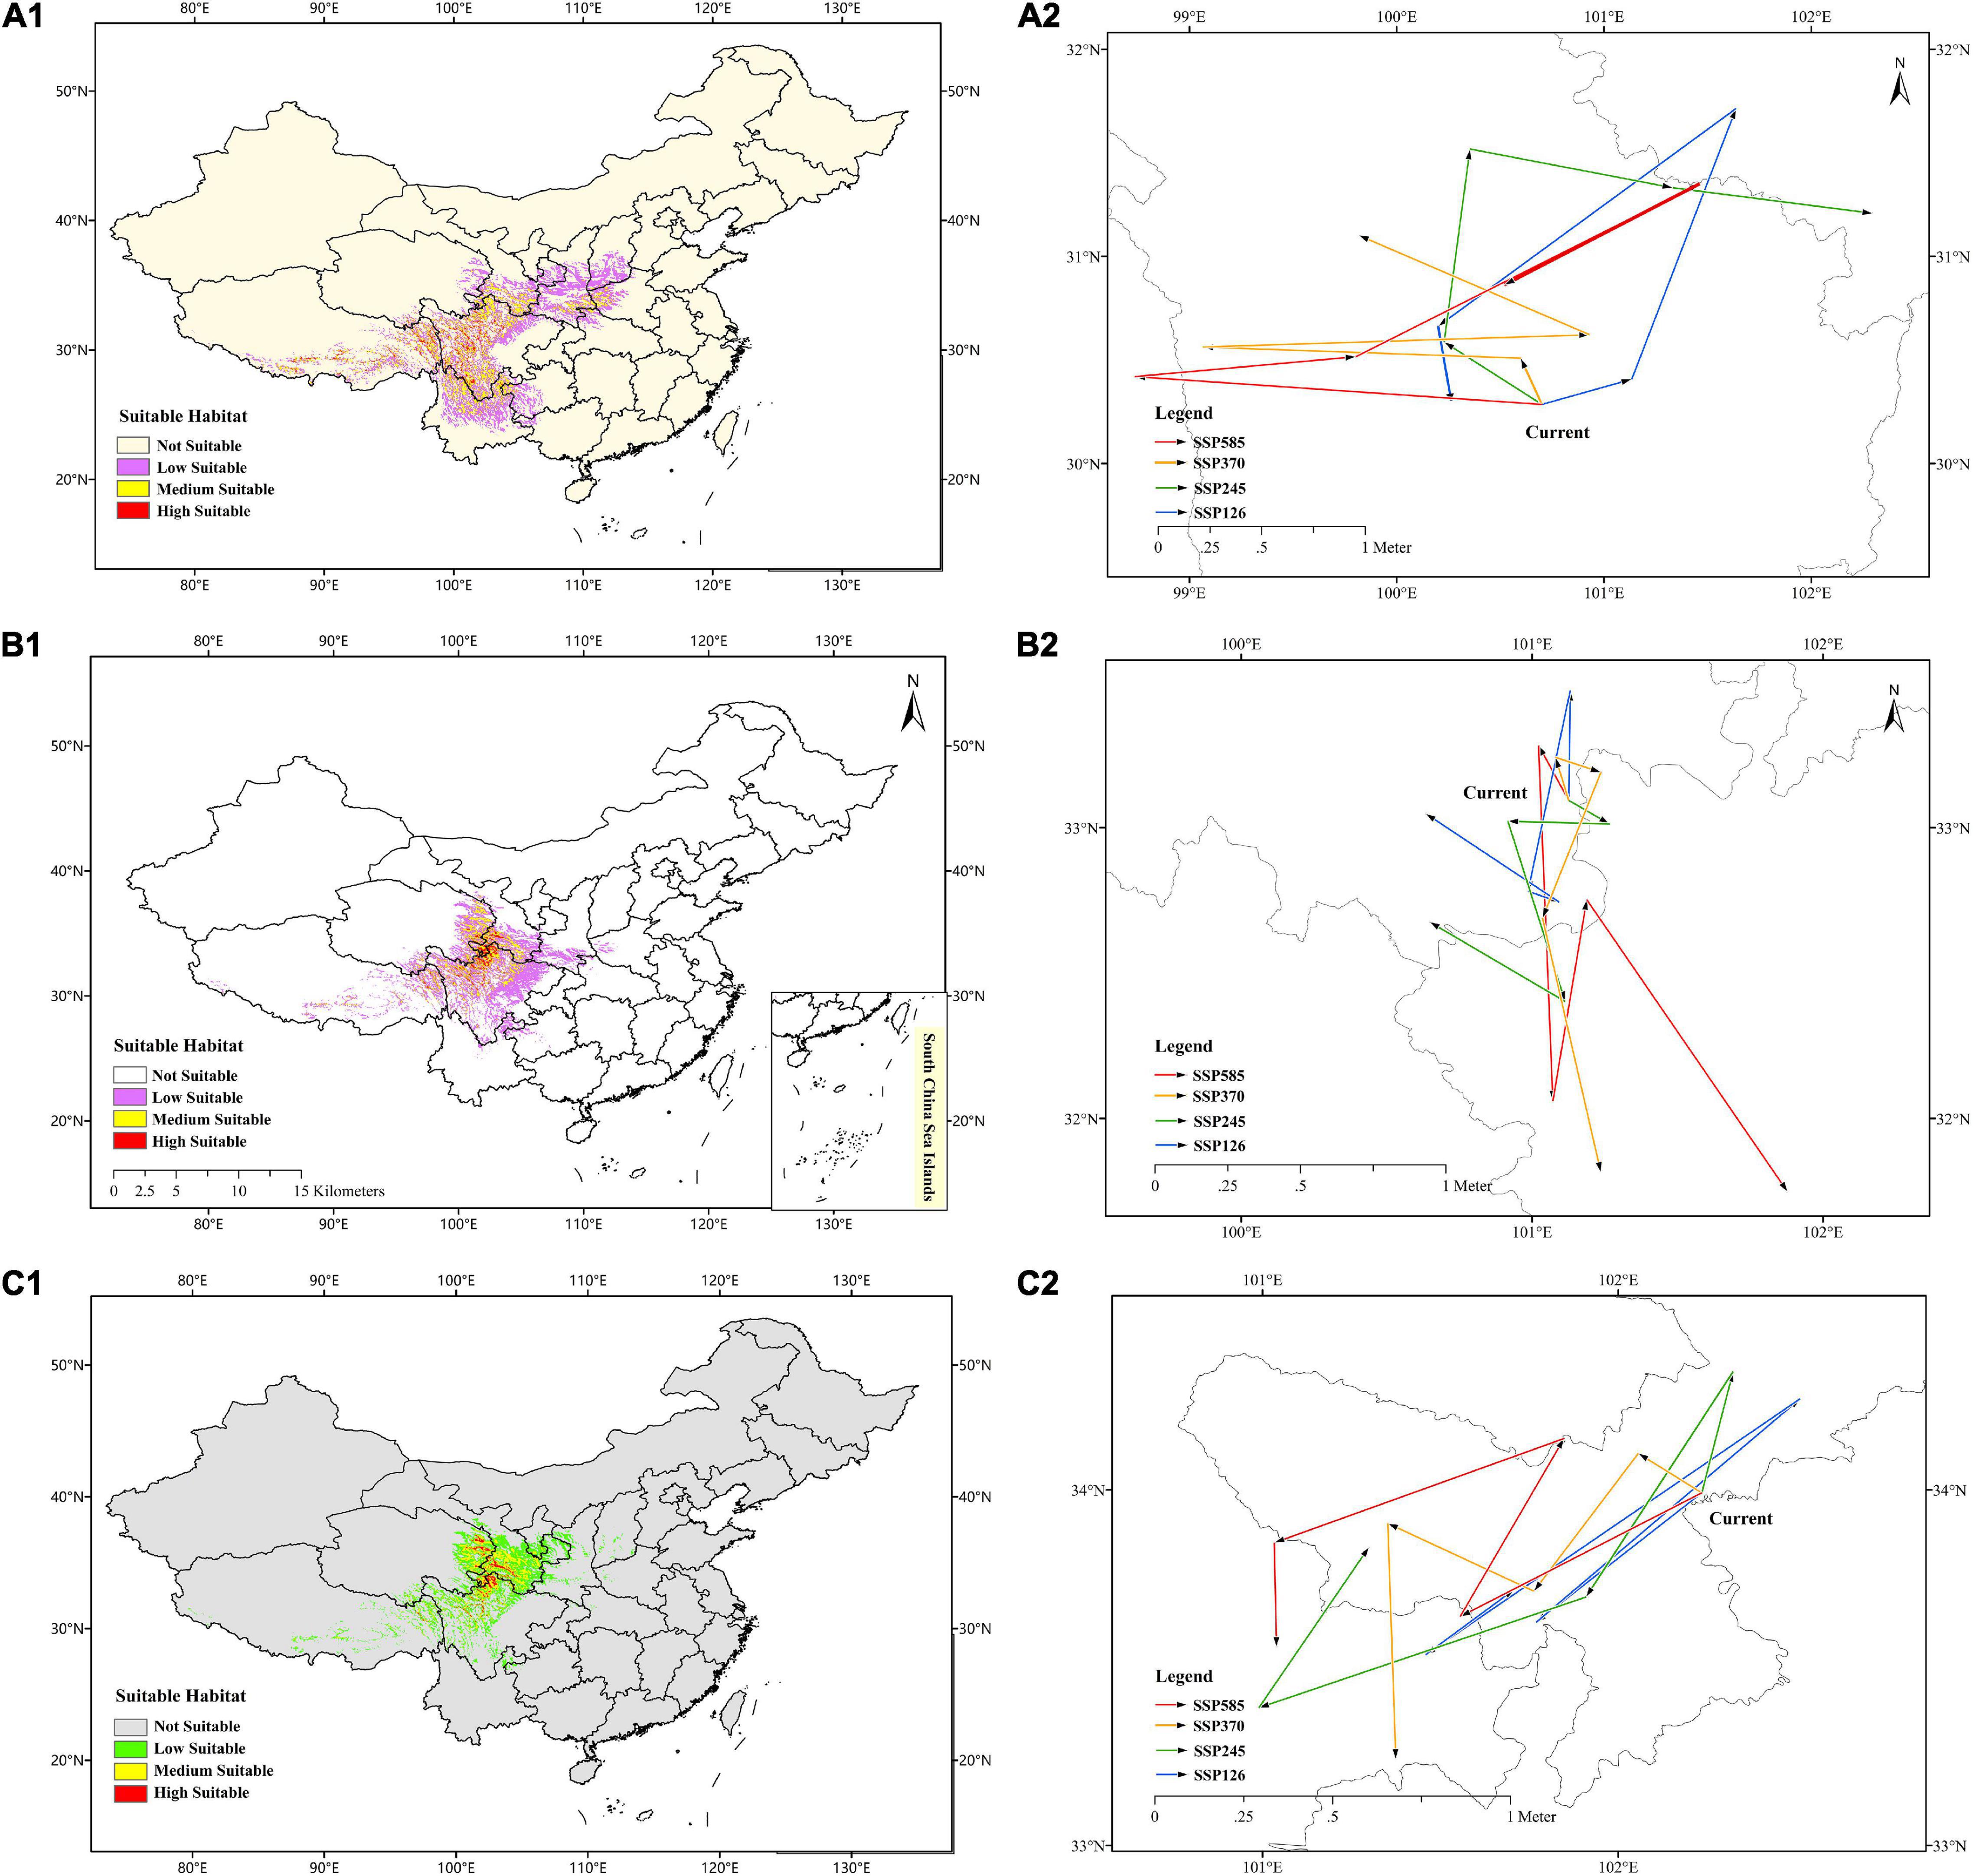
Figure 5. Predicted current distribution model and the core distributional shifts under different climate scenarios/year for three Fritillaria species. (A1–C1) Represented predicted current distribution for Fritillaria cirrhosa, Fritillaria unibracteata and Fritillaria przewalskii, respectively. (A2–C2) Represented core distributional shifts under different climate scenarios/year for Fritillaria cirrhosa, Fritillaria unibracteata and Fritillaria przewalskii, respectively.
In F. unibracteata, the evaluated highly suitable habitat was located in Sichuan, Qinghai, Gansu, and Tibet. The evaluated areas of moderately suitable habitat included Sichuan, Tibet, Qinghai, Gansu, Shaanxi, Henan, Hubei, and Yunnan. The current areas of suitable habitat for F. unibracteata encompassed 0.48 million km2 (Figure 5B1). As for F. przewalskii, the highly suitable habitat occurred in Gansu, Qinghai, Sichuan, and Tibet and the moderately suitable habitat distributed around the highly suitable growth area. The total area suitable habitat for F. przewalskii was 0.35 million km2, accounting for 3.64% of the total area of China (Figure 5C1).
Future Changes in Suitable Habitat Area
The centroid of the current habitat of F. cirrhosa was located at the site of 100°699′E and 30°275′N in south-west Sichuan province. The centroid of the suitable area shifted to 101°130′E, 30°399′N, 101°639′E, 31°704′N, 100°200′E, 30°656′N, 100°264′E, 30°3′N under SSP126 from 2021 to 2100. Under SSP245, the centroid of the future suitable area moved to 100°235′E, 30°584′N, 100°35′E, 31°507′N, 101°315′E, 31°331′N, 102°292′E, 31°302′N from 2021 to 2100. Under SSP370, the centroid of the future suitable area changed to 100°577′E, 30°486′N, 99°121′E, 30°558′N, 100°917′E, 30°611′N, 99°827′E, 31°089′N. Moreover, on the condition of SSP585, the centroid of the suitable area shifted to 98°741′E, 30°406′N, 99°782′E, 30°505′N, 101°460′E, 31°334′N, 100°540′E, 30°859′N. Overall, the core distribution of F. cirrhosa shifted toward the north-east under four scenarios (Figure 5A2). The elevation of the centroid under four scenarios (4,143–4,601 m) was higher than that of the current centroid (3,907 m).
In F. unibracteata, the centroid of the current habitat was located at the position of 101°124′E, 33°092′N in north-west Sichuan province. The centroid of the suitable area shifted to 101°132′E, 33°468′N, 100°991′E, 32°789′N, 101°087′E, 32°745′N, 100°645′E, 33°041′N from 2021 to 2100 under SSP126. Under SSP245, the centroid of the future suitable area moved to 101°257′E, 33°018′N, 100°918′E, 33°022′N, 101°114′E, 32°407′N, 100°653′E, 32°673′N from 2021 to 2100. Under SSP370, the centroid of the future suitable area changed to 101°081′E, 33°238′N, 101°236′E, 33°189′N, 101°038′E, 32°691′N, 101°238′E, 31°838′N from 2021 to 2100. Finally, under the condition of SSP585, the centroid of the suitable area shifted to 101°150′E, 33°078′N, 101°078′E, 32°070′N, 101°192′E, 32°732′N, 101°877′E, 31°742′N from 2021 to 2100. Overall, the core distribution of F. unibracteata shifted toward the south under four scenarios (Figure 5B2).
Additionally, in F. przewalskii, the centroid of the current habitat was located at the position of 102°236′E, 33°99′N in north-west Sichuan province. The centroid of the suitable area shifted to 101°769′E, 33°627′N, 102°511′E, 34°256′N, 101°459′E, 33°536′N, 101°708′E, 33°719′N from 2021 to 2100 under SSP126. Under SSP245, the centroid of the future suitable area moved to 102°328′E, 34°331′N, 101°911′E, 33°697′N, 100°996′E, 33°39′N, 101°299′E, 33°834′N from 2021 to 2100. Under SSP370, the centroid of the future suitable area changed to 102°059′E, 34°102′N, 101°766′E, 33°711′N, 101°355′E, 33°904′N, 101°377′E, 33°246′N from 2021 to 2100. Finally, under the condition of SSP585, the centroid of the suitable area shifted to 101°559′E, 33°647′N, 101°85′E, 34°141′N, 101°036′E, 33°852′N, 101°039′E, 33°564′N from 2021 to 2100. Generally, the core distribution of F. przewalskii shifted slightly toward the south-west under four scenarios (Figure 5C2). The elevation of the centroid under four scenarios (3,503–4,284 m) also increased compared with that of the current centroid (3,425 m).
As shown in Supplementary Table 5, in F. cirrhosa (Figure 6A), the areas of highly and moderately suitable habitats, as well as suitable habitats (including high, moderate, and low suitable habitats) increased in a wave-like change under the SSP126 scenario. The maximum area of highly and moderately suitable habitats appeared in 2041–2060 with 0.48 and 2.32%, respectively. Under the SSP245 scenario, the highly and moderately suitable habitats, as well as the suitable habitat continuously increased from 2020 to 2100. Both the maximum area of highly and moderately suitable habitats appeared in 2081–2100 with 0.97 and 4.12%, respectively. Moreover, under the SSP370 scenario, the highly and moderately suitable habitats showed a similar increasing tendency as SSP126. The highly and moderately suitable habitats reached the maximum at 2061–2080 period with 1.39 and 4.01%, respectively. Finally, under the SSP585 scenario, the highly and suitable habitats as well as suitable habitat showed similar tendencies as those under the SSP126 scenario from 2020 to 2100. The highly and moderately suitable habitats reached the maximum at 2081–2100 with 1.53% and at 2061–2080 with 3.95%, respectively. Overall, SSP585 was the optimum scenario for F. cirrhosa, since the highly and totally suitable habitats reached the maximum areas during 2021–2100 at 146,758 and 133,884.2 km2, respectively.
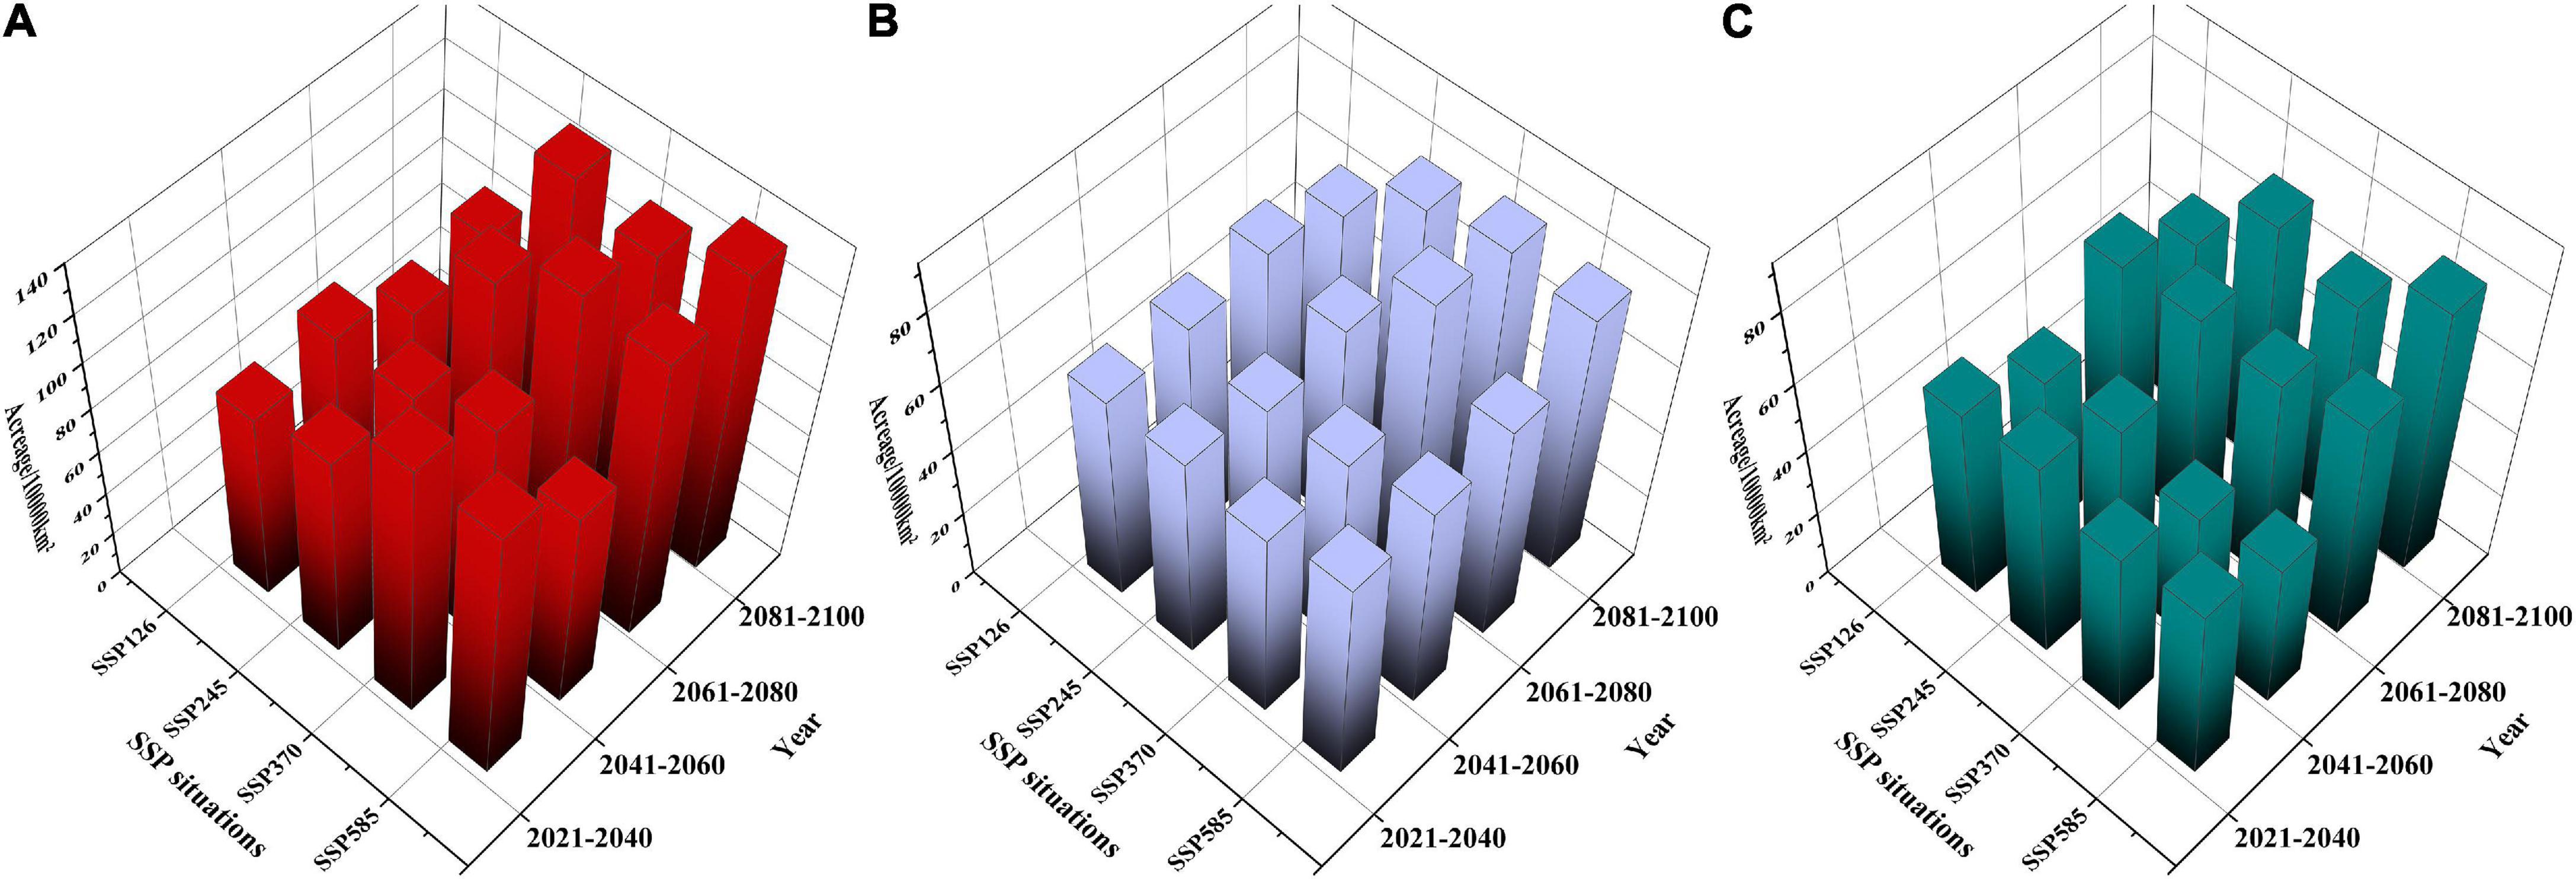
Figure 6. The suitable areas of three Fritillaria species in China under future climate conditions. (A) F. cirrhosa, (B) F. unibracteata, and (C) F. przewalskii.
In F. unibracteata (Figure 6B), the areas of highly and moderately suitable habitats as well as suitable habitat increased first and then declined slightly (but higher than that of the current corresponding habitat) under the SSP126 scenario. The maximum area of the highly and moderately suitable habitats appeared in 2061–2080 with 0.36 and 1.66%, respectively. Under the SSP245 scenario, the highly and moderately as well as totally suitable habitat increased in a wave-like change. The maximum area of highly and moderately suitable habitats appeared in 2041–2060 with 0.46% and in 2081–2100 with 1.61%, respectively. Furthermore, under the SSP370 scenario, the highly and moderately, as well as totally suitable habitat showed a similar tendency as those under the SSP245 scenario. The highly and moderately suitable habitats reached the maximum at 2081–2100 with 0.54% and at 2061–2080 with 1.96%, respectively. Finally, under the SSP585 scenario, the highly and moderately as well as the totally suitable habitat increased continuously. Both highly and moderately suitable habitats reached the maximum at 2081–2100 with 0.36 and 2.08%, respectively. Overall, SSP370 was the optimum scenario for F. unibracteata, since the highly and totally suitable habitats reached the maximum areas during 2021–2100 at 517.39 and 831.501 km2, respectively.
In F. przewalskii (Figure 6C), the areas of highly and moderately as well as totally suitable habitat increased in a wave-like change under SSP126, SSP245, SSP370, and SSP585 scenario, respectively. Under the SSP126 scenario, both the maximum area of highly and moderately suitable habitats appeared in 2061–2080 with 0.65 and 1.66%, respectively. Under the SSP245 scenario, the maximum area of both highly and moderately suitable habitats appeared in 2080–2100 with 0.89 and 2.24%, respectively. Additionally, under the SSP370 scenario, the highly and moderately suitable habitats reached the maximum at 2061–2080 with 0.84% and 2081–2100 with 2.00%, respectively. Finally, under the SSP585 scenario, the highly and moderately suitable habitats reached the maximum at 2081–2100 with 1.10 and 2.43%, respectively. SSP585 was the optimum scenario for F. przewalskii since the highly, moderately, and suitable habitats reached the maximum areas during 2021–2100 at 106,043, 232,835, and 784,581 km2, respectively.
Ecological Niche Overlapping of Three Fritillaria Species
We carried out a prediction on the ecological niche overlap of three Fritillaria species based on the distribution maps (Figure 2). As a result, F. unibracteata showed the broadest niche (indicated by the highest value of B1 and B2: 0.187 and 0.908, respectively), while the F. cirrhosa showed a narrower niche (B1 and B2: 0.155 and 0.886, respectively) and F. przewalskii showed the narrowest (B1 and B2: 0.112 and 0.874). The most similar niches were of F. unibracteata and F. przewalskii, which is indicated by the highest values of niche overlap (I: 0.927, D: 0.723). Fritillaria cirrhosa was more similar to F. unibracteata (I: 0.896, D: 0.659) than to F. przewalskii (I: 0.879, D: 0.619). Then, based on the statistics and calculations, the overlapping degree in highly and moderately suitable habitats of F. cirrhosa and F. unibracteata was 34.43%, those of F. cirrhosa and F. przewalskii was 26.06% and those of F. unibracteata and F. przewalskii was 50.00% (Figure 7B). The results coincided with the results of prediction by ENMTools that F. unibracteata and F. przewalskii shared the highest niche overlap.
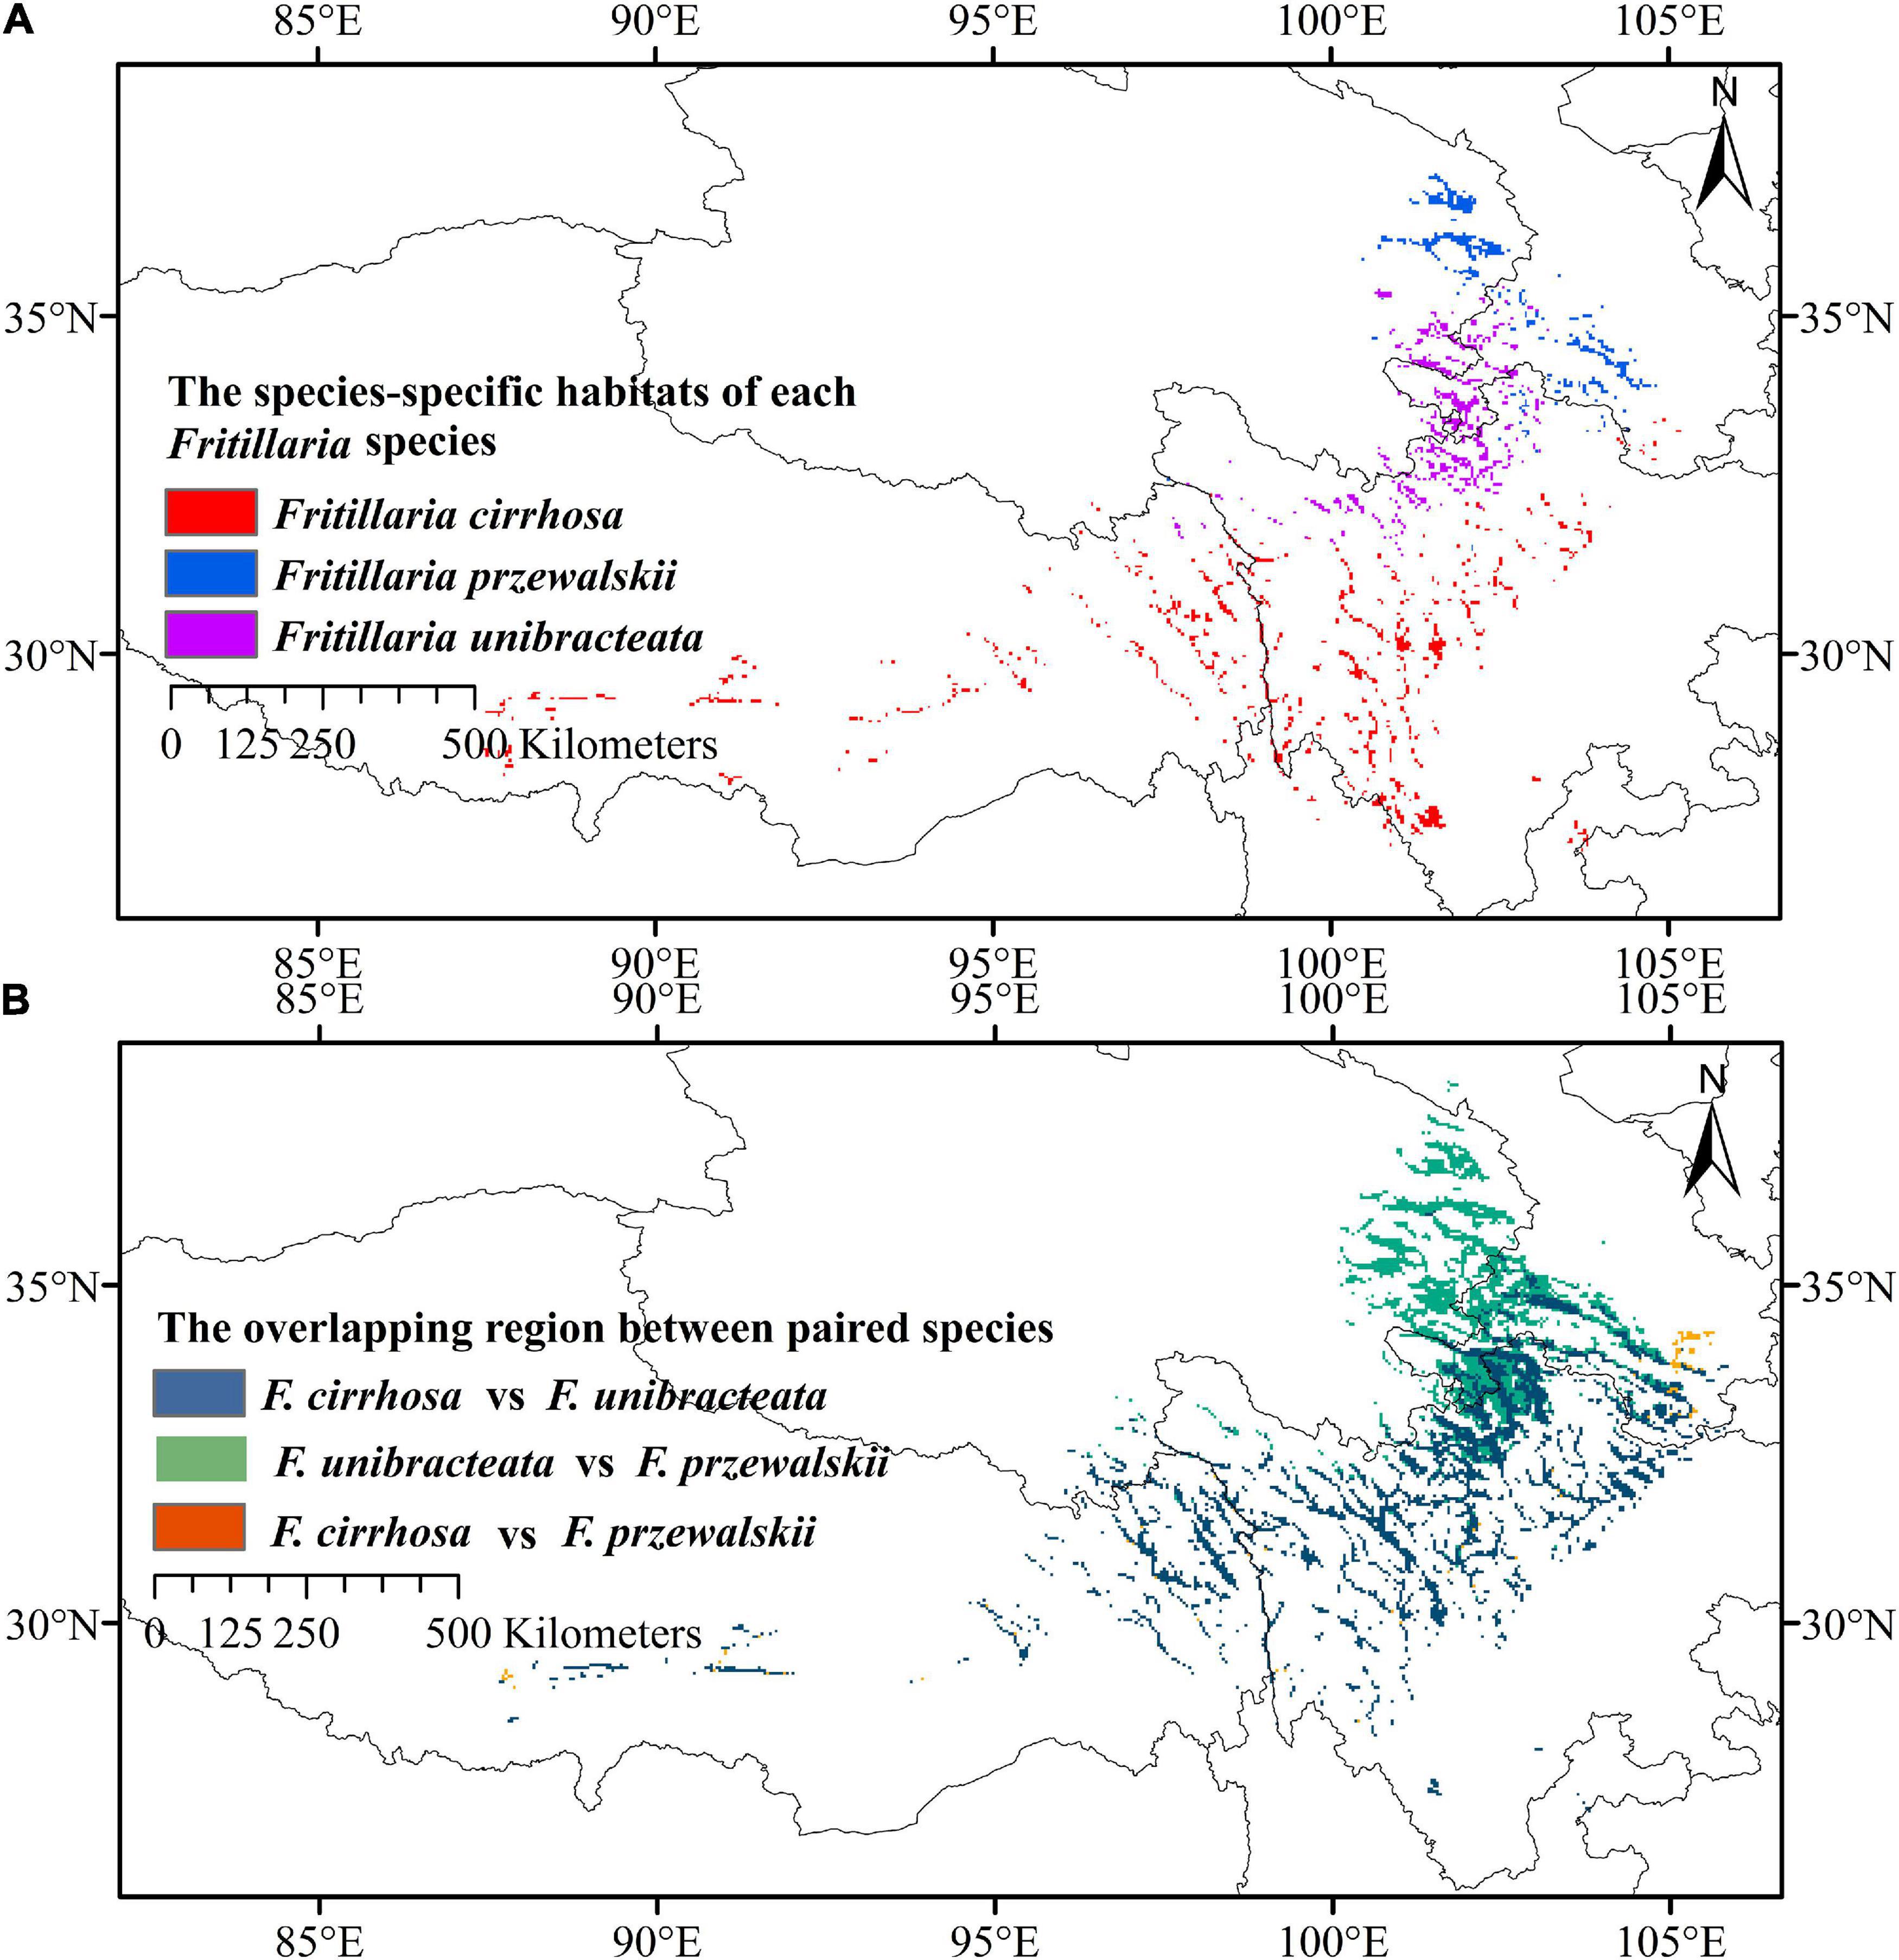
Figure 7. Distribution patterns of three Fritillaria species. (A) Species-specific high suitable habitats of Fritillaria cirrhosa, Fritillaria unibracteata, and Fritillaria przewalskii. (B) Overlapping region of high and medium suitable habitats between paired species.
After predicting the overlapping and specific suitable habitats of the three Fritillaria species, we found that the densely overlapping highly and moderately suitable habitats were mainly distributed in the Himalayan–Hengduan Mountains region, and mainly concentrated in Sichuan, Tibet, Qinghai, Gansu, and Shanxi provinces (Figure 7B). The specific highly suitable habitat of F. cirrhosa was distributed at southwest Sichuan, north Yunnan, east Tibet, and some were distributed at Shaanxi, Henan, and Hubei. The specific highly suitable habitat of F. unibracteata was mainly concentrated in north Sichuan, south Qinghai, and west Gansu. The specific highly suitable habitat of F. przewalskii was mainly concentrated in Gansu, Qinghai, and Sichuan province as shown in Figure 7A.
To study the correlation between the overlapping extent and the evolutionary distance between different Fritillaria species, ITS1 (Figure 8A), ITS2 (Figure 8B), ITS1+ITS2 (Figure 8C), and CP (Figure 8D) were obtained, and further the phylogenetic trees were constructed (Figure 8) and the corresponding evolutionary distance was calculated (Supplementary Table 6). As shown in Table 2, the correlation between evolutionary distances based on ITS2 and CP, and overlapping extent showed weak accuracy (no correlation, R2 = 0.289) with no significant correlation (P >> 0.05), whereas that of ITS1 obtained medium accuracy (R2 = 0.766) but high P-value. The evolutionary distances based on ITS1+ITS2 and overlapping extent showed a positive correlation with relatively higher accuracy (R2 = 0.93) and lower P-value (P = 0.12).
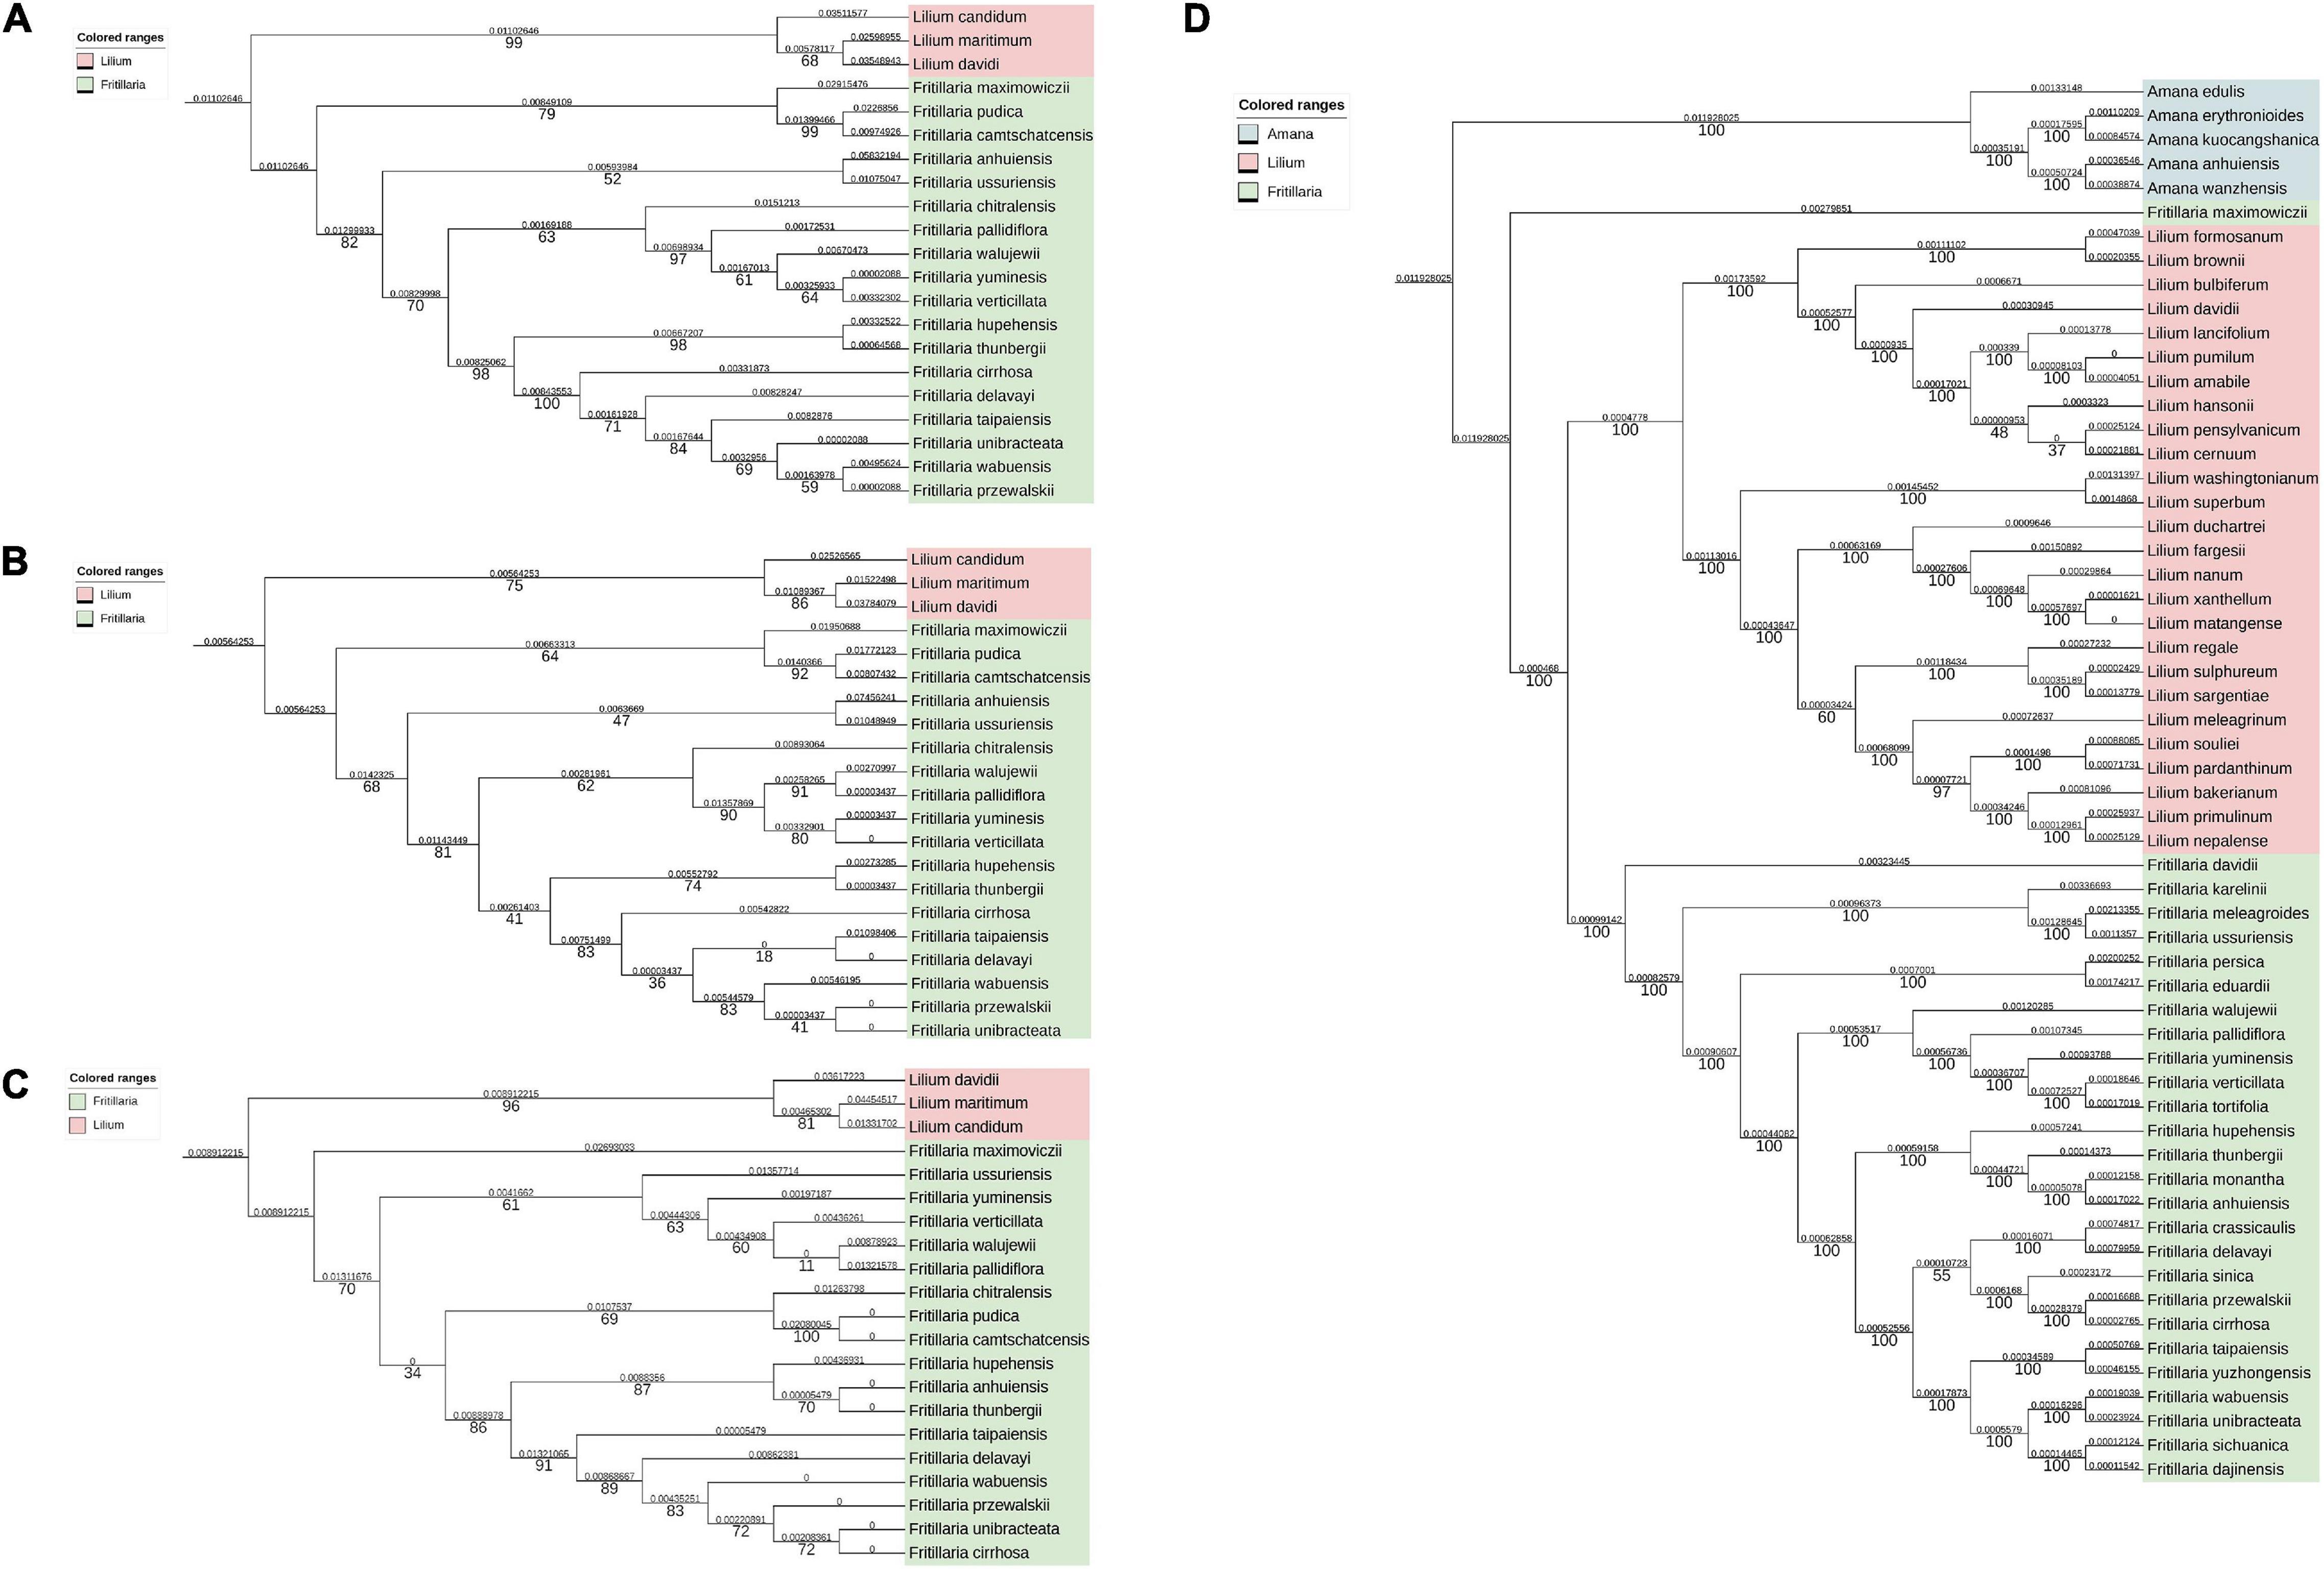
Figure 8. Phylogenetic trees based on ITS1, ITS2, ITS1+ITS2, and CP genome. The pairwise distance (above the branches) and bootstrap value (under the branches) were listed. (A) Phylogenetic trees based on ITS1 sequences. (B) phylogenetic trees based on ITS2 sequences; (C) phylogenetic trees based on ITS1+ITS2 sequences; (D) phylogenetic trees based on CP genomes.
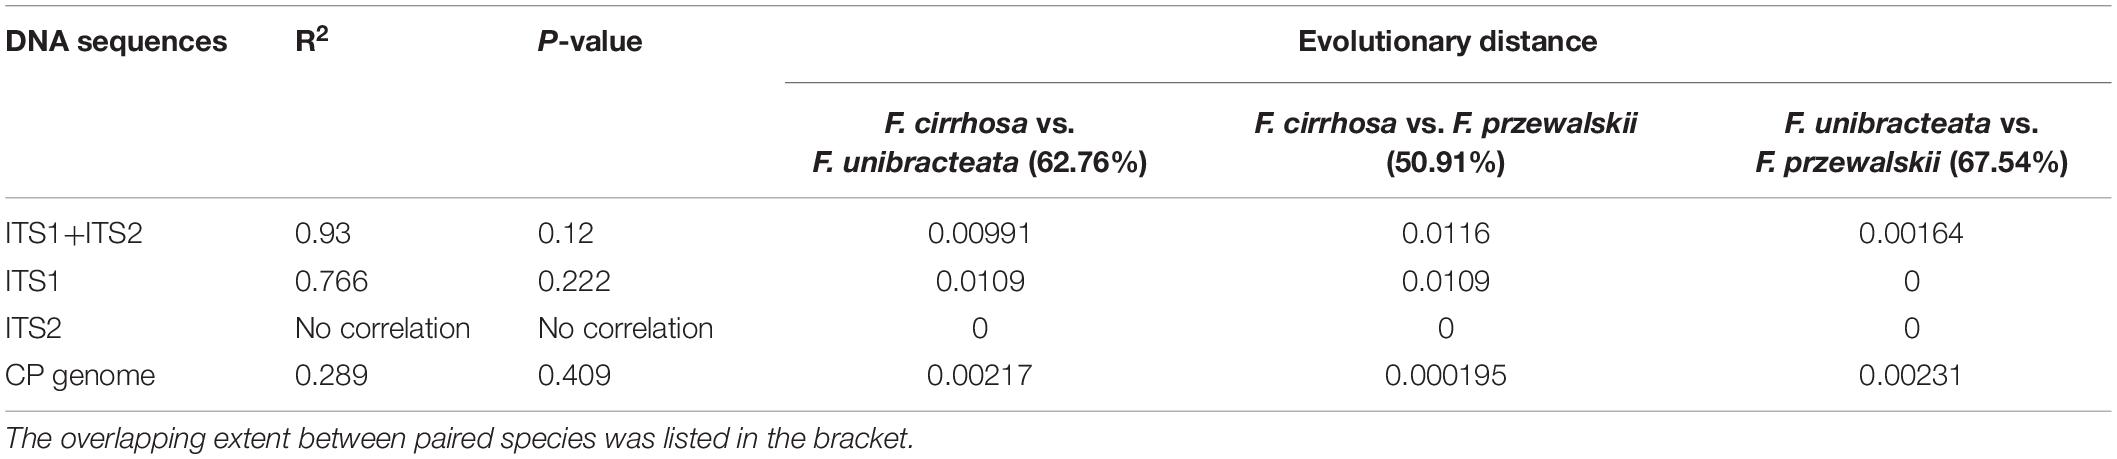
Table 2. The correlation between distribution pattern and phylogenetic relationship.
Discussion
As classical method, SDMs utilized current data to build a correlative model that met ecological requirements of species and thus predicted the relative habitat suitability in the future (Warren and Seifert, 2011). To obtain reliable prediction, it was necessary to improve the quality and accuracy of current data rigorously. During the initial process of collecting records, several records were excluded due to highly spatial autocorrelation. This procedure would avoid sample bias and was suggested by Zhu et al. (2012) and Wu et al. (2021). Second, the correlation analysis and reasonable selection of environmental variables would reduce the complexity of machine learning models and increase the researching sense. Similar studies have been reported extensively (Wang et al., 2018; Feng et al., 2019; Zurell et al., 2020). Meanwhile, various SDMs, parameterization, and evaluation index would provide comprehensive reliability of models. Especially, although most literatures employed 75% data as training set and 25% data as testing set (Wang et al., 2018; Zhang et al., 2018; Ren et al., 2020), our result indicated that the proportion of training/testing should be considered. Prediction of GARP was lower compared to MaxEnt, as indicated by AUC, KAPPA, and TSS values, suggesting that MaxEnt performed excellently (Warren and Seifert, 2011; Zhu et al., 2012). Then, a detailed analysis on the suitable habitat of three Fritillaria species under current and future climate scenarios, and also a prediction of ecological niche overlapping was carried out. All the results would function as an important step in formulating a feasible strategy for their conservation and artificial cultivation.
Our model indicated that the center area for F. cirrhosa was in the south-west Sichuan province. This result was in agreement with the previous study that found this species mainly distributed in the Himalayan–Hengduan Mountain area (Li X. et al., 2017). Interestingly, some areas of Gansu, Shanxi, Henan, Guizhou, and Hubei provinces were also evaluated to be highly suitable habitats for this species, and this would provide areas for introducing F. cirrhosa in the future. Compared with F. cirrhosa, F. unibracteata and F. przewalskii were intensively distributed in Sichuan, Qinghai, Gansu, and Tibet, respectively.
Among the environmental variables, precipitation, elevation, and temperature contributed mostly to the distribution model for three Fritillaria species in respect to other variables, indicating that these factors played role in controlling their distribution. This result was supported by the fact that the climatic factors of an area acted as key elements for population regeneration. Most of the distribution area, including the center area, of three Fritillaria species received the influence of monsoon from the Indian and Pacific oceans and has sufficient precipitation from May to September. Water was reported to play an essential role in root growth (Sharma et al., 2021), seed dormancy and germination (Sheppard et al., 2014), and leaf growth and photosynthesis (Peng et al., 2021). Water deficiency would activate transcription factors and thus promote the expression of stress-related genes (Van Beek et al., 2021), whereas sufficient water would increase stomatal and leaf area (Mozo et al., 2021) and promote dormancy and germination (Chritine et al., 2014; Sheppard et al., 2014). In this study, three Fritillaria species shared similar precipitation, indicating the similar water requirement of the three species. As annual precipitation, lower than 335.98 mm, greatly reduced the probability of the presence of three Fritillaria species, it was considered to be an important constraint. Especially, the suitable precipitation in several growth stages of Fritillaria species was of importance. Especially, September to October was sowing time for Fritillaria, and thus the suitable precipitation in this period would play a significant role in its seed germination and next-step growth. Second, the moderate precipitation in May implied that the water requirement was necessary for the bulb filling of Fritillaria species. During the filling stage, it was reported that balanced water supplement improved not only the seed formation but also nutrient accumulation in seed and next-step yield, while unbalanced water supplement would promote plant diseases, such as Fritillaria rust and root rot from April to June. Meanwhile, previous studies have shown that freezing rain would cause plant cellular damage, pollen abortion, and declined height (Sheppard et al., 2014), and thus the low precipitation in autumn was beneficial to avoid the frost damage of Fritillaria species.
The altitude usually interacted with the temperature and light intensity, which had a significant influence on the accumulation of metabolites and nutrients in underground bulbs. Moreover, altitude was also correlated with UV-B, which showed influence on the subaerial organs of plants. However, little was known about the influence of UV-B radiation on the growth of Fritillaria, and quantitative research studies were further recommended. The similar high altitude of F. cirrhosa and F. unibracteata ensured both species to use the relatively low temperature to reduce the energy consumption of respiration, while relatively high light intensity could increase the photosynthesis, which was beneficial for the accumulation of metabolites and nutrients in underground bulbs. This result was in agreement with a previous report by Cunningham et al. (2018), who indicated that the occurrence of F. cirrhosa was in high altitude (from 2,700 to 4,600 m). Compared with those of F. cirrhosa and F. unibracteata, F. przewalskii displayed lower optimum altitude (2455.73 m), indicating that the growth of F. przewalskii was associated with relatively weaker light intensity, lower temperature, and UV-B.
Temperature is the third factor that was reported to affect the vegetative growth (Li et al., 2009) and bulbs dormancy (Marković et al., 2020) of Fritillaria species. The seeds of most Fritillaria species contained immature embryos, and thus dormancy breaking of seeds in Fritillaria species was typically complex, requiring after-ripening process (Chen et al., 1993). Treatment of Fritillaria seeds with cold stratification would break the dormancy seed and shorten germination time (Zhang, 1992). In addition, the relatively narrow Bio4 indicated that the survival of Fritillaria species might be sensitive to temperature change. This result was in agreement with a previous report by Li et al. (2019), who indicated that the alpine plants were more sensitive to temperature variability.
With greenhouse gas emissions, some species will migrate to high latitude or high elevation, while other species maintained the current location by changing physiologically or phenologically (Zhang et al., 2018; Faticov et al., 2021). Our prediction showed that the shift of F. cirrhosa from current altitude to higher altitude would become gradually more significant. Furthermore, the centroidal elevation of both F. cirrhosa and F. przewalskii shift were higher than the current habitat, which might be facilitated through adaptations. However, F. unibracteata might adapt to the changes of greenhouse gas emissions, as shown in unchanged centroid of suitable areas. Under higher concentrations of greenhouse gas emissions scenario, suitable habitat range of three species showed similar tendency to increase despite varying degrees. Under the highest emission (SSP585) scenario, the suitable area of F. cirrhosa and F. przewalskii reached the maximum 196.33 and 224.68%, respectively, in respect to that of the current situation, while those of F. unibracteata reached the maximum 172.65% under medium emission (SSP370) in respect to the current situation. That result was consistent with that of previous research studies, which indicated that temperature had a positive effect on plants by accelerating the process of phenology, improving growth rate and size, and increasing the soil nutrients (Jia et al., 2016; Li F. et al., 2017; Zettlemoyer et al., 2019). However, the sensitiveness of various species on temperature might be due to different adaptive rates, despite the adaptive mechanism being elusive.
Another consideration that would influence the distribution of species was the ecological niche. Such high Schoener’s D and Hellinger’s I values suggested that three Fritillaria species shared highly similar environmental factors and showed a high ecological niche. Consistently, three species shared commonly important environmental factors, including precipitation, elevation, and temperature, and corresponding similar optimum values. Moreover, as shown in Figure 7, the highly suitable habitats of three Fritillaria species were overlapped, and thus the current distributions of three species in this overlapping area could be estimated. As a result, approximately 50% distributions of F. przewalskii were located in the overlapping area, indicating the high ecological niche among three species. Generally, plants with close a relationship share a similar mechanism to adapt to living environments in the evolution process (Milanesi et al., 2018), and thus it was probable to find a correlation between phylogenetic relationships and ecological niche overlap among these species. To understand the correlation between ecological niche and phylogenies, the phylogenetic tree between Fritillaria species was constructed. In the phylogenetic tree, F. cirrhosa, F. unibracteata, and F. przewalskii formed a close clade with Fritillaria unibracteata var wabuensis and represented a close relationship. Therefore, the high accuracy supported that the spatial distribution was related to the phylogenies despite the relatively weak P-value (Table 2). The weak significance was also observed in Pipridae reported by Villegas et al. (2021) and Profundulidae reported by Miguel Calixto-Rojas et al. (2021). One possible reason is that the species evolution was controlled by multiple factors, such as spatial distribution, sexual reproduction, and geographical barrier (Zheng et al., 2021). Hopefully, the statistical value would be more reliable if another or more factors that contribute to species evolution are added in the correlation analysis. Another reason might be the limited species in this study. Tucker et al. (2018) showed that phylogenetic diversity correlated with functional diversity increasingly strongly as more species are included in the functional diversity measure. Hopefully, phylogenetic diversity might be a useful surrogate for high-dimensional trait diversity on the condition of sufficient Fritillaria samples. The third is the application of advanced machine learning that might provide a strategy; Grundler and Rabosky (2020) developed Dirichlet-multinomial framework to model resource use evolution on phylogenetic trees.
In addition, central Sichuan and the border regions between Sichuan, Qinghai, and Gansu Province were the main overlapping highly and moderately suitable areas of the three Fritillaria species. Meanwhile, the specific highly suitable habitat of F. cirrhosa, F. unibracteata, F. przewalskii were mainly distributed in southwest Sichuan, the border regions between Sichuan, Qinghai, and Gansu, respectively (Figure 7). For example, the non-overlap highly and moderately suitable habitats will be the preferable choices for cultivation to decrease habitat competition among species, improve production, and protect rare species as well.
Conclusion
The role of future climate on the distribution of Fritillaria species is of vital importance for conservation. Our results indicated that the suitable habitat for three Fritillaria species tends to increase under the scenario for medium and highest concentration of greenhouse gas emissions. However, under the emission of greenhouse gas, we predicted that F. cirrhosa moved to high latitude and high elevation, while F. przewalskii migrated to high latitude and F. unibracteata did not migrate. The spatial and temporal shifts as well as the niche overlap between the three species would be a useful reference in developing a reasonable conservation strategy for those three medicinally important species.
Data Availability Statement
The original contributions presented in the study are included in the article/Supplementary Material, further inquiries can be directed to the corresponding authors.
Author Contributions
RJ and MZ performed the experiments. RJ, MZ, YQ, GT, SH, and HQ analyzed the data. JZ and HL contributed to the materials and analysis tool, wrote and were responsible for the manuscript. All authors contributed to the article and approved the submitted version.
Funding
This study was partially funded by the National Natural Science Foundation of China (No. 31500276), the Sichuan Science and Technology Program (Nos. 2018SZ0061 and 2021ZHFP0170), the Sichuan Administration of TCM program (No. 2021MS116), and the Fundamental Research Funds for the Central Universities (No. 2682021ZTPY017).
Conflict of Interest
The authors declare that the research was conducted in the absence of any commercial or financial relationships that could be construed as a potential conflict of interest.
Publisher’s Note
All claims expressed in this article are solely those of the authors and do not necessarily represent those of their affiliated organizations, or those of the publisher, the editors and the reviewers. Any product that may be evaluated in this article, or claim that may be made by its manufacturer, is not guaranteed or endorsed by the publisher.
Supplementary Material
The Supplementary Material for this article can be found online at: https://www.frontiersin.org/articles/10.3389/fpls.2021.749838/full#supplementary-material
Footnotes
References
Abou-Shaara, H., Alashaal, S. A., Hosni, E. M., Nasser, M. G., Ansari, M. J., and Alharbi, S. A. (2021). Modeling the invasion of the large hive beetle, Oplostomus fuligineus, into North Africa and South Europe under a changing climate. Insects 12:275. doi: 10.3390/insects12040275
Assefa, A., Tibebu, A., Bihon, A., and Yimana, M. (2021). Global ecological niche modelling of current and future distribution of peste des petits ruminants virus (PPRv) with an ensemble modelling algorithm. Transbound Emerg. Dis. 68, 3601–3610. doi: 10.1111/tbed.13967
Calixto-Rojas, M., Lira-Noriega, A., Rubio-Godoy, M., de León, G. P. P., and Pinacho-Pinacho, C. D. (2021). Phylogenetic relationships and ecological niche conservatism in killifish (Profundulidae) in Mesoamerica. J. Fish Biol. 99, 396–410. doi: 10.1111/jfb.14727
Chen, Q., Wu, X. B., and Zhang, D. Q. (2020). Comparison of the abilities of universal, super, and specific DNA barcodes to discriminate among the original species of Fritillariae cirrhosae bulbus and its adulterants. PLoS One 15:e0229181. doi: 10.1371/journal.pone.0229181
Chen, Y., Zhang, J., and Li, X. E. (1993). Temperature requirements for afterripening of the embryo of Fritillaria cirrhosa Don.f. Zhongguo Zhong Yao Za Zhi 18, 270–272,317.
Cheng, T., Xu, C., Lei, L., Li, C. H., Zhang, Y., and Zhou, S. L. (2016). Barcoding the kingdom plantae: new PCR primers for ITS regions of plants with improved universality and specificity. Mol. Ecol. Resour. 16, 138–149. doi: 10.1111/1755-0998.12438
Cunningham, A. B., Brinckmann, J. A., Pei, S. J., Luo, P., Schippmann, U., Long, X., et al. (2018). High altitude species, high profits: can the trade in wild harvested Fritillaria cirrhosa (Liliaceae) be sustained? J. Ethnopharmacol. 223, 142–151. doi: 10.1016/j.jep.2018.05.004
Deng, Y., Zheng, H., Yan, Z. C., Liao, D. Y., Li, C. L., Zhou, J. Y., et al. (2018). Full-length transcriptome survey and expression analysis of Cassia obtusifolia to discover putative genes related to aurantio-obtusin biosynthesis, seed formation and development, and stress response. Int. J. Mol. Sci. 19:2476. doi: 10.3390/ijms19092476
Eyres, A., Böhning-Gaese, K., Orme, C. D. L., Rahbek, C., and Fritz, S. A. (2020). A tale of two seasons: the link between seasonal migration and climatic niches in passerine birds. Ecol. Evol. 10, 11983–11997. doi: 10.1002/ece3.6729
Faticov, M., Abdelfattah, A., Roslin, T., Vacher, C., Hambäck, P., Blanchet, F. G., et al. (2021). Climate warming dominates over plant genotype in shaping the seasonal trajectory of foliar fungal communities on oak. New Phytol. 231, 1770–1783. doi: 10.1111/nph.17434
Feng, X., Park, D. S., Liang, Y., Pandey, R., and Papes, M. (2019). Collinearity in ecological niche modeling: confusions and challenges. Ecol. Evol. 9, 10365–10376. doi: 10.1002/ece3.5555
Fernández, I. C., and Morales, N. S. (2019). One-class land-cover classification using MaxEnt: the effect of modelling parameterization on classification accuracy. PeerJ 7:e7016. doi: 10.7717/peerj.7016
Fick, S. E., and Hijmans, R. J. (2017). WorldClim 2: new 1-km spatial resolution climate surfaces for global land areas. Int J Climatol 37, 4302–4315.
Fitzpatrick, R. B. (2008). Reprotox: an information system on environmental hazard to human reproduction and development. Med. Ref. Serv. Q. 27, 73–80.
Gao, Y., Wang, C., Song, B., and Du, F. (2019). Corolla retention after pollination facilitates the development of fertilized ovules in Fritillaria delavayi (Liliaceae). Sci. Rep. 9:729. doi: 10.1038/s41598-018-37358-0
Giménez-Benavides, L., Albert, M. J., Iriondo, J. M., and Escudero, A. (2011). Demographic processes of upward range contraction in a long-lived Mediterranean high mountain plant. Ecography 34, 85–93.
Grundler, M., and Rabosky, D. L. (2020). Complex ecological phenotypes on phylogenetic trees: a markov process model for comparative analysis of multivariate count data. Syst. Biol. 69, 1200–1211. doi: 10.1093/sysbio/syaa031
Jia, J., Dai, Z., Li, F., and Liu, Y. (2016). How will global environmental changes affect the growth of Alien plants? Front. Plant Sci. 7:1623. doi: 10.3389/fpls.2016.01623
Jiang, Y. H. (2017). Suitability Evaluation and Prediction of Potential Distribution of Pinus Koraiensis Based on Random Forest Model. Ph. D. Dissertation. Beijing: Chinese Academy of Forestry.
Khan, S. A., Baeshen, M. N., Ramadan, H. A., and Baesshen, N. A. (2019). ITS2: an ideal DNA barcode for the arid medicinal plant Rhazya stricta. Pharmaceut. Med. 33, 53–61. doi: 10.1007/s40290-019-00266-3
Kumar, S., Stecher, G., Li, M., Knyaz, C., and Tamura, K. M. E. G. A. X. (2018). Molecular evolutionary genetics analysis across computing platforms. Mol. Biol. Evol. 35, 1547–1549. doi: 10.1093/molbev/msy096
Lakey, L., and Dorji, K. (2016). Ecological status of high altitude medicinal plants and their sustainability: Lingshi, Bhutan. BMC Ecol. 16:45. doi: 10.1186/s12898-016-0100-1
Lawler, J. J. (2009). Climate change adaptation strategies for resource management and conservation planning. Ann. N.Y. Acad. Sci. 21, 79–98. doi: 10.1111/j.1749-6632.2009.04147.x
Levins, R. (1968). Evolution in Changing Environments: Some Theoretical Explorations. Princeton, NJ: Princeton University Press.
Li, F., Peng, Y. F., Natali, S. M., Chen, K. L., Han, T. F., Yang, G. B., et al. (2017). Warming effects on permafrost ecosystem carbon fluxes associated with plant nutrients. Ecology 98, 2851–2859. doi: 10.1002/ecy.1975
Li, L. H., Zhang, Y. L., Wu, J. S., Li, S. C., Zhang, B. H., Zu, J. X., et al. (2019). Increasing sensitivity of alpine grasslands to climate variability along an elevational gradient on the Qinghai-Tibet Plateau. Sci. Total Environ. 678, 21–29. doi: 10.1016/j.scitotenv.2019.04.399
Li, X., Liu, L., Gu, X., and Xiang, J. Y. (2017). Heavy collecting induces smaller and deeper Fritillariae Cirrhosae Bulbus in the wild. Plant Divers. 39, 208–213. doi: 10.1016/j.pld.2017.05.002
Li, X. W., Dai, Y., and Chen, S. L. (2009). Growth and physiological characteristics of Fritillaria cirrhosa in response to high irradiance and shade in age-related growth phases. Environ. Exp. Bot. 67, 77–83.
Ma, B., and Sun, J. (2018). Predicting the distribution of Stipa purpurea across the Tibetan Plateau via the MaxEnt model. BMC Ecol. 18:10. doi: 10.1186/s12898-018-0165-0
Marković, M., Trifunović, M. M., Uzelac, B., Cingel, A., Milošević, S., Jevremović, S., et al. (2020). Breaking the dormancy of snake’s head fritillary (Fritillaria meleagris L.) in vitro bulbs-part 1: effect of GA(3), GA inhibitors and temperature on fresh weight, sprouting and sugar Content. Plants 9:1449. doi: 10.3390/plants9111449
Midgley, G. F., and Thuiller, W. (2005). Global environmental change and the uncertain fate of biodiversity. New Phytol. 167, 638–641. doi: 10.1111/j.1469-8137.2005.01522.x
Milanesi, P., Caniglia, R., Fabbri, E., Puopolo, F., Galaverni, M., and Holderegger, R. (2018). Combining Bayesian genetic clustering and ecological niche modeling: insights into wolf intraspecific genetic structure. Ecol. Evol. 8, 11224–11234. doi: 10.1002/ece3.4594
Mozo, I., Rodríguez, M. E., Monteoliva, S., and Luquez, V. M. C. (2021). Floodwater depth causes different physiological responses during post-flooding in willows. Front. Plant Sci. 12:575090. doi: 10.3389/fpls.2021.575090
Parmesan, C., and Yohe, G. (2003). A globally coherent fingerprint of climate change impacts across natural systems. Nature 421, 37–42. doi: 10.1038/nature01286
Peng, C., Song, Y., Li, C., Mei, T., Wu, Z., Shi, Y., et al. (2021). Growing in mixed stands increased leaf photosynthesis and physiological stress resistance in Moso bamboo and mature Chinese Fir plantations. Front. Plant Sci. 12:649204. doi: 10.3389/fpls.2021.649204
Perkins-Taylor, I. E., and Frey, J. K. (2020). Predicting the distribution of a rare chipmunk (Neotamias quadrivittatus oscuraensis): comparing MaxEnt and occupancy models. J. Mammal. 101, 1035–1048. doi: 10.1093/jmammal/gyaa057
Quintero, I., and Wiens, J. J. (2013). Rates of projected climate change dramatically exceed past rates of climatic niche evolution among vertebrate species. Ecol. Lett. 16, 1095–1103. doi: 10.1111/ele.12144
Ren, Z., Zagortchev, L., Ma, J., Yan, M., and Li, J. (2020). Predicting the potential distribution of the parasitic Cuscuta chinensis under global warming. BMC Ecol. 20:28. doi: 10.1186/s12898-020-00295-6
Salick, J., Fang, Z. D., and Hart, R. (2019). Rapid changes in eastern Himalayan alpine flora with climate change. Am. J. Bot. 106, 520–530. doi: 10.1002/ajb2.1263
Santamaría, M. E., Diaz-Mendoza, M., Diaz, I., and Martinez, M. (2014). Plant protein peptidase inhibitors: an evolutionary overview based on comparative genomics. BMC Genomics 15:812. doi: 10.1186/1471-2164-15-812
Savolainen, O., Lascoux, M., and Merilä, J. (2013). Ecological genomics of local adaptation. Nat. Rev. Genet. 14, 807–820.
Schatz, A. M., Kramer, A. M., and Drake, J. M. (2017). Accuracy of climate-based forecasts of pathogen spread. R. Soc. Open Sci. 4:160975. doi: 10.1098/rsos.160975
Schoener, T. W. (1968). The Anolis lizards of Bimini: resource partitioning in a complex fauna. Ecology 49, 704–726.
Sharma, M., Singh, D., Saksena, H. B., Sharma, M., Tiwari, A., Awasthi, P., et al. (2021). Understanding the intricate web of phytohormone signaling in modulating root system architecture. Int. J. Mol. Sci. 22:5508. doi: 10.3390/ijms22115508
Sheppard, C. S., Burn, B. R., and Stanley, M. C. (2014). Predicting plant invasions under climate change: are species distribution models validated by field trials? Glob. Chang Biol. 20, 2800–2814. doi: 10.1111/gcb.12531
Soberón, J., and Peterson, A. T. (2005). Interpretation of models of fundamental ecological niches and species’ distributional areas. Biodiv. Inf. 2, 1–10. doi: 10.1073/pnas.0901637106
Sosef, M. S., Dauby, G., Blach-Overgaard, A., van der Burgt, X., Catarino, L., Damen, T., et al. (2017). Exploring the floristic diversity of tropical Africa. BMC Biol. 15:15. doi: 10.1186/s12915-017-0356-8
Stocker, T. F. (2013). Climate change. the closing door of climate targets. Science 18, 280–282. doi: 10.1126/science.1232468
Swets, J. A. (1998). Measuring the accuracy of diagnostic systems. Science 3, 1285–1293. doi: 10.1126/science.3287615
Tamura, K., and Nei, M. (1993). Estimation of the number of nucleotide substitutions in the control region of mitochondrial DNA in humans and chimpanzees. Mol. Biol. Evol. 10, 512–526. doi: 10.1093/oxfordjournals.molbev.a040023
Thuiller, W., Richardson, D. M., Pyšek, P., Midgley, G. F., Hughes, G. O., and Rouget, M. (2015). Niche-based modelling as a tool for predicting the risk of alien plant invasions at a global scale. Glob. Change Biol. 12, 2234–2250.
Tucker, C. M., Davies, T. J., Cadotte, M. W., and Pearse, W. D. (2018). On the relationship between phylogenetic diversity and trait diversity. Ecology 99, 1473–1479. doi: 10.1002/ecy.2349
Van Beek, C. R., Guzha, T., Kopana, N., van der Westhuizen, C. S., Panda, S. K., van der Vyver, C., et al. (2021). The SlNAC2 transcription factor from tomato confers tolerance to drought stress in transgenic tobacco plants. Physiol. Mol. Biol. Plants 27, 907–921. doi: 10.1007/s12298-021-00996-2
Villegas, M., Loiselle, B. A., Kimball, R. T., and Blake, J. G. (2021). Ecological niche differentiation in Chiroxiphia and Antilophia manakins (Aves: Pipridae). PLoS One 16:e0243760. doi: 10.1371/journal.pone.0243760I
Wang, R. L., Wen, G., Li, Q., Wang, M. T., Guo, X., Lin, S., et al. (2018). Geographical distribution simulation of Actinidia deliciosa in China and influence of climate. J. Trop. Subtrop. Bot. 26, 335–345.
Wang, W. T., Guo, W. Y., Jarvie, S., and Svenning, J. C. (2020). The fate of Meconopsis species in the Tibeto-Himalayan region under future climate change. Ecol. Evol. 11, 887–899. doi: 10.1002/ece3.7096
Warren, D. L., Glor, R. E., and Turelli, M. (2008). Environmental niche equivalency versus conservatism: quantitative approaches to niche evolution. Evolution 62, 2868–2883. doi: 10.1111/j.1558-5646.2008.00482.x
Warren, D. L., and Seifert, S. N. (2011). Ecological niche modeling in Maxent: the importance of model complexity and the performance of model selection criteria. Ecol. Appl. 21, 335–342. doi: 10.1890/10-1171.1
Wiens, J. J. (2016). Climate-related local extinctions are already widespread among plant and animal species. PLoS Biol. 14:e2001104. doi: 10.1371/journal.pbio.2001104
Wu, Z., Zhang, F., Di, D., and Wang, H. (2021). Study of spatial distribution characteristics of river eco-environmental values based on emergy-GeoDa method. Sci. Total Environ. 802:149679. doi: 10.1016/j.scitotenv.2021.149679
Zettlemoyer, M. A., Schultheis, E. H., and Lau, J. A. (2019). Phenology in a warming world: differences between native and non-native plant species. Ecol. Lett. 22, 1253–1263. doi: 10.1111/ele.13290
Zhang, C. M. (1992). Study on the after-ripening of seed of Tendrilleaf Fritillary (Fritillaria cirrhosa). Chin. Trad. herb. drugs 23, 434–436.
Zhang, K., Yao, L., Meng, J., and Tao, J. (2018). MaxEnt modeling for predicting the potential geographical distribution of two peony species under climate change. Sci. Total Environ. 634, 1326–1334. doi: 10.1016/j.scitotenv.2018.04.112
Zheng, H., Deng, K. Y., Chen, A. Q., Fu, S. B., Zhou, D., Wang, W. W., et al. (2019). Molecular identification and genetic relationship of Fritillaria cirrhosa and related species based on DNA barcode. Acta Pharm. Sin. 54, 2326–2334.
Zheng, H. Y., Guo, X. L., Price, M., He, X. J., and Zhou, S. D. (2021). Effects of mountain uplift and climatic oscillations on phylogeography and species divergence of Chamaesium (Apiaceae). Front. Plant Sci. 12:673200. doi: 10.3389/fpls.2021.673200
Zhu, G., Bu, W., Gao, Y., and Liu, G. (2012). Potential geographic distribution of brown marmorated stink bug invasion (Halyomorpha halys). PLoS One 7:e31246. doi: 10.1371/journal.pone.0031246
Keywords: climate change, distribution, Fritillaria, machine learning methods, MaxEnt
Citation: Jiang R, Zou M, Qin Y, Tan G, Huang S, Quan H, Zhou J and Liao H (2022) Modeling of the Potential Geographical Distribution of Three Fritillaria Species Under Climate Change. Front. Plant Sci. 12:749838. doi: 10.3389/fpls.2021.749838
Received: 30 July 2021; Accepted: 15 November 2021;
Published: 10 January 2022.
Edited by:
Boris Rewald, University of Natural Resources and Life Sciences Vienna, AustriaReviewed by:
Sailesh Ranjitkar, N.Gene Solution of Natural Innovation, NepalJorge Eduardo Campos, National Autonomous University of Mexico, Mexico
Lázaro Guevara, National Autonomous University of Mexico, Mexico
Copyright © 2022 Jiang, Zou, Qin, Tan, Huang, Quan, Zhou and Liao. This is an open-access article distributed under the terms of the Creative Commons Attribution License (CC BY). The use, distribution or reproduction in other forums is permitted, provided the original author(s) and the copyright owner(s) are credited and that the original publication in this journal is cited, in accordance with accepted academic practice. No use, distribution or reproduction is permitted which does not comply with these terms.
*Correspondence: Jiayu Zhou, c3BpbmV6aG91QGhvbWUuc3dqdHUuZWR1LmNu; Hai Liao, ZGRsaWFvaGFpQGhvbWUuc3dqdHUuZWR1LmNu
†These authors have contributed equally to this work