- 1Department of Agronomy and Plant Breeding, Faculty of Agriculture, University of Kurdistan, Sanandaj, Iran
- 2College of Life Sciences, Yantai University, Yantai, China
Genomic repetitive sequences commonly show species-specific sequence type, abundance, and distribution patterns, however, their intraspecific characteristics have been poorly described. We quantified the genomic repetitive sequences and performed single nucleotide polymorphism (SNP) analysis between 29 Ae. tauschii genotypes and subspecies using publicly available raw genomic Illumina sequence reads and used fluorescence in situ hybridization (FISH) to experimentally analyze some repeats. The majority of the identified repetitive sequences had similar contents and proportions between anathera, meyeri, and strangulata subspecies. However, two Ty3/gypsy retrotransposons (CL62 and CL87) showed significantly higher abundances, and CL1, CL119, CL213, CL217 tandem repeats, and CL142 retrotransposon (Ty1/copia type) showed significantly lower abundances in subspecies strangulata compared with the subspecies anathera and meyeri. One tandem repeat and 45S ribosomal DNA (45S rDNA) abundances showed a high variation between genotypes but their abundances were not subspecies specific. Phylogenetic analysis using the repeat abundances of the aforementioned clusters placed the strangulata subsp. in a distinct clade but could not discriminate anathera and meyeri. A near complete differentiation of anathera and strangulata subspecies was observed using SNP analysis; however, var. meyeri showed higher genetic diversity. FISH using major tandem repeats couldn’t detect differences between subspecies, although (GAA)10 signal patterns generated two different karyotype groups. Taken together, the different classes of repetitive DNA sequences have differentially accumulated between strangulata and the other two subspecies of Ae. tauschii that is generally in agreement with spike morphology, implying that factors affecting repeatome evolution are variable even among highly closely related lineages.
Introduction
Aegilops tauschii Coss. (2n = 2x = 14, DD genome) is the D genome progenitor of common wheat (Kihara, 1944; McFadden and Sears, 1946) and the pivotal genome of several polyploid Aegilops species (Kimber and Yen, 1988; Mirzaghaderi and Mason, 2017). Ae. tauschii harbors a high-genetic variation that can be used in wheat-breeding programs against biotic and abiotic stresses tolerance (Mirzaghaderi and Mason, 2019). Iran is widely referred to as the center of the origin and diversity of Ae. tauschii (Dvorak et al., 1998). However, during the long periods of dispersal and adaptation, this species has been distributed through a wide geographical region in the central Eurasia, from the northern Syria and Turkey to the western China (Kihara et al., 1965; Matsuoka et al., 2015).
On the basis of the spike morphology, Ae. tauschii has been divided into three varieties, of which two (var. anathera, and var. meyeri) are grouped into A. tauschii subsp. tauschii, whereas the third is subsp. strangulata. Variety anathera is commonly awnless except for the two apical spikelets, while meyeri form is very slender and has short spikes with only 4–8 spikelets, awned except the two lowest ones. Subspecies strangulata is monophyletic and form a sharply defined moniliform spike. This classification remains controversial because of the presence of intermediate forms so for example var. typica has also been mentioned as a distinct variety of subsp. tauschii (Eig, 1929; Kihara and Tanaka, 1958; Hammer, 1980; Wang et al., 2013). Variety meyeri, which is morphologically an intermediate type between typica and anathera, is found mainly on the west coast of the Caspian Sea (Kihara et al., 1965).
Interestingly, Ae. tauschii botanical classification has a weak agreement with the genetic relationships. Based on the genetic studies, Ae. tauschii has been divided into L1 and L2 lineages that are broadly related to tauschii and strangulata subspecies, respectively (Dvorak et al., 1998; Mizuno et al., 2010). L2 has a limited distribution and is mainly composed of subsp. strangulata along with the accessions (mainly var. meyeri and a number of accessions from var. typica) formerly assigned to subsp. tauschii based on spike morphology. These troublesome accessions have likely been originated by the gene migration from subsp. tauschii into subsp. strangulata (Lubbers et al., 1991; Dvorak et al., 1998). A subpopulation mainly composed of var. meyeri and var. typica within L2 in the southwestern and southern Caspian appears to be the main source of the wheat D genome (Wang et al., 2013). L1 lineage has been distributed in more diverse environments (Lubbers et al., 1991; Dvorak et al., 1998; Wang et al., 2013).
Understanding the genetic and evolutionary relationships of Ae. tauschii accessions might lead to more effective utilization of this species in the wheat breeding (Kilian et al., 2011; Mirzaghaderi et al., 2020). Genomic repetitive sequences commonly show species-specific sequence type, abundance, and distribution patterns, however, there is little information about their intraspecific characteristics. With the increasing genomic data available for the model organisms, it is now possible to investigate repeatome organization among subspecies. Hence, the aim of the present study is to provide an overview of the repetitive sequences in Ae. tauschii, and to characterize its dominant lineages related to the botanical classification. Specifically, we analyzed the repetitive sequences of 29 different Ae. tauschii genotypes using publicly available low coverage, Illumina-sequencing data, and compared repeat abundance between the different subspecies. The result was further compared to the genome relationships interfered from single nucleotide polymorphism (SNP) analysis and some repeats were localized on the D genome chromosomes using fluorescence in situ hybridization (FISH).
Materials and Methods
Exploring Repetitive Sequences
Raw Illumina reads (in FASTQ format with 150 bp length) of 29 different Ae. tauschii accessions belonging to subspecies anathera (10 accessions), meyeri (10 accessions), and strangulata (9 accessions) (Zhou et al., 2020) (Supplementary Table 1) were downloaded from EBI to RepeatExplorer2 pipeline (Novák et al., 2013, 2020) via Get Data option. Reads were pre-processed using the ‘Preprocessing of FASTQ paired-end reads’ tool using default settings, except that read sampling was set to 500,000 and all the reads were trimmed to 149 nucleotides. Sample codes were added to each sample using “FASTA read name affixer” to specify the corresponding subspecies and accession. All the read samples were merged into a single dataset using “Concatenate datasets tail-to-head” tool. Comparative analysis of repetitive sequences were done by similarity-based clustering of Illumina paired-end reads using the “RepeatExplorer2 clustering” tool (Novák et al., 2020) where 0.01% cluster size threshold (considering only repeats with at least 0.01% of the input reads) and “automatic filtering of abundant satellite repeats” were selected. In the output cluster table, all the clusters were checked manually, and the automated annotation was corrected if needed. The clusters were used to characterize and quantify the most abundant repeats and genomic proportions of the major repeat types were calculated based on the proportion of reads in individual-annotated clusters.
The previously published genome size of 4,968 Mbp per 1C-value (Ozkan et al., 2003) was considered to normalize the sizes of resulting repeat clusters of all the Ae. tauschii accessions using optparse package of R version 4.0.2 (The R Project for Statistical Computing, Vienna, Austria) as described in Novák et al. (2020). This generated a plot of rectangles proportional to the amounts of repeats in the genome of the analyzed accessions.
Separate analyses of read samples from each accession were run on RepeatExplorer, using default settings (i.e., similarity threshold of 90 over 55% of the read length) and consensus sequences of the identified repeat monomers were reconstructed by TAREAN (TAndem REpeat ANalyzer) (Novák et al., 2017).
Phylogenetic Analysis Based on the Identified Repeats
Repeat counts for each genotype were obtained from the output table of the comparative analysis in RepeatExplorer2. Repetitive sequence clusters that differentially amplified between subspecies were identified by the ANOVA. Repeats that showed high-variable abundances between individuals were identified by inspecting the comparative analysis output table manually. A UPGMA (average linkage) tree of 29 Ae. tauschii accessions was generated based on the Euclidean distances between the abundances of the repetitive sequence clusters that showed differential amplification between genotypes and subspecies as inferred from RepeatExplorer2. Also, 18S and 26S rDNA genes of the identified 45S rDNA were searched by RNAmmer (Lagesen et al., 2007) and “+” strand of the rDNA sequences of all genotypes were obtained using Range Extractor DNA at https://www.bioinformatics.org/sms2/range_extract_dna.html (Stothard, 2000). Subsequently, the ITS1-5.8S-ITS2 region was extracted for each genotype and used as input for multiple sequence alignment by MUSCLE method using the “msa” package (Bodenhofer et al., 2015). A phylogenetic maximum likelihood tree was obtained using the “phangorn” package (Schliep, 2010) with 100 bootstrapping replications. Box plots were generated based on read abundances in R using ggplot2 package.
Characterization of Transposable Element
Identification and classification of transposable element protein domain sequences were performed using the DANTE tool at https://repeatexplorer-elixir.cerit-sc.cz/galaxy/(Novak et al., 2019) and the REXdb database (Neumann et al., 2019). The output gff3 files belonging to the different retrotransposons were used to generate corresponding bed and bedgraph files that were subsequently visualized in the Integrative Genomics Viewer (IGV) software (Robinson et al., 2017).
Variant Calling, Quality Control of SNPs, and Genetic Diversity Analysis
The same sequence reads of Ae. tauschii accessions that used for the above mentioned RepeatExplorer analysis, were also downloaded and mapped to their corresponding reference genome (Aegilops_tauschii.Aet_v4.0.dna_rm.toplevel.fa) with Bowtie2 (Langmead and Salzberg, 2012) after sequence trimming with Trimmomatic v. 0.36 (Bolger et al., 2014). Variant calling of each genotype was performed using freebayes v1.3.2 (Garrison and Marth, 2012). VCF output files of all samples were merged into a single VCF file using BCFtools and high quality SNPs with minimum allele frequency of 5% (QUAL > 30, AF > 0.05 and AF < 0.95, GQ > 20) were filtered using VCFtools 0.1.16 (Danecek et al., 2011). A maximum likelihood phylogeny was inferred based on the filtered SNPs using RAxML-NG v. 1.0.2-master (Kozlov et al., 2019) with 100 bootstrapping replications.
FISH Experiments
Sixteen genotypes of Ae. tauschii were received from the Seeds and Plant Improvement Institute of Iran (SPII) or IPK gene bank of Germany (Supplementary Table 2) and analyzed by FISH. Oligo-(GAA)10 (Pedersen and Langridge, 1997), oligo-pTa535-1 (Komuro et al., 2013; Tang et al., 2014), oligo-pSc119.2-1 and oligo-pAs1-1 probes were used for karyotype analysis (Table 1). Oligo-(GAA)10 and oligo-pSc119.2-1 were directly labeled at the 5′ end with FAM (6-carboxyfluorescein) and oligo-pTa535-1 and oligo-pAs1-1 were 5′-end-labeled with TAMRA. Oligonucleotide probes were synthesized by Bioneer Co. Ltd. (Daejeon, South Korea). Synthesized probes were diluted using 1 × TE solution (pH 7.0). A partial sequence of the CRM repeat unit (3D:250158225-250159002 region) was amplified using forward: 5′AGGGCCTAGCTTTGAGAAGG, and reverse: 5′ATGGATATCGCTTTGGTGGA primers, labeled with a nick translation kit (Jena Bioscience, Jena, Germany), recovered by ethanol precipitation and used as a probe in FISH for localization of CRM elements. Chromosome preparation and FISH were performed according to Abdolmalaki et al. (2019), except that root tips pretreatment time with nitrous oxide (N2O) was reduced to 2 hours.
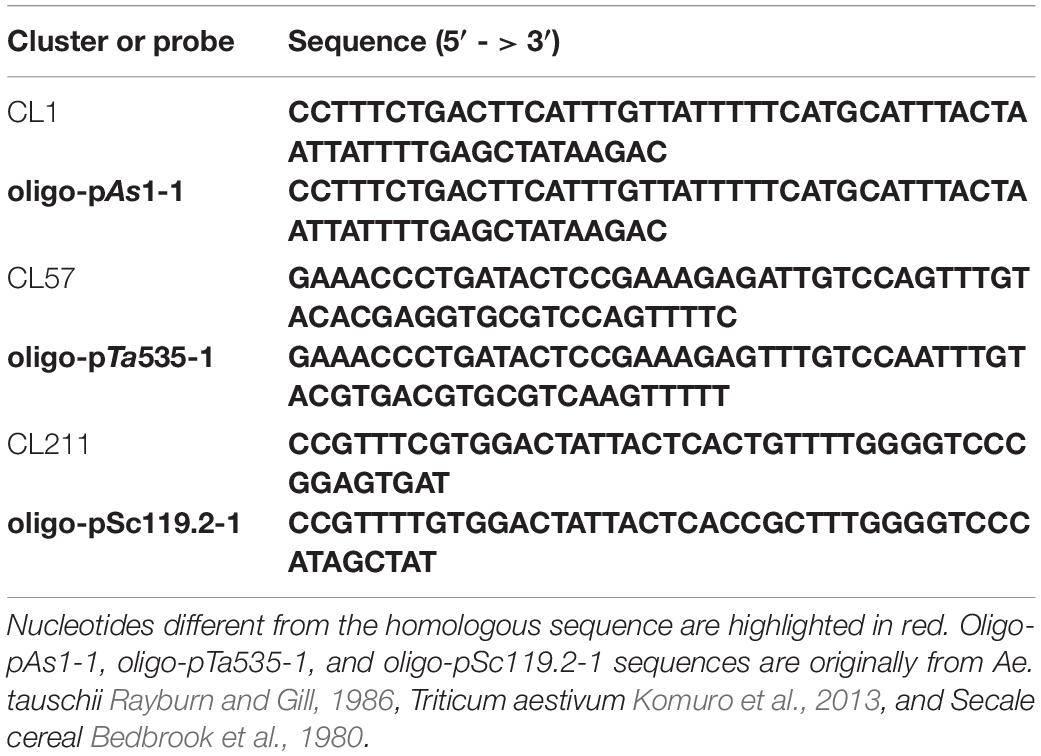
Table 1. Partial sequences of the identified Ae. tauschii satellite clusters homologous to the oligonucleotide probes used in the present study i.e., oligo-pAs1-1, oligo-pTa535-1, and oligo-pSc119.2-1.
Results
General and Intervarietal Repeatome Structure of Ae. tauschii
In the present study, publicly available raw Illumina 150 bp paired end reads from 29 different Ae. tauschii accessions belonging to anathera, strangulata, and tauschii subspecies (Supplementary Table 1) were analyzed using RepeatExplorer2 pipeline to elucidate the evolutionary patterns of highly repetitive sequences among subspecies. The GC content for Ae. tauschii genome showed a value of 47% and highly and moderately repetitive sequences constitute 77.35% of the nuclear genome (Supplementary Table 2). The majority (61.56%) of the repeats are composed of transposons with 58.42% of which being retrotransposons. On the other hand, class II transposons contributed to only 2.03% of the repeats. Long terminal repeat LTR retrotransposons are the most abundant mobile elements and composed 58.27% of the genome. LTRs divided into Ty3/gypsy and Ty1/copia super families with 38.65 and 19.35% of genome, respectively (Supplementary Table 3).
The proportion of the identified repeat clusters and the number of reads in each cluster (which is proportional to their genomic abundance) per accessions and other details including satellite probabilities and related indices, i.e., connected component index (C) and are pair completeness index (P) (Novák et al., 2017) are shown in Supplementary Table 4 where cluster numbers are in order of their amount in the genome. Comparative repeatome analysis revealed that the overall contents and proportions of the identified repetitive sequences are highly similar between the three subspecies of Ae. tauschii (Supplementary Figure 1 and Supplementary Table 4) except seven repeat clusters which showed significantly different abundances between the studied subspecies. The read counts of these differentially amplified repeats are presented in Supplementary Table 5, and results of their statistical comparisons between the subspecies are presented in Supplementary Table 6. Monomer, analysis of individual genomes using TAREAN (data not presented) showed that monomer sequences of tandem repeats are completely identical among all the Ae. tauschii genotypes.
Sixteen different satellite repeats representing 3% of the genome of Ae. tauschii were identified with unit lengths ranging from 44 to 6371 nucleotides, although a majority (13) of them had unit length in range of 118 to 567 nucleotides. The proportion and other details of each of these tandem repeats including consensus length and satellite probability are shown in Supplementary Table 7. Seven clusters including CL1, CL62, CL87, CL213, CL217, CL119, and CL142 showed subspecies-specific amplification during the diversification of Ae. tauschii (Figure 1). CL62 and CL87 were Tekay retrotransposons belong to Ty3/gypsy super family and showed significantly higher abundances, while CL213, CL217, CL119, and CL1 tandem repeats and CL142 (Ty1/copia) retrotransposon showed significantly lower abundances in subsp. strangulata compared with subsp. anathera and subsp. meyeri (p value < 0.05; Supplementary Table 6). 45S rDNA abundances were highly variable between accessions but their abundances were not subspecies specific (Figure 1). Cluster CL220 was observed in only some of the studied accessions (Supplementary Table 5). Based on a dendrogram made from read counts of these clusters (Figure 2A), subsp. strangulata was clearly confined to a distinct clade. We extracted ITS1-5.8S-ITS2 sequences (Supplementary Table 8) from all the accessions and made a maximum likelihood tree (Figure 3) which could not resolve the subspecies, although most of the strangulata genotypes were grouped together. Compared with ITS sequences, it seems that repeat abundance is a more efficient tool for intraspecific classification in Ae. tauschii.
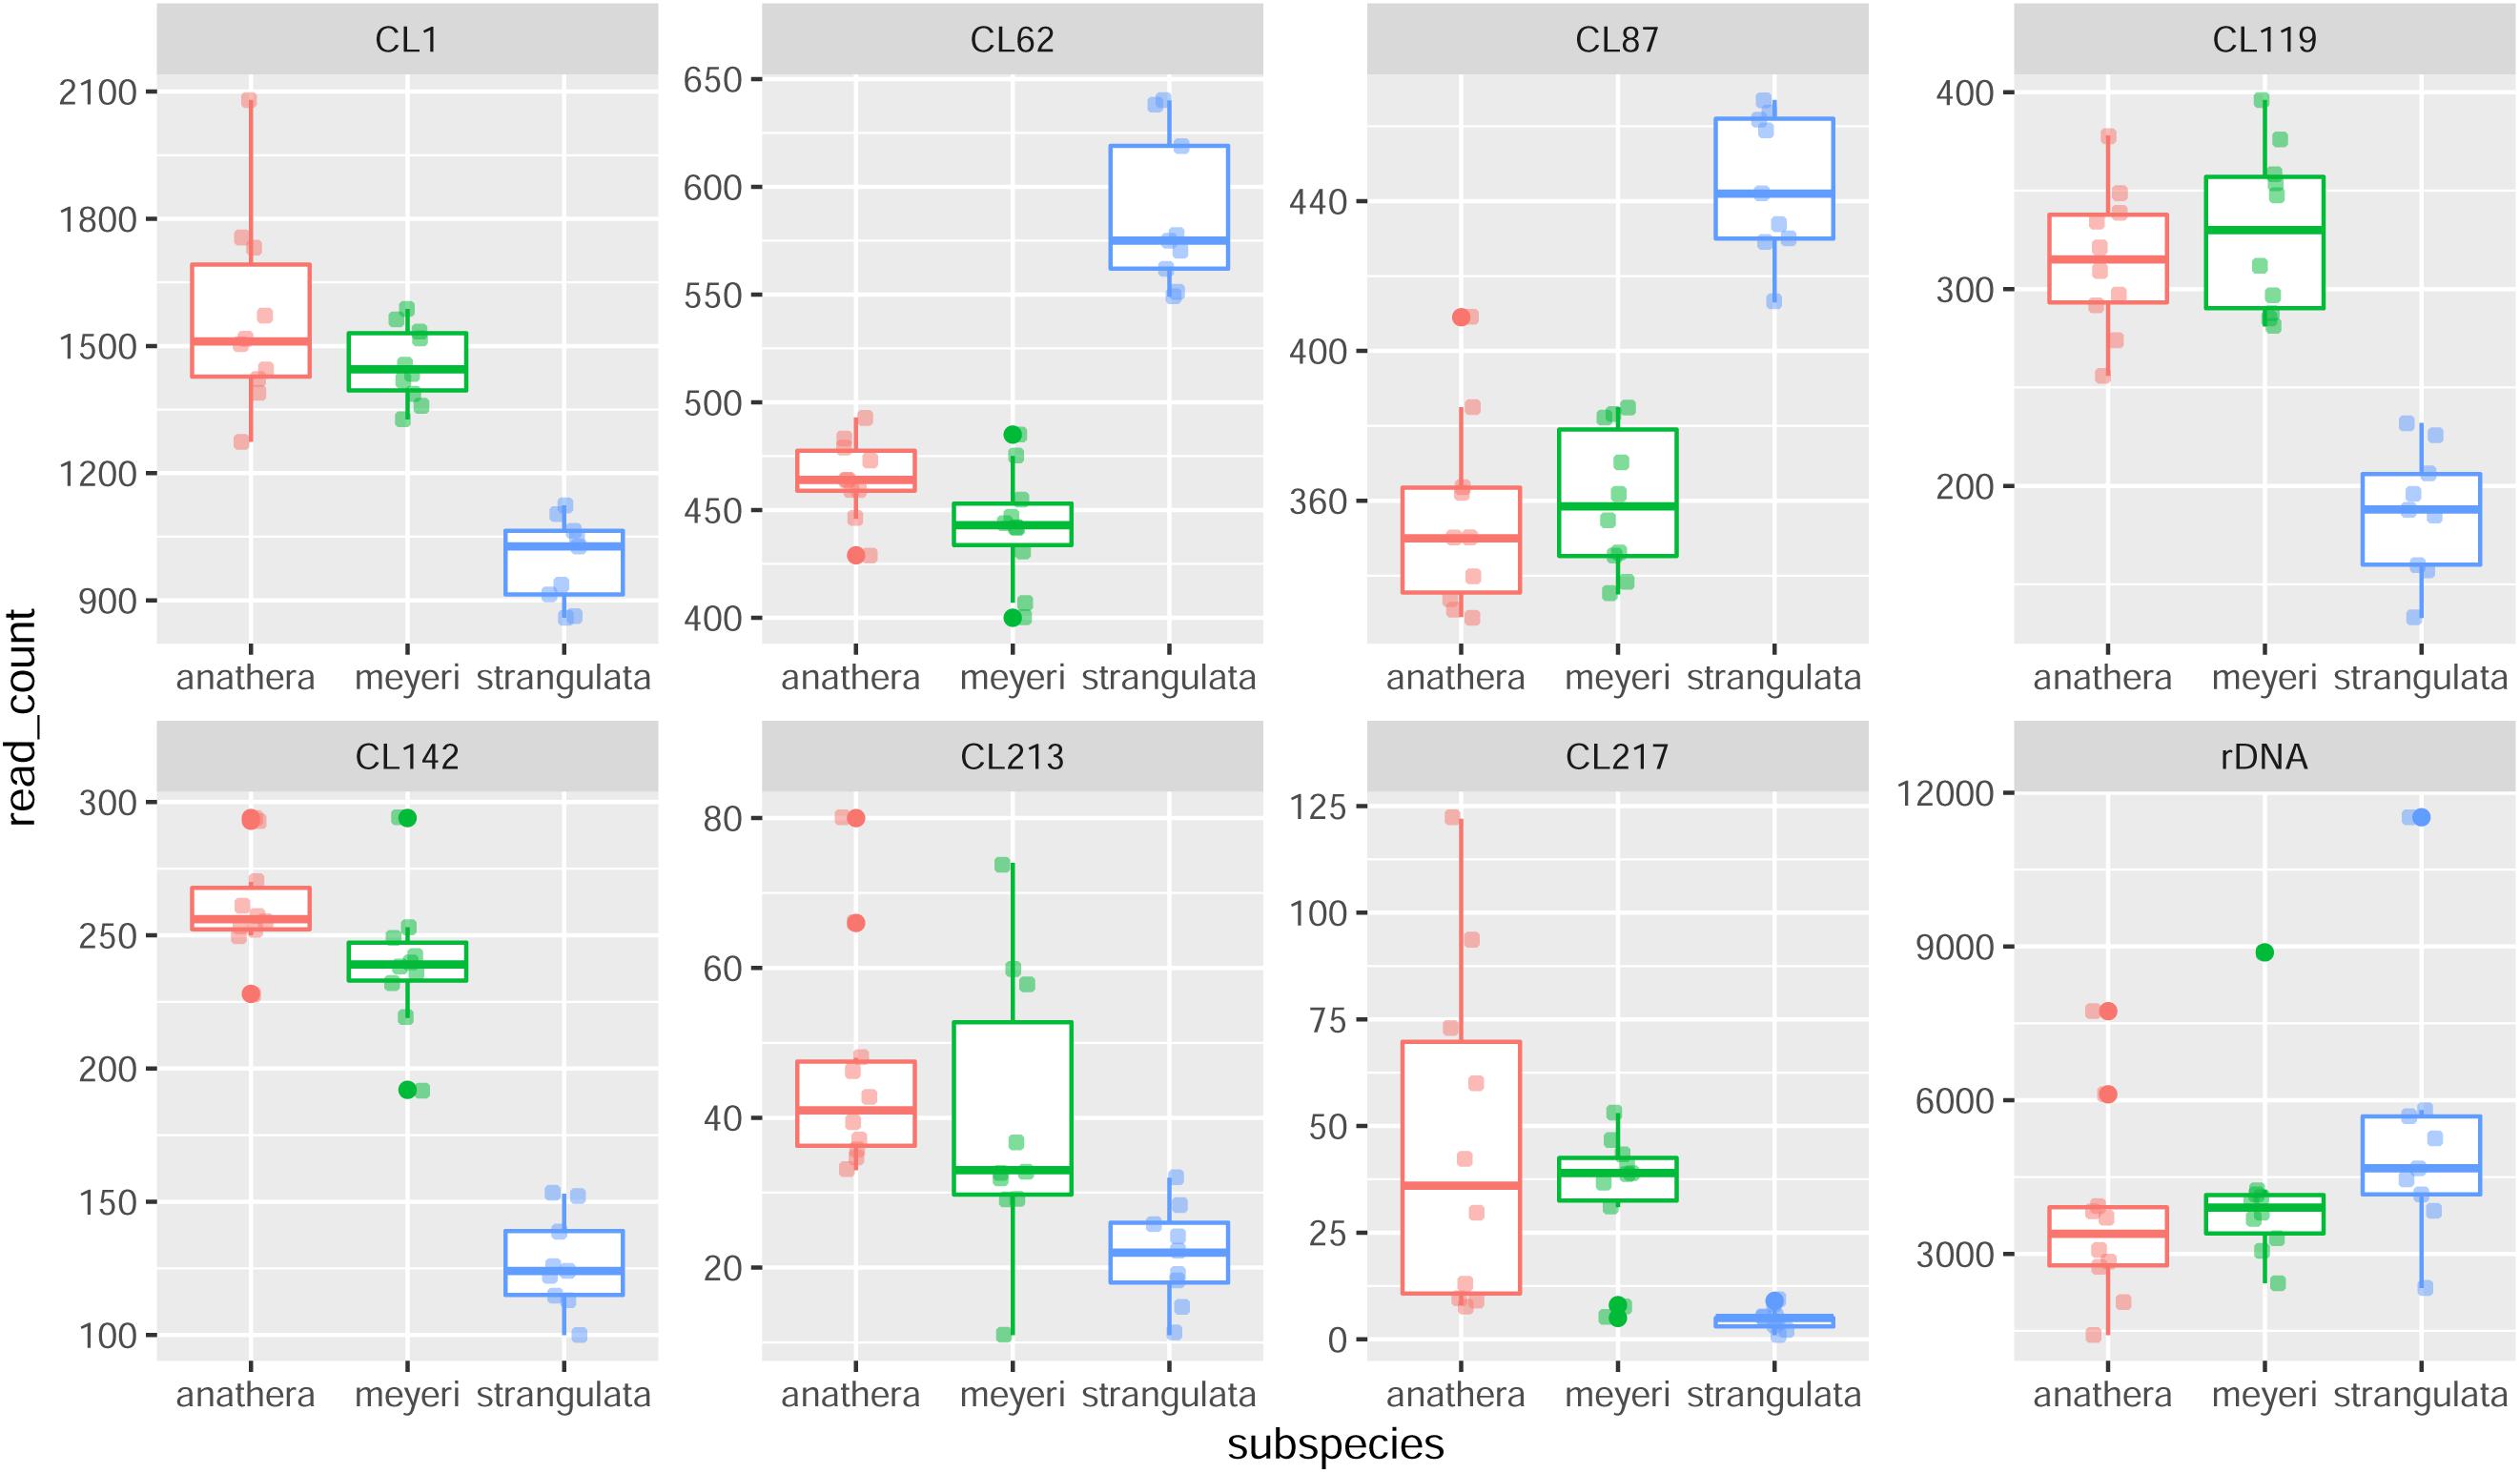
Figure 1. Box plot of repetitive DNA abundances (number of reads in each read sample) in 29 Ae. tauschii accessions belonging to subsp. anathera (red dots), subsp. meyeri (green dots) and subsp. strangulata (blue dots). CL119, CL1, CL142, CL87, and CL62 clusters showed significant differences between subspecies and CL213 and rDNA (45S) showed considerable variation between genotypes.
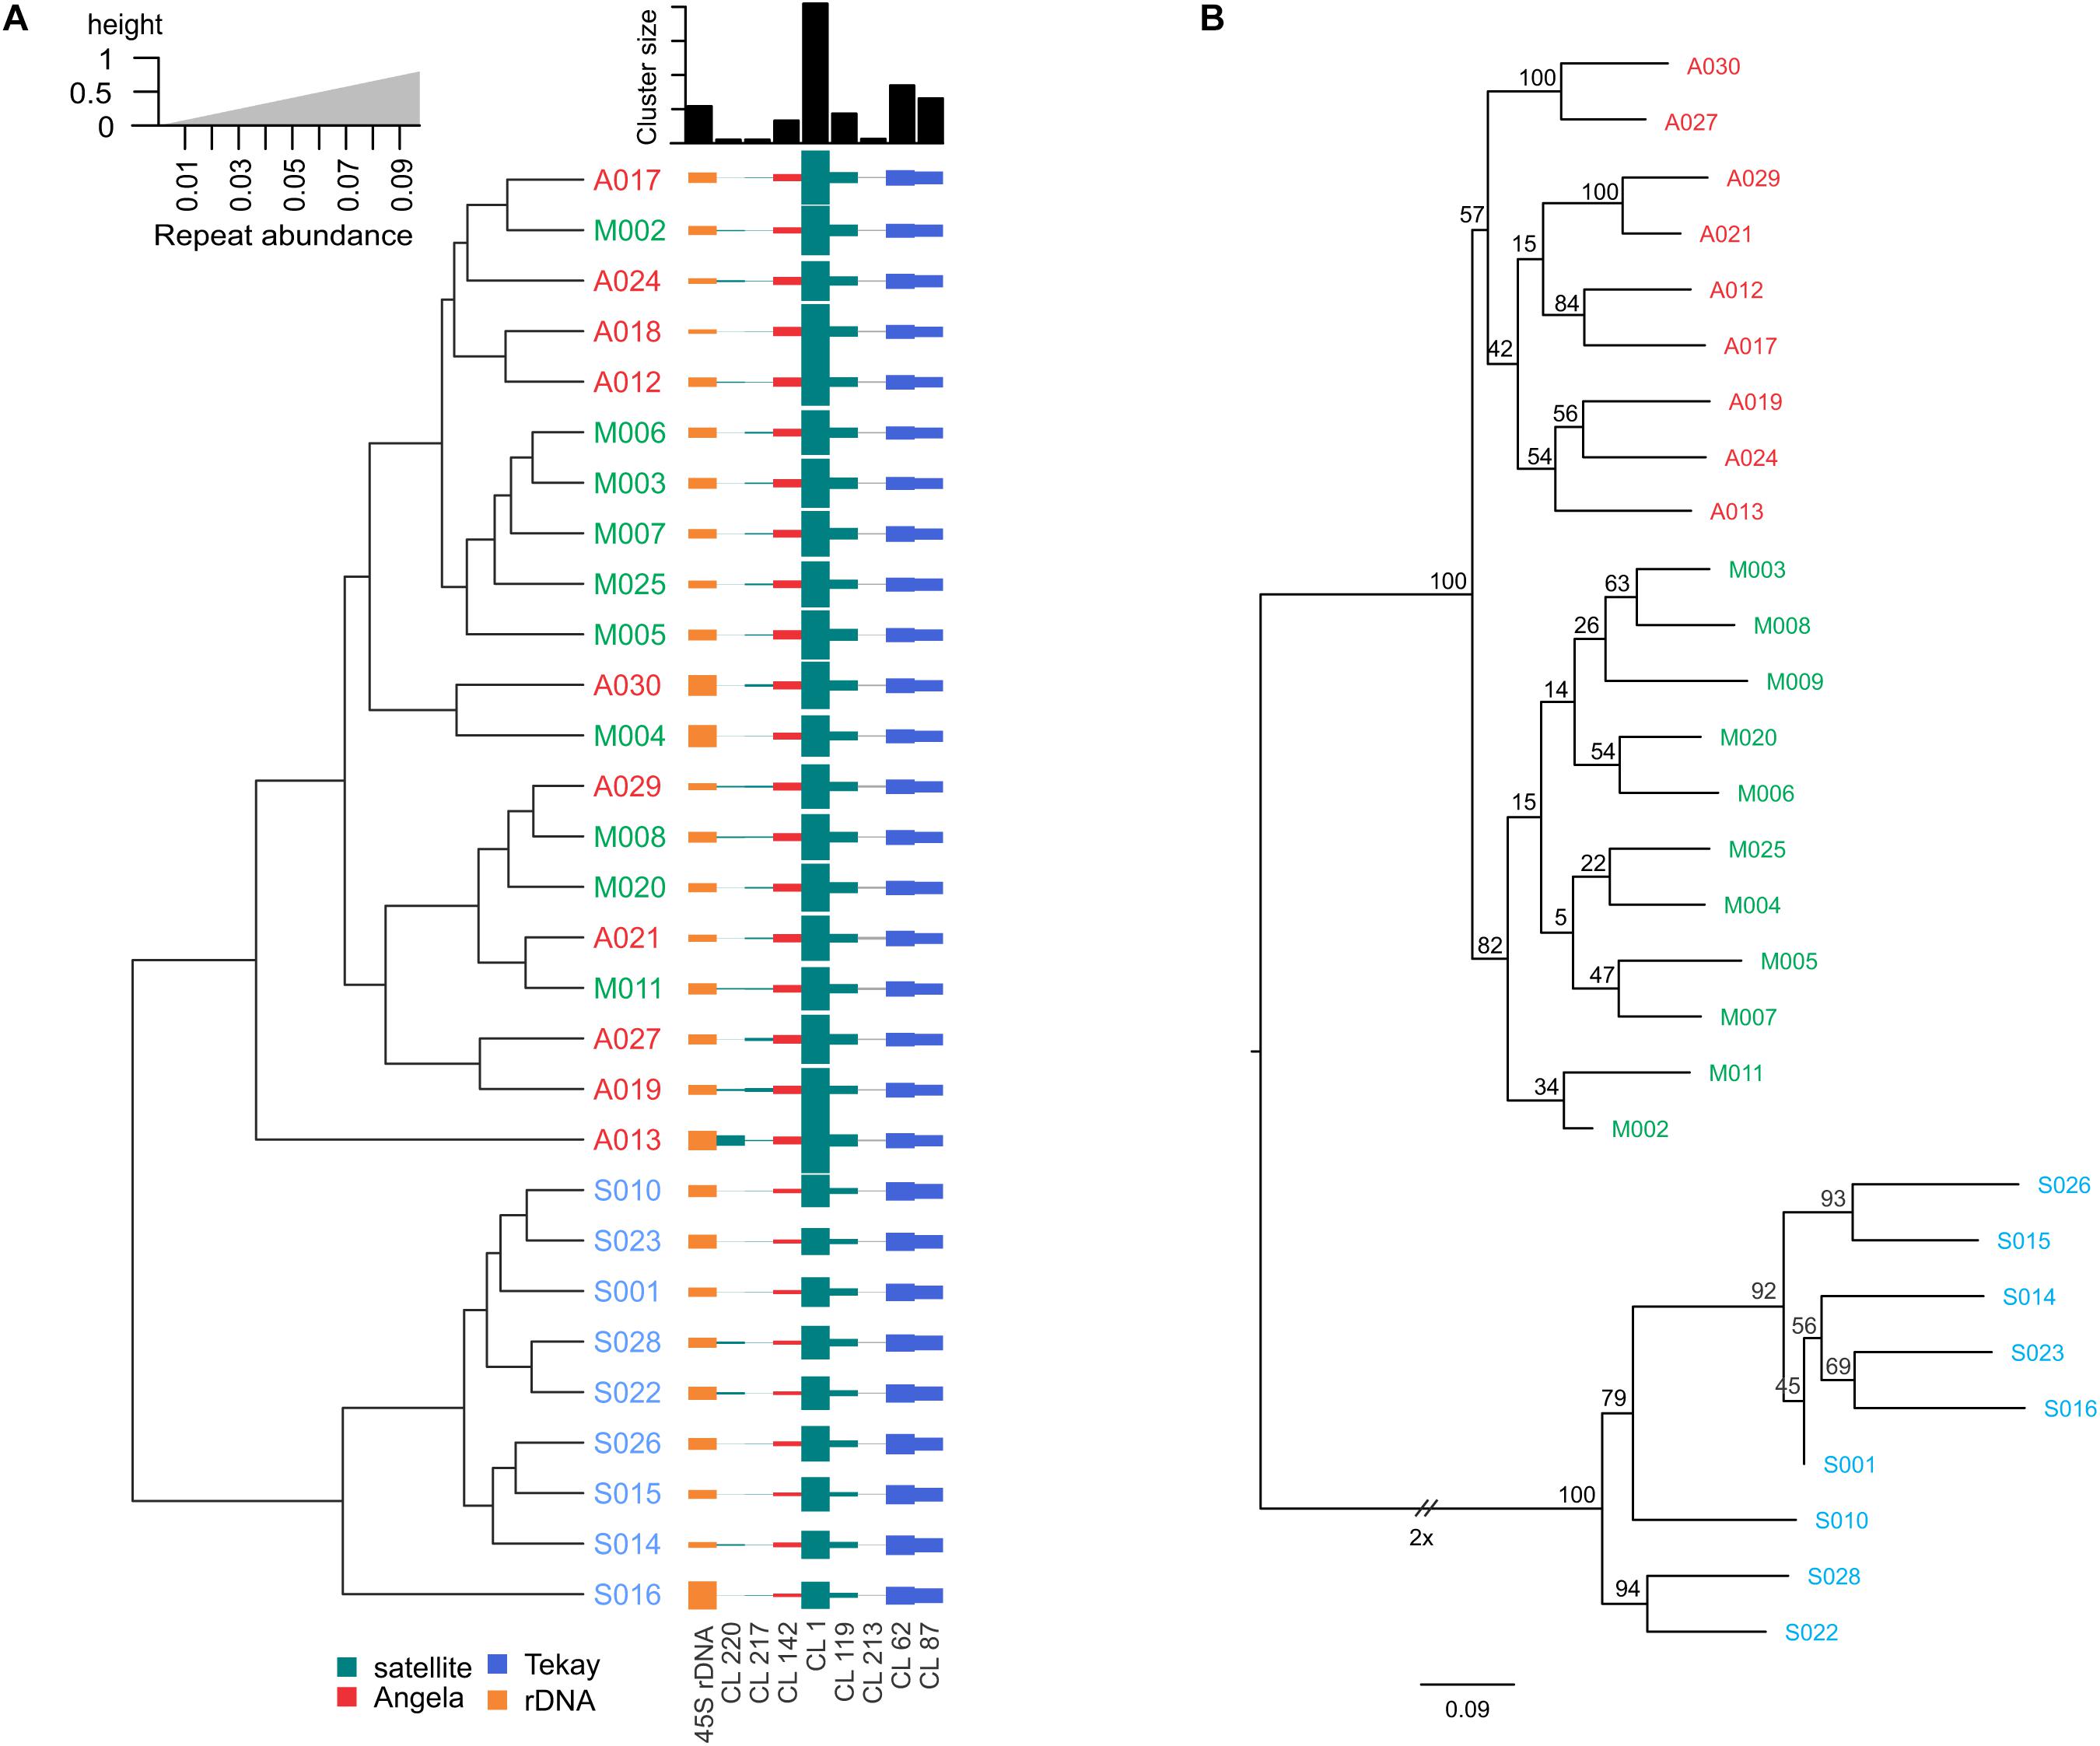
Figure 2. (A) Dendrogram of 29 Ae. tauschii accessions derived from the abundance of repetitive sequences differentially amplified between genotypes and subspecies as inferred from RepeatExplorer2. (B) Phylogenetic tree by maximum likelihood method based on SNPs discovered from low coverage Illumina reads. Numbers at the nodes are bootstrap values from 100 replications. Accession codes have been shown in red (for subsp. anathera), green (subsp. meyeri), and blue (subsp. strangulata).
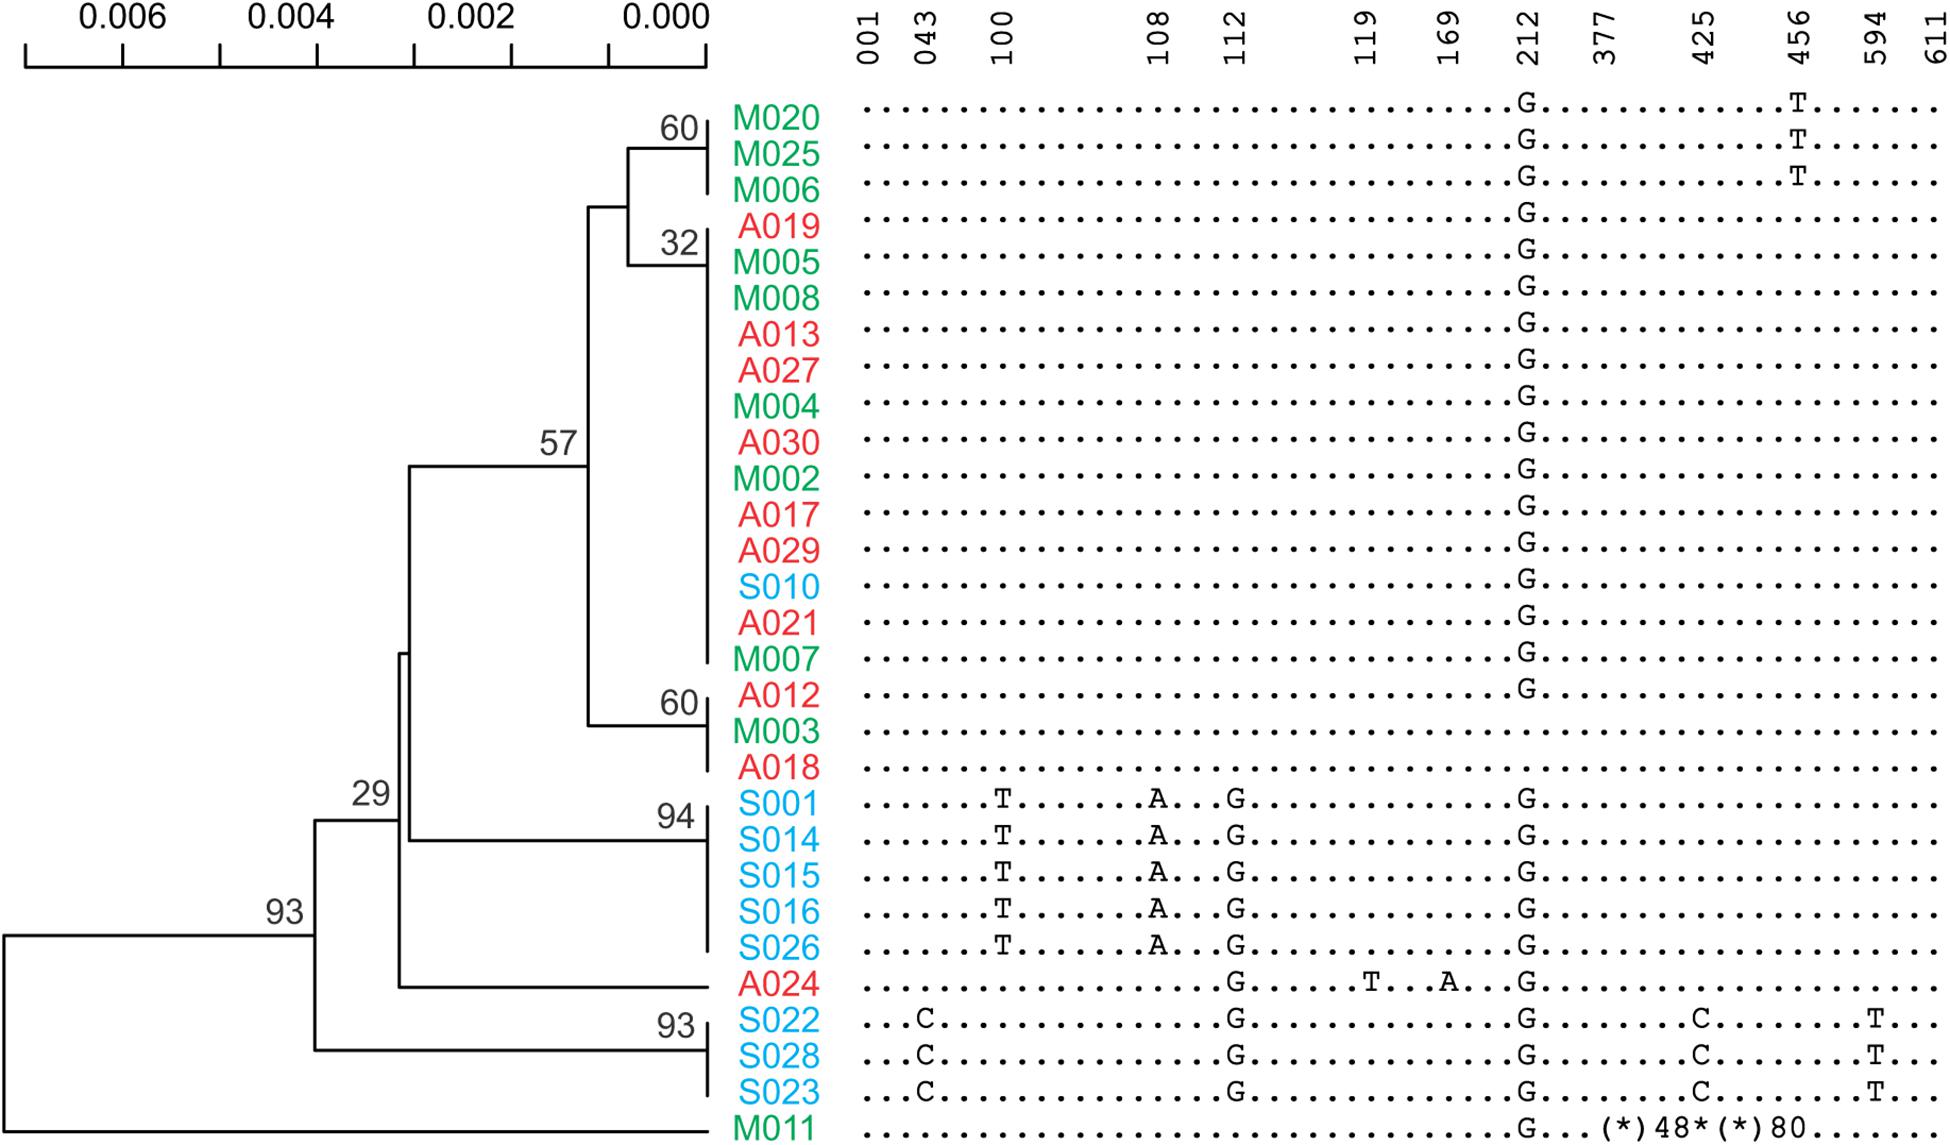
Figure 3. A maximum likelihood phylogenetic tree inferred from ITS1-5.8S-ITS2 part of rDNA sequences. Reduced form of the sequences covering all the variants and their locations has also been presented. An asterisk indicates deletion and an asterisk followed by a number indicates the number of deleted residues.
Satellite Repeats Characterization
Homology search of the identified satellite repeats using BLASTn revealed that CL1 is homologous to pTa-173 (GenBank: KC290893.1) (Komuro et al., 2013), pAs1 (Rayburn and Gill, 1986) and Afa family (Nagaki et al., 1995). CL57 is homologous to pTa-s53 (KC290895.1) and pTa-535 (KC290894.1) that is also related to pAs1. CL119 satellite is homologous to 4P6-2 (AY249987.1), a repeat that has been identified already by FISH using bacterial artificial chromosome (BAC) clones as probes (Zhang et al., 2004). CL23 has 78% identity with pTa-451 (KC290912.1), CL173 is homologous to Triticum aestivum clone pTa-465 sequence and CL211 is homologous to pTa-835 (KC290898.1).
Fluorescence in situ hybridization using oligo-pAs1-1 (homologous to the most abundant tandem repeat CL1), oligo-pTa535-1 (homologous to CL57 tandem repeat), oligo-pSc119.2-1 (homologous to CL211 tandem repeat) and (GAA)10 was applied on sixteen Ae. tauschii genotypes (Figures 4, 5). Oligo-pAs1-1 and oligo-pTa535-1 probes generally produced comparable patterns, and have been widely used for the identification of D genome chromosomes (Tang et al., 2014). Oligo-pSc119.2-1 probe generated weak signals in subtelomeric regions of chromosome arms 1DS, 2DS, 3DS, and 4DS (Figure 5) in some accessions. Although none of the probes discriminated subspecies (GAA)10, signal patterns generated two karyotype groups, that poorly agreed with botanical classification (Figure 4).
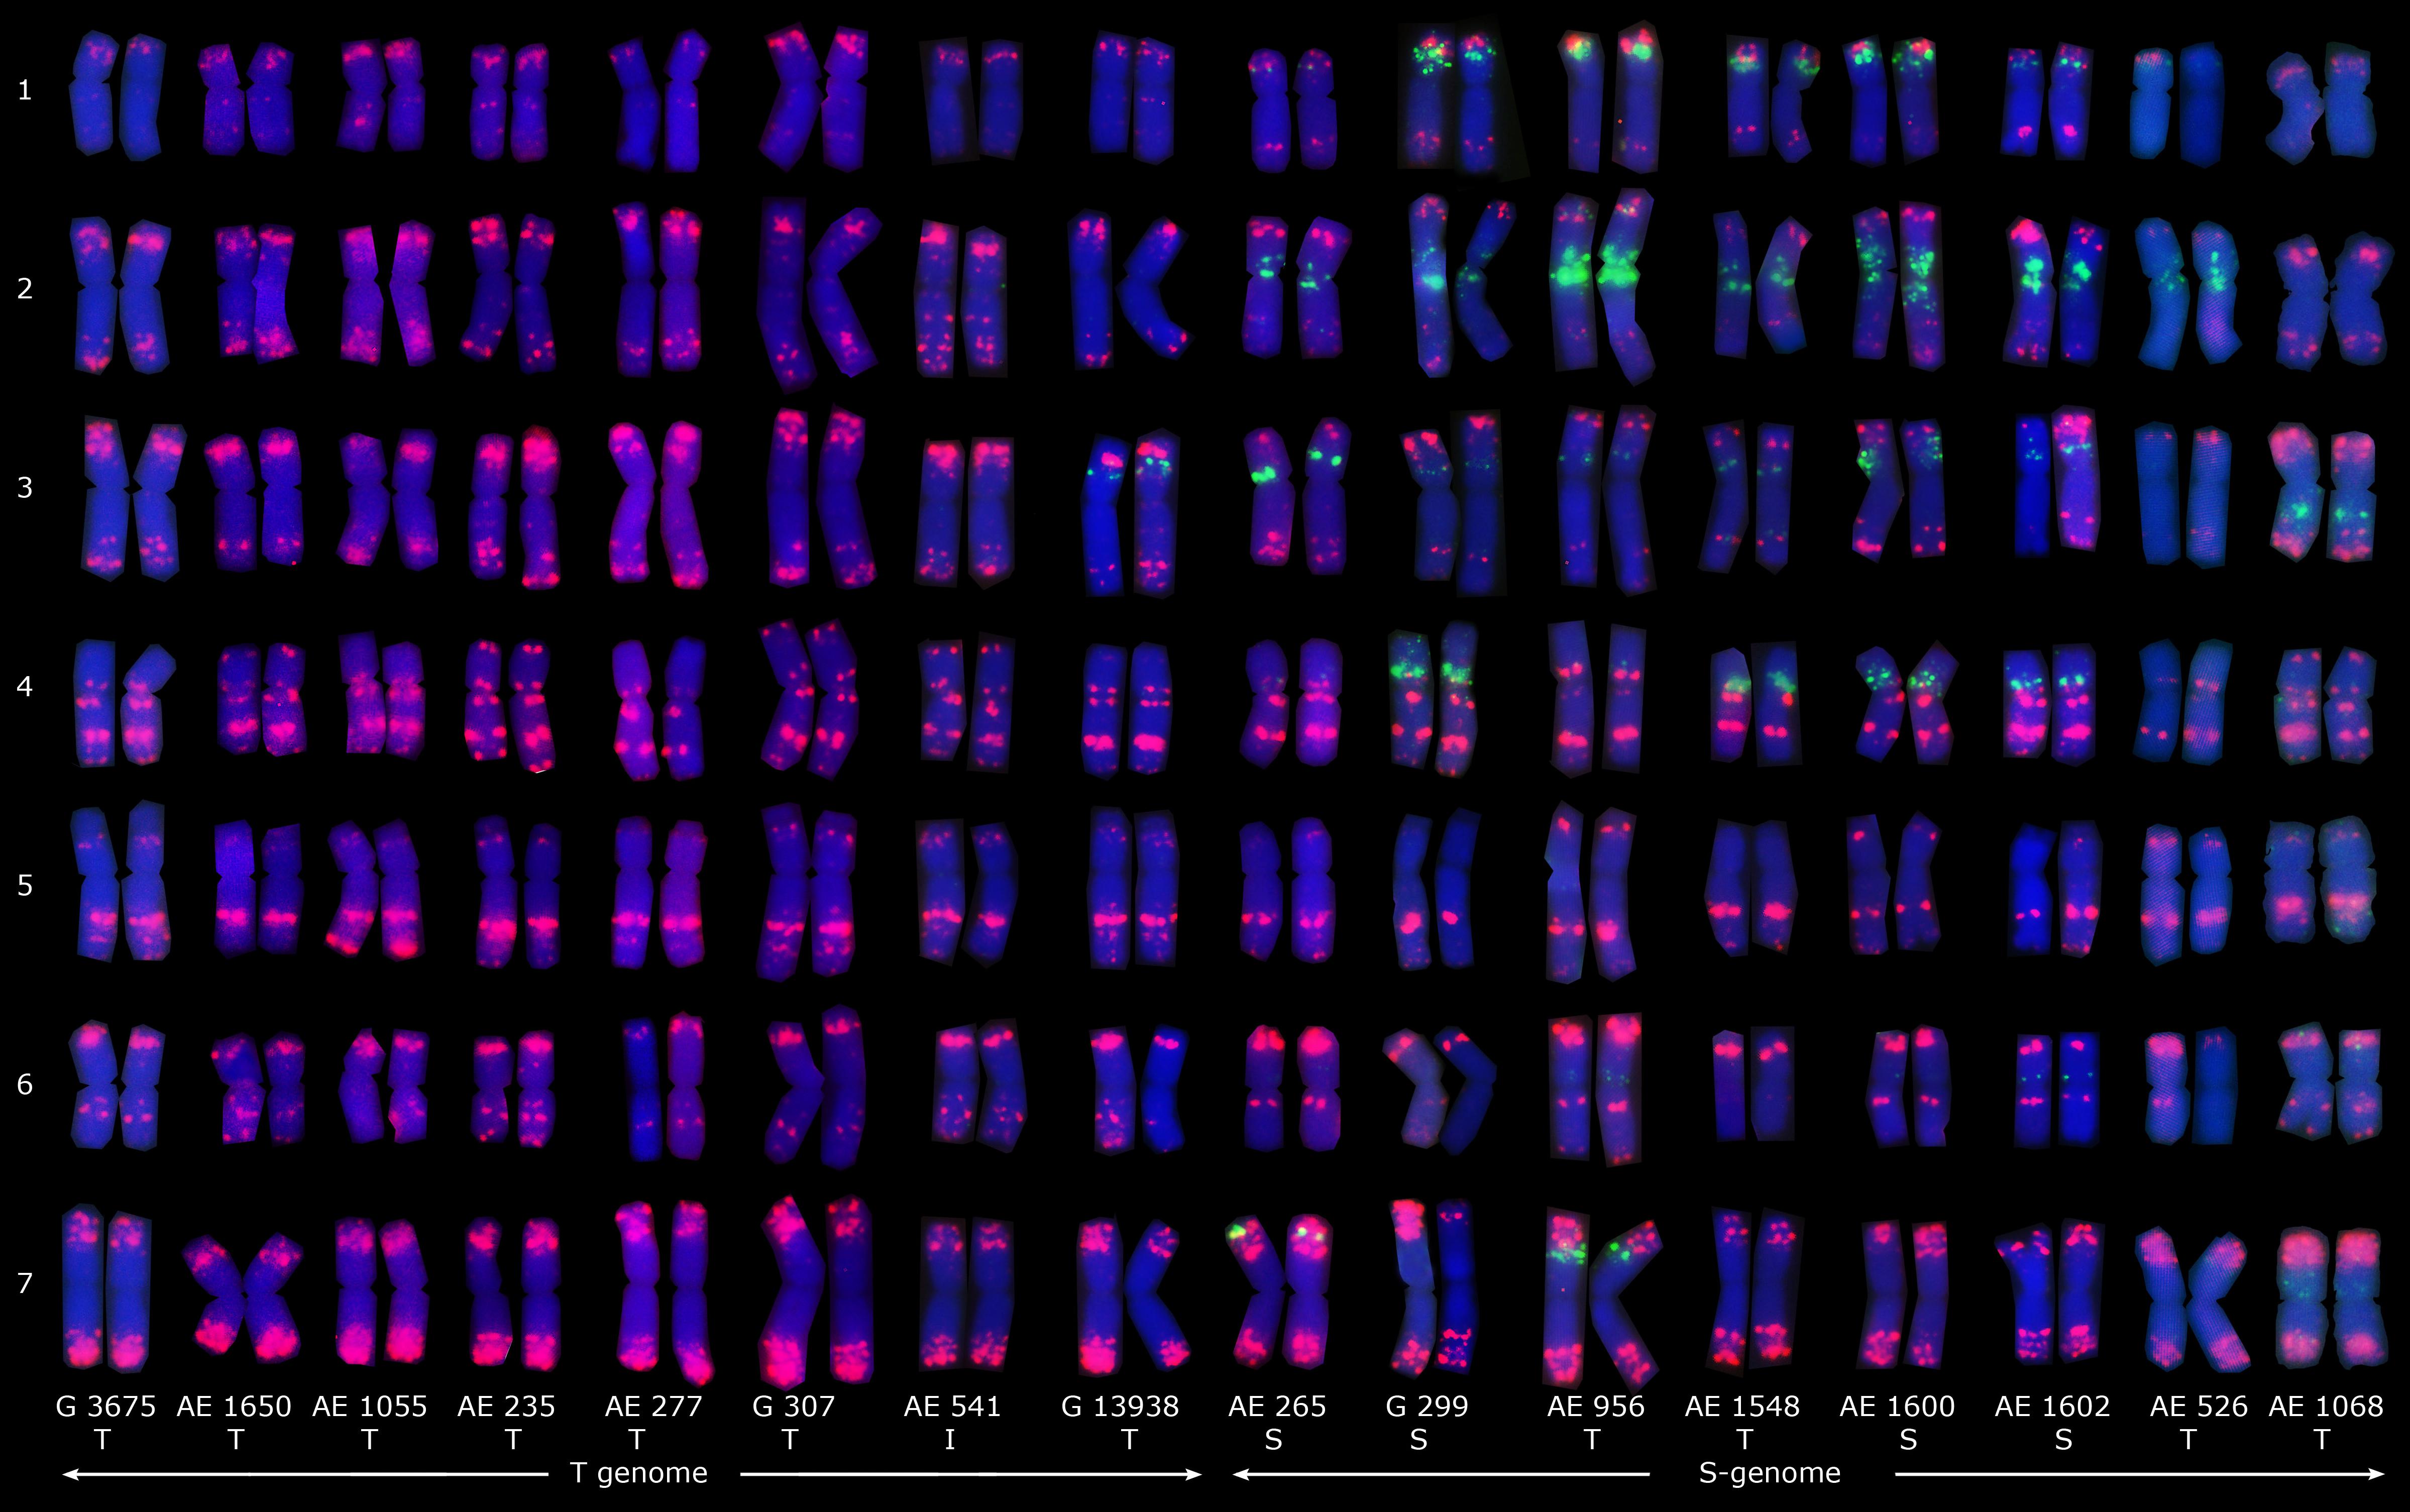
Figure 4. Distribution patterns of (GAA)10 (green) and pTa535-1 (red) probes on the mitotic metaphase chromosomes of sixteen Ae. tauschii accessions. Types of spike morphology (S, subsp. strangulata; T, subsp. tauschii; and I, intermediate) has also been indicated.
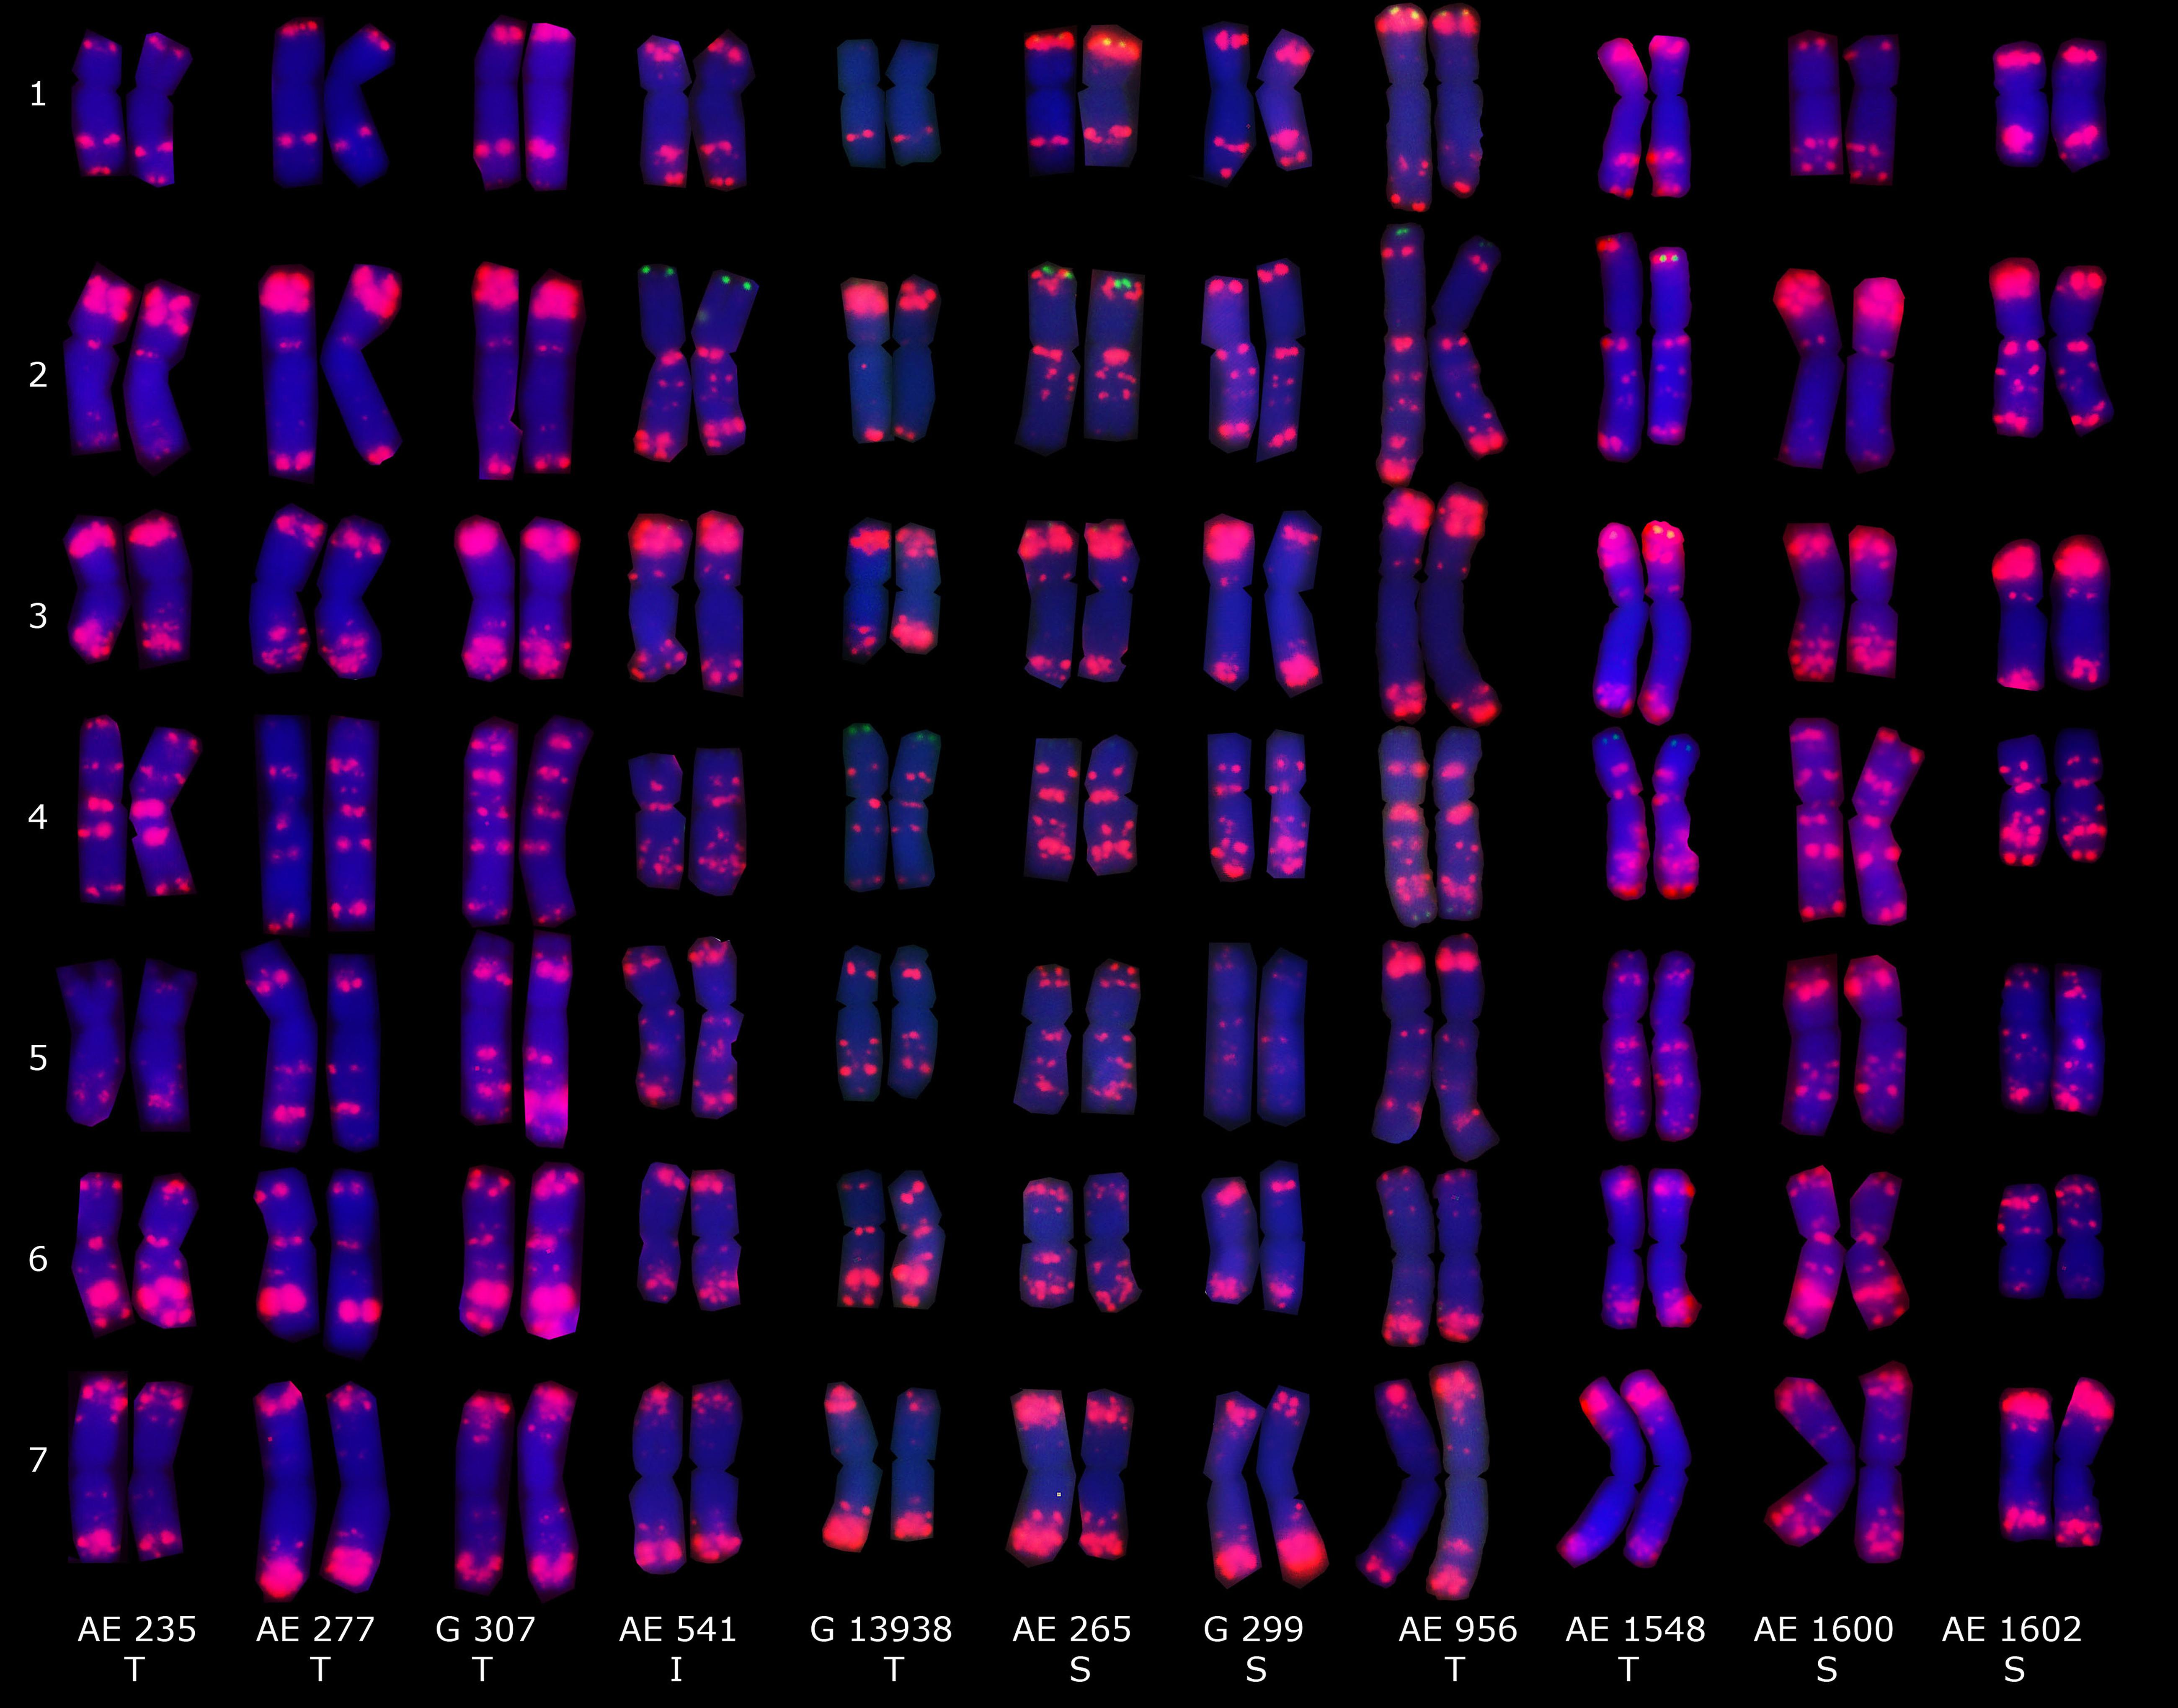
Figure 5. Distribution patterns of pAs1-1 (red) and oligo-pSc119.2-1 probes (green) on the mitotic metaphase chromosomes of eleven Ae. tauschii accessions. Spike morphologies of S, T, and I refers to as subsp. strangulata, subsp. tauschii, and intermediate form, respectively.
Distribution Patterns of Major Retrotransposons on Chromosomes
The density of the Ty1/Copia and LINE (short interspersed nuclear element) superfamilies accompanied codding gene density and increased from the centromere toward the telomere whereas the density of the Ty3/Gypsy superfamily and two of its most abundant lineages, i.e., Athila and Tekay increased in the opposite direction (Figure 6). The centromere-specific retrotransposon CRM (homologous to cereba) that is a lineage of Ty3/gypsy chromoviruses has been preferentially accumulated in centromeres (Nagaki et al., 2003). BLASTn mapped the previously identified Triticeae specific CCS1 centromeric repeat (Aragon-Alcaide et al., 1996) between the CRM elements indicating that these elements are enriched for the centromere core sequences (Figure 7). The CRM peaks showed uneven distribution within the 7 Ae. tauschii chromosomes (Figure 7). We used root tips of an F1 hybrid generated from a cross between emmer wheat and Ae. tauschii ‘G 299’ for the localization of CRM elements: Chromosomes 6D and 7D showed stronger signals relative to the other D genome chromosomes (Figure 8).
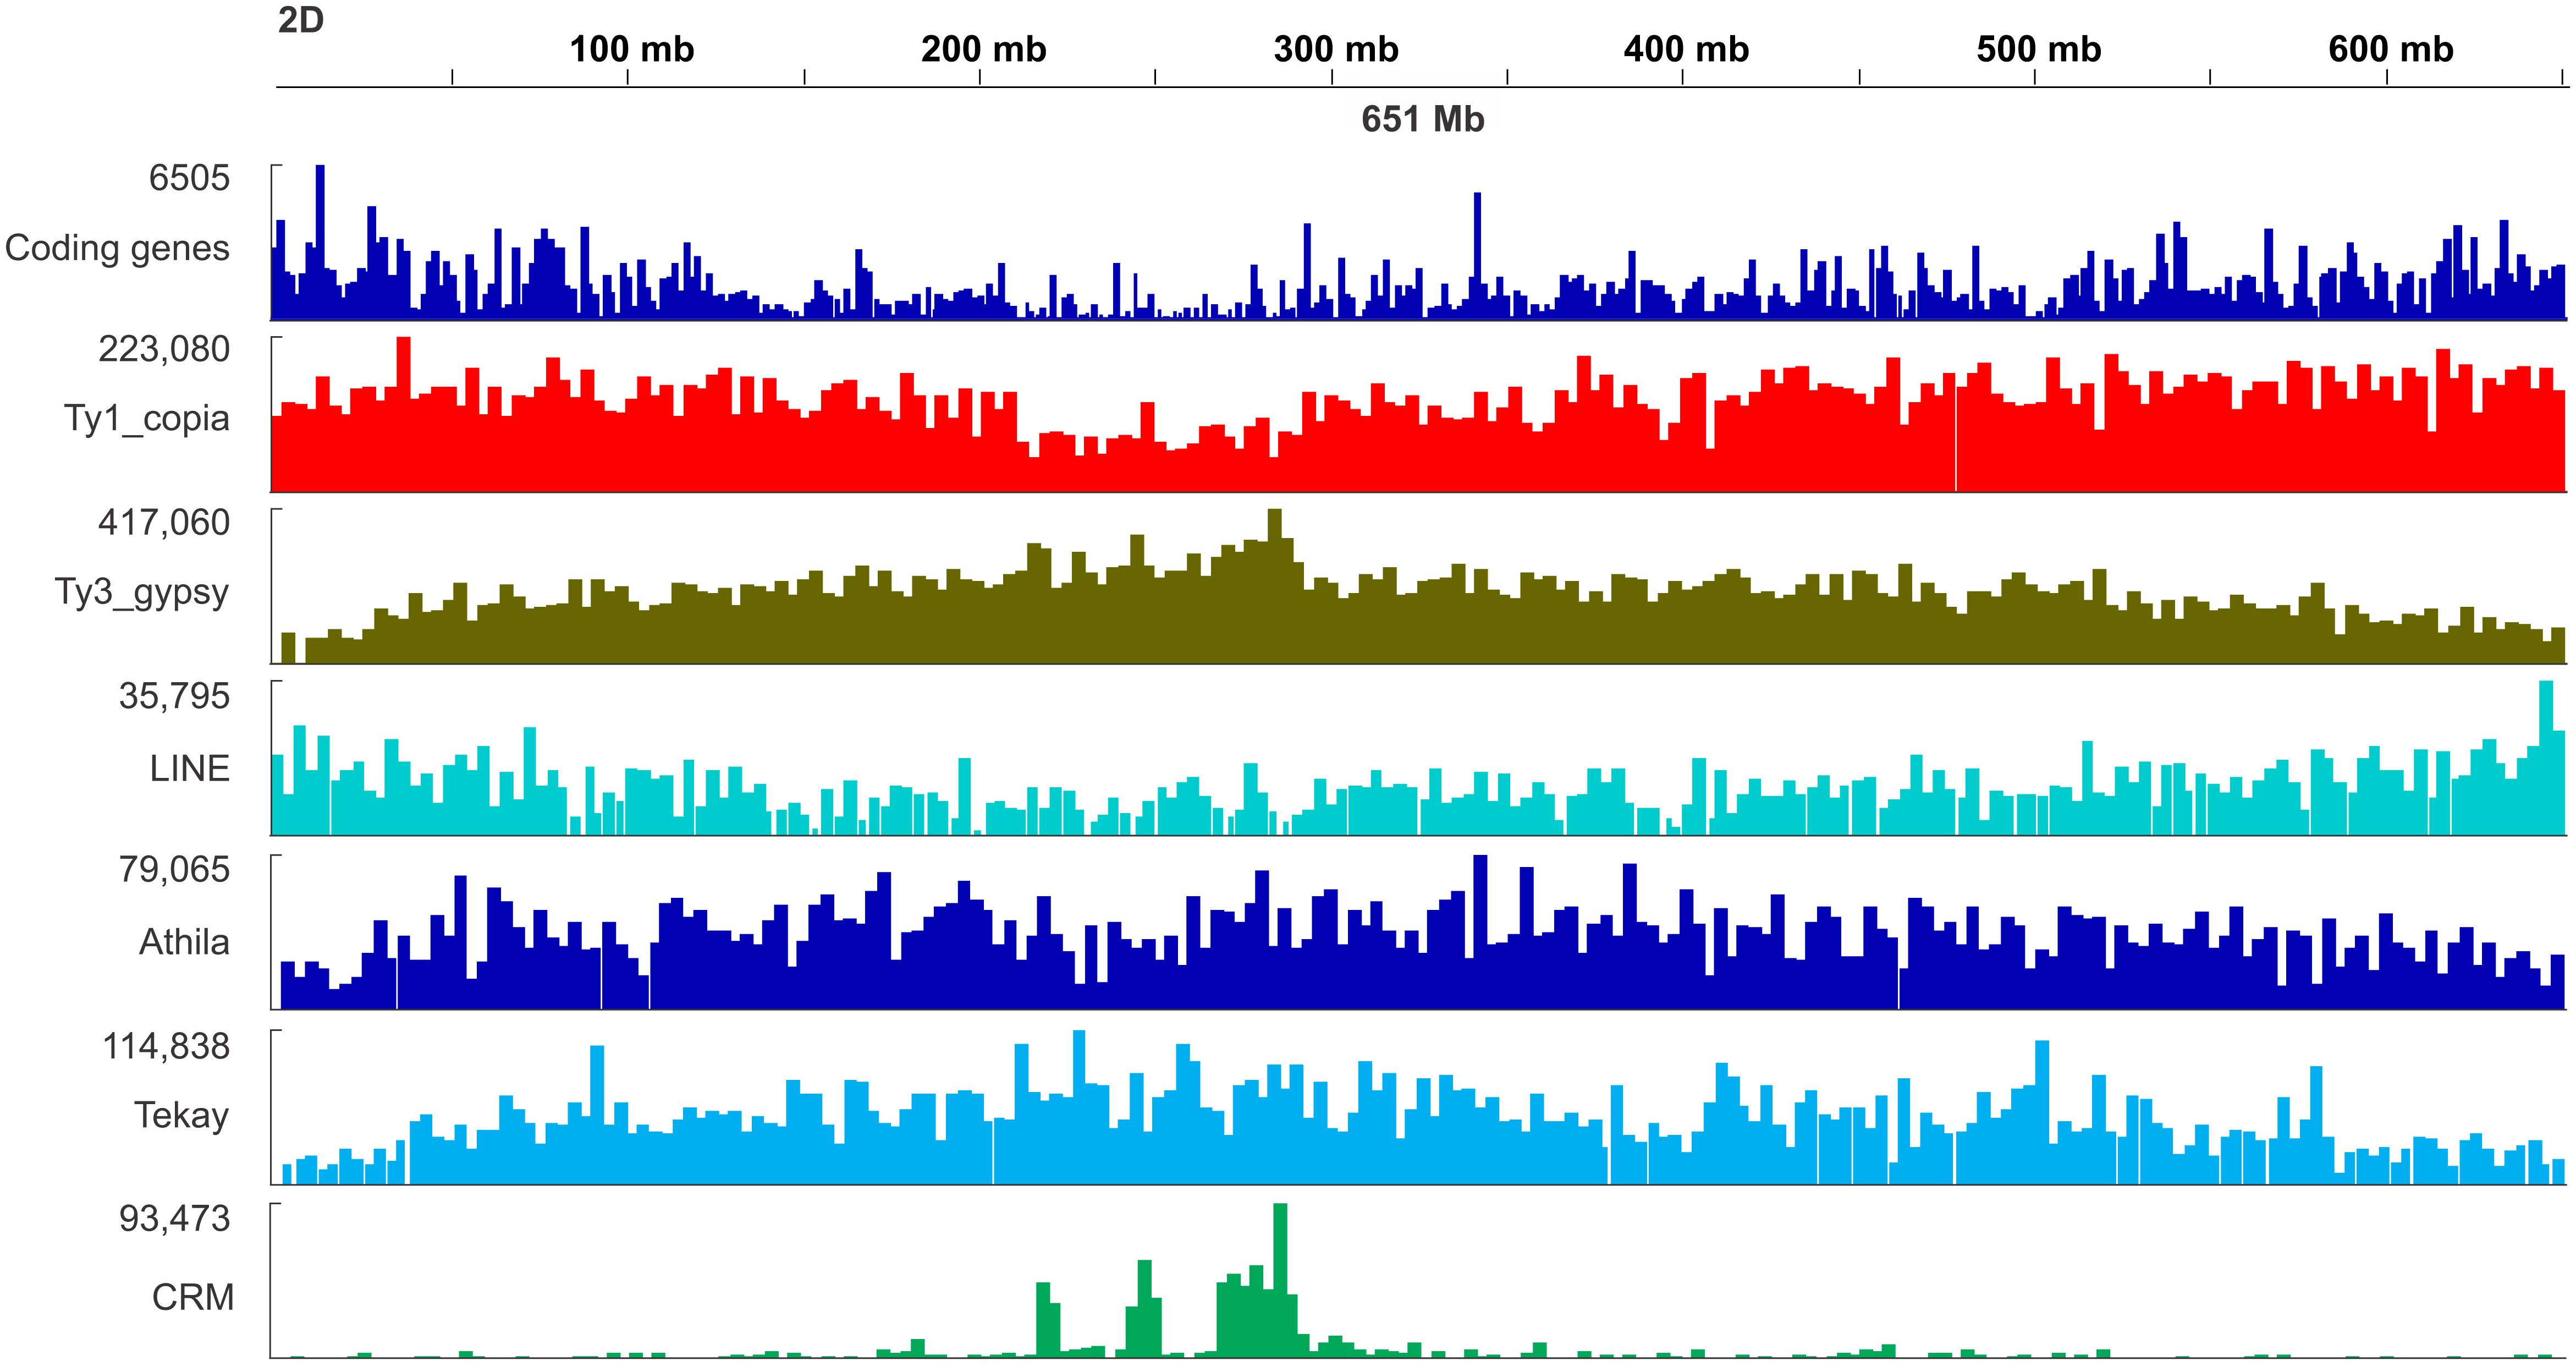
Figure 6. Distribution map of genes and selected retrotransposon lineages including Ty1/copia, Ty3/gypsy, LINE, Athila, Tekay, and CRM retrotransposons along the chromosome 2D of Ae. tauschii.

Figure 7. Density of CRM lineage of Ty3/gypsy retrotransposon along the chromosome 3D of Ae. tauschii. A small part from the centromeric region which is highly enriched in CRM elements has been show in detail. BLASTn mapped the Triticeae specific CCS1 centromeric repeat (red elements) between the CRM elements. CHDCR, chromodomain of centromeric retrotransposons; INT, integrase; PROT, protease; RH, ribonuclease H; RT, reverse transcriptase.
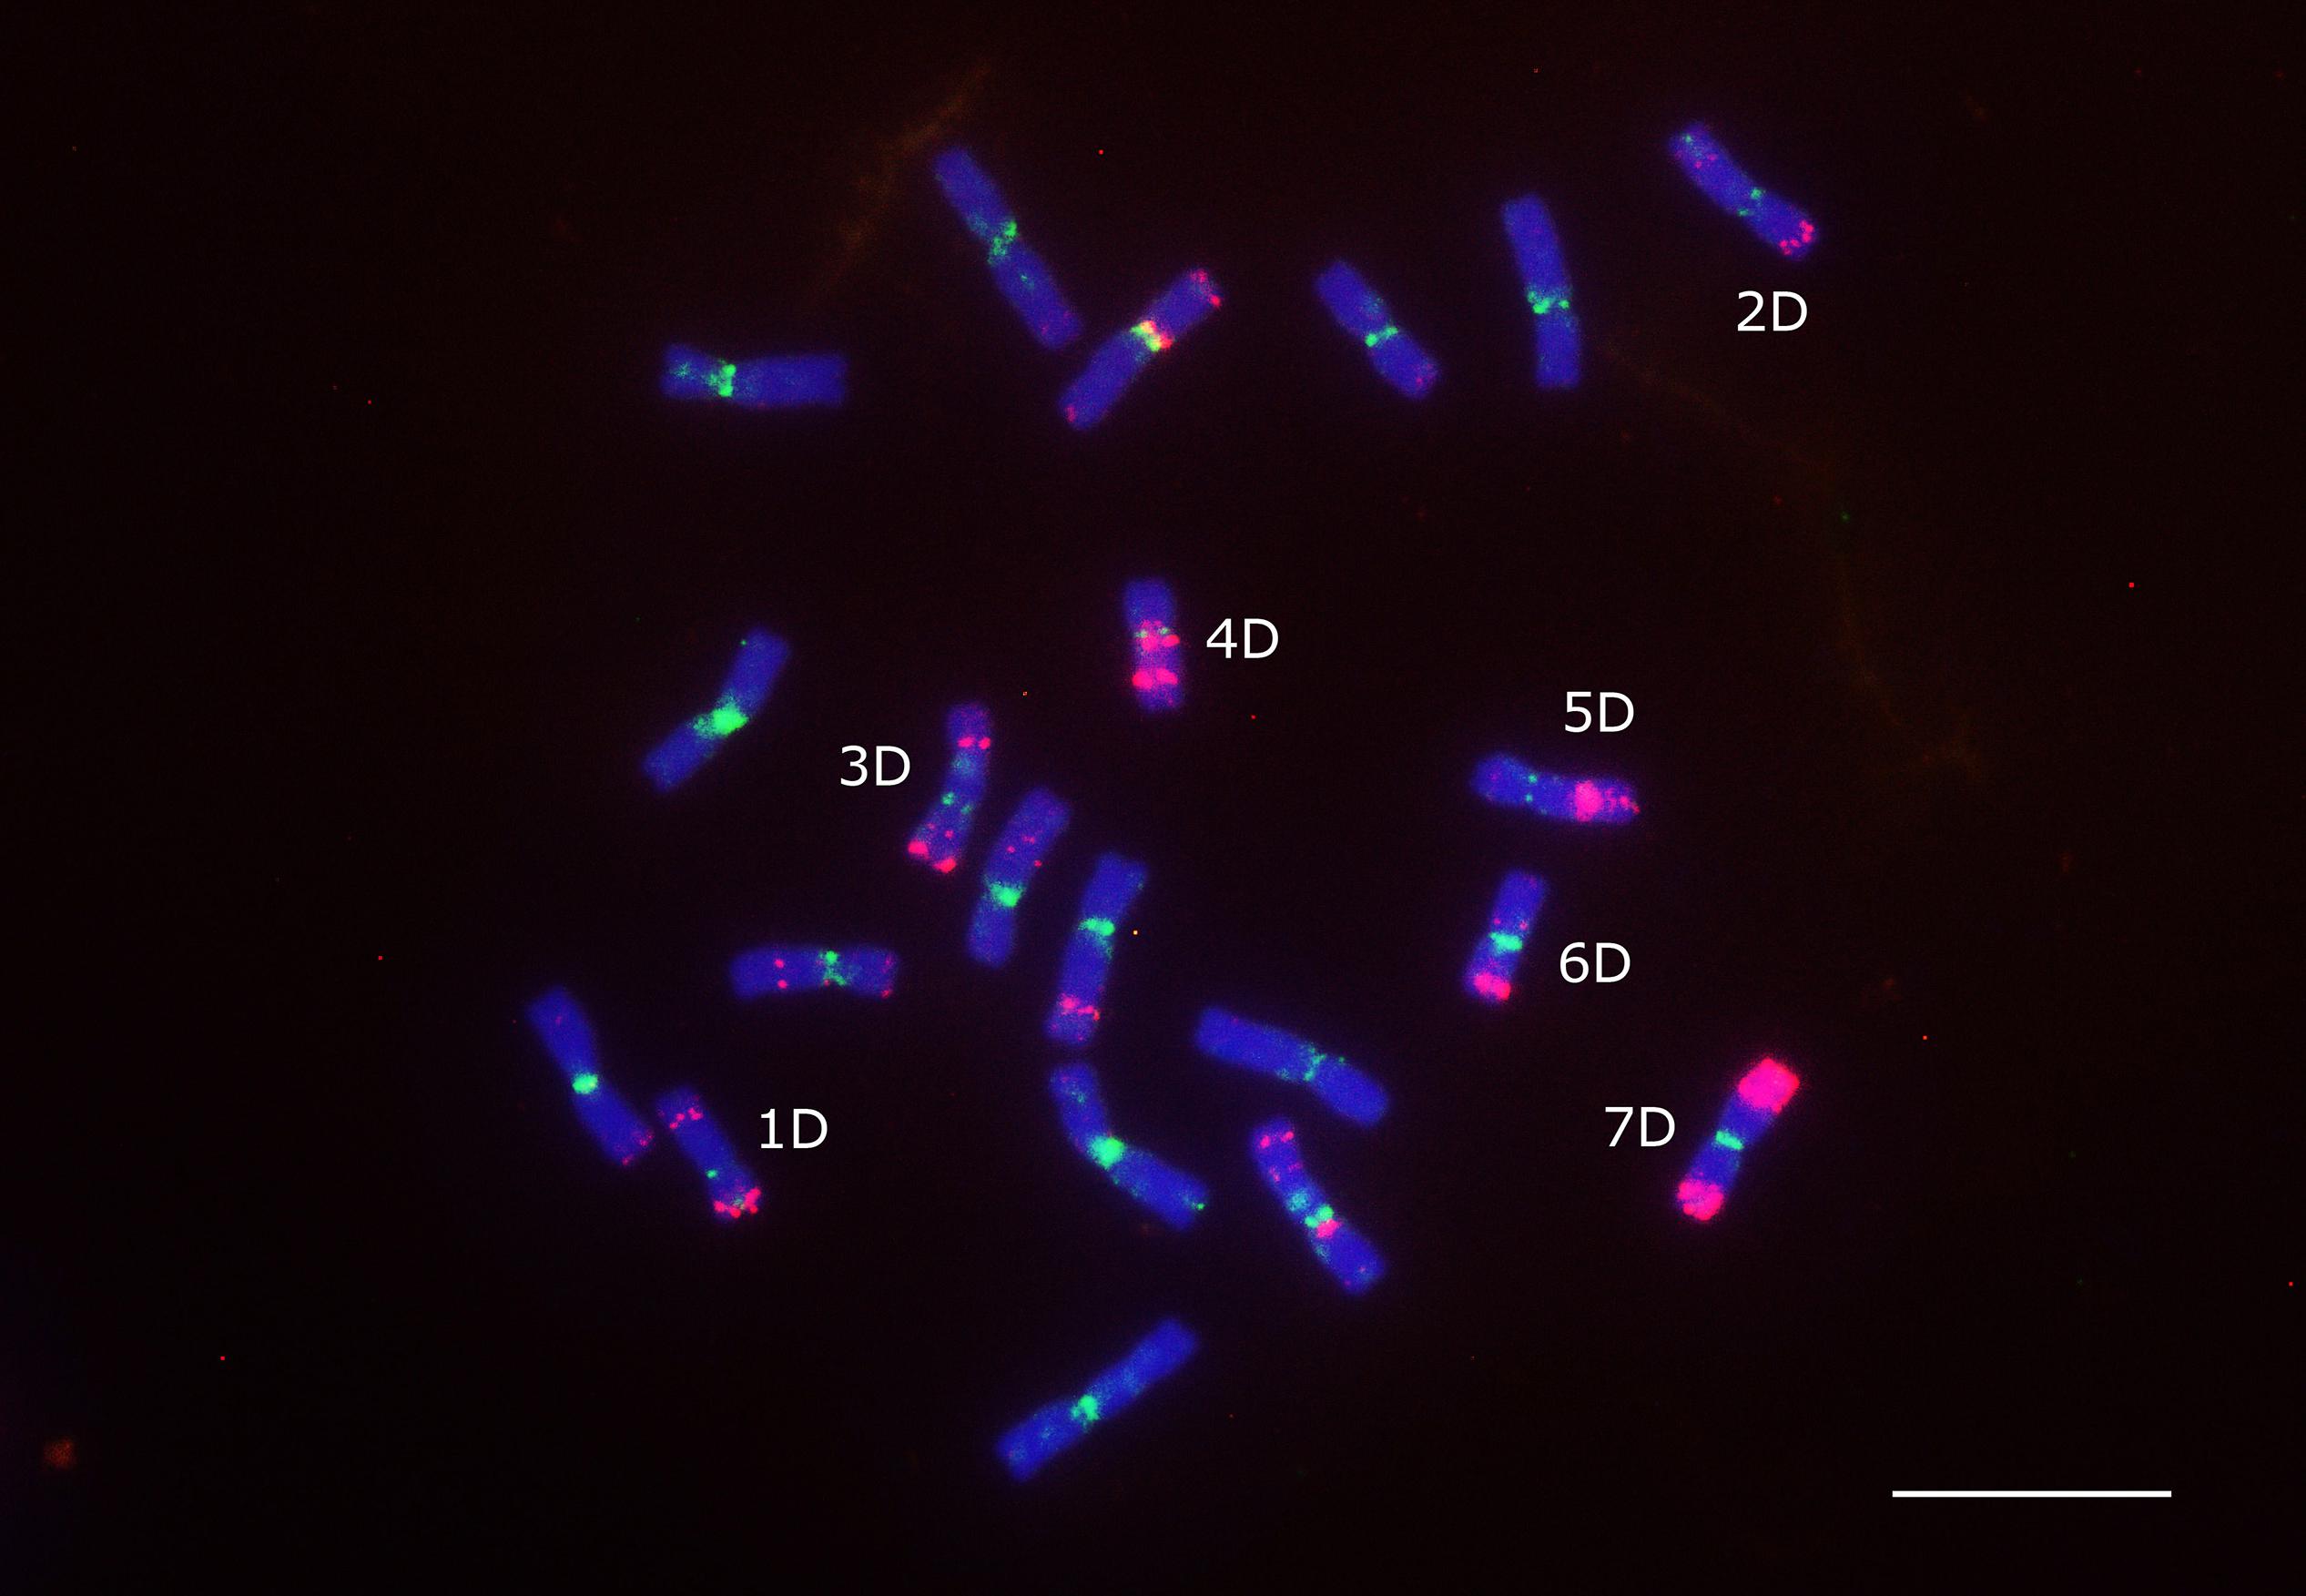
Figure 8. Localization of CRM element (green signals) on the mitotic chromosomes of an F1 hybrid from a cross between emmer wheat (T. dicoccum “TazeabadAliabad”) and Ae. tauschii “G 299.” Oligo-pTa535-1 probe (red signals) was also applied to identify the D genome chromosomes. Scale bar = 10 μm.
SNP Calling and Genetic Diversity Analysis
The same Illumina reads that used for the repeat identification, were also used for variant calling and SNP identification among the Ae. tauschii accessions. A total of 466,498 SNPs identified from all the genotypes after filtering. Distributions of each type of SNP were as follows: A/G, 147010 (31.1%), C/T, 149165 (32%), A/T, 35523 (7.6%), A/C, 44284 (9.4%), C/G, 46079 (9.8%), and G/T, 44437 (9.5%). Of the 466498 identified SNPs, 296175 (63.4%) were classified as transitions (A/G or C/T), and 170323 (36.5%) were classified as transversions (A/T, A/C, C/G, and G/T) (Supplementary Table 9). A phylogenetic tree based on the identified SNPs and Nei’s genetic distances was constructed, based on which, almost all anathera and strangulata genotypes were grouped according to their subspecies (Figure 2B). Genotypes of var. meyeri showed a substantial genetic diversity based on SNP analysis. The SNP-derived phylogenetic tree rather supported the tree generated from the abundances of subspecies and genotype specific clusters (Figure 2B). This agreement was specifically obvious for strangulata subspecies whose genotypes were clustered together in both trees, although the tree of repeat abundances was unable to unify genotypes belonging to anathera subspecies.
Discussion
Genomic repetitive sequences commonly show species-specific sequence type, abundance, and distribution patterns, however, their intraspecific variations have been poorly described. To see how the repeatome differentiate in Ae. tauschii, we used publicly available genomic Illumina read data and compared the repetitive sequences between 29 Ae. tauschii genotypes from different subspecies, i.e., anathera, meyeri, and strangulata using RepeatExplorer (Novák et al., 2020).
Repetitive DNA constitutes about 80% of angiosperm genomes with 1C DNA value greater than 5.0 pg (Flavell et al., 1974). Nearly, 85% of the maize (Schnable et al., 2009), wheat (Appels et al., 2018), and barley (Mayer et al., 2012) genomes are composed of transposable elements, the majority of which are LTR retrotransposons. Our analysis using RepeatExplorer2 showed that the repetitive sequences constitute 77.35% of the nuclear genome of Ae. tauschii, the majority of which (61.56%) are composed of transposons with 58.42% of which being retrotransposons (Supplementary Table 3). LTR retrotransposons were found to be the most abundant mobile elements and composed 58.27% of Ae. tauschii genome. The LTR retrotransposons divided to Ty3/gypsy and Ty1/copia super families with 38.65 and 19.35% of genome, respectively. Estimation of the amount of transposable element by RepeatExplorer is in agreement with the amount of transposable element (55.12%) estimated via Ae. tauschii genome sequencing (Jia et al., 2013). On the contrary, class II transposons contributed to only 2% of the repeats. This estimate was not in agreement with 11% (Jia et al., 2013) and 16% (Luo et al., 2017) ratios estimated by genome sequencing projects of Ae. tauschii. A similar proportion of 2–3% class II transposons is found in each of maize (Meyers et al., 2001) and Arabidopsis (The_Arabidopsis_Genome_Initiative, 2000) whose genomes are 1.9 and 16.8 times smaller than that of Ae. tauschii (4,968 Mbp), respectively. However, this estimate is different from that of Brassica and rice, whose genomes contain ∼6 and 12% class II DNA transposons, respectively (Jiang and Wessler, 2001; Jiang et al., 2004).
Sixteen different satellite repeats representing 3% of the Ae. tauschii genome were identified. The unit length of the identified satellites ranged from 44 to 6371 nucleotides, although a majority (thirteen) of these had a unit length in the range of 118 to 567 nucleotides. The unit length of most tandem repeat families in plants varies from 150 to 180 bp, but can reach up to 1000 bp or more (Melters et al., 2013). For example, centromeric tandem repeats lengths are 178 bp in Arabidopsis (Copenhaver et al., 1999), 155 bp in rice, and 156 bp in maize (Ananiev et al., 1998; Melters et al., 2013), a length sufficient for wrapping around a single nucleosome (Henikoff et al., 2001).
Unequal crossing-over and strand slippage are the mechanisms which can easily explain the duplication of tandem repeats in the genome (Garrido-Ramos, 2015). Tandem repeats are highly prevalent at centromeres of both the animal and plant genomes (Melters et al., 2013); however, here the most frequent satellites such as CL1 and CL57 are distributed outside the centromeres and toward the distal end of chromosome arms. CL1, CL34, and CL57 are homologous to the already identified repeats pAs1 or Afa family (Nagaki et al., 1995; Komuro et al., 2013), pTa-451 (Komuro et al., 2013), and pTa535 (Komuro et al., 2013), respectively.
A key result of this study is that a few repetitive sequence clusters were revealed to be differentially proliferated between Ae. tauschii subspecies. Although the type and amount of the identified repeats were generally the same between accessions, however, we found seven repeats with differential amplification between subspecies (Figure 1 and Supplementary Table 7). In a dendrogram generated based on the abundances of these repeats, subsp. strangulata differed from subsp. meyeri and subsp. anathera while the latter two were grouped together. Taken together, these results are in agreement with the monotypic nature, distinct spike morphology, and the lower geographic dispersal and genetic diversity of subsp. strangulata compared with the other subspecies, e.g., subsp. tauschii and intermediate forms (Kihara and Tanaka, 1958; Dvorak et al., 1998).
Variation in repeat abundance is common during the speciation and might change DNA C value. For example, differential lineage-specific amplification of transposable elements has been observed in Gossypium (Hawkins et al., 2006). Subspecific repeats amplification has also been reported in other plants. In Beta nana copy number of a specific satellite, was more than tenfold higher than in B. lomatogona and up to 200 times higher than in B. vulgaris, indicating the different levels of sequence amplification during evolution in the genus Beta (Kubis et al., 1997). In rice, the different repetitive sequence families have been differentially amplified between indica and japonica rice (Ohmido et al., 2000).
Our study suggests that repetitive sequence abundances could provide additional helpful data for phylogenetic and genome evolution studies. Comparative graph-based clustering of next-generation sequence reads has been utilized for the phylogenetic analysis. It has been shown that the abundance of repetitive elements has a phylogenetic signal and can be used as a continuous character to infer phylogenetic trees (Dodsworth et al., 2015a,b). CL220 tandem repeat and 45S rDNA abundances were highly variable between genotypes but their abundances were not subspecies specific. Variation in rDNA copy number between individuals within a species is well documented (Rogers and Bendich, 1987). Variation in rDNA copy number is thought to be tolerated because of redundancy, and the observation that only a subset of the repeats is transcribed at any one time (McStay and Grummt, 2008; Lopez et al., 2021).
Besides the repeat abundances, we further used a reference-based SNP calling and ITS1-5.8S-ITS2 sequences (Supplementary Table 8) for phylogeny of Ae. tauschii accession. The ITS tree did not group subspecies even the strangulata accessions together (Figure 3), implying lack of ITS sequence efficacy for intervarietal classification. A near complete differentiation of anathera and strangulata subspecies was observed using SNP analysis although var. meyeri showed a higher genetic diversity (Figure 2B). There are reports that some meyeri accessions, specifically those from the west coast of the Caspian Sea, are genetically closer to strangulata (Lubbers et al., 1991; Dvorak et al., 1998; Wang et al., 2013). Although phylogenetic analysis using the repeat abundances placed all the strangulata accessions in a distinct clade but could not discriminate between anathera and meyeri (Figure 2).
Providing that anathera and meyeri varieties be considered as a single tauschii subspecies as suggested basically by the botanical classifications, we can conclude that subspecific differential amplification of CL62 and CL87 and CL217 (all belonging to Ty3/gypsy super family) and CL142 (belonging to Ty1/copia super family) retrotransposons have been resulted from change in their activity after strangulata subsp. divergence. In fact, LTR retrotransposons are the most dynamic part of the genome, and an important source of within species differences in repeat abundances (Vitte and Panaud, 2005).
Our results suggest the involvement of repeat amplification rates in botanical differences such as spike morphology between Ae. tauschii genotypes. Types and abundances of repetitive DNA might have an impact on the expression of the adjacent genes (Ramírez-González et al., 2018; Bariah et al., 2020). TEs also have an impact on DNA methylation and expression of nearby genes in the different plant species (Makarevitch et al., 2015; Wang et al., 2018; Stritt et al., 2020). TEs in gene promoter might affect gene expression in a tissue-specific manner as cis-regulatory elements or through other epigenetic mechanisms (Ramírez-González et al., 2018). For example, MITE domestication into miRNA precursors might have an important role in gene expression in wheat (Poretti et al., 2020). Association between a specific TE insertion into a gene and the levels of gene expression in wheat has also been reported (Domb et al., 2019). TE insertions can also have a direct effect on phenotypes such as brittle rachis and heading date in wheat (Jiang et al., 2019; Shi et al., 2019). Various functions ranging from chromosome organization and pairing to the modulation of gene functions are also proposed for tandem repeats (Martienssen, 2003; Kloc and Martienssen, 2008; Garrido-Ramos, 2015).
Fluorescence in situ hybridization using pAs1-1 (homologous to CL1), pTa535-1 (homologous to CL57), pSc119.2-1 (homologous to CL211), and (GAA)10 oligo-nucleotide probes could not discriminate Ae. tauschii subspecies but (GAA)10 signal patterns generated two distinct karyotype groups. The two karyotype groups were poorly agreed with botanical classification of subspecies, but were concurrent with the molecular marker-based phylogeny that proposed the presence of two distinct lineages of Ae. tauschii (Dvorak et al., 1998; Mizuno et al., 2010; Wang et al., 2013). This is not the first report on Ae. tauschii that links karyotype to genetic structure. The presence of two distinct genomes in Ae. tauschii has already been demonstrated as well based on the GAA distribution patterns (Zhao et al., 2018). Based on the spike morphology and karyotypic analysis, Zhao et al. (2018) concluded that subsp. tauschii var. meyeri, as an intermediate form, should be redesignated subsp. strangulata var. meyeri. The FISH pericentromeric signal resulting from (GAA)10 probes on chromosome 4 seems to be specific to strangulata subspecies and is not available on the other two types (Zhao et al., 2018), but chromosome 4 of “AE 956” and “AE 1548”– which belong to tauschii subspecies, exceptionally showed a very weak (GAA)10 signal in this study (Figure 4).
Conclusion
Although the SNP-based analysis proved to be the gold standard for the intraspecific classification, the present study demonstrated that different classes of repetitive DNA sequences have differentially accumulated between tauschii and strangulata subspecies of Ae. tauschii. The differential repeat amplifications generally agreed with morphological differences. Taken together, the results imply that repeatome is differentially evolved even among highly closely related lineages.
Data Availability Statement
The original contributions presented in the study are included in the article/Supplementary Material; further inquiries can be directed to the last corresponding author.
Author Contributions
RE and FO assisted in FISH experiments. GM and PM conceived and designed the research. GM conducted bioinformatics analysis, did FISH experiments, and wrote the manuscript. All authors contributed to the article and approved the submitted version.
Funding
This work was supported by the University of Kurdistan and Iran National Science Foundation (INSF) grant 99014038. Research use permissions for plant material including seed germination and collection were obtained from the IPK and SPII gene banks according to corresponding MTA agreements.
Conflict of Interest
The authors declare that the research was conducted in the absence of any commercial or financial relationships that could be construed as a potential conflict of interest.
Publisher’s Note
All claims expressed in this article are solely those of the authors and do not necessarily represent those of their affiliated organizations, or those of the publisher, the editors and the reviewers. Any product that may be evaluated in this article, or claim that may be made by its manufacturer, is not guaranteed or endorsed by the publisher.
Supplementary Material
The Supplementary Material for this article can be found online at: https://www.frontiersin.org/articles/10.3389/fpls.2021.716750/full#supplementary-material
References
Abdolmalaki, Z., Mirzaghaderi, G., Mason, A. S., and Badaeva, E. D. (2019). Molecular cytogenetic analysis reveals evolutionary relationships between polyploid Aegilops species. Plant Syst. Evol. 305, 459–475. doi: 10.1007/s00606-019-01585-3
Ananiev, E. V., Phillips, R. L., and Rines, H. W. (1998). Chromosome-specific molecular organization of maize (Zea mays L.) centromeric regions. Proc. Natl. Acad. Sci. U.S.A. 95, 13073–13078. doi: 10.1073/pnas.95.22.13073
Appels, R., Eversole, K., Stein, N., Feuillet, C., Keller, B., Rogers, J., et al. (2018). Shifting the limits in wheat research and breeding using a fully annotated reference genome. Science 361:eaar7191. doi: 10.1126/science.aar7191
Aragon-Alcaide, L., Miller, T., Schwarzacher, T., Reader, S., and Moore, G. (1996). A cereal centromeric sequence. Chromosoma 105, 261–268. doi: 10.1007/s004120050183
Bariah, I., Keidar-Friedman, D., and Kashkush, K. (2020). Where the wild things are: transposable elements as drivers of structural and functional variations in the wheat genome. Front. Plant Sci. 11:585515. doi: 10.3389/fpls.2020.585515
Bedbrook, J., Jones, J., O’dell, M., Thompson, R., and Flavell, R. (1980). A molecular description of telomeric heterochromatin in Secale species. Cell 19, 545–560. doi: 10.1016/0092-8674(80)90529-2
Bodenhofer, U., Bonatesta, E., Horejš-Kainrath, C., and Hochreiter, S. (2015). msa: an R package for multiple sequence alignment. Bioinformatics 31, 3997–3999.
Bolger, A. M., Lohse, M., and Usadel, B. (2014). Trimmomatic: a flexible trimmer for Illumina sequence data. Bioinformatics 30, 2114–2120. doi: 10.1093/bioinformatics/btu170
Copenhaver, G. P., Nickel, K., Kuromori, T., Benito, M.-I., Kaul, S., Lin, X., et al. (1999). Genetic definition and sequence analysis of Arabidopsis centromeres. Science 286, 2468–2474. doi: 10.1126/science.286.5449.2468
Danecek, P., Auton, A., Abecasis, G., Albers, C. A., Banks, E., DePristo, M. A., et al. (2011). The variant call format and VCFtools. Bioinformatics 27, 2156–2158. doi: 10.1093/bioinformatics/btr330
Dodsworth, S., Chase, M. W., Kelly, L. J., Leitch, I. J., Macas, J., Novák, P., et al. (2015a). Genomic repeat abundances contain phylogenetic signal. Syst. Biol. 64, 112–126. doi: 10.1093/sysbio/syu080
Dodsworth, S., Chase, M. W., Särkinen, T., Knapp, S., and Leitch, A. R. (2015b). Using genomic repeats for phylogenomics: a case study in wild tomatoes (Solanum section Lycopersicon: Solanaceae). Biol. J. Linn. Soc. 117, 96–105. doi: 10.1111/bij.12612
Domb, K., Keidar-Friedman, D., and Kashkush, K. (2019). A novel miniature transposon-like element discovered in the coding sequence of a gene that encodes for 5-formyltetrahydrofolate in wheat. BMC Plant Biol. 19:461. doi: 10.1186/s12870-019-2034-1
Dvorak, J., Luo, M.-C., Yang, Z.-L., and Zhang, H.-B. (1998). The structure of the Aegilops tauschii genepool and the evolution of hexaploid wheat. Theor. Appl. Genet. 97, 657–670. doi: 10.1007/s001220050942
Eig, A. (1929). “Monographisch-kritische uebersicht der gatung Aegilops,” in Repertorium Specierum Novarum Regni Vegetabilis, ed. F. Fedde (Dahlem bei Berlin: Verlag des Repertoriums), 1–228.
Flavell, R., Bennett, M., Smith, J., and Smith, D. (1974). Genome size and the proportion of repeated nucleotide sequence DNA in plants. Biochem. Genet. 12, 257–269. doi: 10.1007/bf00485947
Garrido-Ramos, M. A. (2015). SatDNA in plants: more than just rubbish. Cytogenet. Genome Res. 146, 153–170. doi: 10.1159/000437008
Garrison, E., and Marth, G. (2012). Haplotype-Based Variant Detection from Short-Read Sequencing. arXiv [Preprint]. Available online at: https://arxiv.org/abs/1207.3907 (accessed July 1, 2021).
Hammer, K. (1980). Vorarbeiten zur monographischen Darstellung von Wildpflanzensortimenten: Aegilops L. Kulturpflanze 28, 33–180. doi: 10.1007/bf02014641
Hawkins, J. S., Kim, H., Nason, J. D., Wing, R. A., and Wendel, J. F. (2006). Differential lineage-specific amplification of transposable elements is responsible for genome size variation in Gossypium. Genome Res. 16, 1252–1261. doi: 10.1101/gr.5282906
Henikoff, S., Ahmad, K., and Malik, H. S. (2001). The centromere paradox: stable inheritance with rapidly evolving DNA. Science 293, 1098–1102. doi: 10.1126/science.1062939
Jia, J., Zhao, S., Kong, X., Li, Y., Zhao, G., He, W., et al. (2013). Aegilops tauschii draft genome sequence reveals a gene repertoire for wheat adaptation. Nature 496, 91–95. doi: 10.1038/nature12028
Jiang, N., and Wessler, S. R. (2001). Insertion preference of maize and rice miniature inverted repeat transposable elements as revealed by the analysis of nested elements. Plant cell 13, 2553–2564. doi: 10.1105/tpc.010235
Jiang, N., Feschotte, C., Zhang, X., and Wessler, S. R. (2004). Using rice to understand the origin and amplification of miniature inverted repeat transposable elements (MITEs). Curr. Opin. Plant Biol. 7, 115–119. doi: 10.1016/j.pbi.2004.01.004
Jiang, Y.-F., Chen, Q., Wang, Y., Guo, Z.-R., Xu, B.-J., Zhu, J., et al. (2019). Re-acquisition of the brittle rachis trait via a transposon insertion in domestication gene Q during wheat de-domestication. N. Phytol. 224, 961–973. doi: 10.1111/nph.15977
Kihara, H. (1944). Discovery of the DD analyser, one of the ancestors of Triticum vulgare. Agric. Hort. 19, 889–890.
Kihara, H., and Tanaka, M. (1958). Morphological and physiological variation among Aegilops squarossa strains collected in Pakistan, Afghanistan and Iran. Preslia 30, 241–251.
Kihara, H., Yamashita, H., and Tanaka, M. (1965). “Morphologic, physiological, genetical, and cytological studies in Aegilops and Triticum collected in Pakistan, Afghanistan, Iran,” in Cultivated Plants and Their Relatives. Results of the Kyoto University Scientific Expedition to the Korakoram and Hidukush in 1955, ed. K. Yamashita (Kyoto: Kyoto University).
Kilian, B., Mammen, K., Millet, E., Sharma, R., Graner, A., Salamini, F., et al. (2011). “Aegilops,” in Wild Crop Relatives, Genomic and Breeding Resources, Cereals, ed. C. Kole (Berlin: Springer), 1–76.
Kimber, G., and Yen, Y. (1988). Analysis of pivotal-differential evolutionary patterns. Proc. Natl. Acad. Sci. U.S.A. 85, 9106–9108. doi: 10.1073/pnas.85.23.9106
Kloc, A., and Martienssen, R. (2008). RNAi, heterochromatin and the cell cycle. Trends Genet. 24, 511–517. doi: 10.1016/j.tig.2008.08.002
Komuro, S., Endo, R., Shikata, K., and Kato, A. (2013). Genomic and chromosomal distribution patterns of various repeated DNA sequences in wheat revealed by a fluorescence in situ hybridization procedure. Genome 56, 131–137. doi: 10.1139/gen-2013-0003
Kozlov, A. M., Darriba, D., Flouri, T., Morel, B., and Stamatakis, A. (2019). RAxML-NG: a fast, scalable and user-friendly tool for maximum likelihood phylogenetic inference. Bioinformatics 35, 4453–4455. doi: 10.1093/bioinformatics/btz305
Kubis, S., Heslop-Harrison, J. S., and Schmidt, T. (1997). A family of differentially amplified repetitive DNA sequences in the genus Beta reveals genetic variation in Beta vulgaris subspecies and cultivars. J. Mol. Evol. 44, 310–320. doi: 10.1007/pl00006148
Lagesen, K., Hallin, P., Rødland, E. A., Stærfeldt, H.-H., Rognes, T., and Ussery, D. W. (2007). RNAmmer: consistent and rapid annotation of ribosomal RNA genes. Nucleic Acids Res. 35, 3100–3108. doi: 10.1093/nar/gkm160
Langmead, B., and Salzberg, S. L. (2012). Fast gapped-read alignment with Bowtie 2. Nat. Methods 9, 357–359. doi: 10.1038/nmeth.1923
Lopez, F. B., Fort, A., Tadini, L., Probst, A. V., McHale, M., Friel, J., et al. (2021). Gene dosage compensation of rRNA transcript levels in Arabidopsis thaliana lines with reduced ribosomal gene copy number. Plant Cell 33, 1135–1150. doi: 10.1093/plcell/koab020
Lubbers, E. L., Gill, K. S., Cox, T. S., and Gill, B. S. (1991). Variation of molecular markers among geographically diverse accessions of Triticum tauschii. Genome 34, 354–361. doi: 10.1139/g91-057
Luo, M.-C., Gu, Y. Q., Puiu, D., Wang, H., Twardziok, S. O., Deal, K. R., et al. (2017). Genome sequence of the progenitor of the wheat D genome Aegilops tauschii. Nature 551, 498–502. doi: 10.1038/nature24486
Makarevitch, I., Waters, A. J., West, P. T., Stitzer, M., Hirsch, C. N., Ross-Ibarra, J., et al. (2015). Transposable elements contribute to activation of maize genes in response to abiotic stress. PLoS Genet. 11:e1004915. doi: 10.1371/journal.pgen.1004915
Martienssen, R. A. (2003). Maintenance of heterochromatin by RNA interference of tandem repeats. Nat. Genet. 35, 213–214. doi: 10.1038/ng1252
Matsuoka, Y., Takumi, S., and Kawahara, T. (2015). Intraspecific lineage divergence and its association with reproductive trait change during species range expansion in central Eurasian wild wheat Aegilops tauschii Coss (Poaceae). BMC Evol. Biol. 15:213. doi: 10.1186/s12862-015-0496-9
Mayer, K. F. X., Waugh, R., Langridge, P., Close, T. J., Wise, R. P., Graner, A., et al. (2012). A physical, genetic and functional sequence assembly of the barley genome. Nature 491, 711–716. doi: 10.1038/nature11543
McFadden, E. S., and Sears, E. R. (1946). The origin of Triticum spelta and its free-threshing hexaploid relatives. J. Hered. 37, 81–89. doi: 10.1093/oxfordjournals.jhered.a105590
McStay, B., and Grummt, I. (2008). The epigenetics of rRNA genes: from molecular to chromosome biology. Annu. Rev. Cell Dev. Biol. 24, 131–157. doi: 10.1146/annurev.cellbio.24.110707.175259
Melters, D. P., Bradnam, K. R., Young, H. A., Telis, N., May, M. R., Ruby, J. G., et al. (2013). Comparative analysis of tandem repeats from hundreds of species reveals unique insights into centromere evolution. Genome Biol. 14:R10. doi: 10.1186/gb-2013-14-1-r10
Meyers, B. C., Tingey, S. V., and Morgante, M. (2001). Abundance, distribution, and transcriptional activity of repetitive elements in the maize genome. Genome Res. 11, 1660–1676. doi: 10.1101/gr.188201
Mirzaghaderi, G., Abdolmalaki, Z., Ebrahimzadegan, R., Bahmani, F., Orooji, F., Majdi, M., et al. (2020). Production of synthetic wheat lines to exploit the genetic diversity of emmer wheat and D genome containing Aegilops species in wheat breeding. Sci. Rep. 10:19698. doi: 10.1038/s41598-020-76475-7
Mirzaghaderi, G., and Mason, A. S. (2017). Revisiting pivotal-differential genome evolution in wheat. Trends Plant Sci. 22, 674–684. doi: 10.1016/j.tplants.2017.06.003
Mirzaghaderi, G., and Mason, A. S. (2019). Broadening the bread wheat D genome. Theor. Appl. Genet. 132, 1295–1307. doi: 10.1007/s00122-019-03299-z
Mizuno, N., Yamasaki, M., Matsuoka, Y., Kawahara, T., and Takumi, S. (2010). Population structure of wild wheat D-genome progenitor Aegilops tauschii Coss.: implications for intraspecific lineage diversification and evolution of common wheat. Mol. Ecol. 19, 999–1013. doi: 10.1111/j.1365-294X.2010.04537.x
Nagaki, K., Song, J., Stupar, R. M., Parokonny, A. S., Yuan, Q., Ouyang, S., et al. (2003). Molecular and cytological analyses of large tracks of centromeric DNA reveal the structure and evolutionary dynamics of maize centromeres. Genetics 163, 759–770. doi: 10.1093/genetics/163.2.759
Nagaki, K., Tsujimoto, H., Isono, K., and Sasakuma, T. (1995). Molecular characterization of a tandem repeat, Afa family, and its distribution among Triticeae. Genome 38, 479–486. doi: 10.1139/g95-063
Neumann, P., Novak, P., Hostakova, N., and Macas, J. (2019). Systematic survey of plant LTR-retrotransposons elucidates phylogenetic relationships of their polyprotein domains and provides a reference for element classification. Mob. DNA 10:1.
Novák, P., Ávila Robledillo, L., Koblížková, A., Vrbová, I., Neumann, P., and Macas, J. (2017). TAREAN: a computational tool for identification and characterization of satellite DNA from unassembled short reads. Nucleic Acids Res. 45:e111. doi: 10.1093/nar/gkx257
Novak, P., Hostakova, N., Neumann, P., and Macas, J. (2019). Domain Based Annotation of Transposable Elements – DANTE. Available online at: http://repeatexplorer.org/?page_id=832 (accessed 17 June 2021)
Novák, P., Neumann, P., and Macas, J. (2020). Global analysis of repetitive DNA from unassembled sequence reads using RepeatExplorer2. Nat. Protoc. 15, 3745–3776. doi: 10.1038/s41596-020-0400-y
Novák, P., Neumann, P., Pech, J., Steinhaisl, J., and Macas, J. (2013). RepeatExplorer: a Galaxy-based web server for genome-wide characterization of eukaryotic repetitive elements from next-generation sequence reads. Bioinformatics 29, 792–793. doi: 10.1093/bioinformatics/btt054
Ohmido, N., Kijima, K., Akiyama, Y., de Jong, J. H., and Fukui, K. (2000). Quantification of total genomic DNA and selected repetitive sequences reveals concurrent changes in different DNA families in indica and japonica rice. Mol. Gen. Genet. 263, 388–394. doi: 10.1007/s004380051182
Ozkan, H., Tuna, M., and Arumuganathan, K. (2003). Nonadditive changes in genome size during allopolyploidization in the wheat (Aegilops-Triticum) group. J. Hered. 94, 260–264. doi: 10.1093/jhered/esg053
Pedersen, C., and Langridge, P. (1997). Identification of the entire chromosome complement of bread wheat by two-colour FISH. Genome 40, 589–593. doi: 10.1139/g97-077
Poretti, M., Praz, C. R., Meile, L., Kälin, C., Schaefer, L. K., Schläfli, M., et al. (2020). Domestication of high-copy transposons underlays the wheat small RNA response to an obligate pathogen. Mol. Biol. Evol. 37, 839–848. doi: 10.1093/molbev/msz272
Ramírez-González, R. H., Borrill, P., Lang, D., Harrington, S. A., Brinton, J., Venturini, L., et al. (2018). The transcriptional landscape of polyploid wheat. Science 361:eaar6089. doi: 10.1126/science.aar6089
Rayburn, A. L., and Gill, B. S. (1986). Isolation of a D-genome specific repeated DNA sequence from Aegilops squarrosa. Plant Mol. Biol. Report. 4, 102–109. doi: 10.1007/bf02732107
Robinson, J. T., Thorvaldsdóttir, H., Wenger, A. M., Zehir, A., and Mesirov, J. P. (2017). Variant review with the integrative genomics viewer. Cancer Res. 77, e31–e34. doi: 10.1158/0008-5472.CAN-17-0337
Rogers, S. O., and Bendich, A. J. (1987). Ribosomal RNA genes in plants: variability in copy number and in the intergenic spacer. Plant Mol. Biol. 9, 509–520. doi: 10.1007/BF00015882
Schliep, K. P. (2010). phangorn: phylogenetic analysis in R. Bioinformatics 27, 592–593. doi: 10.1093/bioinformatics/btq706
Schnable, P. S., Ware, D., Fulton, R. S., Stein, J. C., Wei, F., Pasternak, S., et al. (2009). The B73 maize genome: complexity, diversity, and dynamics. Science 326, 1112–1115. doi: 10.1126/science.1178534
Shi, C., Zhao, L., Zhang, X., Lv, G., Pan, Y., and Chen, F. (2019). Gene regulatory network and abundant genetic variation play critical roles in heading stage of polyploidy wheat. BMC Plant Biol. 19:6. doi: 10.1186/s12870-018-1591-z
Stothard, P. (2000). The sequence manipulation suite: javascript programs for analyzing and formatting protein and DNA sequences. Biotechniques 28, 1102–1104. doi: 10.2144/00286ir01
Stritt, C., Wyler, M., Gimmi, E. L., Pippel, M., and Roulin, A. C. (2020). Diversity, dynamics and effects of long terminal repeat retrotransposons in the model grass Brachypodium distachyon. N. Phytol. 227, 1736–1748. doi: 10.1111/nph.16308
Tang, Z., Yang, Z., and Fu, S. (2014). Oligonucleotides replacing the roles of repetitive sequences pAs1, pSc119. 2, pTa-535, pTa71, CCS1, and pAWRC. 1 for FISH analysis. J. Appl. Genet. 55, 313–318. doi: 10.1007/s13353-014-0215-z
The_Arabidopsis_Genome_Initiative (2000). Analysis of the genome sequence of the flowering plant Arabidopsis thaliana. Nature 408, 796–815. doi: 10.1038/35048692
Vitte, C., and Panaud, O. (2005). LTR retrotransposons and flowering plant genome size: emergence of the increase/decrease model. Cytogenet. Genome Res. 110, 91–107. doi: 10.1159/000084941
Wang, J., Luo, M. C., Chen, Z., You, F. M., Wei, Y., Zheng, Y., et al. (2013). Aegilops tauschii single nucleotide polymorphisms shed light on the origins of wheat D-genome genetic diversity and pinpoint the geographic origin of hexaploid wheat. N. Phytol. 198, 925–937. doi: 10.1111/nph.12164
Wang, Y., Liang, W., and Tang, T. (2018). Constant conflict between Gypsy LTR retrotransposons and CHH methylation within a stress-adapted mangrove genome. N. Phytol. 220, 922–935. doi: 10.1111/nph.15209
Zhang, P., Li, W., Fellers, J., Friebe, B., and Gill, B. S. (2004). BAC-FISH in wheat identifies chromosome landmarks consisting of different types of transposable elements. Chromosoma 112, 288–299. doi: 10.1007/s00412-004-0273-9
Zhao, L., Ning, S., Yi, Y., Zhang, L., Yuan, Z., Wang, J., et al. (2018). Fluorescence in situ hybridization karyotyping reveals the presence of two distinct genomes in the taxon Aegilops tauschii. BMC Genomics 19:3. doi: 10.1186/s12864-017-4384-0
Keywords: satellite repeat, repetitive sequence abundance, tandem repeat, speciation, wheat
Citation: Ebrahimzadegan R, Orooji F, Ma P and Mirzaghaderi G (2021) Differentially Amplified Repetitive Sequences Among Aegilops tauschii Subspecies and Genotypes. Front. Plant Sci. 12:716750. doi: 10.3389/fpls.2021.716750
Received: 29 May 2021; Accepted: 27 July 2021;
Published: 19 August 2021.
Edited by:
István Molnár, Centre for Agricultural Research, Hungarian Academy of Sciences (MTA), HungaryReviewed by:
Eva Hribova, Institute of Experimental Botany, Czech Academy of Sciences, CzechiaOlga Raskina, University of Haifa, Israel
Copyright © 2021 Ebrahimzadegan, Orooji, Ma and Mirzaghaderi. This is an open-access article distributed under the terms of the Creative Commons Attribution License (CC BY). The use, distribution or reproduction in other forums is permitted, provided the original author(s) and the copyright owner(s) are credited and that the original publication in this journal is cited, in accordance with accepted academic practice. No use, distribution or reproduction is permitted which does not comply with these terms.
*Correspondence: Pengtao Ma, cHRtYUB5dHUuZWR1LmNu; Ghader Mirzaghaderi, Z2gubWlyemFnaGFkZXJpQHVvay5hYy5pcg==; orcid.org/0000-0002-4578-3374
 Rahman Ebrahimzadegan1
 Pengtao Ma
 Ghader Mirzaghaderi