
94% of researchers rate our articles as excellent or good
Learn more about the work of our research integrity team to safeguard the quality of each article we publish.
Find out more
ORIGINAL RESEARCH article
Front. Physiol. , 18 March 2025
Sec. Computational Physiology and Medicine
Volume 16 - 2025 | https://doi.org/10.3389/fphys.2025.1547117
 Xiaoyu Yin1*†
 Sophie Adelaars1,2†
 Elisabetta Peri1Eduard Pelssers3
 Jaap Den Toonder3Arthur Bouwman1,4
 Daan Van de Kerkhof2
 Massimo Mischi1
Introduction: The adequacy of hemodialysis (HD) in patients with end-stage renal disease is evaluated frequently by monitoring changes in blood urea concentrations multiple times between treatments. As monitoring of urea concentrations typically requires blood sampling, the development of sweat-sensing technology offers a possible less-invasive alternative to repeated venipuncture. Moreover, this innovative technology could enable personalized treatment in a home-based setting. However, the clinical interpretation of sweat monitoring is hampered by the limited literature on the correlation between urea concentrations in sweat and blood. This study introduces a pioneering approach to estimate blood urea concentrations using sweat urea concentration values as input.
Methods: To simulate the complex transport mechanisms of urea from blood to sweat, a novel pharmacokinetic transport model is proposed. Such a transport model, together with a double-loop optimization strategy from our previous work, was employed for patient-specific estimation of blood urea concentration. 32 patient samples of paired sweat and blood urea concentrations, collected both before and after HD, were used to validate the model.
Results: This resulted in an excellent Pearson correlation coefficient (0.98, 95%CI: 0.95–0.99) and a clinically irrelevant bias (−0.181 mmol/L before and −0.005 mmol/L after HD).
Discussion: This model enabled the accurate estimation of blood urea concentrations from sweat measurements. By accurately estimating blood urea concentrations from sweat measurements, our model enables non-invasive and more frequent assessments of dialysis adequacy in ESRD patients. This approach could facilitate home-based and patient-friendly dialysis management, enhancing patient comfort while enabling more personalized treatment across diverse clinical settings.
Monitoring urea concentrations in blood is essential for determining the adequacy of HD in patients with end-stage renal disease (ESRD). The necessity of frequent hospital visits for the HD treatment, often multiple times per week, significantly diminishes the quality of life of these patients. Home-based HD treatment could improve patients’ quality of life by reducing travel and providing a familiar environment. Additionally, customizing HD treatment to meet individual patient requirements could further optimize their treatment and, consequently, improve their wellbeing. To realize these personalized HD treatments in home settings, there is an urgent clinical need for developing non-invasive alternatives to frequent venipuncture. These alternatives should be capable of remote and continuous monitoring of biomarkers, both during and in intervals between HD sessions.
As a non-invasive biofluid, sweat contains a wide variety of biomarkers, including urea, presenting a promising alternative for assessing blood urea concentration. Although the measurement of urea concentrations in sweat is now achievable (Futane et al., 2023), the clinical consideration of sweat urea concentrations remains limited due to the unclear relationship between urea concentrations in sweat and blood. In previous work of our group and other recent literature, concentrations of urea in sweat are found to be somewhat higher than in plasma (Adelaars et al., 2024; Al-Tamer et al., 1997; Bulmer, 1957), implying that urea might not only diffuse passively over the different compartments. Possible explanations for the higher concentration in sweat include an additional urea source outside plasma like epidermal accumulation of urea (Brusilow, 1967; Gordon et al., 1976), the impact of evaporation on sweat urea concentrations, cleavage of arginine to urea in the sweat gland (Szondi et al., 2021; Baker et al., 2022), and active transport mechanisms via urea transporters in the sweat gland membrane (Xie et al., 2017). To our knowledge, no study has established a method to estimate plasma urea concentrations based on measurements in sweat. Advanced modeling of the urea transport mechanism from plasma to sweat would provide valuable insights into the kinetics of urea and facilitate the clinical interpretation of sweat urea monitoring results.
In a previous study of our group (Yin et al., 2024), we proposed a novel double-loop strategy using a glucose transport model that enables estimations of blood glucose concentrations based on sweat measurements in a personalized manner. It is important to note that this method is specifically designed for glucose monitoring, where the transport mechanism is known to be purely passive. Compared to glucose, urea transport kinetics between blood and sweat are more complex.
Building on the optimization framework introduced in our previous work (Yin et al., 2024), here we propose an innovative method that allows for the estimation of urea in blood using sweat urea concentrations, taking into account the complex kinetic behavior of urea. By incorporating physiological mechanisms into the modeling of urea transport, this approach offers a more robust clinical interpretation of sweat-based urea monitoring. This approach was tested on a population of ESRD patients with a large variation in urea concentrations across HD.
To simulate the mechanism of urea transport from blood to sweat, a pharmacokinetic urea transport model was developed using COMSOL Multiphysics® software (Zoetermeer, Netherlands). This model builds upon the glucose transport model from previous work (Yin et al., 2024), which exclusively considered a passive transport mechanism based on convection and diffusion. The urea transport model is composed by three compartments: the blood capillary, interstitial fluid (ISF), and sweat gland. The overall transport process is summarized in Figure 1.
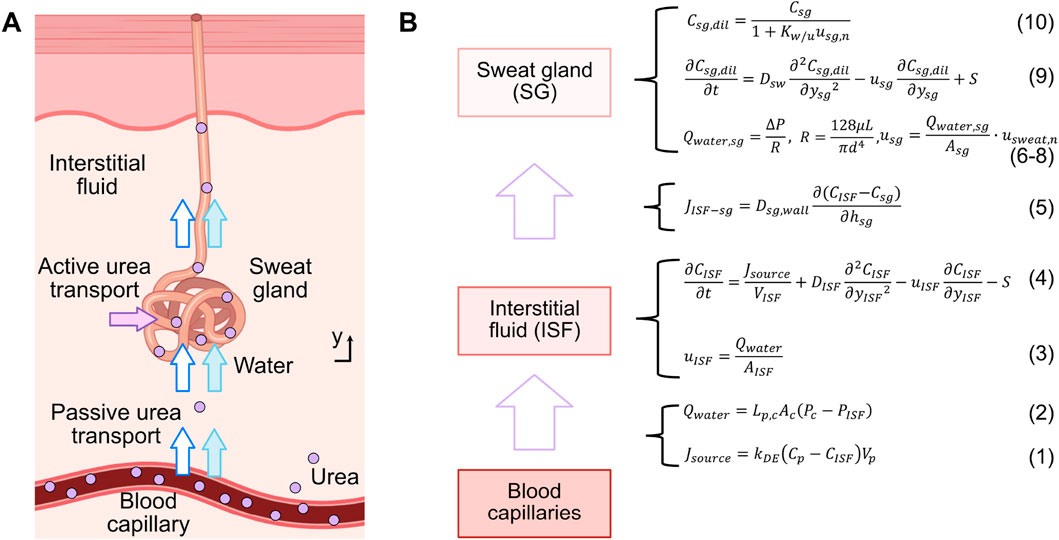
Figure 1. (A) Schematic illustration of the urea transport mechanism from blood to sweat along a single sweat gland, encompassing both passive and active transport. (B) Compartmental model and relevant formulas for urea transport.
Firstly, a flow rate of urea from the blood capillary compartment to the ISF compartment, denoted as
where
At the same time, due to the pressure difference between the blood capillary compartment and the ISF compartment, water flows from the blood capillary into the ISF at a flow rate denoted by
where
The water flow velocity in the ISF compartment,
In the ISF compartment, urea undergoes a joint process of convection and diffusion, and a portion of it is also actively transported out this compartment. This active transport is facilitated by urea transporters located in the following sweat gland compartment (Xie et al., 2017). The transport process can be modeled as shown in Equation (4)
where
Thereafter, due to the concentration gradient between the ISF compartment and sweat gland compartment, urea is passively transported to the sweat gland compartment through diffusion across the gland wall. This process can be quantified by the urea flux
where
Water flows from the ISF compartment into the sweat gland compartment, and then to the skin’s surface, driven by the pressure difference (
where
where
The pressure difference in Equations 2, 6 are closely related, with the interstitial pressure
The water flow velocity in the sweat gland compartment,
where
Simultaneously, a fraction of the urea is actively transported into the sweat gland by urea transporters, which move urea against its concentration gradient (Xie et al., 2017). As water enters the sweat gland, a fraction of it is absorbed by the duct wall, reducing the water content and thereby increasing the concentration of urea. Both the passively- and actively-transported urea flow through the sweat gland to the skin surface. This process can be modeled using the diffusion-convection equation as shown in Equation (9)
where
Due to the dilution effect of water entering the sweat gland and the absorption of a fraction of this water by the duct wall (Schwartz et al., 1953), the original concentration of urea in the sweat gland
Where
As shown in Figure 2, solving the inverse problem by estimating blood urea concentration from sweat urea concentration can be realized using a double-loop optimization strategy, similarly to in our previous work on glucose estimation (Yin et al., 2024). This strategy consists of two intertwined optimization loops: the first loop refines the estimated blood urea concentration
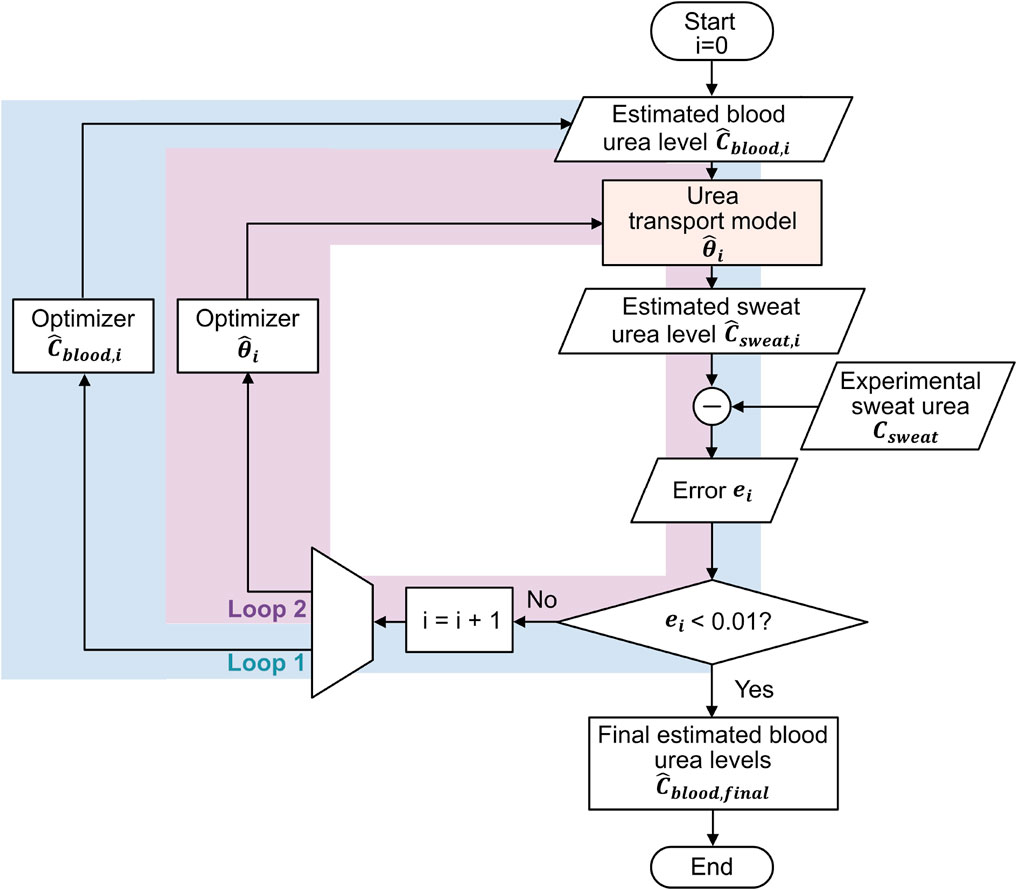
Figure 2. Double-loop optimization flowchart for inverse estimation of blood urea concentrations from sweat urea concentrations: Loop 1 refines the estimated blood urea concentrations, and Loop 2 optimizes the parameter values of the urea transport model, with the two loops alternating sequentially.
The optimization process begins with initializing the blood urea concentration
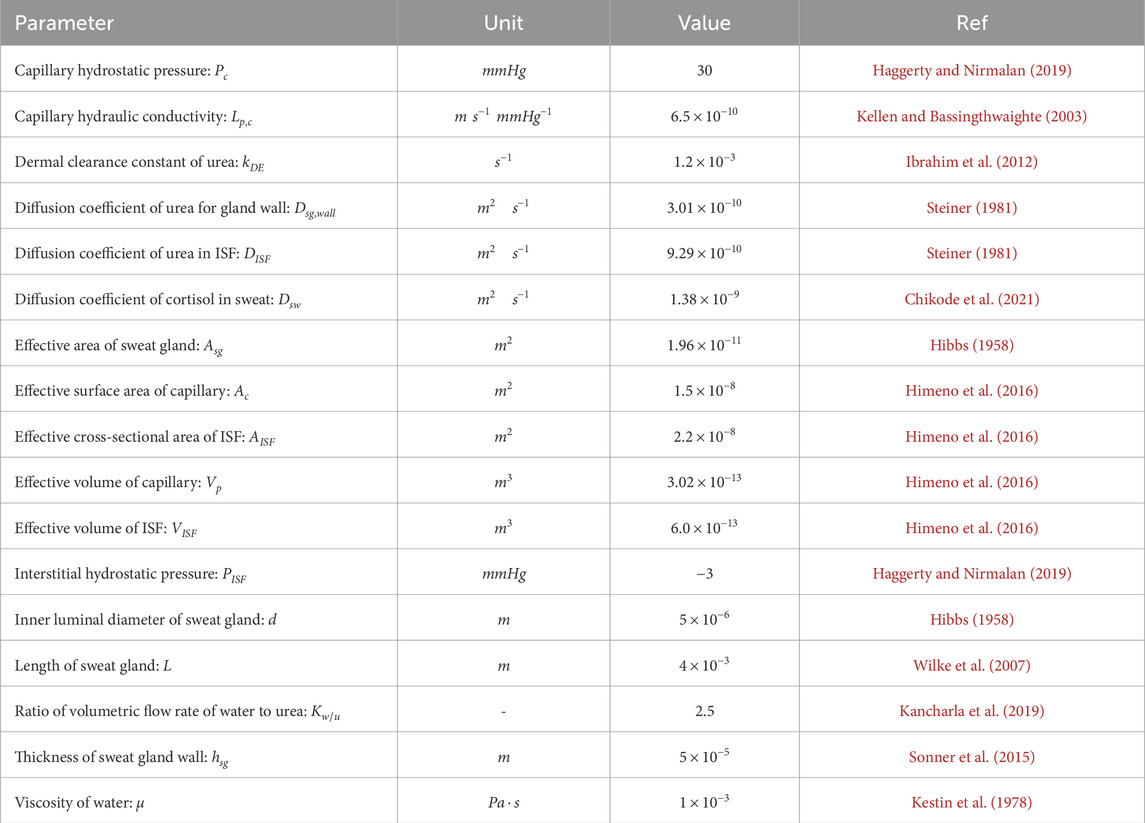
Table 1. Parameters used in the urea transport model.
Using the initialized parameters, we input
where
The optimization process continues until
This developed model was validated with data obtained during the observational clinical trial that is registered in the International Clinical Trials Registry Platform (UMIS Study, ID NL9831). The study was approved by the local ethical review board and the medical research Ethics Committees United (MEC-U), and written informed consent was obtained from each patient before participation. This study was carried out in accordance with the principles of the Declaration of Helsinki (Fortaleza, Brazil, October 2013) and in accordance with Dutch law. In the UMIS study, a total of 40 patients were initially included. At the beginning and end of a single HD cycle, both sweat and blood samples were collected from patients. Sweat samples were gathered from the forearm using the Macroduct Advanced Sweat Collection System (Elitechgroup, Logan, Utah, United States), following the manufacturer’s guidelines. Sweat samples were collected under routine HD conditions, where patients typically remained seated or reclined throughout the procedure. While our protocol specified the general sample collection method, we did not explicitly track or control factors such as recent physical activity or dietary intake prior to sweat collection. However, given that participants remained in a resting state during HD and followed standard pre-dialysis dietary guidelines, we did not consider the potential variability in sweat urea concentration due to these factors within this controlled clinical setting. Concurrently, blood samples were obtained while patients were connected to the HD machine, with dialysis flow temporarily reduced from 300 to 100 mL/min. All collected samples were centrifuged within 2 h after collection and urea concentrations ware determined using a kinetic method by the Cobas Pro analyzer (Roche Diagnostics, Rotkreutz, Switzerland). For further information regarding the acquisition protocol, please refer to the study by Adelaars et al. (2024). In this work, 8 patients were excluded due to the absence of at least one required sweat measurement before and/or after HD. The missing values were attributed to the low volume of collected sweat, which hindered the accurate quantification of urea. Consequently, the study proceeded with 32 patient samples, involving paired sweat and blood urea concentrations collected both before and after HD, to validate the model. Figure 3 illustrates the measured sweat urea versus measured blood urea concentrations. Table 2 presents the baseline characteristics of the 32 included patients.
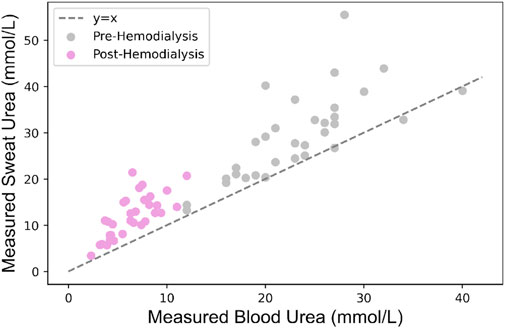
Figure 3. Relationship between measured sweat and blood urea concentrations in patients undergoing HD.
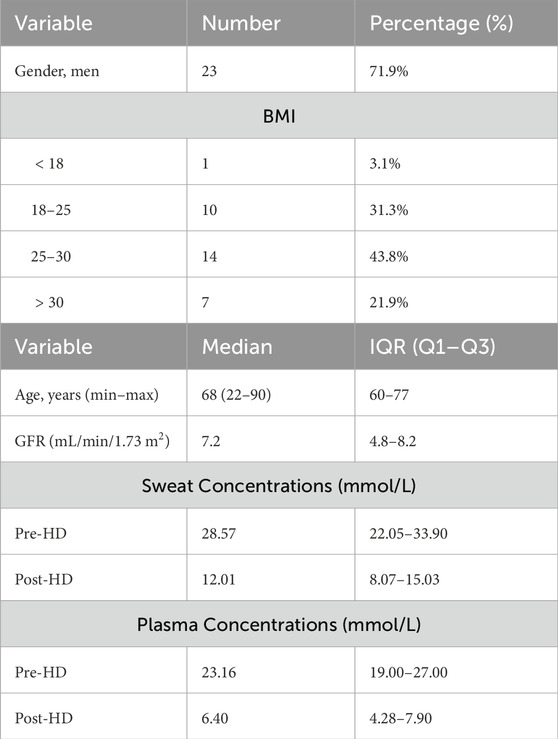
Table 2. Patient characteristics and measured urea concentrations (N = 32): BMI (body mass index), IQR (interquartile range), GFR (glomerular filtration rate).
The accuracy of our estimation strategy was assessed by computing the Root Mean Square Error (RMSE) and Root Mean Square Percentage Error (RMSPE) (Taraji et al., 2017), and determining the Pearson Correlation Coefficient
To evaluate the significance of the urea source term S in the urea transport model, we compared
We conducted a sensitivity analysis to assess the extent to which each parameter of the urea transport model, along with its input
To evaluate the robustness of the double-loop optimization strategy to its initial input, the estimated blood urea concentration
The plasma urea concentrations estimated using our novel approach are presented in Figure 4A, demonstrating a very high correlation coefficient of 0.98, with a RMSE of 2.9
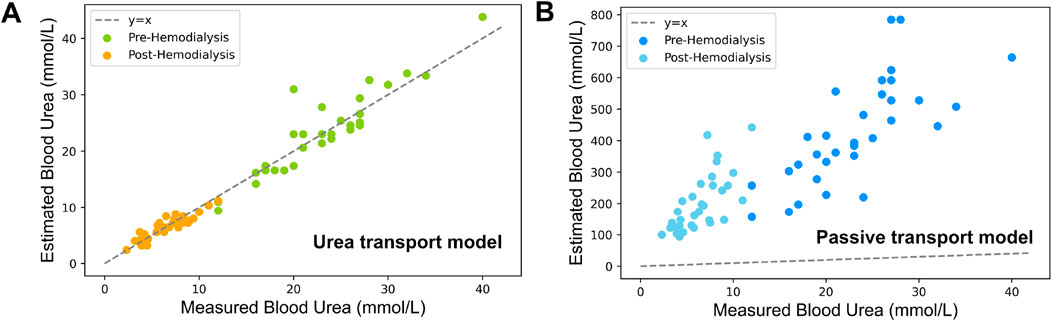
Figure 4. Comparison of estimated vs experimental blood urea concentrations based on measured sweat urea concentrations (A) Estimations using the urea transport model incorporating both passive and active transport (B) Estimations derived solely from passive transport within the same model.
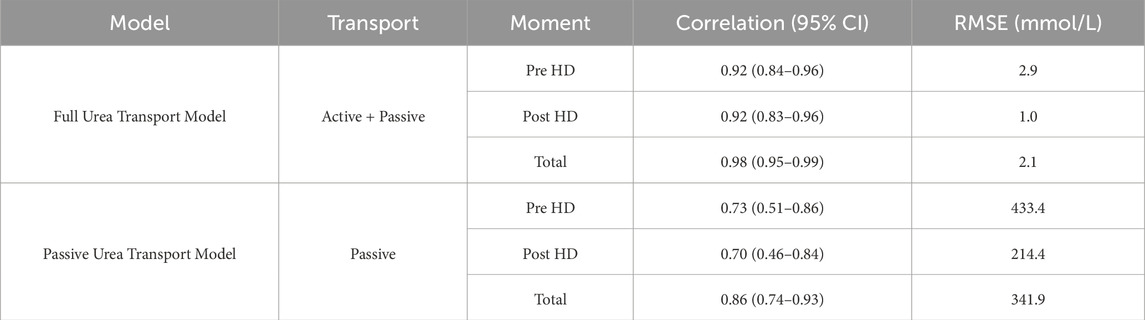
Table 3. Overview of the urea transport models’ performance.
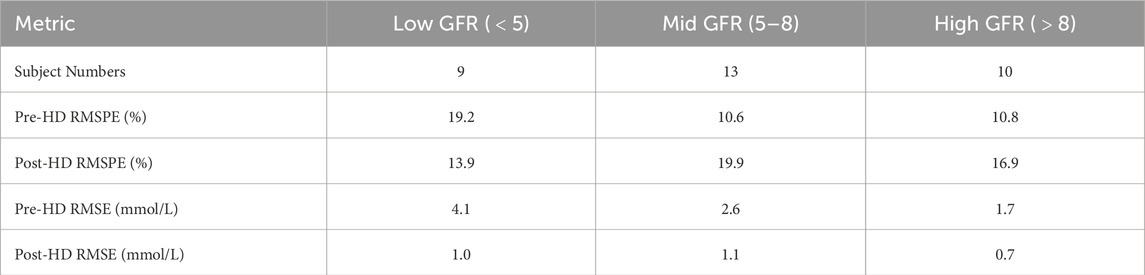
Table 4. Model performance metrics across different GFR groups.
The results of the Bland-Altman analysis are shown in Figure 4, assessing the agreement between estimated and experimentally determined blood urea concentrations for both pre-HD (Figure 5A) and post-HD (Figure 5B) data sets. The mean bias was
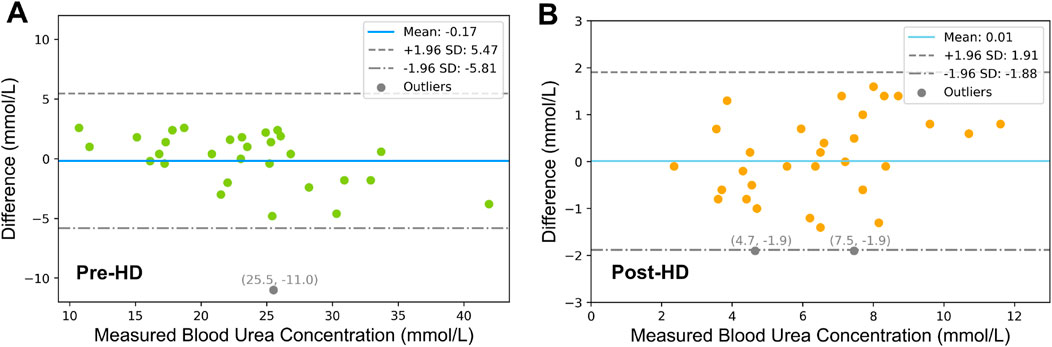
Figure 5. Bland-Altman Analysis of (A) Pre-HD and (B) Post-HD Estimation Results. The dashed lines represent the 95% limits of agreement, which are derived as the mean difference
Figure 6 shows the distribution of estimated values for the urea active transport term S pre- and post-HD. For pre-HD, the median (IQR) value of S is 0.51 (0.11)
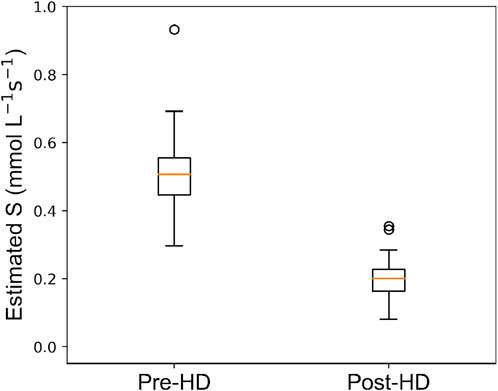
Figure 6. Box plot depicting distribution of estimated urea source
Table 5 displays the results of the sensitivity analysis for the parameter values of the urea transport model, reporting only those model parameters that exhibit a CV higher than 1%. Among all parameters, the diffusion coefficient of urea in sweat
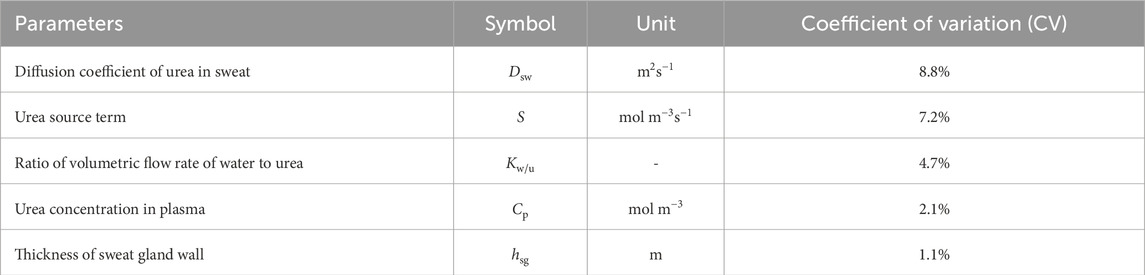
Table 5. Sensitivity analysis of key parameters in the urea transport model.
In this study, we introduced a novel urea transport model to describe the process of urea transport from blood to sweat through a single sweat gland, considering both passive and active transport mechanisms.
The urea concentration before and after HD was accurately estimated by the proposed urea transport model, with an average RMSE of 2.1
Further validation of our urea transport model was performed using Bland-Altman analysis to compare the model estimates with experimental plasma values. The analysis revealed a clinically irrelevant bias of −0.17
Beyond evaluating the accuracy and performance of our model, we also investigated its robustness under varying initial conditions to ensure reliability across a broad spectrum of clinical scenarios. Specifically, the initial value of the model input, i.e., the estimated blood urea concentration
The strategy proposed in this paper introduces an active transport mechanism of urea through the model parameter
The critical role of
When considering a model accounting for passive urea transport only, the results show a significant under performance due to a systematic overestimation of blood urea concentrations. Such an overestimation by the passive urea transport model is attributed to its exclusive reliance on the passive transport mechanisms of diffusion and convection. When these are the sole mechanisms considered, the influx of water into the sweat glands leads to a dilution effect that notably reduces the urea concentrations in sweat, which is responsible for the observed overestimation. Our urea transport model addresses this limitation by incorporating an additional term,
The only existing research focused on estimating plasma urea from sweat urea concentrations was performed by our group using linear regression analysis (Adelaars et al., 2024). Adelaars et al. (2024) indicated an average RMSE and RMSPE of 4.3
Our study demonstrates the efficacy of kinetic modeling in elucidating the dynamics of urea across body fluid and its relationship with plasma concentrations both during and between HD sessions. This methodology could enable more personalized monitoring and management of renal failure patients who are not yet undergoing HD treatment, potentially postponing the clinical need for HD. It also holds promise for extending its application to predict plasma concentrations of other clinically relevant biomarkers using sweat-sensing technology.
Our urea transport model represents an important step towards clinical implementation of sweat-based urea monitoring, which has been hampered by the unclear relationship between urea concentrations in blood and sweat. This advancement could broaden the scope of non-invasive patient monitoring, paving the way for innovative, patient-friendly tools that enhance clinical practice beyond ESRD. Moreover, our proposed method not only estimates blood urea concentrations, but also provides physiologically meaningful model parameters, offering insights for improved diagnosis and decision-making, and contributing to achieving more personalized and effective patient care. Clinically, this modeling framework could be integrated into sweat-sensing devices for home-based urea monitoring, reducing the need for frequent blood draws and enabling more frequent assessments of dialysis adequacy. In home dialysis settings, such non-invasive technology could improve patient comfort and adherence, allowing earlier detection of inadequate dialysis and timely treatment adjustments. This approach may ultimately enhance quality of life for ESRD patients by minimizing hospital visits and personalizing therapy schedules.
With this model, we have taken the initial steps towards enabling the clinical interpretation of sweat urea concentrations, validated with data from 32 patients undergoing HD. However, the study presents some limitations. First, the computational demand of our approach is relatively high. Multiple simulation iterations lead to computation times of approximately 5–10 min per data point, which may hinder its application for real-time monitoring in clinical settings. Future work should focus on developing more efficient algorithms or streamlined simulation techniques to facilitate real-time estimation. Second, the dataset used in this study is relatively small and lacks healthy subjects and patients in the early stages of kidney disease, potentially limiting the generalizability of the model beyond individuals with ESRD. Although the dataset includes diverse demographic and physiological factors, such as sex, age (22–90 years), and BMI (18–30), it does not explicitly categorize factors like concomitant drug use and ethnicity, whose influence on sweat physiology remains unexamined. Findings by Xie et al. (Xie et al., 2017) suggest a decrease in AQP5 expression in uremic patients compared to healthy individuals, indicating that transport mechanisms for urea and water may vary across populations. Moreover, the study was conducted in a relatively controlled clinical setting (HD) and did not systematically assess the impact of demographic and environmental factors, such as temperature and humidity, on model performance. Future studies should validate the model in a broader population, including both healthy individuals and patients at earlier stages of kidney disease, while investigating how demographic and environmental variables may affect model parameters. Additionally, 8 patients were excluded due to insufficient sweat volume for accurate urea quantification. While this represented only 20% of the study cohort, it underscores a potential limitation in real-world applications, particularly for individuals with limited sweat production. However, current research is focusing on the development of microfluidic-based devices for collection of low sweat volumes which should be better investigated in the future to ensure reliable measurements of sweat under various conditions (Moonen et al., 2024). Finally, while this proposed strategy offers promise for non-invasive urea monitoring, its adoption into practice may face certain obstacles. Home-based monitoring devices, while enabling convenient and frequent assessments, can be costly and may be unaffordable for some patients. Besides, integrating these systems into clinical workflows may require staff training and process adjustments. Overcoming these challenges will require affordable device design, simplified workflows, and user-friendly implementation for effective integration into routine care.
Although measuring urea concentrations in sweat has become feasible, research towards the clinical significance of sweat urea remains limited. This study introduces a novel urea transport model that includes both active and passive transport of urea from blood to sweat. By accurately estimating blood urea concentrations from sweat measurements, our model bridges a crucial gap, enabling the translation of sweat urea data into clinical insights. This advancement facilitates the progression toward remote, non-invasive urea monitoring in patients with ESRD using sweat-sensing technology.
The original contributions presented in the study are included in the article/supplementary material, further inquiries can be directed to the corresponding author.
The studies involving humans were approved by local ethical review board and the medical research Ethics Committees United (MEC-U). The studies were conducted in accordance with the local legislation and institutional requirements. The participants provided their written informed consent to participate in this study.
XY: Conceptualization, Methodology, Validation, Visualization, Writing–original draft, Writing–review and editing. SA: Conceptualization, Data curation, Writing–original draft, Writing–review and editing. ElP: Supervision, Writing–original draft, Writing–review and editing. EdP: Project administration, Supervision, Writing–original draft, Writing–review and editing. JD: Funding acquisition, Writing–original draft, Writing–review and editing. AB: Writing–original draft, Writing–review and editing. DV: Supervision, Writing–original draft, Writing–review and editing. MM: Funding acquisition, Supervision, Writing–original draft, Writing–review and editing.
The author(s) declare that financial support was received for the research, authorship, and/or publication of this article. This work was supported in part by the Dutch Research Council (NWO) under Grant SEDAS 18271. The clinical trial was funded by the Catharina Research Fund (2021-3) and Penta program (project 19017).
The authors declare that the research was conducted in the absence of any commercial or financial relationships that could be construed as a potential conflict of interest.
The author(s) declare that no Generative AI was used in the creation of this manuscript.
All claims expressed in this article are solely those of the authors and do not necessarily represent those of their affiliated organizations, or those of the publisher, the editors and the reviewers. Any product that may be evaluated in this article, or claim that may be made by its manufacturer, is not guaranteed or endorsed by the publisher.
Adelaars S., Konings C. J., Cox L., Boonen E., Mischi M., Bouwman R. A., et al. (2024). The correlation of urea and creatinine concentrations in sweat and saliva with plasma during hemodialysis: an observational cohort study. Clin. Chem. Laboratory Med. (CCLM) 62, 1118–1125. doi:10.1515/cclm-2023-1285
Al-Tamer Y. Y., Hadi E. A., al-Badrani I. I. (1997). Sweat urea, uric acid and creatinine concentrations in uraemic patients. Urological Res. 25, 337–340. doi:10.1007/BF01294662
Baker L. B. (2019). Physiology of sweat gland function: The roles of sweating and sweat composition in human health. Temperature 6, 211–259. doi:10.1080/23328940.2019.1632145
Baker L. B., Engel M. D., et al. (2022). Sweat biomarkers for sports science applications. Sports Sci. Exch. 35, 1–9.
Brusilow S. W. (1967). Evidence for a non-plasma source of urea in sweat. Nature 214, 506. doi:10.1038/214506a0
Bulmer M. G. (1957). The concentration of urea in thermal sweat. J. Physiology 137, 261–266. doi:10.1113/jphysiol.1957.sp005810
Chikode P. P., Sabale S. R., Vhatkar R. S., Fulari V. J. (2021). Determination of the diffusion coefficient of urea solution using double exposure digital holographic interferometry (dedhi) to study plant growth. Opt. Spectrosc. 129, 303–308. doi:10.1134/s0030400x2103005x
Futane A., Senthil M., S J., Srinivasan A., R K., Narayanamurthy V. (2023). Sweat analysis for urea sensing: trends and challenges. Anal. Methods 15, 4405–4426. doi:10.1039/d3ay01089a
Gordon R. S., Thompson R. H., Thrasher D., Benson J. W. (1976). Genesis of the sweat: plasma urea concentration gradient. J. Investigative Dermatology 66, 218–221. doi:10.1111/1523-1747.ep12482142
Haggerty A., Nirmalan M. (2019). Capillary dynamics, interstitial fluid and the lymphatic system. Anaesth. Intensive Care Med. 20, 182–189. doi:10.1016/j.mpaic.2019.01.009
Hibbs R. G. (1958). The fine structure of human exocrine sweat glands. Am. J. Anat. 103, 201–217. doi:10.1002/aja.1001030204
Himeno Y., Ikebuchi M., Maeda A., Noma A., Amano A. (2016). Mechanisms underlying the volume regulation of interstitial fluid by capillaries: a simulation study. Integr. Med. Res. 5, 11–21. doi:10.1016/j.imr.2015.12.006
Ibrahim R., Nitsche J. M., Kasting G. B. (2012). Dermal clearance model for epidermal bioavailability calculations. Rev. Chem. Eng. 101, 2094–2108. doi:10.1002/jps.23106
Inoue R., Sohara E., Rai T., Satoh T., Yokozeki H., Sasaki S., et al. (2013). Immunolocalization and translocation of aquaporin-5 water channel in sweat glands. J. Dermatological Sci. 70, 26–33. doi:10.1016/j.jdermsci.2013.01.013
Kancharla S., Canales E., Alexandridis P. (2019). Perfluorooctanoate in aqueous urea solutions: micelle formation, structure, and microenvironment. IJMS 20, 5761. doi:10.3390/ijms20225761
Kellen M. R., Bassingthwaighte J. B. (2003). Transient transcapillary exchange of water driven by osmotic forces in the heart. Am. J. Physiology-Heart Circulatory Physiology 285, H1317–H1331. doi:10.1152/ajpheart.00587.2002
Kestin J., Sokolov M., Wakeham W. A. (1978). Viscosity of liquid water in the range 8 °c to 150 °c. J. Phys. Chem. Ref. Data 7, 941–948. doi:10.1063/1.555581
Krishnamoorthy K., Lee M. (2014). Improved tests for the equality of normal coefficients of variation. Comput. Stat. 29, 215–232. doi:10.1007/s00180-013-0445-2
Moonen E. J. M., Verberne W., Pelssers E., Heikenfeld J., den Toonder J. M. J. (2024). Discretised microfluidics for noninvasive health monitoring using sweat sensing. Lab a Chip 24, 5304–5317. doi:10.1039/d4lc00763h
Nejsum L. N., Kwon T.-H., Jensen U. B., Fumagalli O., Frøkiaer J., Krane C. M., et al. (2002). Functional requirement of aquaporin-5 in plasma membranes of sweat glands. Proc. Natl. Acad. Sci. U.S.A. 99, 511–516. doi:10.1073/pnas.012588099
Nie S., Zhang C., Song J. (2018). Thermal management of epidermal electronic devices/skin system considering insensible sweating. Sci. Rep. 8, 14121. doi:10.1038/s41598-018-32152-4
Schmidt M. D., Notley S. R., Meade R. D., Akerman A. P., Rutherford M. M., Kenny G. P. (2022). Revisiting regional variation in the age-related reduction in sweat rate during passive heat stress. Physiol. Rep. 10, e15250. doi:10.14814/phy2.15250
Schulz I. J. (1969). Micropuncture studies of the sweat formation in cystic fibrosis patients. J. Clin. Invest 48, 1470–1477. doi:10.1172/JCI106113
Schwartz I. L., Thaysen J. H., Dole V. P. (1953). Urea excretion in human sweat as a tracer for movement of water within the secreting gland. J. Exp. Med. 97, 429–437. doi:10.1084/jem.97.3.429
Sonner Z., Wilder E., Heikenfeld J., Kasting G., Beyette F., Swaile D., et al. (2015). The microfluidics of the eccrine sweat gland, including biomarker partitioning, transport, and biosensing implications. Biomicrofluidics 9, 031301. doi:10.1063/1.4921039
Steiner C. A. (1981). Mass transfer of urea through blood. Ann. Biomed. Eng. 9, 217–225. doi:10.1007/BF02363456
Szondi D. C., Wong J. K., Vardy L. A., Cruickshank S. M. (2021). Arginase signalling as a key player in chronic wound pathophysiology and healing. Front. Mol. Biosci. 8, 773866. doi:10.3389/fmolb.2021.773866
Taraji M., Haddad P. R., Amos R. I., Talebi M., Szucs R., Dolan J. W., et al. (2017). Error measures in quantitative structure-retention relationships studies. J. Chromatogr. A 1524, 298–302. doi:10.1016/j.chroma.2017.09.050
Taylor N. A., Machado-Moreira C. A. (2013). Regional variations in transepidermal water loss, eccrine sweat gland density, sweat secretion rates and electrolyte composition in resting and exercising humans. Extrem Physiol. Med. 2 (4), 4. doi:10.1186/2046-7648-2-4
Wilke K., Martin A., Terstegen L., Biel S. S. (2007). A short history of sweat gland biology. Intern J Cosmet. Sci 29, 169–179. doi:10.1111/j.1467-2494.2007.00387.x
Xie L., Jin L., Feng J., Lv J. (2017). The expression of aqp5 and uts in the sweat glands of uremic patients. BioMed Res. Int. 2017, 8629783–8629810. doi:10.1155/2017/8629783
Keywords: kidney failure, end-stage renal disease, patient monitoring, pharmacokinetic modeling, inverse modeling
Citation: Yin X, Adelaars S, Peri E, Pelssers E, Den Toonder J, Bouwman A, Van de Kerkhof D and Mischi M (2025) A novel kinetic model estimating the urea concentration in plasma during non-invasive sweat-based monitoring in hemodialysis. Front. Physiol. 16:1547117. doi: 10.3389/fphys.2025.1547117
Received: 17 December 2024; Accepted: 03 March 2025;
Published: 18 March 2025.
Edited by:
Christian Baumgartner, Graz University of Technology, AustriaReviewed by:
Xiaomei Liu, Children’s National Hospital, United StatesCopyright © 2025 Yin, Adelaars, Peri, Pelssers, Den Toonder, Bouwman, Van de Kerkhof and Mischi. This is an open-access article distributed under the terms of the Creative Commons Attribution License (CC BY). The use, distribution or reproduction in other forums is permitted, provided the original author(s) and the copyright owner(s) are credited and that the original publication in this journal is cited, in accordance with accepted academic practice. No use, distribution or reproduction is permitted which does not comply with these terms.
*Correspondence: Xiaoyu Yin, eC55aW5AdHVlLm5s
†These authors have contributed equally to this work
Disclaimer: All claims expressed in this article are solely those of the authors and do not necessarily represent those of their affiliated organizations, or those of the publisher, the editors and the reviewers. Any product that may be evaluated in this article or claim that may be made by its manufacturer is not guaranteed or endorsed by the publisher.
Research integrity at Frontiers
Learn more about the work of our research integrity team to safeguard the quality of each article we publish.