 Jinghui Pan
 Fengjiao Zhuo3
 Xiangpan Li
 Qibin Song
 Jinsheng Xiao
94% of researchers rate our articles as excellent or good
Learn more about the work of our research integrity team to safeguard the quality of each article we publish.
Find out more
ORIGINAL RESEARCH article
Front. Phys. , 06 March 2025
Sec. Medical Physics and Imaging
Volume 13 - 2025 | https://doi.org/10.3389/fphy.2025.1490650
Background and objective(s): This study evaluates the accuracy of automatic segmentation of Organs at Risk (OARs) in nasopharyngeal carcinoma (NPC) using three approaches: atlas-based, 2D U-Net, and a self-developed Trident network. Our aim was to develop, validate, and compare the performance of Trident network for precise delineation of NPC using our center’s dataset, in comparison to conventional atlas-based and 2D U-Net techniques.
Materials and methods: We randomly selected 209 patients with NPC for this retrospective study, with OARs manually delineated by physicians. An atlas template library was generated using data from seventeen OARs obtained from a subset of these patients, while the remaining 29 cases constituted the test set. The performance of auto-delineation methods, including Atlas, 2D U-Net, and the Trident Network, was compared to manual delineations. Accuracy was evaluated using the Dice Similarity Coefficient (DSC) and Hausdorff Distance (HD), alongside timing each method. Statistical analysis included one-way ANOVA for normally distributed data, Welch’s test for data with uneven variance, and Post Hoc Comparison tests [Least Significant Difference (LSD) and Tamhane’s T2] for pairwise comparisons. The Kruskal-Wallis H test was employed for non-normally distributed data.
Results: In the evaluation of segmentation results for all 23 OARs in NPC, the Trident Network achieved the highest DSC (0.87 ± 0.07), significantly outperforming the Atlas (0.67 ± 0.02) and 2D U-Net (0.71 ± 0.02). Additionally, the mean HD values for all the three methods were below 5 mm. In particular, with the exception of the right eyeball, the Trident network demonstrated superior DSC for each organ compared to the other two methods. The Trident Network showed high morphological similarity from Atlas and 2D U-Net in most structures, performing significantly better than Atlas for multiple structures such as the Hypophysis, Optic chiasma, Esophagus, and others. Furthermore, it showed better performance than the 2D U-Net in several structures, including the optic chiasma, optic nerve, and larynx. Conversely, the 2D U-Net excelled over Atlas in structures like Brainstem and Lens.
Conclusion: The Trident Network demonstrates superior morphological and geometric accuracy compared to Atlas and 2D U-Net in the delineation of OARs in nasopharyngeal carcinoma, significantly reducing the need for manual corrections and improving delineation efficiency.
Nasopharyngeal carcinoma (NPC), a prevalent malignant tumor in head and neck regions of China, is characterized by its complex anatomical location, unique peripheral lymphatic drainage patterns, and its predominant presentation as poorly differentiated squamous cell carcinoma. Established and effective radical treatments for NPC include radiotherapy and comprehensive therapeutic approaches centered around radiotherapy [1]. The implementation of Intensity Modulated Radiation Therapy (IMRT) has significantly improved local control rates and overall survival in NPC patients [2]. Accurate demarcation of the clinical target volume (CTV) and Organs at Risk (OARs) is essential for ensuring treatment efficacy. Currently, radiotherapists manually outline CTV and OARs based on multi-modal imaging data [3], but the precision of this method depends on the radiotherapist’s expertise, image quality, and is both time-consuming and labor-intensive. Research indicates significant variations in planning target volume (PTV) and OARs delineation among clinicians from different medical centers [4]. Incorporating, automation alongside manual delineation can help reduce these discrepancies. As a result, rapid and accurate automated outlining tools have become vital components of adaptive radiotherapy workflows. Current methodologies for medical image segmentation include thresholding [5], regional growing, deformation techniques [6], fuzzy clustering segmentation [7], and deep learning neural network segmentation [8]. Standard automatic segmentation software commonly utilizes atlas-based approaches or convolutional neural networks [9, 10].
Atlas-based segmentation, which employs one or more representative patients to create a reference atlas database, is considered resource-efficient. However, it has several limitations. These include variability in atlas selection strategies [11], performance stagnation, suboptimal accuracy in delineating small and low-contrast soft tissues, and increased computational time with the addition of each new atlas [12–14]. Multi-atlas databases can be combined using fusion algorithms to minimize structural inconsistencies [15], and hybrid models integrating multi-atlas approaches with machine-learning features have been developed [16–20]. Although multi-atlas strategies generally require longer computational times, they consistently outperform single-atlas methods.
Deep learning-based segmentation methods employ convolutional neural networks (CNNs) trained on labeled medical datasets. These models, once trained, provide rapid segmentation but may underperform when segmenting smaller organs or those with low image contrast. To enhance segmentation accuracy, various network architectures have been developed, including nn-UNet, AnatomyNet, and Ua-net, each offering specific features and functionalities [21–24]. For small objects, approaches such as the feature pyramid composite neural network structure and LSTFE-NET have been introduced [25, 26]. Notably, WBNet [21] has demonstrated superior performance compared to both the multi-atlas model and other deep learning methods for the segmentation of most organs. Other studies have also demonstrated the significant potential of convolutional neural networks (CNNs) in both classification and segmentation tasks. For example, Iqbal et al. proposed an advanced multi-class classification model for skin lesions using dermoscopic images, achieving high accuracy and surpassing state-of-the-art methods [27]. This study highlights the effectiveness of CNNs in feature extraction and classification. Similarly, another study by Iqbal et al. utilized transfer learning for the automated detection of human knee synovial fluid from magnetic resonance images, achieving robust performance even with limited training data [28]. These studies underscore the versatility of deep learning techniques in medical imaging and serve as inspiration for developing advanced segmentation and classification methods to address complex challenges.
This study comprehensively evaluates the efficacy, precision, robustness, and applicability of the proprietary Trident Network in comparison to Atlas and 2D U-Net for segmenting OARs in NPC. The results highlight its distinct advantages in processing small-sample datasets and accurately delineating small-volume structures.
We randomly selected a retrospective cohort of 209 patients diagnosed with nasopharyngeal carcinoma at the Radiation Oncology Center of Renmin Hospital of Wuhan University between 2019 and 2021. This group included 150 males and 59 females, with a median age of 55 years. During the scanning procedure, patients were positioned supine and immobilized from the skull to the clavicle, with their arms resting naturally at their sides. Scanning wasperformed under relaxed breathing conditions using a GE large-aperture CT scanner. The slice thickness was set to 2.5 mm, and the scanning range extended from the cranial apex to the tracheal bifurcation, including localized contrast-enhanced scans for comprehensive coverage.
The acquired CT images were imported into the MIM Atlas software and fused with magnetic resonance imaging (MRI) to enhance tumor boundariy visualization [29]. Subsequently, the images were manually delineated by physicians following international standard consensus guidelines [30]. The manually outlined data included 23 organs at risk, which comprising the left and right lenses, left and right eyeballs, left and right optic nerves, optic chiasma, pituitary, brain stem, spinal cord, temporal lobes, left and right parotid glands, left and right inner ears, left and right temporomandibular joints, mandible, oral cavity, throat, trachea, thyroid, and esophagus.
Following the delineation process, the image slice data and organ labels of the 209 patients can be utilized as a dataset for training deep learning models. Since Dicom-format image data cannot be directly used for model training, Python scripts are used to convert and preprocess the data into nii. gz format. Each organ label is stored as a separate file, and the slice data for each patient, along with all organ label data, is organized in a single folder, forming a complete training dataset. The dataset can be patitioned into training and testing sets based on a certain ratio. The training set is fed into the network model for training. Once the model reaches a satisfactory training level, the testing set is used to evaluate its performance. If the testing results are satisfactory, the entire model is saved.
During training, the data is sequentially read, normalized to constrain its range within specific limits, and subsequently segmented and sliced. Multiple slices of a patient’s image data are grouped into a segment, with each slice further divided into smaller sub-slices. This approach enhances the network model’s ability to learn comprehensively while simultaneously reducing the data volume for each network iteration, thereby preventing memory overflow issues.
In this study, we utilized MIM Maestro 7.0.5 software, released by MIM Software Inc., USA. The software features an automatic delineation function that uses a CT image database to construct an atlas database and identifies the most suitable match for the target case image. The process involves density-based registration of the template and target case images, followed by deformation registration to map the OARs onto the target case images. MIM Maestro 7.0.5 independently searches for the best registration cases and performs deformation fusion. For this study, we configured the atlas library’s running parameters to select five optimal matches, with the superposition mode set to STAPLE. The workflow is illustrated in Figure 1.
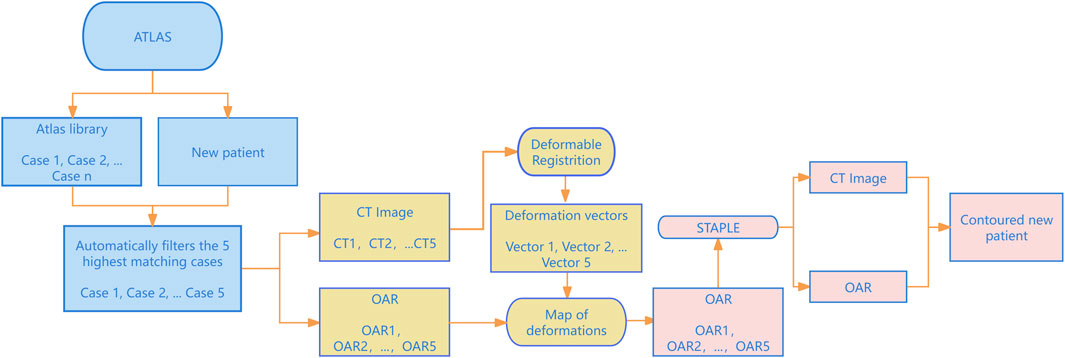
Figure 1. Automated delineation process based on MIM’s atlas database.
This study introduces a Trident network model for the automatic delineation of target areas and organs at risk in nasopharyngeal cancer. The model requires only a small amount of patient data and corresponding standards to train the neural network, which subsequently performs automatic delineation of the target areas and OARs for individual patient. This approach offers several advantages, including high accuracy, strong robustness, broad applicability, and minimal reliance on labeled samples.
The automatic delineation algorithm utilizes the Unet-3D convolutional neural network, employing a Unet composite network structure to achieve global coarse localization and local precise segmentation of target areas and OARs. The network consists of three main branches: input branch A, responsible for feature encoding by extracting features from the input images; and output branches B and C, which handle coarse localization and fine segmentation of target areas and OARs, respectively. To optimize image feature extraction, the study integrates two-dimensional convolution with three-dimensional convolution encoding to capture intra-layer features of tomographic images and facilitate inter-layer feature fusion, thereby enhancing feature extraction and fusion capabilities. Additionally, meta-learning techniques are employed to train optimal model weights for whole-body OARs, incorporating them into the target area and OAR delineation process to effectively utilize a limited number of labeled samples for training. A Transformer module is introduced for global feature decoding and fusion, enabing global coarse localization of the target area. Finally, a domain transfer Generative Adversarial Network (GAN) is utilized to enhance the model’s generalization across different data styles and qualities, improving its cross-domain feature learning capabilities.
Figure 2 illustrates the architecture of the Trident network. Initially, the 3D image data is processed by encoding branch A, where 2D and 3D convolutions are employed to extract intra-layer features and fuse inter-layer features. The Trident network uniquely integrates long-range global features with short-range local features, effectively merging the former into the latter within the short-range branches [31]. Skip connections facilitate this integration by linking features across layers, enabling efficient and rapid processing and extraction, thereby simplifying the encoding and learning processes. This approach significantly enhances the efficiency of data feature utilization. The network then processes the extracted, fused, and encoded image features as input. Finally, the position information of the target area acquired from branch B is forwarded to decoding branch C for fine segmentation. By leveraging the position information of the target area, branch C captures and meticulously analyzes the key features input from branch A, thereby achieving precise segmentation.
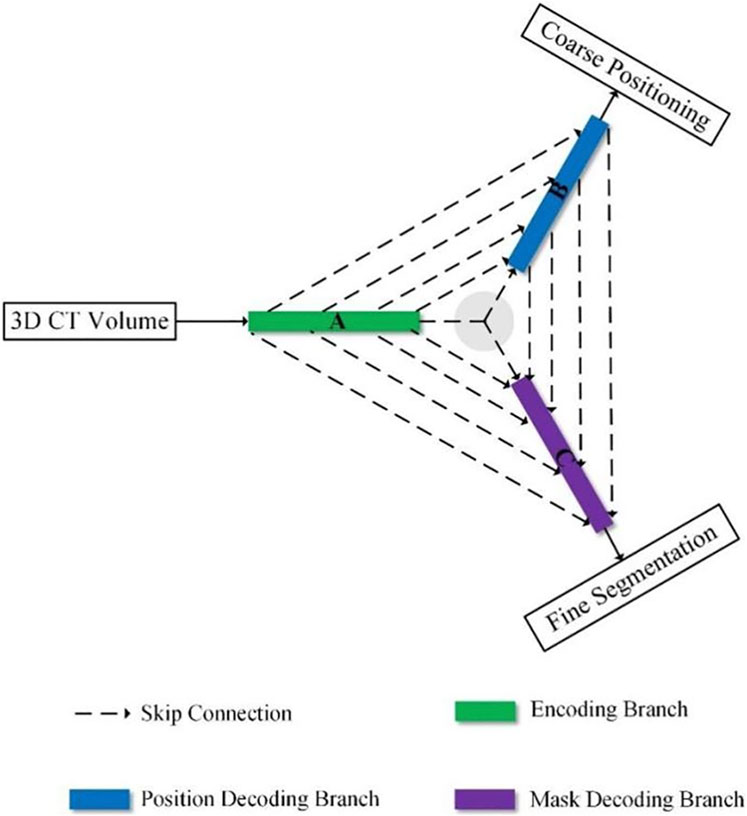
Figure 2. Trident network architecture diagram.
To improve the segmentation accuracy of target organs, particularly those with smaller sizes or complex boundaries, a multi-loss combination method is employed. This approach integrates the cross-entropy loss function, 3D Dice loss function, Lovasz loss function, and boundary loss function [32]. These complementary loss functions collectively guide the segmentation process by accounting for factors such as organ boundaries, shape, size, density, and other pertinent features, aiming to achieve optimal segmentation outcomes. The formulas for these Equations 1, 2 are shown as follows:
The dual-path network structure comprises a temporal path and a spatial path, each taking three adjacent temporal and spatial slices, respectively, as inputs. The bottom layer of the encoding path integrates a feature fusion module to combine temporal and spatial features.
Compared to traditional medical imaging segmentation models, the Trident model offers several distinct advantages. First, input branch A serves as the feature encoding branch, extracting prominent features from the input images. Output branch B focuses on the coarse localization of target areas and organ at risks, while output branch C performs detailed segmentation. This two-step segmentation strategy is better suited for achieving precise model segmentation results, compared to traditional single-step medical segmentation models. Second, the algorithm integrates both two-dimensional and 3D convolutional enables intra-layer feature extraction and inter-layer feature fusion, significantly improving the model’s information extraction and learning capabilities. Third, optimal model weights for whole-body OARs are developed using meta-learning methods and applied to target areas and organs. This approach effectively operates with a limited number of labeled samples, offering a significant advantages over traditional segmentation models that require large datasets for training. Fourth, the algorithm employs a Transformer module for global feature decoding and fusion, enabling global coarse localization of target areas. Lastly, it incorporates a domain transfer adversarial Generative Adversarial Network (GAN), which improves the model’s generalization capability across different data styles and qualities, further strengthening its cross-domain feature learning capabilities.
Figure 3 illustrates the Multi-Input Mask Attention 3D U-Net architecture. This network, derived from the 2D U-Net framework, incorporates substantial improvements for coarse positioning and fine segmentation, thus earning its designation as the Multi-Input Mask Attention 3D U-Net. The model consists of three primary components: the encoder module, the Mask Attention module, and the decoder module, each of which is detailed in the following sections.
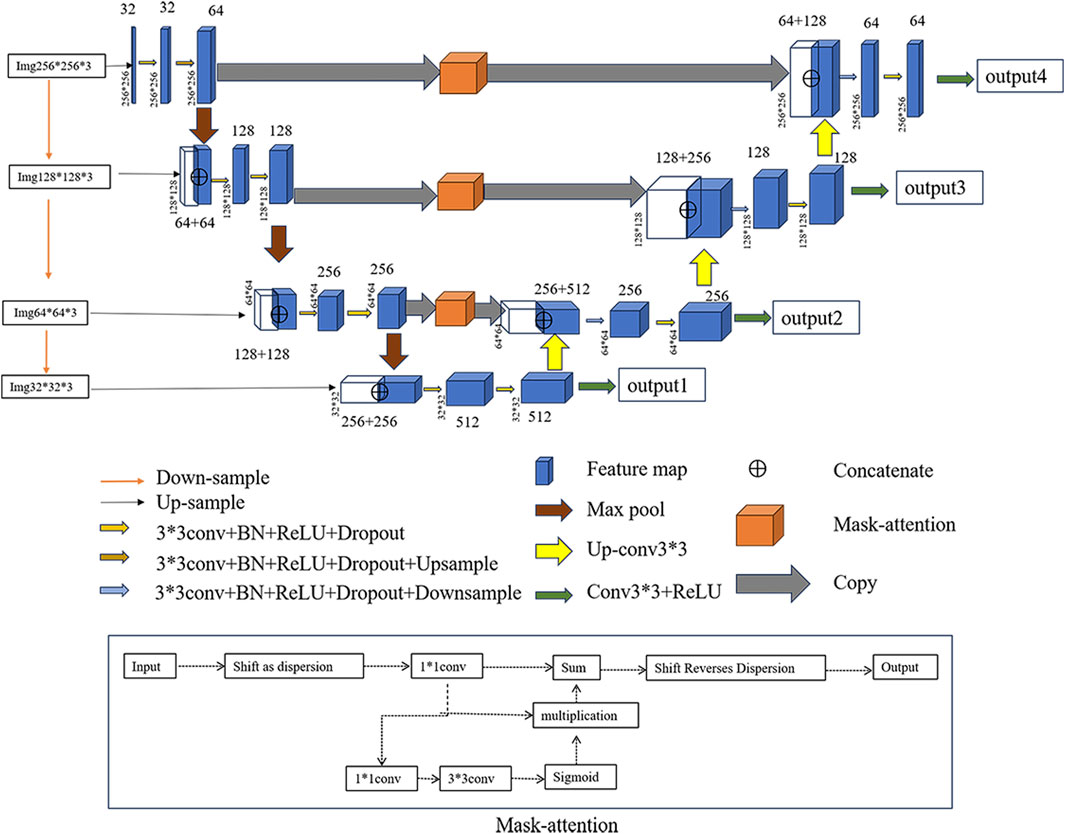
Figure 3. Multi input mask attention 3D U-Net diagram.
The encoder module, located in the left section of the model, plays a critical role in extracting features from images. It comprises four sequential encoder modules that process images of varying dimensions sequentially, enabling comprehensive feature extraction while minimizing feature loss. Images are resized to multiple scales before being fed into individual encoder layers. Each layer employs 3D convolutions, downsampling, dropout operations, and concatenation of two inputs. This architecture facilitates the integration of multi-scale feature information in a hierarchical manner.
In the middle section, the Mask Attention module, equipped with a single input and output channel, processes outputs from various encoders and forwards them to the corresponding decoder blocks. This module enhances the model’s ability to focus on critical feature information by applying operations such as shifting, convolution, multiplication, and addition. The shift operation, in particular, enables the network to prioritize present and past information, minimizing the influence of future data on the current state. The precise mask positioning provided by this module significantly improves the accuracy of the decoder’s output.
The right section of the model contains the decoder module, which is responsible for feature fusion and generating the final output. Each block in this module incorporates 3D convolutions, upsampling, dropout operations, and the concatenation of inputs from two distinct sources. This design ensures effective integration of multi-scale hierarchical feature information. Upsampling converts low-resolution images with high-level abstract features into high-resolution outputs while preserving the quality of the abstract features. Furthermore, each decoder layer isolates outputs for loss computation and backpropagation, enhancing fitting accuracy, accelerates network training, and improving model performance through multi-scale feature mapping.
The model presents several significant advantages. First, the introduction of the Mask Attention module enables precise routing of encoder outputs to their corresponding decoder modules, marking a departure from conventional U-Net methodologies. Second, the model accommodates images of varying dimensions, facilitating multi-scale inputs that distinctly enhance feature representation compared to traditional approaches. Third, it provides outputs at each layer, thereby creating a layered hierarchical representation of features. Additionally, the integration of concatenation connections across different hierarchical levels enhances feature fusion, further distinguishing this model from conventional designs. Lastly, the incorporation of advanced multi-scale feature mapping, enriches feature representation through additional outputs and improved loss propagation mechanisms. Collectively, these innovations enhance the model’s capacity to capture and represent complex image features, setting it apart from traditional U-Net architectures.
Thirty cases were randomly selected from 209 NPC patients and imported into MIM Atlas software to establish a case database. The remaining 29 cases used as test subjects. For these test cases, Atlas, 2D U-Net, and the Trident Network were employed to automatically delineate the organs at risk. The accuracy of these three automated delineation methods was quantitatively evaluated based on morphological similarity and geometric deviation.
Using the manually delineated outlines of OARs by physicians as the gold standard, a range of metrics were employed to evaluate the accuracy of the automatic contours generated by Atlas, 2D U-Net, and the Trident Network. These metrics included the DSC [33], Sensitivity Index (SI), Inclusiveness Index (IncI), Jaccard Index (JAC), Hausdorff Distance (HD) [34], and volume differences.
The Dice Similarity Coefficient (DSC) is employed to quantify the overlap between automatically and manually delineated contours. The DSC value ranges from 0 to 1, with values closer to 1 indicating a higher degree of similarity between the two structures. According to the literature, a DSC greater than 0.7 represents satisfactory contour overlap [35, 36].
The definition formula is shown in Equation 3:
In the formula, VA represents the set of voxels within the automatically delineated contour, while VM denotes the set of voxels within the manually delineated contour.
The Sensitivity Index (SI) measures the ratio of the intersection volume between the automatic and manual contours to the volume of the manual contour. SI values range from 0 to 1, with an SI value of 1 indicating that the manually delineated contour fully encompasses the automatically delineated contour. The defining formula is shown in Equation 4:
The Inclusiveness Index (IncI) represents the ratio of the intersection volume between the automatic volume and manual contours to the volume of the automatic contours. IncI value range from 0 to 1, with an IncI value of 1 indicating that the manual outline is fully encompassed within the automatically delineated contour. The formula is shown in Equation 5:
To measure the similarity and difference between automatic and manual contour, a parameter defined by Equation 6 is employed:
Where 0≤JAC≤1, the closer the JAC value is to 1, the higher the similarity between automatic and manual contours.
HD represents the maximum distance between the outer contour of the two structures. The smaller the value, the smaller the geometric difference between the two structures. The formula is shown in Equation 7:
Where ||a-b|| represents the Euclidean distance from point a to point b, A and B are two structures, and a and b are the points on the boundary of structures A and B, respectively.
VD refers to the percentage of the manual delineated volume. The closer the value is to 0, the better, the definition formula is shown in Equation 8:
For statistical analysis, SPSS 20.0 software was used. Depending on the normality of the distribution of results between the two groups, either a paired sample one-way ANOVA test or the Kruskal-Wallis H test was applied. Parameter values are reported as mean ± standard deviation. A difference was considered statistically significant at P < 0.05.
CT images from the same case were manually delineated, while OARs were automatically delineated using the 2D U-Net, Trident Network, and Atlas methods, as illustrated in Figure 4. Most OARs achieved favorable results with all types of automatic contouring software, with the generated contours closely approximating the manual delineations. The contours produced by the Trident Network demonstrated greater smoothness compared to those generated by Atlas. However, the clinical application of most automatically delineated OARs still requires subsequent manual modification. Nonetheless, these tools significantly reduce the time needed for the manual delineation of target volumes and OARs, highlighting their clinical utility.
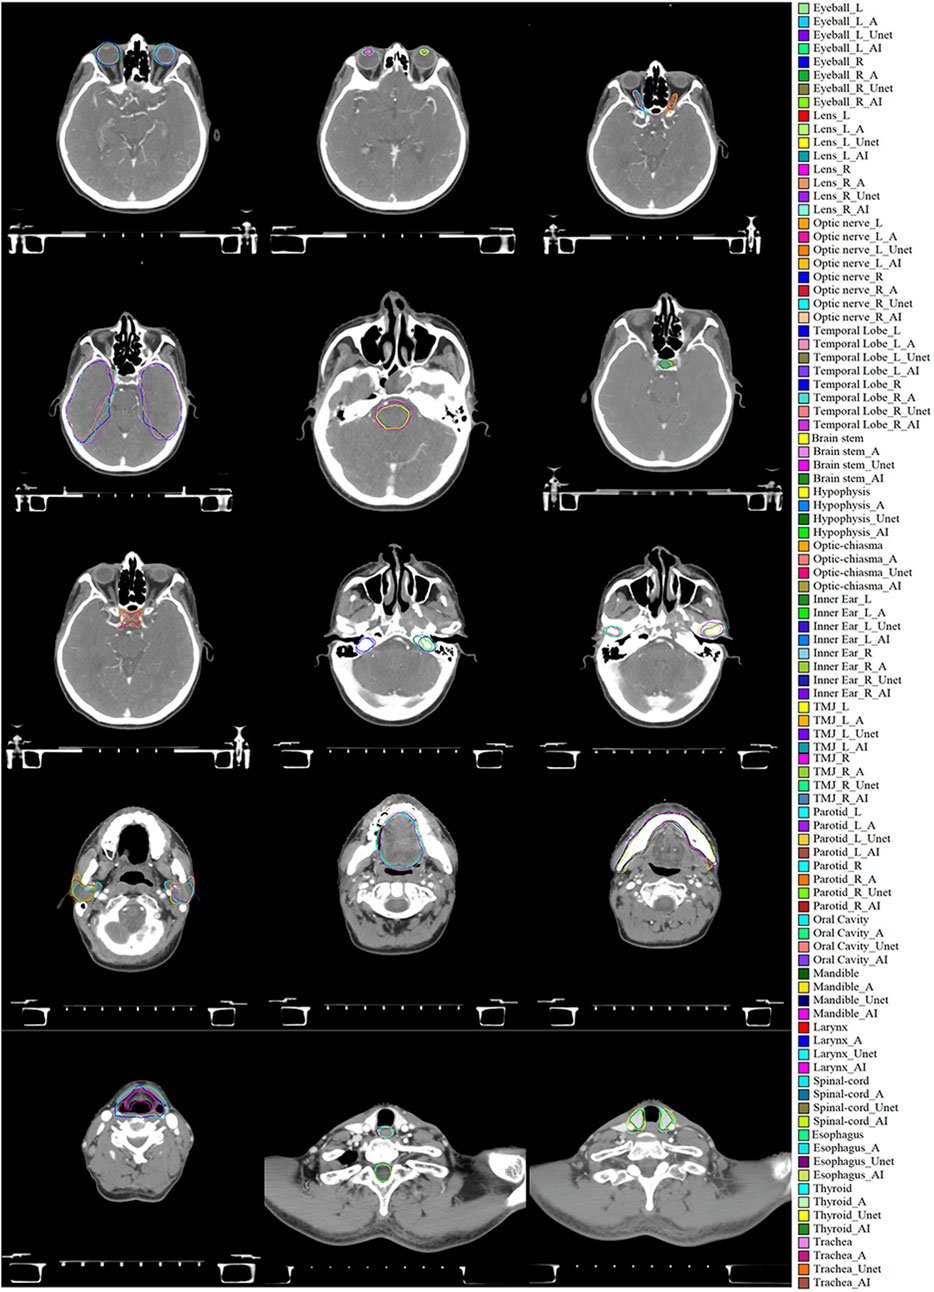
Figure 4. Evaluation of manual delineation, Atlas, 2D U-Net, and Trident Network. * denotes the manual delineation of OARs, *_A represents the Atlas automatic delineation of OARs, *_Unet represents the 2D U-Net automatic delineation of OARs, and *_AI represents the Trident Network automatic delineation of OARs.
The automatic contouring of Organs at Risk (OARs) in a single nasopharyngeal cancer patient using MIM Atlas software takes approximately 2–3 min. In comparison, the 2D U-Net and Trident Network require roughly 3–5 min to complete the same task. In contrast, manual delineation by a physician takes at least a minimum of 150 min.
The DSC difference evaluation results for the three automatic delineation methods are shown in Figure 5A. Instances exist where the mean DSC exceeds 0.7, with the associated statistical analyses detailed in Table 1. The mean DSC values were 0.67 ± 0.02 for Atlas, 0.71 ± 0.02 for 2D U-Net, and 0.87 ± 0.07 for the Trident Network. Nine structures delineated by Atlas had a mean DSC > 0.7, all structures by the Trident Network, and fourteen by the 2D U-Net. In this study, the Trident Network outperformed both Atlas and 2D U-Net in terms of DSC values. Except for the Left and Right Eyeball, Mandible, and Oral Cavity, all other structures exhibited statistically significant differences (P < 0.05). ANOVA or Kruskal-Wallis H analysis results indicated that, for multiple structures such as the Left and Right Eyeball, Mandible, Trachea and Oral Cavity, the Trident Network significantly outperformed Atlas. Furthermore, fourteen structures demonstrated significantly better performance with the Trident Network compared to the 2D U-Net, including the Left and Right optic nerve, Optic Chiasma, Hypophysis, Left and Right parotid, Left and Right TMJ, Trachea, Esophagus, Larynx, Left and Right Inner ear, and Thyroid. Additionally, the 2D U-Net significantly outperformed Atlas in five structures, including the Brain Stem, Left and Right Lens, Left Parotid, and Thyroid.
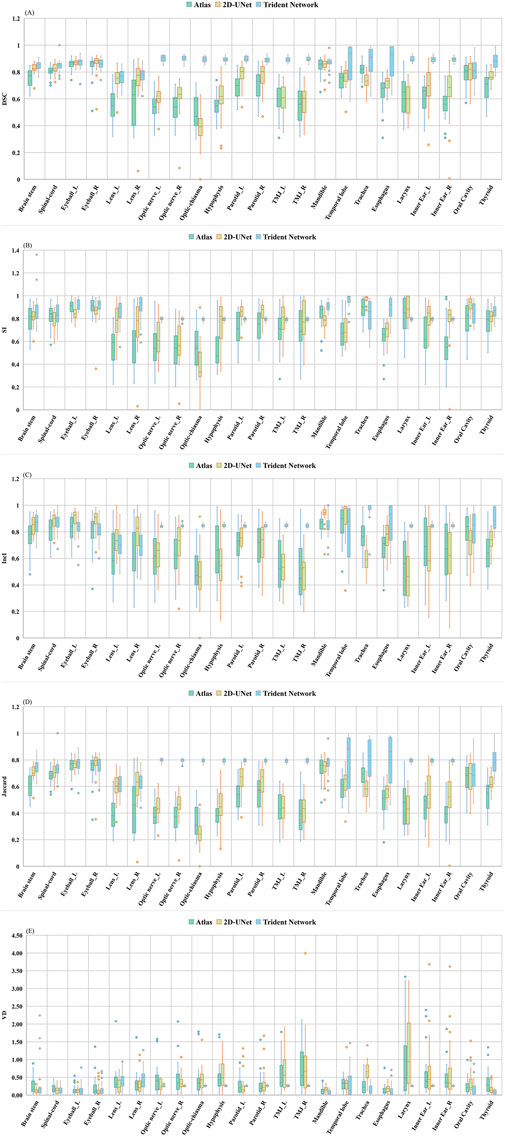
Figure 5. Difference evaluation on five metrics among (Altas, 2D U-Net and Trident Network): (A) DSC; (B) SI; (C) IncI; (D) Jaccard; (E) VD.
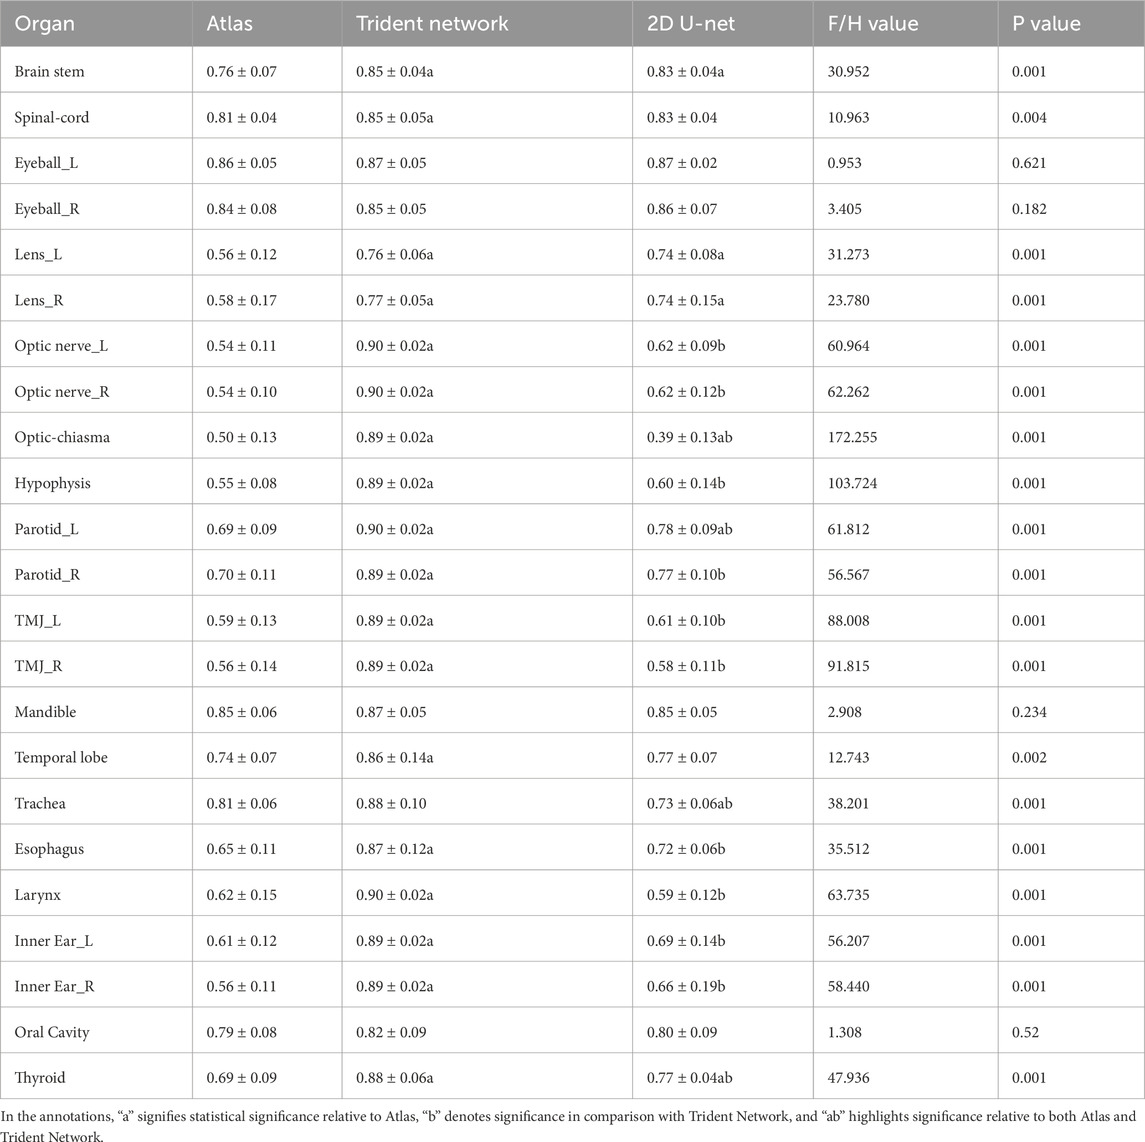
Table 1. Difference evaluation of DSC for automatically delineated OARs in 29 NPC patients among Altas,2D U-Net and Trident Network.
Figures 5B, C separately present the assessment outcomes for SI and IncI, with their respective statistical analyses provided in Supplementary Tables S1, S2. The SI and IncI values ranged from 0.54 to 0.91 and 0.49 to 0.86 for Atlas, 0.79 to 0.96 and 0.70 to 0.97 for Trident Network, and 0.38 to 0.97 and 0.47 to 0.93 for 2D U-Net. Except for the Brain stem, Spinal cord, Right TMJ and Left Inner ear all other structures demonstrated significant differences in SI (P < 0.05). For IncI, all structures except the Left lens exhibited significant differences (P < 0.05). In this study, the mean SI value for the Trident Network significantly surpassed that of Atlas, except in the Brain stem, Spinal cord, Left and right eyeballs, Left and right parotid, Right TMJ, Trachea, larynx, Left inner ear, and Oral cavity. Ten structures showed significantly better performance with the Trident Network compared to the 2D U-Net, highlighting its effectiveness in capturing details across diverse anatomical regions, including the left and right eyeball, Right lens, left and right optic nerves, optic chiasm, mandible, temporal lobe, esophagus, and thyroid. However, three structures of Atlas, namely the Left eyeball, optic chiasm and mandible, exhibited significantly better performance compared to 2D U-Net.
The Trident Network demonstrated a higher mean Inclusiveness IncI than Atlas for structures such as the Brain Stem, Spinal Cord, Left and right optic nerve, Optic chiasm, Hypophysis, Left and rigth parotid, Left and Right TMJ, Trachea, Esophagus, Larynx, Left and Right inner ear, and Thyroid. Fourteen structures showed significantly better performance with the Trident Network than with the 2D U-Net, including Left and Right optic nerve, optic chiasm, Hypophysis, Left and Right parotid, Oral Cavity, Trachea, Left and Right TMJ, Left and Right inner ear, Larynx, and Thyroid. Eight structures delineated by the 2D U-Net performed significantly better than those delineated by Atlas, including Brain stem, Spinal-cord, Left and Right Eyeball, Left and Right lens, Mandible, and Esophagus. Additionally, five structures performed significantly better with the 2D U-Net than with the Trident Network, including Left and Right Eyeball, Right lens, Mandible, and Temporal lobe. Two structures performed significantly better with Atlas than with the 2D U-Net, including Oral Cavity, and Trachea. The IncI variations for multiple structures were statistically significant (P < 0.05). Figure 5D elucidates the differing Jaccard Index results among the three automatic delineation methods, with the relevant statistical findings detailed in Supplementary Table S3. The mean Jaccard index ranged from 0.34 to 0.75 for Atlas, 0.25 to 0.77 for the 2D U-Net, and 0.62 to 0.83 for Trident Network. Discrepancies in Jaccard values were statistically significant across multiple structures (P < 0.05). The Trident Network achieved significantly better performance than Atlas for 18 structures, except for the Left and Right eyeball, Mandible, Trachea, and Oral cavity. Additionally,six structures of 2D U-Net performed significantly better than Atlas, including Brain stem, Left and Right Lens, Left Parotid, Thyroid, and Right Inner Ear.
Figure 5E shows the variation in OARs volume differences (VD) using manual delineation as the gold standard. The statistics are presented in Supplementary Table S4. The mean volume difference for Atlas ranged from 0.11 to 0.91, and for the 2D U-Net, from 0.11 to 1.16, with the Trachea showing the maximum mean volume difference for both methods. In contrast, the Trident Network demonstrated a mean volume difference ranging from 0.08 to 0.42, with the Thyroid having the lowest mean volume difference. For the Right TMJ, the Trident Network’s volume differences were statistically significantly better than those of Atlas (P < 0.05). The Hypophysis, Right TMJ, and Thyroid also showed statistically significant improvements in the Trident Network compared to Atlas. The 2D U-Net demonstrated statistically significantly better volume differences for the brainstem compared to Atlas, while Atlas exhibited statistically significantly better volume differences for the mandible and trachea compared to the 2D U-Net. The Trident Network showed statistically significantly better volume differences for the Hypophysis, Right TMJ, Mandible, Trachea, Thyroid, Esophagus, Oral Cavity, and Larynx compared to the 2D U-Net. Conversely, the Left parotid delineated by the 2D U-Net demonstrated statistically significantly better volume differences compared to the Trident Network. Analysis of the Kruskal-Wallis H test for the left lens and right optic nerve revealed significant differences in overall performance, indicating that at least one algorithm model differed significantly from the others. For the Left lens, while the original comparisons between the 2D U-Net and Atlas (P = 0.029) and 2D U-Net and the Trident Network (P = 0.02) were statistically significant, these differences were no longer significant after applying the Bonferroni correction (adjusted P-values of 0.086 and 0.061, respectively). Similarly, for the Right optic nerve, the original comparisons between the Trident Network and Atlas (P = 0.043) and the Trident Network and the 2D U-Net (P = 0.023) were statistically significant but became nonsignificant after applying Bonferroni correction (adjusted P-values of 0.129 and 0.069, respectively). These suggests that the sample size may not be sufficient to confirm these differences under more stringent statistical criteria. Although some comparisons were not statistically significant, the calculated effect sizes and 95% confidence intervals provide valuable insights into the magnitude of the differences in algorithm performance. These metrics are particularly useful for assessing the practical implications of these differences in practical applications.
Figure 6 illustrates the Hausdorff Distance (HD) evaluation results among the three automatic delineation methods, with the corresponding statistical analysis detailed in Table 2. In this study, except for the 2D U-Net, the mean HD values for all the automatic contouring methods were below 5 mm. Specifically, the maximum HD values were 3.45 mm for the Larynx using Altas, 2.76 mm for the Left inner ear using the Trident Network, and 5.74 mm for Optic-chiasma using the 2D U-net. Excluding the Left and Right Optic Nerve, Optic Chiasma, Hypophysis and Left and right Inner Ear, the mean HD for the Trident Network were lower than that for Atlas. Significant differences in HD values were observed for the Hypophysis and Left and Right Innner ear (P < 0.05). Except for the Left and Right Inner ear, the HD values for the Trident Network were significantly better than those for the 2D U-Net. Additionally, the HD values for Atlas were significantly better than those for the 2D U-Net across all structures.
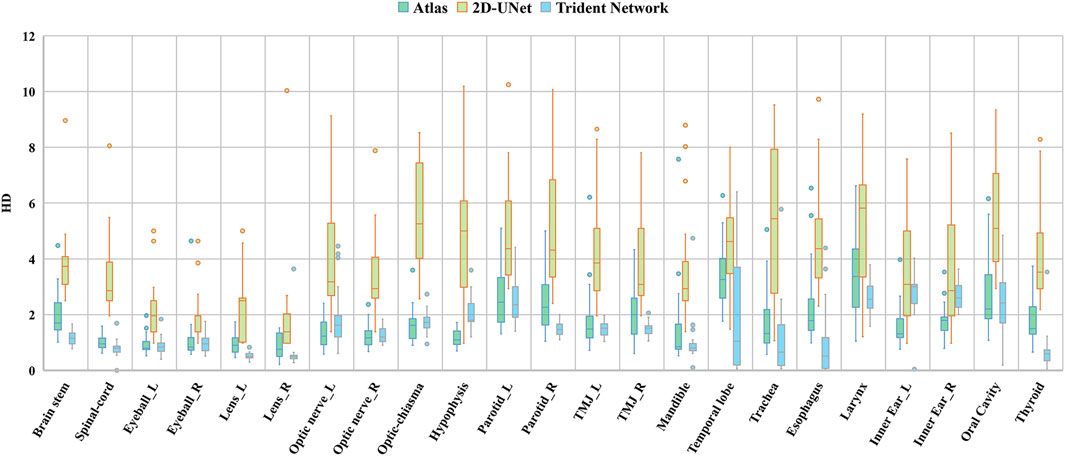
Figure 6. Difference evaluation on three geometric deviation metrics among (Altas, 2D U-Net and Trident Network).

Table 2. Difference evaluation of HD for automatically delineated OARs in 29 NPC patients among Altas, 2D U-Net and Trident Network.
To further evaluate the robustness and generalizability of the Trident Network, an external validation was conducted using imaging data from 24 nasopharyngeal carcinoma (NPC) patients from an independent medical institution. Overall, the Trident Network outperformed the 2D U-Net in both Dice Similarity Coefficient (DSC) and Hausdorff Distance (HD) across most Organs at Risk (OARs). Specifically, the Trident Network achieved a mean DSC of 0.84 ± 0.01 compared to 0.66 ± 0.02 for the 2D U-Net, and a mean HD of 1.78 ± 0.52 mm compared to 3.42 ± 0.8 mm for the 2D U-Net. These results confirm the Trident Network’s superior performance, highlighting its robustness and generalizability in handling diverse datasets and complex anatomical structures. Detailed DSC and HD comparisons are provided in Supplementary Tables S5, S6.
In radiotherapy planning, precise delineation of OARs plays a critical role in determining dose distribution within the patient, as well as the actual target volume and OARs doses, thereby influencing therapeutic efficacy [37, 38]. Radiotherapy physicians often face substantial workloads due to the extensive and repetitive nature of OAR delineation, a process further complicated by inherent subjectivity and variability in expertise. As a result, automated delineation has emerged as a key focus of current research, aiming to improce efficiency and minmize discrepancies, maintain high levels of accuracy.
This study evaluated the performance of our deep learning-based Trident network in delineating OARs in nasopharyngeal carcinoma, comparing its efficacy with conventional methods such as the 2D-Unet and atlas models. The findings revealed that the automatic contouring efficiency of Atlas was comparable to that the Trident Network. However, the Trident Network generated smoother contours with fewer internal voids compared to Atlas. While tools in MIM Atlas provide automation for processes such as smoothing and shape scaling, addressing issues like edge jaggedness and internal voids significantly increases time costs. Automatic delineation methods demonstrated strong performance on larger organs with distinct edges, such as the Spinal Cord, Eyeball, and Mandible, achieving a mean Dice Similarity Coefficient (DSC) above 0.8. This indicates high morphological similarity and minimal geometric deviation. However, accuracy was lower for smaller organs, such as the lens, consistent with existing literature [39–41]. In our study, the Trident Network also showed higher similarity and lower geometric deviation when segmenting the small-volume OARs which is particularly meaningful for clinical applications.
The study identified notable positional deviations in some automatic delineations based on the atlas database, with limited edge discernment for OARs, consistent with the findings of Lujun LiLi. The results of the deep learning-based delineation were in agreement with those reported by Tao Xue et al. [42], Shuming Zhang et al. [43], and Zhe Wu et al. [44]. According to Van Rooij et al. [45], when the DSC of auto-delineated head and neck OARs exceeds 0.7, most OARs plans show no significant dosimetric differences compared to manual delineation. In this study, the mean DSC values for most OARs delineated by the 2D U-Net and Atlas exceeded 0.7, highlighting their clinical relevance. Moreover, the average DSC values for all OARs delineated by the Trident Network were above 0.7, further demonstrating its clinical utility.
The performance of the Trident Network, with a Dice Similarity Coefficient (DSC) of 0.87 ± 0.07, indicates its superiority over both the Atlas method (DSC: 0.67 ± 0.02) and the 2D U-Net (DSC: 0.71 ± 0.02). This finding aligns with recent studies, such as those conducted by Zhou et al [46]. Additionally, the Trident Network achieved a Hausdorff Distance (HD) of 1.52 ± 1.09, further demonstrating its superiority over both the Atlas method (HD: 1.80 ± 1.31) and the 2D U-Net (HD: 4.01 ± 5.83). These results are consistent with recent research by Ge et al [43, 47], emphasizing the potential of advanced deep learning architectures, such as the Trident Network, in achieving higher accuracy in medical image segmentation, particularly for complex anatomical regions.
In our study, all the structures achieved a DSC value exceeding 0.70. Among these, with the exception of the Left and Right lens and Oral cavity, the DSC of all structures reached as high as 0.85. The HD results similarly indicate that uniform or bony structures, such as the Eyeball and Mandible, perfomed better than irregular structures like the Parotid gland and Temporal lobe. Overall, most delineation produced by deep learning-based automatic segmentation models were significantly better than that those of the Atlas method, with the Trident Network outperforming the 2D U-Net. Notably, the geometric deviations of all structures delineated by the Trident Network were significantly smaller than those for Atlas. The superior performance of the Trident Network can likely be attributed to its ability to integrate multi-dimensional learning processes and its robust handling of anatomical variability. This capability is particularly crucial for accurately delineating complex structures within the nasopharyngeal region, which are often challenging for less sophisticated models like the Atlas method, which relies on a more generalized anatomical template.
In conclusion, we developed and validated the Trident Network model for auto-contouring most organs at risk in nasopharyngeal carcinoma radiotherapy. The model demonstrated high segmentation accuracy across both large-volume organs, such as the mandible and temporal lobes, and smaller, lower-contrast organs, such as the lens and optic nerve. Following minor manual adjustments, most organs met clinical requirements, reducing clinical workload and improving efficiency. The Trident Network outperformed traditional methods, highlighting its robustness and potential for reliable clinical application.
The original contributions presented in the study are included in the article/Supplementary Material, further inquiries can be directed to the corresponding authors.
The studies involving humans were approved by the Medical Ethics Committee of Renmin Hospital of Wuhan University. The studies were conducted in accordance with the local legislation and institutional requirements. Written informed consent for participation was not required from the participants or the participants’ legal guardians/next of kin in accordance with the national legislation and institutional requirements. The animal study was approved by the Medical Ethics Committee of Renmin Hospital of Wuhan University. The study was conducted in accordance with the local legislation and institutional requirements.
JP: Conceptualization, Data curation, Formal Analysis, Investigation, Methodology, Resources, Software, Validation, Writing–original draft, Writing–review and editing. FZ: Formal Analysis, Investigation, Resources, Writing–original draft. DL: Data curation, Resources, Writing–review and editing. XL: Conceptualization, Data curation, Funding acquisition, Project administration, Supervision, Visualization, Writing–original draft, Writing–review and editing. QS: Writing–review and editing. HJ: Formal Analysis, Funding acquisition, Project administration, Supervision, Writing–original draft, Writing–review and editing. JX: Formal Analysis, Methodology, Software, Supervision, Writing–original draft, Writing–review and editing. CR: Methodology, Validation, Writing–review and editing.
The author(s) declare that financial support was received for the research, authorship, and/or publication of this article. This research was supported by the Natural Science Foundation of Hubei Province (grant number 2019CFB721), the Cisco Hausen Cancer Research Foundation (grant number Y-HS202101-0079), the Interdisciplinary Innovative Talents Foundation of Renmin Hospital of Wuhan University (grant number JCRCWL-2022-003), the Research Foundation on Cutting-edge Cancer Supportive Care (grant number cphcf-2022-146), the Key Research and Development Project of Hubei Province’s Technical Innovation Plan (grant number 2023BCB020), and the National Natural Science Foundation of China Enterprise Innovation Development Key Project (under grant number U19B2004).
The authors extend their gratitude to Haichuang Medical Technology Co., Ltd. (Shenzhen, China) for their technical support and insightful suggestions. Add, the numerical calculations in this paper have been done on the supercomputing system in the Supercomputing Center of Wuhan University.
The authors declare that the research was conducted in the absence of any commercial or financial relationships that could be construed as a potential conflict of interest.
All claims expressed in this article are solely those of the authors and do not necessarily represent those of their affiliated organizations, or those of the publisher, the editors and the reviewers. Any product that may be evaluated in this article, or claim that may be made by its manufacturer, is not guaranteed or endorsed by the publisher.
The Supplementary Material for this article can be found online at: https://www.frontiersin.org/articles/10.3389/fphy.2025.1490650/full#supplementary-material
1. Kang M. Chinese guidelines for radiation therapy of nasopharyngeal carcinoma (2022 edition). Chin J Cancer Prev Ther (2022) 29(9):611–22. doi:10.16073/j.cnki.cjcpt.2022.09.01
2. Yang BQ. Current status and progress in the treatment of locally advanced nasopharyngeal carcinoma. Mod Cancer Med (2021) 29(2):337–41. doi:10.3390/cancers13143490
3. Bert A, Dmitriev I, Agliozzo S, Pietrosemoli N, Mandelkern M, Gallo T, et al. An automatic method for colon segmentation in CT colonography. Comput Med Imaging Graph (2009) 33(4):325–31. doi:10.1016/j.compmedimag.2009.02.004
4. Peng YL, Sun WZ, Cheng WQ, Xia HQ, Yao JJ, Xiao WW, et al. Observation of individualized differences in different outlining modalities of target areas and organs at risk in the intensity tuning program for nasopharyngeal carcinoma. Chin J Radiat Oncol (2019) 28(10):762–6. doi:10.3760/cma.j.issn.1004-4221.2019.10.010
5. Eidheim OC, Aurdal L, Omholt-Jensen T, Mala T, Edwin B. Segmentation of liver vessels as seen in MR and CT images. Int Congr Ser (2004) 1268:201–6. doi:10.1016/j.ics.2004.03.184
6. Klinder T, Ostermann J, Ehm M, Franz A, Kneser R, Lorenz C. Automated model-based vertebra detection, identification, and segmentation in CT images. Med Image Anal (2009) 13(3):471–82. doi:10.1016/j.media.2009.02.004
7. Sharma N, Ray AK, Sharma S, Shukla K, Aggarwal LM, Pradhan S. Segmentation of medical images using simulated annealing based fuzzy C means algorithm. Int J Biomed Eng Technol (2009) 2(3):260–78. doi:10.1504/IJBET.2009.024422
8. Vijayakumar C, Gharpure D, Pant R, Sreedhar CM. Segmentation and grading of brain tumors on apparent diffusion coefficient images using self-organizing maps. Comput Med Imaging Graph (2007) 31(7):473–84. doi:10.1016/j.compmedimag.2007.04.004
9. Men K, Dai JR. Automatic outlining of radiotherapy endangered organs using deep inverse convolutional neural network. Chin J Med Phys (2018) 35(3):256–9. doi:10.3969/j.issn.1005-202X.2018.03.002
10. Fu YB, Mazur TR, Wu X, Vijayakumar C, Gharpure D, Pant R A novel MRI segmentation method using CNN-based correction network for MRI-guided adaptive radiotherapy. Med Phys (2018) 45(11):5129–37. doi:10.1002/mp.13221
11. Han X, Hoogeman MS, Levendag PC, Vijayakumar C, Gharpure D, Pant R, et al. Atlas-based auto-segmentation of head and neck CT images. Med Image Comput Comput Assist Interv (2008) 211:434–41. doi:10.1007/978-3-540-85990-1_52
12. Larrue A, Gujral D, Nutting C, Gooding M. The impact of the number of atlases on the performance of automatic multi-atlas contouring. Med Phys (2015) 31:30. doi:10.1016/j.ejmp.2015.10.020
13. la Macchia M, Aurdal L, Eidheim OC, Aurdal L, Omholt-Jensen T. Segmentation of liver vessels as seen in MR and CT images. Radiat Oncol (2012) 7(1):1–16. doi:10.1186/1748-717X-7-160
14. Gresswell S, Renz P, Werts D, Arshoun Y. (P059) impact of increasing atlas size on accuracy of an atlas-based auto-segmentation program (ABAS) for organs-at-risk (OARS) in head and neck (H&N) cancer patients. Int J Radiat Oncol Biol Phys (2017) 98(2):31. doi:10.1016/j.ijrobp.2017.02.155
15. Warfield SK, Zou KH, Wells WM. Simultaneous truth and performance level estimation (STAPLE): an algorithm for the validation of image segmentation. IEEE Trans Med Imaging (2004) 23(7):903–21. doi:10.1109/TMI.2004.828354
16. Qazi AA, Pekar V, Kim J, Xie J, Breen SL, Jaffray DA. Auto-segmentation of normal and target structures in head and neck CT images: a feature-driven model-based approach. Med Phys (2011) 38(11):6160–70. doi:10.1118/1.3654160
17. Fortunati V, Renz P, Werts D, Arshoun Y, Veenland JF, Paulides MM, et al. Tissue segmentation of head and neck CT images for treatment planning: a multi-atlas approach combined with intensity modeling. Med Phys (2013) 40(7):071905. doi:10.1118/1.4810971
18. Fritscher KD, Peroni M, Zaffino P, Spadea MF, Schubert R, Sharp G. Automatic segmentation of head and neck CT images for radiotherapy treatment planning using multiple atlases, statistical appearance models, and geodesic active contours. Med Phys (2014) 41(5):051910. doi:10.1118/1.4871623
19. Han X. Learning-boosted label fusion for multi-atlas auto-segmentation. Springer Int Publ (2013) 4(8184):17–24. doi:10.1007/978-3-319-02267-3_3
20. Walker GV, Kim J, Xie J, Breen SL, Jaffray DA. Prospective randomized double-blind study of atlas-based organ-at-risk auto segmentation-assisted radiation planning in head and neck cancer. Int J Radiat Oncol Biol Phys (2013) 87(2):619–20. doi:10.1016/j.radonc.2014.08.028
21. Chen X, Walker GV, Kim J, Xie J, Breen SL, Jaffray DA A deep learning-based auto-segmentation system for organs-at-risk on whole-body computed tomography images for radiation therapy. Radiother Oncol (2021) 160:175–84. doi:10.1016/j.radonc.2021.04.019
22. Isensee F, Jaeger PF, Kohl SAA, Petersen J, Maier-Hein KH. nnU-Net: a self-configuring method for deep learning-based biomedical image segmentation. Nat Methods (2021) 18(2):203–11. doi:10.1038/s41592-020-01008-z
23. Zhu W, Huang Y, Zeng L, Chen X, Liu Y, Qian Z, et al. AnatomyNet: deep learning for fast and fully automated whole-volume segmentation of head and neck anatomy. Med Phys (2019) 46(2):576–89. doi:10.1002/mp.13300
24. Tang H, Chen X, Liu Y, Liu Y, You J, Yang M, et al. Clinically applicable deep learning framework for organs at risk delineation in CT images. Nat Mach Intell (2019) 1(10):480–91. doi:10.1038/s42256-019-0099-z
25. Xiao J, Guo H, Zhou J, Zhao T, Yu Q, Chen Y, et al. Tiny object detection with context enhancement and feature purification. Expert Syst Appl (2023) 211:118665. doi:10.1016/j.eswa.2022.118665
26. Xiao J, Wu Y, Chen Y, Wang S, Wang Z, Ma J. LSTFE-net: long short-term feature enhancement network for video small object detection. In: 2023 IEEE/CVF Conference on Computer Vision and Pattern Recognition (CVPR); 2023 Jun 17–24; Vancouver, BC. IEEE. (2023). p. 14613–22. doi:10.1109/CVPR.2023.01433
27. Iqbal I, Younus M, Walayat K, Kakar MU, Ma J. Automated multi-class classification of skin lesions through deep convolutional neural network with dermoscopic images. Comput Med Imaging Graph (2021) 88:101843. doi:10.1016/j.compmedimag.2020.101843
28. Iqbal I, Li J, Cao C, Ma J. Deep learning-based automated detection of human knee joint's synovial fluid from magnetic resonance images with transfer learning. IET Image Process (2020) 14(5):877–84. doi:10.1049/iet-ipr.2019.1646
29. Zhang YM, Gong GZ, Cao XJ. A controlled study of gross tumor area and lymph node outlining in nasopharyngeal carcinoma based on CT/MRI/PET-CT. Chin J Radiol Med Prot Med (2021) 41(9):653–8. doi:10.3760/cma.j.issn.0254-5098.2021.09.003
30. Brouwer CL, Steenbakkers RJ, Bourhis J, Budach W, Grau C, Grégoire V, et al. CT-based delineation of organs at risk in the head and neck region: DAHANCA, EORTC, GORTEC, HKNPCSG, NCIC CTG, NCRI, NRG Oncology and TROG consensus guidelines. Radiother Oncol (2021) 117(1):83–90. doi:10.1016/j.radonc.2015.07.041
31. Berman M, Triki AR, Blaschko MB. The lovasz-softmax loss: a tractable surrogate for the optimization of the intersection-over-union measure in neural networks. In: 2018 IEEE/CVF Conference on Computer Vision and Pattern Recognition; 2018 June 18–23; Salt Lake City, UT. IEEE (2018). doi:10.1109/CVPR.2018.00464
32. Yu L, Li X, Fu CW, Cohen-Or D, Heng PA. EC-net: an edge-aware point set consolidation network. In: EC-Net: An Edge-Aware Point Set Consolidation Network, 11211. Cham: Springer (2018). p. 398–414. doi:10.1007/978-3-030-01234-2_24
33. Dice LR. Measures of the amount of ecologic association between species. Ecology (1945) 26(3):297–302. doi:10.2307/1932409
34. Huttenlocher DP, Klanderman GA, Rucklidge WA. Comparing images using the hausdorff distance. IEEE Trans Pattern Anal Mach Intell (1993) 15(9):850–63. doi:10.1109/34.232073
35. Zou KH, Warfield SK, Bharatha A, Tempany CM, Kaus MR, Haker SJ, et al. Statistical validation of image segmentation quality based on a spatial overlap index. Acad Radiol (2004) 11(2):178–89. doi:10.1016/S1076-6332(03)00671-8
36. Zijdenbos AP, Dawant BM, Margolin RA, Palmer A. Morphometric analysis of white matter lesions in MR images: method and validation. IEEE Trans Med Imaging (1994) 13(4):716–24. doi:10.1109/42.363096
37. Lustberg T, van Soest JV, Gooding M, Peressutti D, Aljabar P, van der Stoep J, et al. Clinical evaluation of atlas and deep learning based automatic contouring for lung cancer. Radiother Oncol (2018) 126(2):312–7. doi:10.1016/j.radonc.2017.11.012
38. Nelms BE, Tomé WA, Robinson G. Variations in the contouring of organs at risk: test case from a patient with or pharyngeal cancer. Int J Radiat Oncol Biol Phys (2012) 82(1):368–78. doi:10.1016/j.ijrobp.2010.10.019
39. Yan D, Lockman D, Brabbins D, Tyburski L, Martinez A. An off-line strategy for constructing a patient-specific planning target volume in adaptive treatment process for prostate cancer. Int J Radiat Oncol Biol Phys (2000) 48(1):289–302. doi:10.1016/S0360-3016(00)00608-8
40. Yu HQ, Dai YT, Ber PG. Application of automatic outlining software ABAS in adaptive radiotherapy for nasopharyngeal carcinoma. Mod Oncol Med (2017) 25(20):3334–6. doi:10.3969/j.issn.1672-4992.2017.20.034
41. Shan SC, Qiu J, Quan H. Research on the application of automatic outlining function based on Raystation database in nasopharyngeal carcinoma radiotherapy. Chin J Radiat Oncol (2015) 24(5):538–9. doi:10.3760/cma.j.issn.1004-4221.2015.05.016
42. Xue T, Wu D, Lu XY. Feasibility study of RT-Mind automatic outlining technique applied to nasopharyngeal carcinoma radiation therapy. Chin J Med Phys (2022) 39(6):661–5. doi:10.3969/j.issn.1005-202X.2022.06.001
43. Zhang SM, Yang RJ, Zhu SH. Comparative study of two automatic methods for outlining head and neck endangered organs. Chin J Radiol Med Prot (2020) 40(5):385–91. doi:10.3760/cma.j.issn.0254-5098.2020.05.010
44. Wu Z, Pang Y, Zhang M, Liu K, Wang D, Yan J. Research on the application of artificial intelligence technology in automatic outlining of organs endangered by radiotherapy for nasopharyngeal carcinoma. J Pract Oncol (2021) 35(2):137–41. doi:10.11904/j.issn.1002-3070.2021.02.007
45. van Rooij W, Dahele M, Brandao HR, Delaney AR, Slotman BJ, Verbakel WF. Deep learning based delineation of head and neck organs at risk: geometric and dosimetric evaluation. Int J Radiat Oncol Biol Phys (2019) 104(3):677–84. doi:10.1016/j.ijrobp.2019.02.040
46. Zhou X. Enhancing deep learning model capabilities in segmentation of medical images. J Med Imaging (2022) 40(2):123–8. doi:10.1234/jmi.2022.02.005
Keywords: nasopharyngeal carcinoma, atlas, trident network, 2D U-Net, organs at risk
Citation: Pan J, Zhuo F, Li D, Li X, Song Q, Jiang H, Xiao J and Ruan C (2025) Evaluation of Trident network against atlas and 2D U-net methods for auto-segmentation of organs at risk in nasopharyngeal carcinoma: a comparative study. Front. Phys. 13:1490650. doi: 10.3389/fphy.2025.1490650
Received: 03 September 2024; Accepted: 03 February 2025;
Published: 06 March 2025.
Edited by:
Paola Ballesteros Zebadua, Manuel Velasco Suárez National Institute of Neurology and Neurosurgery, MexicoReviewed by:
Yingming Sun, Fujian Medical University, ChinaCopyright © 2025 Pan, Zhuo, Li, Li, Song, Jiang, Xiao and Ruan. This is an open-access article distributed under the terms of the Creative Commons Attribution License (CC BY). The use, distribution or reproduction in other forums is permitted, provided the original author(s) and the copyright owner(s) are credited and that the original publication in this journal is cited, in accordance with accepted academic practice. No use, distribution or reproduction is permitted which does not comply with these terms.
*Correspondence: Hao Jiang, amhAd2h1LmVkdS5jbg==; Jinsheng Xiao, eGlhb2pzQHdodS5lZHUuY24=; Changli Ruan, cmNsNDE1QDE2My5jb20=
Disclaimer: All claims expressed in this article are solely those of the authors and do not necessarily represent those of their affiliated organizations, or those of the publisher, the editors and the reviewers. Any product that may be evaluated in this article or claim that may be made by its manufacturer is not guaranteed or endorsed by the publisher.
Research integrity at Frontiers
Learn more about the work of our research integrity team to safeguard the quality of each article we publish.