- 1Department of Rheumatology and Immunology, Shenzhen Children's Hospital, Shenzhen, China
- 2Department of Pediatrics, Anyang Maternal and Child Health Care Hospital, Anyang, China
In the real world, individuals may become infected with an epidemic after multiple exposures to the corresponding virus. This occurs because each individual possesses certain physical defenses and immune capabilities at the time of exposure to the virus. Repeated exposure to the virus can lead to a decline in immune competence, consequently resulting in epidemic infection. The susceptibility of individuals to an epidemic is heterogeneous. We model this characteristic as the individual heterogeneous infection threshold. Then, we propose an individual logarithmic-like infection threshold function on a single-layer complex network to reflect the heterogeneity of individual susceptibility on infecting the virus and the associated epidemic. Next, we introduce a partition theory based on the edge and logarithmic-like infection threshold function to qualitatively analyze the mechanisms of virus infection and epidemic spreading. Finally, simulation results on Erdő–Rényi (ER) and scale-free (SF) networks indicate that increasing both the epidemic infection initial threshold and outbreak threshold, as well as decreasing the virus and epidemic infection probability, can all effectively suppress epidemic spreading and epidemic infection outbreak. With an increase in the epidemic infection outbreak threshold, the increasing pattern of the final epidemic infection scale transitions from a second-order continuous phase transition to a first-order discontinuous phase transition. Additionally, degree distribution heterogeneity also significantly impacts the outbreak and spread of diseases. These findings provide valuable guidance for the formulation of immunization strategies.
1 Introduction
As early as 1760, Bernoulli proposes the first model for the spread of smallpox, marking the birth of transmission dynamics [1]. In 2001, Pastor-Satorras and Vespignani were the first to utilize complex networks to describe transmission pathways and explore the impact of network topology on epidemic spread, subsequently investigating its implications on transmission dynamics [2]. This work garners widespread attention from scholars domestically and internationally, signaling the emergence of complex network transmission dynamics. Virus infection and epidemic spreading is one of the primary research subjects within this field. In most real-world networks, common phenomena such as the spread of computer viruses and epidemics are interpreted through the lens of epidemic dynamics on complex networks [3–5]. The epidemic and infectious disease spreading not only affects public health but also leads to significant economic losses.
The study of epidemic spreading on complex networks primarily focuses on “simple” propagation, where the probability of epidemic infection remains constant across two consecutive contacts. Scholars have proposed several classic compartmental models tailored to different types of diseases, including the susceptible–infectious (SI) model, the susceptible–infectious–recovered (SIR) model, and the susceptible–infectious–susceptible (SIS) model [6]. [7] offered new perspectives for establishing a precise theoretical framework for spreading dynamics on complex networks by integrating the most commonly utilized theoretical methods which include mean-field [8], heterogeneous mean-field, quench mean-field [9], dynamical message-passing, link percolation, and pairwise approximation.
In the era of big data, we have more opportunities to access relevant data on human behavioral activities, including social activity data [10]. This authentic big data allow for a greater possibility of uncovering the true mechanisms behind epidemic and disease transmission [11]. Through the analysis of real-world data, researchers have discovered that human behavioral activities significantly influence epidemic and disease transmission [12]. Some scholars focus on accurately identifying the epidemic outbreak thresholds as these thresholds are crucial in many real-world scenarios. When the number of exposures an individual has to the virus reaches a certain threshold, the individual may become infected with the epidemic. The epidemic threshold represents the critical condition under which a system is in an active outbreak state [13]. A substantial amount of theoretical research has been conducted to predict the outbreak thresholds of SIR models [14–17].
In theoretical terms, accurately determining the epidemic infection outbreak thresholds can identify the critical conditions for the emergence of global large-scale epidemics [18]. It also significantly impacts the study of critical phenomena, including the determination of critical exponents [19]. In practical applications, epidemic infection outbreak thresholds can characterize the effectiveness of immunization strategies [20] and assist in identifying the optimal initial transmission source [21].
[22] utilized numerical computations based on the SIR epidemic model to relatively accurately predict the spread of COVID-19 and other pandemics. [23] employed time-varying networks to simulate the disease transmission process and proposed the most effective measures for controlling epidemic spread. [24] investigated the impact of vaccination on the dynamics of epidemic models, introducing a novel fractional-order discrete-time SIR epidemic model aimed at illustrating and quantifying the complex dynamics of the system. [25] considered the influence of individual and mass media information dissemination on epidemic spread, exploring the dynamic interactions between information transmission and susceptible-exposed-infectious-recovered (SEIR)-based epidemic spread. Additionally, unlike traditional information transmission, most current studies on epidemic spreading focus on “simple” propagation, i.e., a fixed infection threshold, overlooking the threshold heterogeneity [26–28].
From the factors discussed above, it is recognized that epidemic infection outbreak thresholds are critical in epidemic spreading, influencing not only the scale of outbreaks and their critical conditions but also providing effective guidance for the formulation of immunization strategies. Traditional studies on viral infection and epidemic transmission often assume that the probability of epidemic infection from two consecutive exposures is constant, suggesting that epidemic transmission lacks memory. Although this simplification facilitates the analysis of epidemic spread, it does not accurately reflect reality. In fact, human activities lead to a certain degree of memory and cumulative effects in the viruses and epidemic infections. As individuals are repeatedly exposed to the virus, the likelihood of epidemic infection outbreak increases.
Individuals possess certain physical defenses and immune capabilities. During initial exposure to the virus, factors such as the distance between individuals, the distribution of medical resources like masks, and variations in immune response may prevent the onset of disease. However, with an increasing number of viral exposures, individual immunity diminishes, significantly raising the probability of disease infection. Moreover, repeated epidemic infections can reduce sensitivity to the virus, leading to a diminishing marginal effect on the likelihood of developing the disease. Therefore, the individual susceptibility to infection epidemic is heterogeneous. Based on this understanding, we propose an individual heterogeneous infection threshold function, a logarithmic-like function, to explore the impact of individual characteristics on sensitivity to the virus and disease.
Based on the aforementioned motivations, we introduce a generalized SIR model on complex networks and propose an individual heterogeneous infection threshold function, a logarithmic-like function, to reflect the heterogeneity of individual susceptibility on infecting the virus and the associated disease. Furthermore, a partition theory based on the edge and individual heterogeneous infection threshold is proposed to theoretically analyze the dynamic processes of epidemic spreading. Finally, computer simulation results are presented to validate the findings of disease transmission, which align with the theoretical analysis. This study aims to leverage complex networks, computer simulations, and theoretical analyses to reveal the mechanisms and patterns of epidemic and disease transmission, thereby providing necessary theoretical support for early warning and control of epidemics and public sentiment. The rest of this paper is organized as follows: in Section 2, we build an epidemic spreading model with the individual heterogeneous infection threshold on complex networks. Section 3 exhibits an edge partition theory. In Section 4, the experimental results are discussed. Finally, Section 5 describes the conclusion.
2 Epidemic spreading model with individual heterogeneity
To investigate the impact of heterogeneity in individual susceptibility to infection epidemic on epidemic spreading mechanisms, we first construct two types of single-layer artificial complex network models, called the Erdő–Rényi (ER) networks [29] and the scale-free (SF) networks [30], for spreading dynamics. Each network has
Let the probability of one S-state node successfully being infected by the virus after coming into contact with its I-state neighbor node be
To investigate the impact of individual susceptibility heterogeneity to viruses and epidemic infection, an individual logarithmic-like infection threshold function, as shown in Figure 1, is proposed:
where
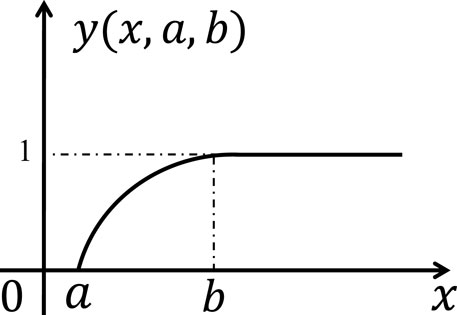
Figure 1. Illustration of the individual heterogeneous infection threshold model. The symbol
Specifically,
The human body possesses immune capabilities and physical defenses. As individuals are exposed to the virus more frequently, the probability of epidemic infection outbreak increases. However, due to the increasing of APIs, individuals’ sensitivity to the virus decreases, leading to a diminishing marginal effect of epidemic infection. Therefore, the logarithmic-like infection threshold function for individual heterogeneous infection is relevant and meaningful.
Next, we summarize the process of virus and epidemic spreading within complex networks. Initially, a proportion
3 The analysis of partition theory based on edge and individual heterogeneity
To better investigate the epidemic spreading process, we develop a partition theory incorporating edge and the epidemic infection outbreak thresholds to analyze the effect of the individual heterogeneity on epidemic spreading. In this approach, we assume that nodes with identical degrees are statistically equivalent. The variables
Let
By time
According to the logarithmic threshold function for epidemic spreading, the probability that an S-state node
The probability that the APIs of a randomly selected S-state nodes by time
Therefore, at time
Our goal is to solve for the three terms in Equation 2, specifically to derive the values of
Since node
According to the logarithmic threshold function for disease spreading, the probability that an S-state node
Let
Due to variations in the distance between individuals, differences in individual immunity, and the protective measures taken by individuals, after the S-state node
The I-state node has a probability of
Combining Equations 11, 12 and the initial conditions
Substituting Equation 10 and Equation 13 into Equation 7, we obtain
Substituting Equation 14 into Equation 11, the evolution of
Throughout the network, we have the density variation of each state
and
Equations 2–6; Equations 15–17 provide a comprehensive description of the transmission dynamics of viruses and diseases. By combining and iterating these equations, the density of each state at arbitrary time step, i.e., the values of
As
In epidemic spreading, the maximum value of the steady-state fixed point of Equation 18 is of paramount importance and is denoted by the critical probability point
and
From Equation 20, the critical infection probability can be calculated as
where
Combining Equation 8 and Equation 9, we derive the expression of
4 Results and discussions
Our paper focus on numerical experiments and theoretical analyses conducted on artificial ER networks and SF networks. The network size is
We use the relative variance
where
4.1 The epidemic spreading on the ER network
Figure 2A indicates that when
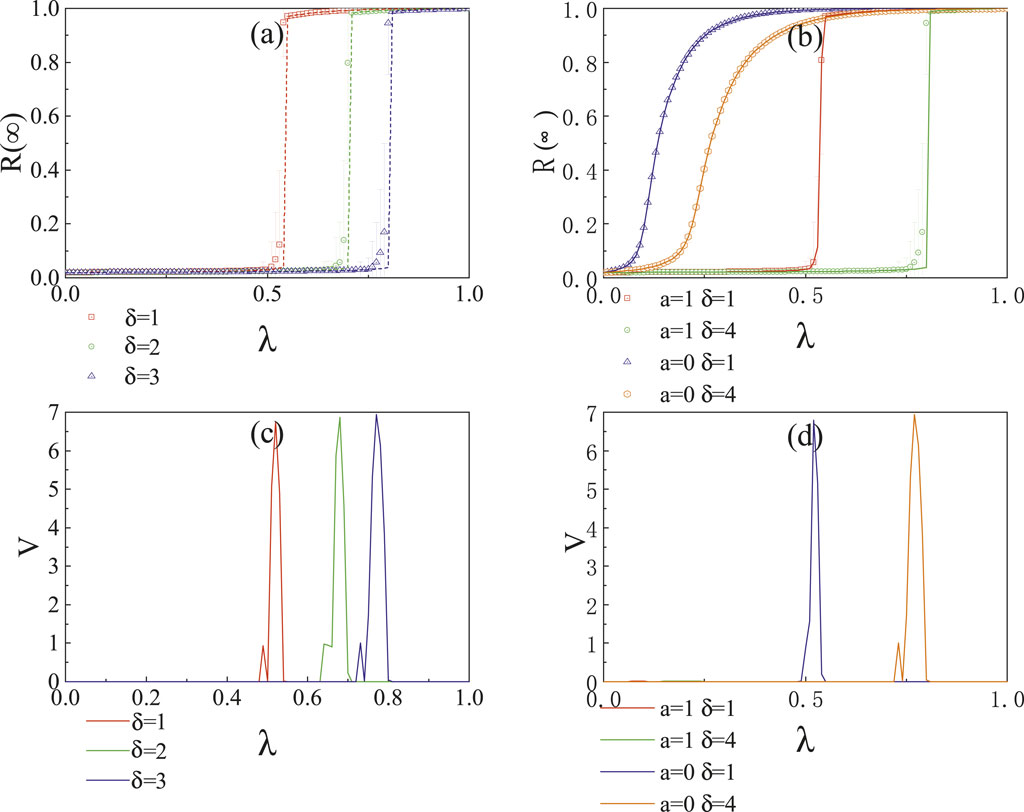
Figure 2. In the ER network, the impact of the infection probability
Figure 3A shows the influence of the infection probability
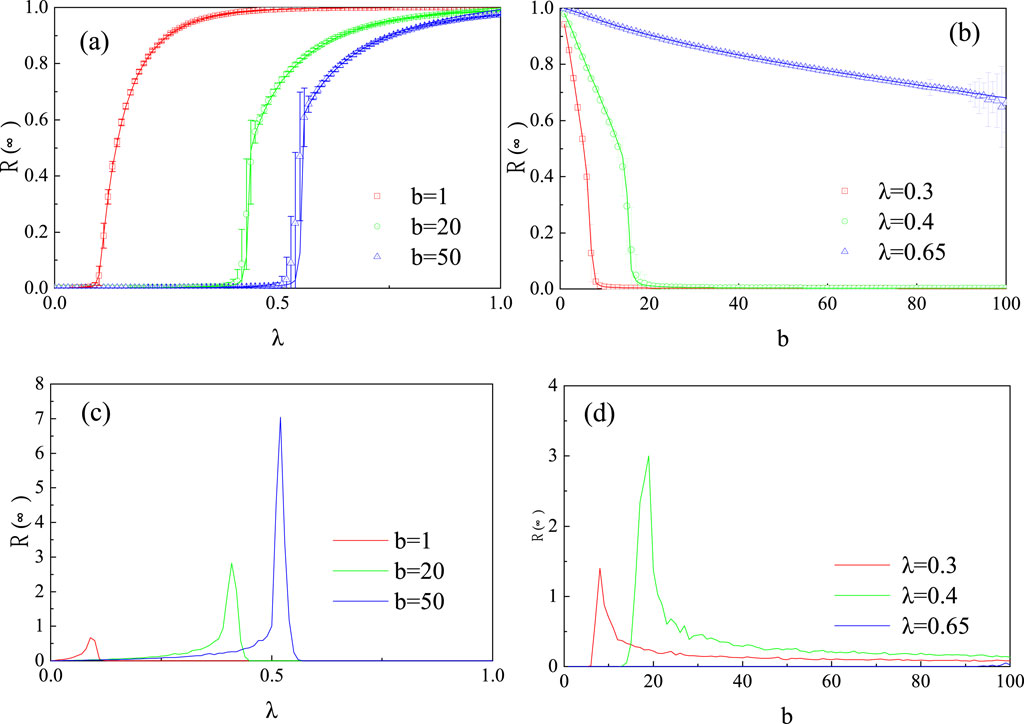
Figure 3. In the ER network, (A) illustrates the influence of the infection probability
Figure 4 illustrates the joint effects of the infection probability
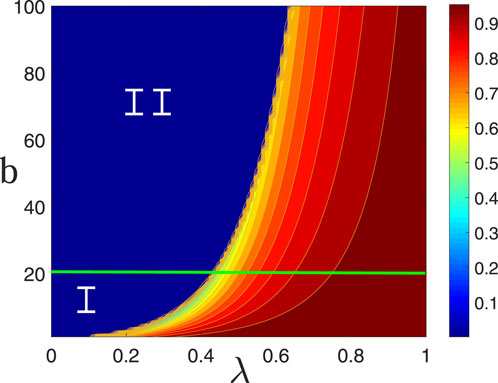
Figure 4. Joint effects of the infection probability
4.2 The epidemic spreading on the SF network
Figure 5 illustrates the effect of the epidemic infection probability
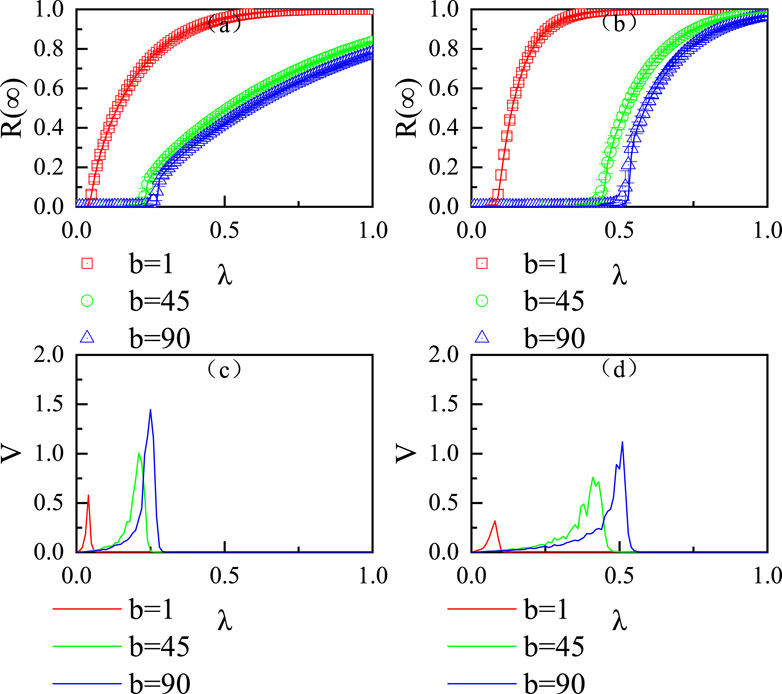
Figure 5. Influence of the virus infection probability
Figure 6A, B explores the variation in the final epidemic infection size
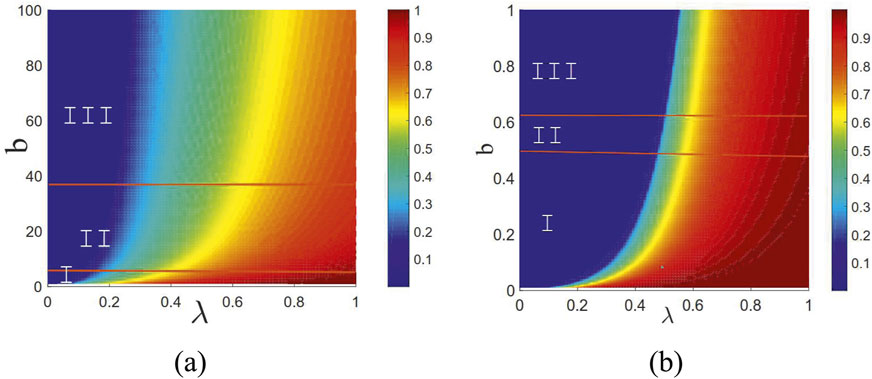
Figure 6. Joint effects of the virus infection probability
5 Conclusion
This paper considers the heterogeneity of individual susceptibility to infection epidemic and employs transmission dynamics to investigate the epidemic spreading process on single-layer complex networks. First, we propose a logarithmic-like threshold model and thoroughly examine its validity under the heterogeneity of individual infection epidemic susceptibility. Subsequently, we enhance the edge partition theory based on the individual logarithmic-like threshold function to analyze the epidemic spreading dynamic process. Through theoretical analysis and numerical simulations on ER and SF networks, we identify the factors influencing the scale of disease outbreaks and propose several strategies for mitigating epidemic spread.
Data availability statement
The raw data supporting the conclusions of this article will be made available by the authors, without undue reservation.
Author contributions
FL: conceptualization, data curation, formal analysis, investigation, methodology, project administration, resources, software, supervision, validation, visualization, writing–original draft, and writing–review and editing.
Funding
The author(s) declare that no financial support was received for the research, authorship, and/or publication of this article.
Acknowledgments
The author would like to thank the reviewers for their insightful comments on the manuscript as their remarks led to an improvement of the work.
Conflict of interest
The author declares that the research was conducted in the absence of any commercial or financial relationships that could be construed as a potential conflict of interest.
Publisher’s note
All claims expressed in this article are solely those of the authors and do not necessarily represent those of their affiliated organizations, or those of the publisher, the editors, and the reviewers. Any product that may be evaluated in this article, or claim that may be made by its manufacturer, is not guaranteed or endorsed by the publisher.
References
1. Bernoulli D. Essai d’une nouvelle analyse de la mortalit́e causée par la petite vérole et des avantages de l’inoculation pour la prévenir. Histoire de l’Acad., Roy Sci.(Paris) avec Mém (1760) 1–45. Available at: https://inria.hal.science/hal-04100467v1
2. Pastor-Satorras R, Vespignani A. Epidemic spreading in scale-free networks. Phys Rev Lett (2001) 86:3200–3. doi:10.1103/physrevlett.86.3200
3. Pastor-Satorras R, Castellano C, Van Mieghem P, Vespignani A. Epidemic processes in complex networks. Rev Mod Phys (2015) 87:925–79. doi:10.1103/revmodphys.87.925
4. Li Z, Zhu P, Zhao D, Deng Z, Wang Z. Suppression of epidemic spreading process on multiplex networks via active immunization. Chaos: An Interdiscip J Nonlinear Sci (2019) 29:073111. doi:10.1063/1.5093047
5. Yan G, Chen G, Eidenbenz S, Li N. Malware propagation in online social networks: nature, dynamics, and defense implications. In: Proceedings of the 6th acm symposium on information, computer and communications security (2011). p. 196–206.
6. Keeling MJ, Rohani P. Modeling infectious diseases in humans and animals. Princeton, NJ: Princeton university press (2011).
7. Wang W, Tang M, Stanley HE, Braunstein LA. Unification of theoretical approaches for epidemic spreading on complex networks. Rep Prog Phys (2017) 80:036603. doi:10.1088/1361-6633/aa5398
8. Li W, Xue X, Pan L, Lin T, Wang W. Competing spreading dynamics in simplicial complex. Appl Mathematics Comput (2022) 412:126595. doi:10.1016/j.amc.2021.126595
9. Feng L, Zhao Q, Zhou C. Epidemic spreading in heterogeneous networks with recurrent mobility patterns. Phys Rev E (2020) 102:022306. doi:10.1103/physreve.102.022306
10. Chun H, Kwak H, Eom YH, Ahn YY, Moon S, Jeong H. Comparison of online social relations in volume vs interaction: a case study of cyworld. In: Proceedings of the 8th ACM SIGCOMM conference on Internet measurement (2008). p. 57–70.
11. Zhang N, Yang Q, Zhu X. The impact of social resource allocation on epidemic transmission in complex networks. Appl Mathematics Comput (2022) 433:127405. doi:10.1016/j.amc.2022.127405
12. Gonzalez MC, Hidalgo CA, Barabasi AL. Understanding individual human mobility patterns. nature (2008) 453:779–82. doi:10.1038/nature06958
13. Moreno Y, Pastor-Satorras R, Vespignani A. Epidemic outbreaks in complex heterogeneous networks. The Eur Phys J B-Condensed Matter Complex Syst (2002) 26:521–9. doi:10.1140/epjb/e20020122
14. Zhu X, Wang Y, Zhang N, Yang H, Wang W. Influence of heterogeneity of infection thresholds on epidemic spreading with neighbor resource supporting. Chaos: An Interdiscip J Nonlinear Sci (2022) 32:083124. doi:10.1063/5.0098328
15. Basnarkov L, Tomovski I, Sandev T, Kocarev L. Non-markovian sir epidemic spreading model of covid-19. Chaos, Solitons and Fractals (2022) 160:112286. doi:10.1016/j.chaos.2022.112286
16. Kabir KA, Kuga K, Tanimoto J. Analysis of sir epidemic model with information spreading of awareness. Chaos, Solitons and Fractals (2019) 119:118–25. doi:10.1016/j.chaos.2018.12.017
17. Yavuz M, Özdemir N. Analysis of an epidemic spreading model with exponential decay law. Math Sci Appl E-Notes (2020) 8:142–54. doi:10.36753/mathenot.691638
18. Dorogovtsev SN, Goltsev AV, Mendes JF. Critical phenomena in complex networks. Rev Mod Phys (2008) 80:1275–335. doi:10.1103/revmodphys.80.1275
19. Mata AS, Boguñá M, Castellano C, Pastor-Satorras R. Lifespan method as a tool to study criticality in absorbing-state phase transitions. Phys Rev E (2015) 91:052117. doi:10.1103/physreve.91.052117
20. Cohen R, Havlin S, Ben-Avraham D. Efficient immunization strategies for computer networks and populations. Phys Rev Lett (2003) 91:247901. doi:10.1103/physrevlett.91.247901
21. Kitsak M, Gallos LK, Havlin S, Liljeros F, Muchnik L, Stanley HE, et al. Identification of influential spreaders in complex networks. Nat Phys (2010) 6:888–93. doi:10.1038/nphys1746
22. Marinov TT, Marinova RS. Dynamics of covid-19 using inverse problem for coefficient identification in sir epidemic models. Chaos, Solitons and Fractals (2020) 5:100041. doi:10.1016/j.csfx.2020.100041
23. Rizi AK, Faqeeh A, Badie-Modiri A, Kivelä M. Epidemic spreading and digital contact tracing: effects of heterogeneous mixing and quarantine failures. Phys Rev E (2022) 105:044313. doi:10.1103/physreve.105.044313
24. He ZY, Abbes A, Jahanshahi H, Alotaibi ND, Wang Y. Fractional-order discrete-time sir epidemic model with vaccination: chaos and complexity. Mathematics (2022) 10:165. doi:10.3390/math10020165
25. Ma W, Zhang P, Zhao X, Xue L. The coupled dynamics of information dissemination and seir-based epidemic spreading in multiplex networks. Physica A: Stat Mech its Appl (2022) 588:126558. doi:10.1016/j.physa.2021.126558
26. Li Z, Xiong F, Wang X, Chen H, Xiong X. Topological influence-aware recommendation on social networks. Complexity (2019) 2019:6325654. doi:10.1155/2019/6325654
27. Hu Y, Xiong F, Pan S, Xiong X, Wang L, Chen H. Bayesian personalized ranking based on multiple-layer neighborhoods. Inf Sci (2021) 542:156–76. doi:10.1016/j.ins.2020.06.067
28. Yang Q, Zhu X, Tian Y, Wang G, Zhang Y, Chen L. The influence of heterogeneity of adoption thresholds on limited information spreading. Appl Mathematics Comput (2021) 411:126448. doi:10.1016/j.amc.2021.126448
29. Erdos P, Rényi A, et al. On the evolution of random graphs. Publ Math Inst Hung Acad Sci (1960) 5:17–60. Available at: https://api.semanticscholar.org/CorpusID:18045682
30. Catanzaro M, Boguná M, Pastor-Satorras R. Generation of uncorrelated random scale-free networks. Phys Rev E (2005) 71:027103. doi:10.1103/physreve.71.027103
31. Shu P, Wei W, Ming T, Do Y. Numerical identification of epidemic thresholds for susceptible-infected-recovered model on finite-size networks. Chaos (2015) 25:063104. doi:10.1063/1.4922153
Keywords: epidemic spreading, individual heterogeneous infection threshold, transmission dynamic, complex network, partition theory
Citation: Li F (2024) Dynamics analysis of epidemic spreading with individual heterogeneous infection thresholds. Front. Phys. 12:1492423. doi: 10.3389/fphy.2024.1492423
Received: 06 September 2024; Accepted: 04 November 2024;
Published: 03 December 2024.
Edited by:
Xuzhen Zhu, Beijing University of Posts and Telecommunications (BUPT), ChinaReviewed by:
Yang Tian, Beijing Information Science and Technology University, ChinaShuo He, Zhengzhou University, China
Dandan Zhu, Zhengzhou University of Light Industry, China
Copyright © 2024 Li. This is an open-access article distributed under the terms of the Creative Commons Attribution License (CC BY). The use, distribution or reproduction in other forums is permitted, provided the original author(s) and the copyright owner(s) are credited and that the original publication in this journal is cited, in accordance with accepted academic practice. No use, distribution or reproduction is permitted which does not comply with these terms.
*Correspondence: Feng Li, Y211bGlmZW5nNDU1MTEyQDE2My5jb20=
 Feng Li