- 1School of Health Science and Engineering, University of Shanghai for Science and Technology, Shanghai, China
- 2School of Mechanical Engineering, University of Shanghai for Science and Technology, Shanghai, China
- 3Engineering Research Center of Optic Instrument and System, Ministry of Education, University of Shanghai for Science and Technology, Shanghai, China
- 4School of Optical-Electrical and Computer Engineering, University of Shanghai for Science and Technology, Shanghai, China
In this study, we developed a new method for designing progressive addition-multifocus defocused freeform lenses. We used two independent meridians and achieved a smooth gradient transition of additional optical power from the center to the peripheral area of the lens, along with an asymmetric distribution of additional optical power on the nasal-temporal side of the lens. To improve the optical performance of the lenses, we developed three different designs based on the distribution of the additional optical power on the meridians. We conducted simulations and processing on the three different designs. The lenses designed using improved logistic regression and sine functions for meridian optical power distribution exhibited stable optical performance in the central focus area. They also met the design requirements for additional optical power. However, significant distortion was still observed in the peripheral region, which required further optimization. Lenses designed using piecewise linear functions for meridian optical power distribution exhibited relatively poor optical performance with significant optimization potential. Thus, combining the optical power distribution and surface-type factors for optimization is necessary. The proposed method enabled designing of defocus-free curved mirror lenses that satisfy the optical performance requirements. Thus, this method provides a new approach for the design of progressive addition lenses.
1 Introduction
Myopia is a common refractive error characterized by an elongated eyeball axis or excessive corneal curvature, resulting in blurred vision caused by the focusing of parallel light in front of the retina [1]. Myopia not only disrupts daily lives and learning of the affected but can also lead to ophthalmic complications, such as macular holes, retinal detachment, retinal degenerative diseases, retinal hemorrhage, and even blindness [2]. Thus, it is a major public health issue worldwide. According to the “World Vision Report” released by World Health Organization in 2020, the total prevalence of myopia in high-income countries in the Asia-Pacific region is as high as 50%. With the rapid development of modern technology and an increase in the human development index, the global population was estimated to reach 3.36 billion by 2023. The incidence of myopia in Chinese teenagers exceeds 80%, with nearly 20% of teenagers being highly myopic [3]. The main methods for treating myopia in teenagers are wearing frame-style glasses for correction and surgery for normalizing the refractive ability of the eye [4].
In recent years, an increasing number of young people have chosen to use eyeglasses that control peripheral defocus (such as multifocal contact lenses and peripheral defocus myopia-control lenses) to manage the progression of myopia [5]. Long-term exposure to hyperopic defocus can accelerate the development of myopia, whereas exposure to myopic defocus can delay its progression [6]. Few theoretical studies support this view from two perspectives. According to the experiments conducted by Smith [7] and Lin [8] on rhesus monkeys and population, respectively, peripheral hyperopic defocus on the retina induces axial elongation and increases myopia. In addition, according to many researchers, including [9], the accommodative sensitivity of myopic children is significantly lower than that of emmetropic children. Compared to contact lenses, eyeglasses with peripheral defocus frames are convenient, noninvasive, and have wider adaptability and fewer adverse reactions. This makes them suitable for young people who cannot adapt to contact lenses or have low myopia or flat corneal curvature [10]. Currently, many types of peripheral defocus lenses are available in the market, such as defocus incorporated multiple segments (DIMS) lenses and concentric ring bifocal micro-prism defocus lenses [11]. DIMS lenses [12] have a 9 mm central focus area surrounded by multiple small lenses that induce myopic defocus, providing good adaptability. The concentric ring bifocal microprism defocus lenses [13] manage myopia through the structure of microprism lenses, which creates high-order aberrations to inhibit axial elongation and delay myopia progression.
According to Laura [14], the population at the greatest risk of myopia progression has asymmetric retinas, that is, the optical characteristics and morphology of the nasal and temporal areas of the retina are different [15]. Therefore, research on the asymmetric design of defocusing lenses is important. Starting with the design method of progressive addition freeform surfaces [16–19], in this study, we optimized a new defocus freeform surface. To obtain a meridian line, we divided the surface into the nasal and temporal zones and connected the central focus area of the two zones to the central point of the myopic defocus area. The optical power change law at each point on the meridian line was determined separately, and the focal light distribution of the entire surface was directly generated by specifying the curve intersecting the meridian line. Next, optical power optimization was performed on the entire surface for smoothness. Finally, the surface shape was calculated. This method can achieve an asymmetric distribution of the light focal length on freeform surfaces while ensuring a smooth transition of the light focal length from the central focus to peripheral defocus area of the lens. It provides excellent optical performance and ensures the comfort of the wearer. In the second section, the design principles of the peripheral defocus freeform surface are explained, and in the third section, simulation processing examples are presented to validate the design.
2 Principle of optimal design method
2.1 Design of the optical power of the defocus freeform surface lenses
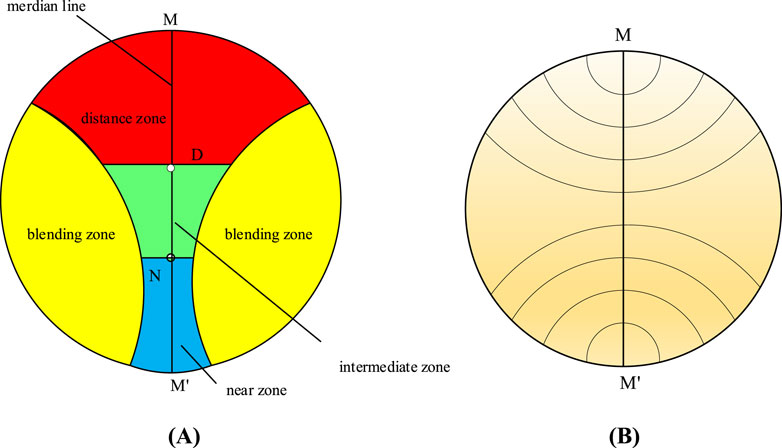
Progressive multifocal freeform surfaces are widely used in the design of progressive addition lenses (PALs) that provide variable optical power for different viewing zones [16]. As shown in Figure 1A, 7PALs are primarily divided into four zones: distance, near, intermediate, and blending [17]. The optical power gradually and smoothly increased along the meridian line of the lens; the gradient of increase started from the distance-vision area at the top of the lens and reached the maximum addition power (ADD) at the near-vision area at the bottom of the lens. In the figure, MM’ represents the meridian line, while points D and N represent the distance and near reference points. In the design concept of progressive multifocal lenses [18], the design of optical power along the meridian line determines the optical power distribution on the entire lens surface. Therefore, a smooth transition function was used along the meridian line to achieve a change in the optical power from the distance to near zone. In addition to designing the optical power along the meridian line, progressive lens designers use a set of contour lines intersecting the meridian line to diffuse the optical power change along the meridian line to the entire surface [20]. The optical power on the contour lines was consistent with that at the contour–meridian line intersection points, as shown in Figure 1B. After obtaining the optical power distribution on the entire surface, calculations, simulations, and manufacturing processes for the lens shape were conducted, and a finished progressive lens was obtained. The design process is illustrated in Figure 2.
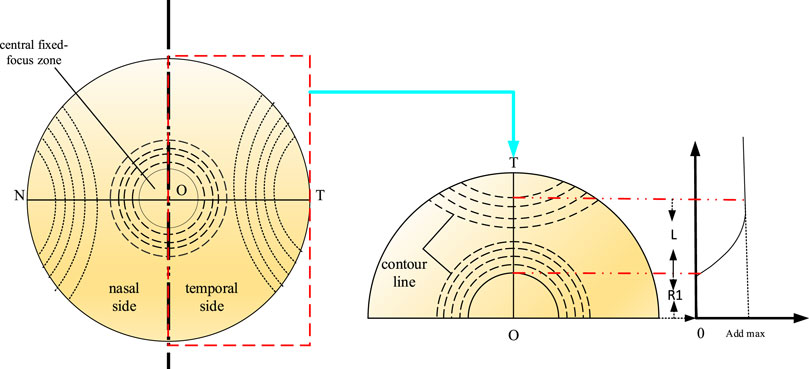
Unlike progressive multifocal freeform surfaces, defocused freeform surfaces consist of central focusing and peripheral defocused areas. The central focusing area provides a constant negative diopter, whereas the peripheral defocused area provides additional power relative to the central focusing area (defocus amount). However, this design fundamentally involves the transition of power from one focus area to another, which can be controlled using meridians. To achieve an asymmetric power distribution between the nasal and temporal sides of the defocused freeform surface, we used two meridians and controlled the power variations on each side, as shown in Figure 3. ON and OT represent the nasal and temporal meridians, respectively, which control the power changes on the nasal and temporal sides of the freeform surface. Viewing each area as a separate gradient power freeform surface and taking the temporal side as an example, the central focusing area on the temporal side has a constant negative diopter but with zero additional power. The additional power smoothly increased along the meridian OT until it reached the maximum additional power, and then stabilized. Subsequently, the power variations on the meridian diffused to the temporal side of the surface through a cluster of contour lines intersecting the temporal meridian. Here, OT = ON = R, where R represents the radius of the freeform surface, and L is the length of the section where the additional power gradually increases along the meridian.
To achieve the variation in light focus on the meridian (Figure 3), we used a relatively simple linear segmented function (Equation 1) and a sine function (Equation 2).
where d represents the distance from a point to origin O of the meridian line; Add is the additional optical power at a distance d from the origin; m is the additional optical power in the central focusing area, usually set to 0; and Add max represents the maximum additional optical power value. While the two functions above can achieve a gradual change in the additional optical power, the nondifferentiable parts existing in the functions may affect the smooth change in the additional optical power. Among commonly employed functions, the logistic regression function (Equation 3) exhibits smoothness, continuity, and high-order differentiability within its domain. Notably, its rates of change are gradual at both extremes. This characteristic renders it particularly advantageous for the design of meridians, facilitating enhanced stability of the central focusing area of the free-form surface. Therefore, we developed an improved logistic regression function (Equation 4) to fit the change in additional optical power on the meridian line.
where A is the curve control coefficient, and b is the curve translation coefficient. Three types of meridian light-focusing functions were obtained, with the parameters set as nasal Add max = 1.5D, temporal Add max = 2.0D (commonly used values of additional optical power), central focusing zone additional light focus m = 0, R = 30 mm, R1 = 6 mm, L = 18 mm, A = 0.7, and b = 10. This resulted in specific changes in light focusing for the nasal and temporal meridians, as shown in Figures 4A, B, respectively, with specific contour line settings, as shown in Figure 4C.

Figure 4. (A) Three types of functions design nasal meridian optical focus map (B) Three types of functions design temporal meridian optical focus map; (C) Defocused freeform surface contour map.
2.2 Calculated surface shape
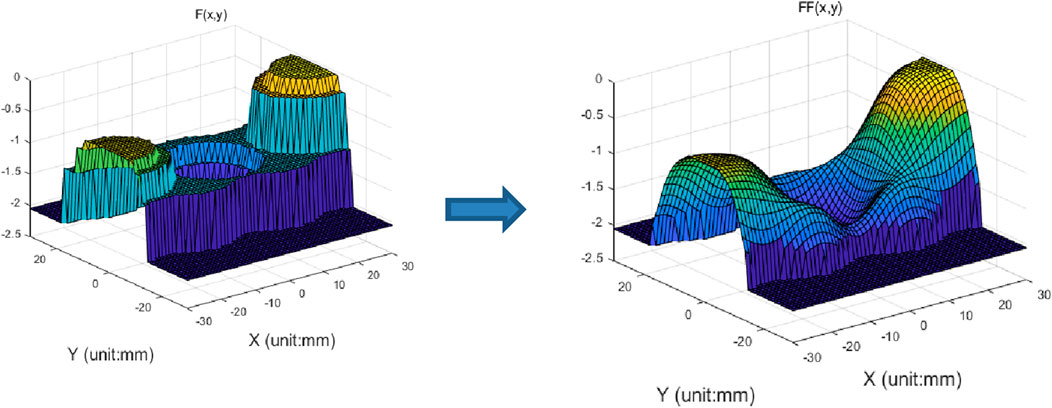
After obtaining the additional optical power distribution on the two meridians and the contour line distribution of the surface, the additional optical power distribution
where M is the optical power of the central fixed-focus zone, which is a constant. As the freeform surface was independently designed for the nasal and temporal sides and the contour line density was limited, the optical power variation across the entire freeform surface was still not sufficiently smooth. Therefore, the interpolation of the optical power distribution across the entire freeform surface is necessary. The interpolated optical power distribution is denoted as
After obtaining the interpolated optical power distribution
where n is the refractive index of the lens that depends on the material used to manufacture the free-form lens.
Before calculating the surface shape, it is essential to recognize that there are two key parameters associated with the surface shape
And the astigmatism is defined as Equation 8:
Next, we determined an optimal surface shape solution that maximized the closeness of the mean curvature distribution of the surface to the expected mean curvature distribution and minimized unnecessary astigmatism on the surface to the greatest extent possible. We constructed a loss function to obtain the optimal solution for the surface shape by minimizing the loss function as Equation 9
where
To obtain the surface shape
The perturbation surface takes the form of an aspheric freeform surface controlled by weighting functions and the desired mean curvature. The reference surface is typically a standard spherical surface; its shape is defined by Equation 11, where R is the curvature radius of the given spherical surface and its value is determined by Equation 12. In Equation 12, B represents the front surface power of the designed lens. Next, we specified three boundary conditions forthe surface as Equation 13:
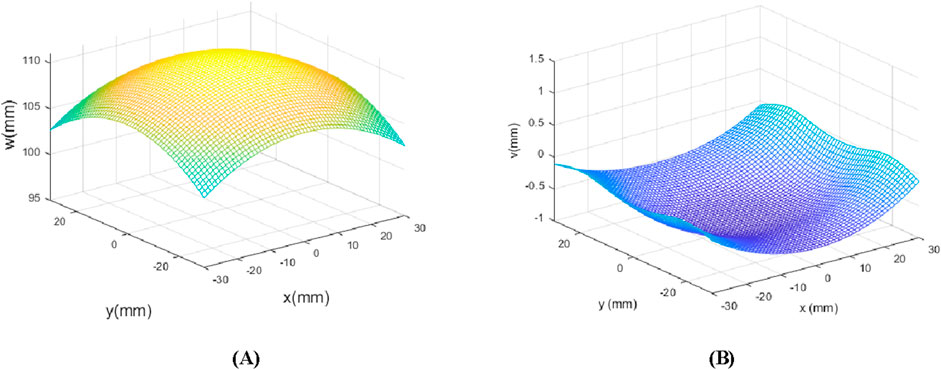
The process of solving the freeform surface height matrix using least squares is given by the Equation 14:
The optical power M of the central fixed-focus zone, front surface power of the lens, and matrix size N were assumed as -2D, 3.43D, and 60, respectively. The thus-obtained base surface
3 Results and discussion
3.1 Optical simulation
For the linear segmented function (Section 2.1) to design the meridian optical power, the solved freeform surface was used for the lens design (Lens 1 in this design instance). The design parameters of Lens 1 are listed in Table 1.
The optical power and astigmatism of Lens 1 were simulated, as shown in Figure 7.
According to the simulation results of the optical power and astigmatism, the astigmatism in the central fixed-focus zone of Lens 1 was slightly higher. In addition, the additional optical powers on the nasal and temporal sides differed significantly from the expected values. This indicated a room for optimization when using linear segmented functions to design meridian optical powers.
For the method (Section 2.1), which uses sine functions to design meridian optical powers, the solved freeform surface was used for the designing Lens 2. The design parameters for Lens 2 are listed in Table 2.
The optical power and astigmatism of Lens 2 were simulated, as shown in Figure 8.
Based on the simulation results, Lens 2 (designed using sine functions for meridian optical powers) showed a relative reduction in astigmatism in the central fixed-focus zone and surrounding areas. The optical power in the central fixed-focus zone satisfied the requirements of the Chinese National Standard [21] GB 10810.1–2005″Ophthalmic Optics - Spectacle Lenses Part 1: Single Vision and Multifocal Lenses.” The additional optical power on the nasal and temporal sides met the expected requirements. Therefore, it can be considered as a relatively good design. However, owing to the nondifferentiable points in the original meridian function, a significant gradient was observed in the additional optical power from the center to the sides of the lens.
For the method (Section 2.1), which uses logistic regression functions to design meridian optical powers, the solved freeform surface was used for the designing Lens 3. The design parameters for Lens 3 are listed in Table 3.
The optical power and astigmatism of Lens 3 were simulated, as shown in Figure 9.
From the simulation results, Lens 3 (designed using an improved logistic regression function for meridian optical powers) exhibited ideal optical power and astigmatism in the central fixed-focus zone. The additional optical power around the central fixed-focus zone exhibited a smoother and more gradual variation. The additional optical power on the nasal and temporal sides also satisfied the design requirements. However, Lenses 3 and 2 exhibited excessive peripheral astigmatism.
3.2 Processing and analysis
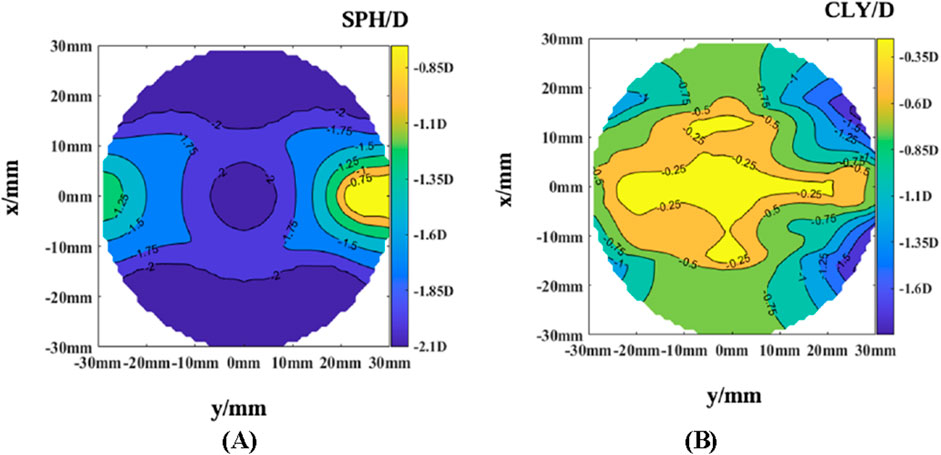
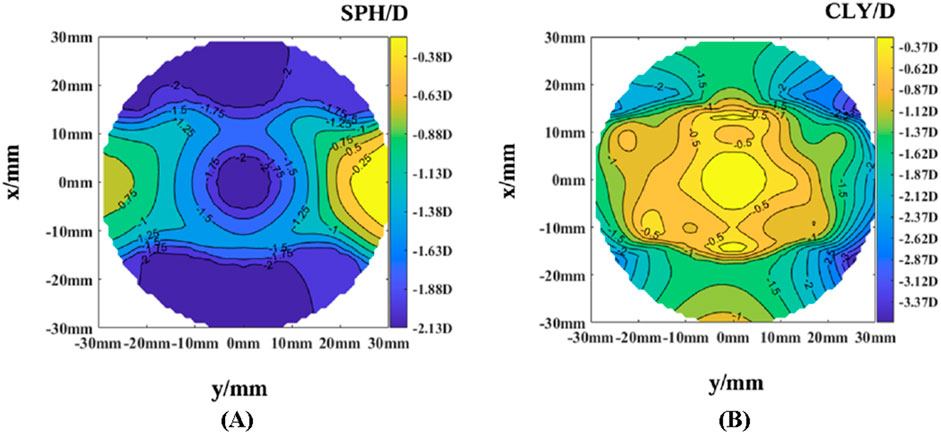
To verify the optical performance of the designed freeform surfaces, the three sets of freeform lenses (Lenses 1–3) were processed and tested. Initially, various processes, such as turning, milling, grinding, and polishing, were conducted on the freeform lenses using the freeform machining equipment Satisloh VFT-orbit provided by Mingyue Optical Co., Ltd. The lenses were measured using a VM2000 freeform measurement instrument to obtain their optical power and astigmatism distributions, as shown in Figures 10, 11.
Simultaneously, using a focimeter, following parameters of the physical lenses were measured (Table 4): the actual center optical power (Center SPH), center astigmatism (Center CYL), actual maximum additional optical power on the nasal side (Actual NADD), and actual maximum additional optical power on the temporal side (Actual TADD).
According to the comprehensive data in Table 4 and Figures 10, 11, all three lenses exhibited relatively good optical performance. The center optical power error in the center focus area of the three lenses did not exceed 0.25D, and astigmatism was also within 0.25D. Astigmatism was predominantly concentrated in the four corners of the lens periphery. Lens 1, designed with meridian optical powers using a linear segmented function, showed sparse astigmatism gradients on the defocused freeform surface. However, the center power deviated from the expected design by 0.14D, and the astigmatism in the center focus area exceeded 0.12D, potentially affecting comfort. The reason for this phenomenon may be that the meridian function of Lens 1 is not smooth at the edges of the center focus area, which leads to significant errors in the astigmatism and optical power of the lens in the center focus area during subsequent calculations. Moreover, the additional optical power in the peripheral areas of the lens exhibited errors of ˃0.5D, indicating significant room for optimization for this design method. Lens 2, designed using sine functions for meridian optical powers, exhibited a center optical power deviation of 0.05D from the expected values, with astigmatism values at −0.05D. The maximum additional optical power errors on the nasal and temporal sides were <±0.06D, complying with the requirements of the national standard (GB10810.1–2005). However, this design showed localized areas of excessive astigmatism in the lens periphery. Lens 3, designed using an improved logistic regression function for meridian optical powers, showed a center optical power deviation of 0.04D from the expected values, with astigmatism values at −0.05D. The maximum additional optical power errors on the nasal and temporal sides were −0.05D and −0.04D, respectively. It also satisfied the requirements of the national standard (GB10810.1–2005). Compared to the second design method, this approach exhibited smaller astigmatism in adjacent areas around the center and a sparser gradient of astigmatism in the center area, potentially offering better comfort. However, similar to other designs, the localized areas of excessive astigmatism in the periphery indicated the need for further optimization. Through the discussion of the fabrication results of the three lenses and the introduction of the three design methods in the previous sections, we can derive Table 5, which clearly illustrates the advantages and disadvantages of the lenses obtained from the three design approaches. The table shows that although the design method of Lens 1 has lower peripheral astigmatism, it has a larger Add error and unstable optical performance in the central region. In contrast, the design methods of Lens 2 and Lens 3 have larger peripheral astigmatism but exhibit smaller Add errors. Furthermore, compared to the design method of Lens 2, Lens 3 has better optical performance in the central region. Therefore, in the actual design process, we are more inclined to choose the design method of Lens 3.
4 Conclusion
This study was based on the design approach of progressive multifocal freeform lenses. We established a new concept for designing asymmetric defocus freeform lenses. Initially, the desired distribution of the mean curvature of the freeform surface was determined. This distribution was incorporated into a loss function related to the average principal curvatures and their difference on the freeform surface, which was minimized to obtain the surface heights of the freeform lens. In this study, we designed two meridians with different levels of optical power variation on the nasal and temporal sides of the freeform surface to achieve an asymmetric distribution of additional optical power. Furthermore, to achieve a smooth transition of additional optical power between the central fixed-focus zone and peripheral defocused zones of the freeform surface, along with basic linear segmented and sine functions, we introduced an improved logistic regression function in the design of the meridian optical power variation. Finally, lenses designed using these three functions were analyzed using optical simulation software, and they were manufactured and quality-tested using freeform machining equipment to validate experimental results. Based on the study findings, in subsequent lens design efforts, to address the issue of significant astigmatism observed in lens 2 and 3, one approach involves superimposing an additional surface with a negative Add onto the existing surface, aiming to counteract a portion of the unwanted astigmatism in the peripheral regions. Alternatively, the lens surface profile could be refined through re-interpolation techniques to reduce peripheral astigmatism, thereby enhancing the optical performance of lens 2 and 3. Then, future research should also focus on further optimizing the design methods for meridian optical powers and investigate more effective mathematical functions or technical methods to enhance the optical performance of freeform lenses and achieve a superior design.
Data availability statement
The original contributions presented in the study are included in the article/supplementary material, further inquiries can be directed to the corresponding author.
Author contributions
HX: Conceptualization, Data curation, Investigation, Methodology, Software, Validation, Writing–original draft, Writing–review and editing. LM: Data curation, Investigation, Methodology, Software, Writing–original draft. XZ: Supervision, Validation, Writing–review and editing. HC: Supervision, Validation, Writing–review and editing. ZZ: Supervision, Validation, Writing–review and editing. JC: Supervision, Validation, Writing–review and editing. CW: Software, Supervision, Validation, Writing–review and editing. DZ: Supervision, Validation, Writing–review and editing. SZ: Supervision, Validation, Writing–review and editing.
Funding
The author(s) declare that financial support was received for the research, authorship, and/or publication of this article. This work was supported by the National Science Foundation for Young Scholars of China (61605114, 52206102).
Acknowledgments
Manufacturing and measuring equipment were provided by Jiangsu Mingyue Photoelectric Technology Co. Ltd. The authors would like to thank Qihang Zhou for useful discussions about this problem.
Conflict of interest
The authors declare that the research was conducted in the absence of any commercial or financial relationships that could be construed as a potential conflict of interest.
Publisher’s note
All claims expressed in this article are solely those of the authors and do not necessarily represent those of their affiliated organizations, or those of the publisher, the editors and the reviewers. Any product that may be evaluated in this article, or claim that may be made by its manufacturer, is not guaranteed or endorsed by the publisher.
References
1. Yang ZK. Causes and prevention strategies of myopia. China Glasses Tech J (2018)(17) 102–5. doi:10.3969/j.issn.1004-6615.2018.17.042
2. Yang S, Xie X, Zhang J, Huang Y. Review of risk factors and intervention of myopia in childrenand adolescents. J Clin Nurs Res (2021) 5(2). doi:10.26689/JCNR.V5I2.1930
3. Wu Y, Kou J, Lei S, Xiong L, Chen Q, Zhang M, et al. Effect of individualized ocular refraction customization SpectacleLens wear on visual performance in myopic Chinese children. Translational Vis Sci Technol (2024) 13(6):21. doi:10.1167/TVST.13.6.21
4. Zhang Q, Huang S, Lian Z. Research progress on the prevention, treatment, and care of myopia. Chin J Traditional Chin Med Ophthalmol (2021) 31(03):211–4. doi:10.13444/j.cnki.zgzyykzz.2021.03.014
5. Tena S, Cleva M, Collar VC. Effectiveness of a spectacle lens with a specific asymmetric myopic peripheral defocus: 12-month results in a Spanish population. Children (2024)(2) 11. doi:10.3390/CHILDREN11020177
6. Ma J, Tian S, Liu QP. Effectiveness of peripheral defocus spectacle lenses in myopia control: a Meta-analysis and systematic review. Int J Ophthalmol (2022) 15(10):1699–706. doi:10.18240/IJO.2022.10.20
7. Smith EL, Hung L, Huang J, Arumugam B. Effects of local myopic defocus on refractive development in monkeys. Optom Vis Sci : official Publ ofthe Am Acad Optom (2013) 90(11):1176–86. doi:10.1097/OPX.0000000000000038
8. Lin Z, Vasudevan B, Liang Y, Zhang YC, Qiao LY, Rong SS, et al. Baseline characteristics of nearwork-induced transient myopia. Optom Vis Sci (2012) 89(12):1725–33. doi:10.1097/opx.0b013e3182775e05
9. Sreenivasan V, Irving EL, Bobier WR. Effect of near adds on the variability of accommodative response in myopic children. Ophthalmic Physiol Opt (2011) 31:145–54. doi:10.1111/j.1475-1313.2010.00818.x
10. Wang Q, Lv G. Comparison of myopia control effect of orthokeratology lens, multi-zone forward optical defocusing glasses and single-focal frame glasses. Int J Ophthalmol (2019) 23(11):1891–5. doi:10.3980/j.issn.1672-5123.2023.11.24
11. Zhao X. About defocusing lenses. China J Opt Sci Tech (2024)(3) 83–5. doi:10.3969/j.issn.1004-6615.2024.03.020
12. Lam C, Tang W, Tse D, Lee R, Chun RKM, Hasegawa K, et al. Defocus Incorporated Multiple Segments (DIMS) spectacle lenses slow myopia progression: a 2-year randomised clinical trial. Br J Ophthalmol (2020) 104(3):363–8. doi:10.1136/bjophthalmol-2018-313739
13. Wang Y, Lv X, Wang L. Common myopia prevention and control from the present situation and thinking of the focal lens. J glass enamel glasses (2023)(09) 38–43. doi:10.13588/j.cnki.g.e.2096-7608.2023.09.007
14. Laura M. Lentes oftálmicas para el control de la miopía. BS thesis (2022). Universidad de Santiago de Compostela.
15. Yelagondula V, Achanta D, Panigrahi S, Panthadi S, Verkicharla P. Asymmetric peripheral refraction profile in myopes along the horizontal meridian. Optom Vis Sci (2022) 4:350–7. doi:10.1097/OPX.0000000000001890
17. Winthrop JTinventor; American Optical Corporation, assignee. Progressive addition spectacle lens. United States patent US4861153 (1989).
18. Baudart T. inventor; Essilor International, assignee. Multifocal ophthalmic lens. United States patent US6102544 (2000).
19. Loos J, Greiner G, Seidel HP. A variational approach to progressive lens design. Computer-Aided Des (1998) 30(8):595–602. doi:10.1016/s0010-4485(97)00102-4
20. Zhan X, Xiang HZ, Wang Y. Design of progressive addition lenses based on conic parametric equations. Acta Optica Sinica (2023) 43(07):190–8. doi:10.3788/AOS231811
21. General Administration of Quality Supervision. Inspection and quarantine of the People′s Republic of China, standardization administration of the People′s Republic of China. In: Uncut finished spectacle lenses: part 1: single-vision and multifocal lenses: GB 10810.1—2005. Beijing: Standards Press of China (2006).
Keywords: freeform surface, defocus lens, optical power, astigmatism, optimization
Citation: Xiang H, Ma L, Zhang X, Cheng H, Zheng Z, Chen J, Wang C, Zhang D and Zhuang S (2024) Research on the design of progressive addition multifocal defocused freeform lenses. Front. Phys. 12:1481543. doi: 10.3389/fphy.2024.1481543
Received: 16 August 2024; Accepted: 14 October 2024;
Published: 24 October 2024.
Edited by:
Jun Zhu, Tsinghua University, ChinaReviewed by:
Xianglong Mao, Chinese Academy of Sciences (CAS), ChinaQun Yuan, Nanjing University of Science and Technology, China
Copyright © 2024 Xiang, Ma, Zhang, Cheng, Zheng, Chen, Wang, Zhang and Zhuang. This is an open-access article distributed under the terms of the Creative Commons Attribution License (CC BY). The use, distribution or reproduction in other forums is permitted, provided the original author(s) and the copyright owner(s) are credited and that the original publication in this journal is cited, in accordance with accepted academic practice. No use, distribution or reproduction is permitted which does not comply with these terms.
*Correspondence: Huazhong Xiang, eGlhbmczODQ1MjQyQDE2My5jb20=
 Huazhong Xiang
 Lefei Ma1
 Cheng Wang