- 1Chitkara University Institute of Engineering and Technology, Chitkara University, Rajpura, Punjab, India
- 2Department of Computer Science, College of Computer and Information Sciences, King Saud University, Riyadh, Saudi Arabia
- 3Department of Natural and Engineering Sciences, College of Applied Studies and Community Services, King Saud University, Riyadh, Saudi Arabia
- 4School of Computing, Gachon University, Seongnam-si, Republic of Korea
The segmentation of gastrointestinal (GI) organs, including the stomach, small intestine, and large intestine, is crucial for radio oncologists to plan effective cancer therapy. This study presents an innovative semantic segmentation approach that integrates the Swin Transformer Block with the U-Net model to delineate healthy GI organs accurately using MRI data. The paper presents a novel approach that merges the Swin Transformer and U-Net models to leverage global context learning capabilities and fine-grained spatial resolution. Incorporating this integration greatly enhances the model’s capacity to achieve precise and comprehensive semantic segmentation, specifically in accurately outlining the gastrointestinal tract in MRI data. It utilizes the Swin Transformer, incorporating a shift-based windowing technique to gather contextual information efficiently while ensuring scalability. This novel architecture effectively balances local and global contexts, improving performance across various computer vision tasks, especially in medical imaging for segmenting the gastrointestinal tract. The model was trained and tested on the UW Madison GI Tract dataset, which comprises 38,496 MRI images from actual cancer cases. By leveraging the self-attention mechanisms of the Swin Transformer to capture global context and long-term dependencies, this approach combines the strengths of both models. The proposed architecture achieved a loss of 0.0949, a dice coefficient of 0.9190, and an Intersection over Union (IoU) score of 0.8454, demonstrating its effectiveness in providing high accuracy and robust performance. This technology holds significant potential for integration into clinical processes, enhancing the precision of radiation therapy for GI cancer patients.
1 Introduction
Gastrointestinal cancers include cancers of the colon, liver, stomach, and esophagus, which are the most common and deadly in the world [1]. They are a substantial source of health burden, especially among older men, and have led to high mortality rate around the globe. GLOBOCAN, the International Agency for Research on Cancer reported that cancer remains one of the most common diseases and causes of death, accounting for around 1.93 million new cases in 2020 and 900,000 deaths. The statistics unveil essential issues that should be urgently addressed through preventive measures, proper early detection methods, and better treatment protocols to mitigate the global burden of cancer [2].
The treatment of GI cancers is generally wide-ranging and based on the type of cancer. For example, patients who have colon cancer often experience surgical intervention, chemotherapy, or radiation therapy [3, 4]. To be more specific, among the three, it tends to be central with the position of being more dominant because it utilizes high-energy X-rays to eliminate cancer cells [4]. Radiation therapy poses a significant challenge in the GI tract. It enables radiation oncologists to reach nearer the cancer cells without affecting the rest of the healthy tissues [5, 6]. Determining tumor size and location helps to optimize treatment plans by giving a higher radiation dose to cancerous tissues, thus providing an effective and targeted approach. Segmentation further allows for easy follow-up of the treatment response, where clinicians can analyze changes in the affected organs’ size and shape during therapy [7, 8].
There has been a revolution in clinical practice over the past decade with the appearance of deep learning as a drastically transforming tool, mainly in the diagnostic space of medical imaging [9, 10]. Techniques like image classification, object recognition, and segmentation have dramatically improved disease diagnosis and treatment planning, thus increasing the accuracy and personalization of patient care [11, 12]. CNN and U-Net architectures shown as deep learning models exhibited auspicious performance in segmenting small intestines, large intestines, and stomachs from MRI scans [13, 14]. This considerable dataset training facilitates the models to recognize and outline segments of disease areas, enabling clinicians to establish relevant information for early detection, treatment, and follow-up monitoring [15–17].
This study introduces a novel deep-learning model that integrates Swin Transformer Blocks and U-Net architecture for the semantic segmentation of GI structures, explicitly targeting the small intestine, large intestine, and stomach. The model leverages the strengths of U-Net, which is optimized for segmentation tasks, and Swin Transformer, which effectively captures global context and pixel relationships within images. Our model achieves highly detailed and precise segmentation by combining these two approaches. The proposed model holds potential for significant clinical applications, enhancing the ability to accurately identify anatomical structures and improving diagnostic, therapeutic, and follow-up capabilities in GI cancer management. This research effort makes significant contributions as follows:
• The paper presents a novel approach that merges the Swin Transformer and U-Net models to leverage global context learning capabilities and fine-grained spatial resolution. Incorporating this integration greatly enhances the model’s capacity to achieve precise and comprehensive semantic segmentation, specifically in accurately outlining the gastrointestinal tract in MRI data.
• The paper utilizes the Swin Transformer, incorporating a shift-based windowing technique to gather contextual information efficiently while ensuring scalability. This novel architecture effectively balances local and global contexts, improving performance across various computer vision tasks, especially in medical imaging for segmenting the gastrointestinal tract.
• The U-Net architecture captures intricate details and preserves spatial information. The model effectively integrates context data and high-resolution information by utilizing skip connections, resulting in accurate localization of object boundaries.
The following outlines the later parts of this study: Section 2 summarizes the literature work, and Section 3 addresses the input dataset. Section 4 elaborates on the proposed Integrated Swin Transformer U-Net Model, Section 5 represents the results, Section 6 offers a comparative investigation of the proposed model with state-of-the-art outcomes, and Section 7 presents the conclusion.
2 Literature work
Many medical imaging researchers have used deep learning architectures to build segmentation and classification models for the gastrointestinal system. Ganz et al. [18] developed software based on narrow-band imaging (NBI) data to differentiate polyps autonomously. The proposed model outperforms previous algorithms for automatically segmenting 87 images. Wang et al. [19] developed a technique named “Polyp-Alert” to support endoscopists in locating polyps during colonoscopy. By monitoring the detected polyp edge(s), the method aggregates images of the same polyp(s) in one shot. Vázquez et al. [20] provided an enlarged segmentation dataset intending to create a novel robust norm for research into colonoscopy image analysis. The proposed dataset includes four relevant classifications for evaluating the endoluminal scene, each serving a different therapeutic need. Using the dataset, the authors train conventional fully convolutional networks (FCNs) to construct new baselines.
Brandao et al. [21] described a DL-based segmentation algorithm for identifying lesions in colonoscopy images. Shape-from-shading is also used to provide a more comprehensive picture of tissues. Depth is introduced as an extra input passage to the RGB data in their network models, and the resulting network performs better. The segmentation model got an IoU of 48%, producing an IoU of 56.95% on the CVC-Colon dataset. Dijkstra et al. [22] described a one-step method for detecting polyps. The approach leverages an FCNN model for segmenting polyp. They tested the proposed network on different datasets, and their outcomes were promising.
Banik et al. [23] offered a multiscale patch network for automatic polyp area segmentation. The patches are then concatenated for precise polyp area pixel label annotation. The proposed model was validated using the CVC-Clinic DB. Wang et al. [24] created a multiscale MCNet for segmentation of GI Tract endoscopic images, using global and local contexts as training guidance. One global subnetwork determines each input image’s worldwide structure. They then build two cascaded local subnetworks based on the worldwide subnetwork’s output feature maps to collect regional appearance. Three subnetworks learn feature maps concatenated for the lesion segmentation task. Galdran et al. [25] described a new approach for gastrointestinal polyp delineation using an encoder-decoder approach. In the proposed method, pre-trained encoder-decoder architecture was successively joined. Sharma et al. [26] used an encoder and a standard U-Net architecture. More sophisticated algorithms with remarkable performance in various classification contexts are available. One can encode these models to generate a distinctive U-Net design and improve output. Ye et al. [27] proposed SIA-UNet, a modified network including MRI sequence information. Extensive studies on the UWM database were conducted to evaluate the suggested model. Chou et al. [28] employed Mask R-CNN along with U-Net techniques to distinguish the GI parts. Sharma et al. [29] suggested a model that is a U-Net design built from the ground up and utilized for image segmentation.
Li et al. [30] examined and combined several 2.5D data creation strategies to make the most of the images and proposed a 2.5D feature combination approach with adjacent weighting. Their solution integrates several representation processes by deeply combining multidimensional convolutions into fundamental modules. Extensive experiments on a publically accessible GI database show that the 2.5D combination strategy outperforms the 2.5D method devoid of feature combination by 0.36% on dice and 0.12% on Jaccard. Using two methods—a UNet and a ResNet50 encoder—and a sparser UNet—Chia et al. [31] look at FiLM, a technique for leveraging pixel width and height picture data to improve UNet design. Using the variety of methods of the ensemble, Georgescu et al. [32] offered a fresh strategy for building ensembles of different medical picture segmentation architectures. Choosing the structures with the highest scores reveals that DiPE surpasses several designs and ensemble-building approaches.
3 Input dataset
The UW Madison GI tract dataset is employed in the proposed study. The University of Wisconsin has released the dataset, which is available on the Kaggle platform [33]. The collection contains 38,496 MRI scans of the GI tract for actual cancer patients.The ground truth of the dataset is in RLE format (Run Length Encoding), so the ground truth mask is created using RLE decoding. The segmentation mask is divided into three classes: small bowel, large bowel, and stomach. The size of the images in a dataset is not same for all the images, so the dataset has been resized to make all the images of same size. The input size for the images is set to 240 × 240. Table 1 displays some dataset’s sample images and corresponding ground truth masks. Figures 1A, B show two MRI images. In contrast, Figures 1C, D show the ground truth masks, with yellow representing the large bowel, green representing the small bowel, and red representing the stomach. The dataset has been separated in the ratio of 70:15:15 for train, testing, and validation, respectively.
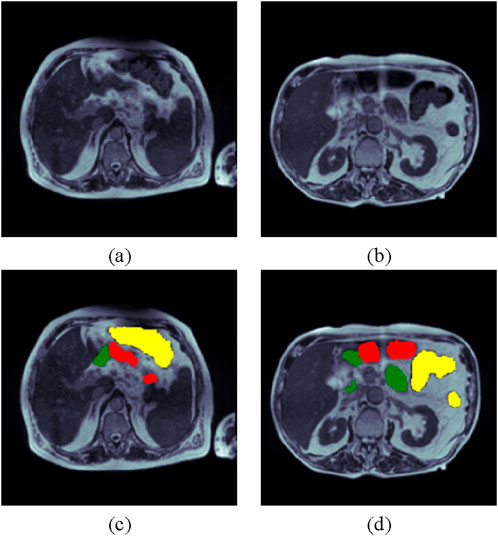
Figure 1. UW Madison GI Tract Dataset (A) and (B) Input Images and (C) and (D) Respective Ground Truth Masks (yellow color shows the large intestine, green shows the small intestines, and red meaning the stomach).
4 Proposed integrated swin transformer U-Net model for GI tract segmentation
The proposed Integrated Swin Transformer U-Net Model combines the Swin Transformer design, a breakthrough in computer vision [34], with the U-Net model [35], which is well-known for its segmentation capabilities. Combining UNet with the Swin Transformer gives the benefits from both the fine-grained spatial resolution of UNet and the high-level context information of the Swin Transformer. With its unique U-shaped topology, the combination of a contracting path for context, and an extensive method for accurate localization, the U-Net architecture captures minute details. Conversely, the Swin Transformer retains localized detail extraction rapidly and adds sliding windows (hence “Swin”) to capture broader context. The Swin Transformer is advantageous over pure transformers for vision tasks due to its hierarchical feature learning and computational efficiency. Using shifted windows to capture localized self-attention reduces the quadratic complexity of processing entire images, making it more scalable and manageable for high-resolution inputs. This “shifted window” mechanism also enables Swin Transformers to capture fine-grained details and global context as information flows between neighboring windows across layers. This combination of localized and global attention makes Swin Transformers particularly effective for image segmentation, where understanding both local structures and overall context is crucial, providing a balanced and efficient approach that pure transformers lack.
Here, employing self-attention techniques to grasp the global context and long-term relationships of images, the Swin Transformer Block and U-Net model have been constructed to combine their capabilities. Its unique feature allows it to combine international academic content with local inference. The proposed model includes three main components: encoder, bottleneck layer, and decoder. In the encoder, decoder, and bottleneck part of the U-Net model, Swin transformer blocks are used to gradually reduce the spatial dimension while increasing the complexity of the received data. Between the encoder’s downsampling and the decoder’s upsampling, the bottleneck layer refines and compresses the coding features, thus allowing us to know how much information flows through the network. The U-Net model’s decoder component improves features gathered during the encoding phase, enabling the network to record fine-grained data. A detailed description of the encoder, decoder, and bottleneck block of the proposed model is given in the following sections.
4.1 Swin transformer
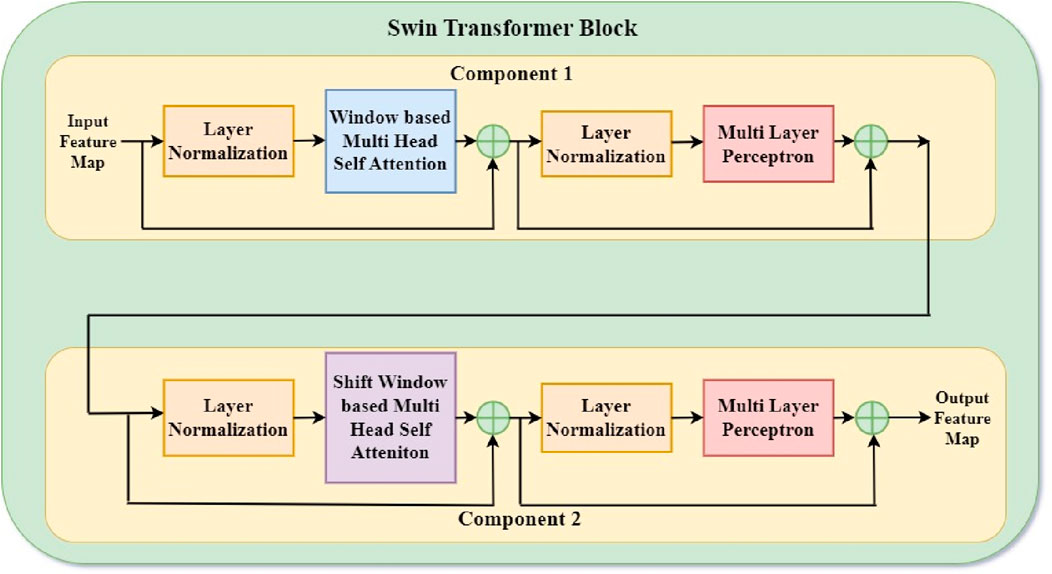
The Swin Transformer block, a vital component of the Swin Transformer architecture, presents a shift-based windowing technique to gather contextual information quickly while retaining scalability. The model’s name, “Swin”, is derived from Shifted Windows, which divides the image into non-overlapping windows and applies the attention mechanism within them. To capture relationships between windows, they are shifted in successive layers. This enables the model to capture local and global context without requiring the whole attention mechanism to cover the entire image. Figure 2 shows the Swin transformer block arrangements. Figure 2, comprising component 1 and component 2, leverages a hierarchical structure for effective image processing. Component 1 initiates with Layer Normalization (LN) to standardize input features, followed by Window-based Multi-head Self-Attention (W-MSA) for capturing local dependencies in a windowed context. Subsequent Layer Normalization ensures stability, and a Multi-Layer Perceptron (MLP) extracts complex features. Component 2 maintains this pattern with LN for normalization, Shifted Window-based Multi-head Self-Attention (SW-MSA) to capture global information with window shifts, and LN for stability. The final MLP facilitates further feature extraction. This dual-block architecture enables the Swin Transformer to simultaneously consider local and global image details, enhancing its performance across diverse computer vision tasks. Cross-window communication incorporates global context, layer normalization, and multi-layer perceptron blocks process patch embeddings to ensure non-linearity and feature transformation. This novel architecture balances local and global context, making the Swin Transformer block particularly successful for various computer vision tasks, including GI tract segmentation in medical imaging.
Consecutive Swin Transformer components calculated with the shifted window partitioning technique are illustrated in Equations 1–4:
where
4.2 Encoder (downsampling path)
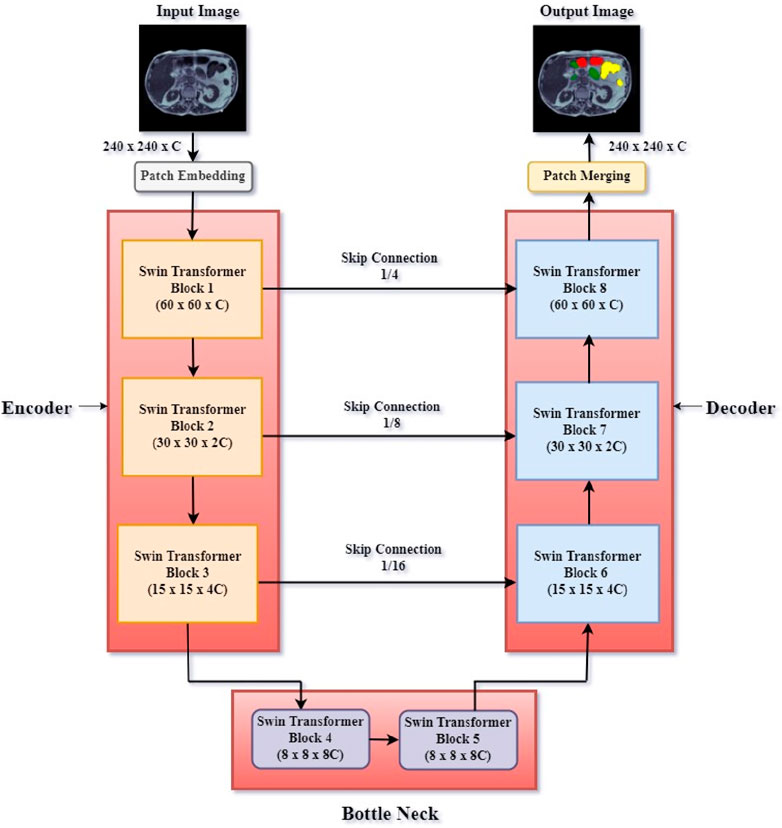
The encoder of the Swin U-Net network consists of a linear embedding block followed by a succession of Swin Transformer blocks capturing local and global information in the image, as shown in Figure 3. Combining the inventive token-based architecture of the Swin Transformer with the conventional feature extraction powers of the U-Net, the Encoder—or Downsampling Path dividing the input image into fixed-size patches, this transformational method treats each patch as a “token” for self-attention computation. It compiles global contextual data essential for exact medical image segmentation. Every encoder layer improves token representations so the model may understand visual content at ever-rising degrees of abstraction. The encoder enables the Swin U-Net to excel in complex medical image analysis, adapt to different scales, and learn relevant features by combining self-attention mechanisms with hierarchical feature extraction, enabling it to obtain good results in semantic segmentation tasks, so a potent tool for accurate and context-aware anatomical structure identification in medical images.
Initially, the input image has dimensions 240 × 240 × C (where C stands for the number of channels). After that, this processed image passes via several Swin Transformer Blocks. Swin Transformer Block 1 generates a feature map of dimensions 60 × 60 × C; Swin Transformer Block 2 generates a feature map of dimensions 30 × 30 × 2C after that. Swin Transformer Block 3 finally creates a 15 × 15 × 4C feature map. Skip connections between related blocks in the encoder and decoder help to guarantee thorough feature preservation: Skip Connection 1/4 links between Swin Transformer Block 1 and Swin Transformer Block 8. Skip Connection 1/8 links between Swin Transformer Block 2 and Swin Transformer Block 7. Skip connection 1/16 links between Block 3 and Block 6. These links directly connect relevant feature maps from the encoder to the decoder, minimizing spatial information loss via downsampling. Skip connections ensure that spatial information is maintained and enhanced throughout the segmentation process.
4.3 Bottleneck block
In the Swin U-Net model, the encoded data is refined through a bottleneck process consisting of two Swin Transformer blocks (Figure 3). The bottom layer is the main point of the network, where the regional capacity of the U-Net model and the hierarchical features collected by the Swin Transformer combine perfectly. Between the encoder’s downsampling and the decoder’s upsampling, this layer compresses and improves the coding characteristics employing two Swin Transformer Blocks (Blocks 4 and 5), allowing more data to flow through the network. The bottleneck layer combines the general concepts of Swin Transformer with the fine-grained data in U-Net, reducing the complexity of the connection while ensuring that the model preserves all information about the input image. This integration improves Swin U-Net’s ability to accurately segment medical images and collect comprehensive and small local data. It is the foundation for standards of excellence in medical image analysis.
4.4 Decoder (upsampling path)
The decoder is an essential part of the Swin U-Net model and is responsible for using the best features of the bottleneck process and the encoder cross-connection to generate feature maps. The decoder is a linear combination that provides the encoder process’s fine details to reconstruct the original image’s segmentation map. This allows the Swin U-Net to effectively capture all the collected data and the Swin Transformer to maintain the complex regional features. This allows the model to achieve high performance. Swin Transformer Block 6 generates a 15 × 15 × 4C feature map, Swin Transformer Block 7 creates a 30 × 30 × 2C feature map, and Swin Transformer Block 8 produces a 60 × 60 × C feature map. The patch merging layer then reconstructs the segmented image, effectively segmenting the intestinal tract while maintaining the original size of 240 × 240 × C. The boundary and content of the region are preserved, which is crucial in processing medical images. This integration allows the model to combine the global understanding provided by the Swin Transformer with the real-time accuracy provided by U-Net, leading to the best performance in the semantic segmentation task where the treatment plan requires anatomical structure information.
5 Results analysis
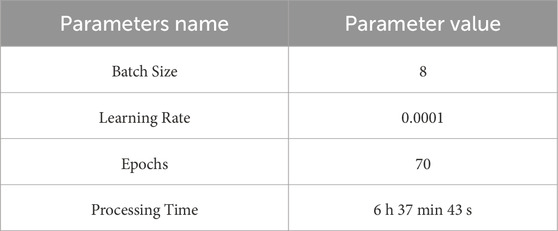
This research proposed an Integrated Swin Transformer U-Net Model to segment the gastrointestinal tract with MRI data. The model runs on the Google Colab platform using Keras and TensorFlow framework. Table 1 describes the Swin Transformer U-Net model’s training parameters proposed in GI organ segmentation task. The selected batch size is 8 to balance the two objectives so that it will not lose any performance and minimize memory use. The learning rate has been set to be 0.0001, which is small enough to ensure that convergence is stable instead of overshooting, which is what matters most for such complex architecture deep learning models like Swin Transformer U-Net. The model was trained over 70 times; thus, there were more than enough iterations to fit the dataset without overfitting. This training run took 6 h, 37 min, and 43 s, demonstrating how computer-intensive training efficient models can be on vast amounts of medical data. The following section presents this model’s results and showcases how it can help segment small bowel, large bowel, and stomach from MRI images.
5.1 Loss analysis
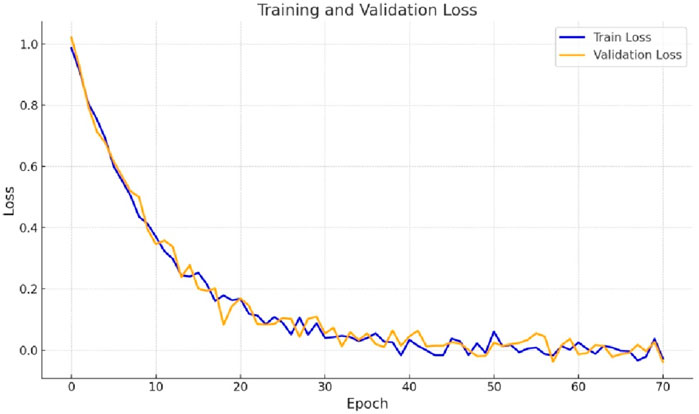
The loss plot analysis for gastrointestinal tract segmentation entails watching the convergence of loss curves unique to the small bowel, large intestine, and stomach segmentation. These curves represent the model’s accuracy in segmenting each area. Monitoring the training and validation loss curves is critical to ensure the model learns properly without overfitting. Figure 4 represents the training and validation loss plots by implementing the proposed design. In Figure 4, we can observe a sharp decline in loss during the fifth epoch. Subsequently, the loss gradually decreases, reaching a value of 0.0472 for the training and 0.0929 for the validation.
5.2 Dice coefficient analysis
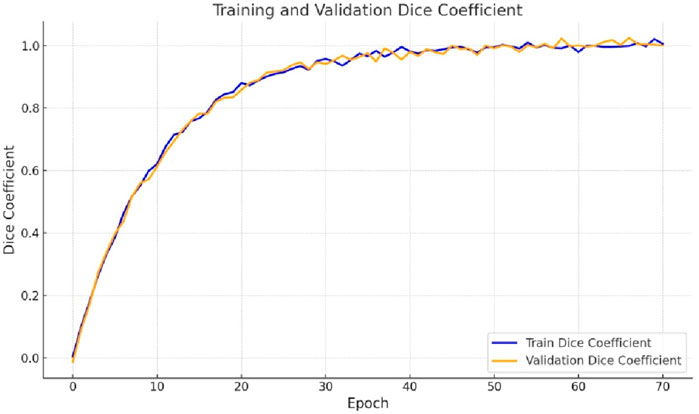
The accuracy of segmentation for the small intestine, large intestine, and stomach regions is assessed using Dice coefficient plots, which illustrate how well the predicted segmentations from the proposed Integrated Swin Transformer U-Net Model align with the ground truth masks. Higher Dice coefficients indicate better alignment. Figure 5 displays the Dice curves generated by the proposed Ensemble of Swin Transformer Block and U-Net Model. As shown in Figure 5, the Dice value starts at 0 and rapidly increases between epochs 0 and 10, followed by a more gradual rise. Ultimately, the Dice coefficient reaches final values of 0.9571 for training and 0.9203 for validation.
5.3 IoU coefficient analysis
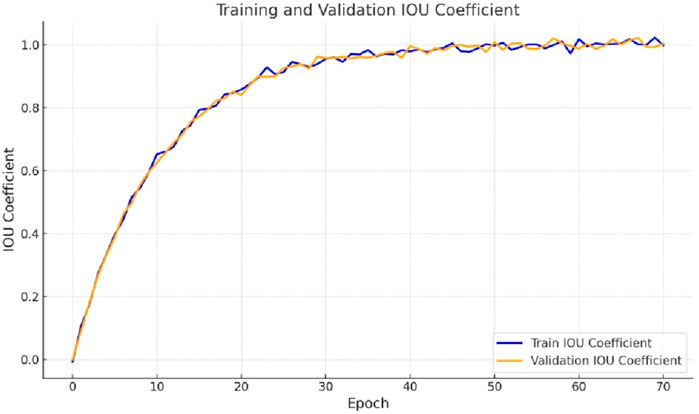
Evaluating the Intersection over Union (IoU) coefficient plots for gastrointestinal tract segmentation using the proposed Integrated Swin Transformer U-Net Model involves assessing the model’s accuracy in delineating the boundaries of the small intestine, large intestine, and stomach regions. These plots demonstrate how closely the model’s predicted segmentations align with the ground truth masks, with higher IoU coefficients indicating superior segmentation quality. Figure 6 presents the IoU curve generated by the proposed model. As depicted in Figure 6, the IoU value increases from the 10th epoch and continues to rise gradually. Ultimately, the IoU coefficient achieves a final value of 0.9147 for the training dataset and 0.9203 for the validation dataset.
5.4 Performance analysis for test dataset
Table 2 shows the performance parameters of the proposed segmentation model for training, testing, and validation datasets. Three crucial measurements of the model’s performance are loss, dice, and IoU. With a low loss of 0.0472, a high Dice value of 0.9571, and an IoU value of 0.99147, the model shows accurate segmentation and significant overlap with the ground truth during training. The model retains its segmentation quality over the testing and validation phases with slightly higher loss values, demonstrating constant Dice and IoU Coefficients of around 0.9190 to 0.9203 and 0.8454 to 0.8490, respectively. These results show that the model can generalize its segmentation skills to previously encountered data while maintaining consistent performance.
5.5 Visual analysis
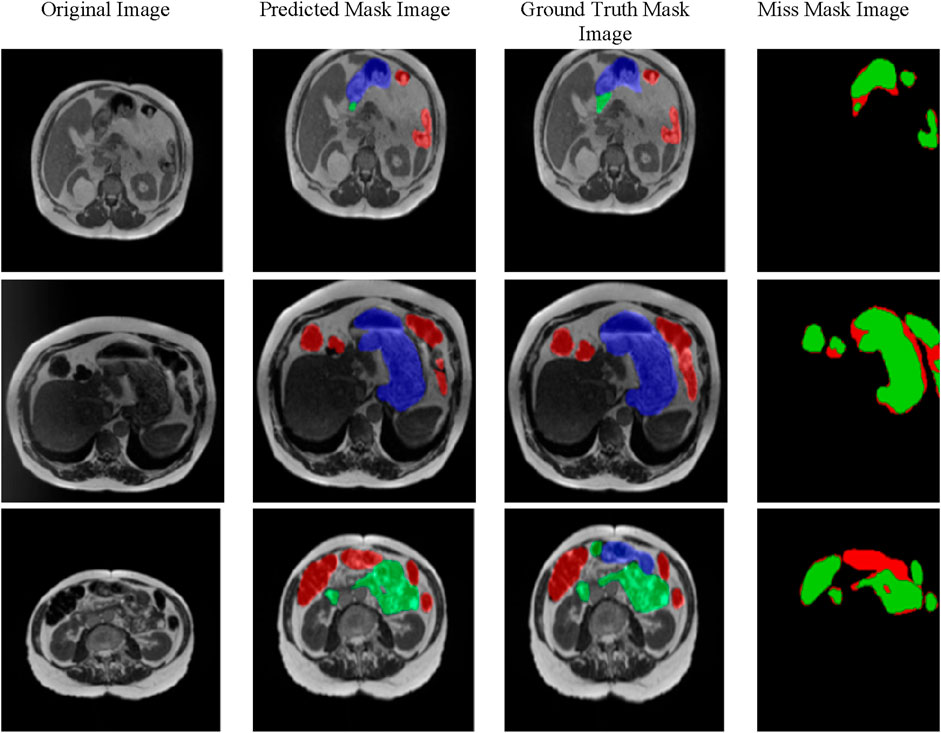
Figure 7 provides a comparison of gastrointestinal tract segmentation results on MRI images, organized into four columns: “Original Image”, “Predicted Mask Image”, “Ground Truth Mask Image”, and “Miss Mask Image”. Each row represents a different MRI slice. The “Original Image” column shows the raw grayscale MRI scans. In contrast, the “Predicted Mask Image” column displays the segmentation masks generated by the proposed model, where different regions are color-coded for straightforward interpretation: red represents the large bowel, green corresponds to the small bowel, and blue indicates the stomach. This color scheme is consistent across the “Ground Truth Mask Image” column, which shows expert-annotated masks that serve as the benchmark for evaluating the model’s accuracy.
The “Miss Mask Image” column highlights discrepancies between the model’s predictions and the ground truth annotations, using green to indicate true positives (areas predicted by the model and present in the ground truth) and red for false negatives (areas in the ground truth but the model missed). This layout effectively visualizes the model’s strengths and limitations, allowing for a quick assessment of its accuracy in segmenting the small bowel, large bowel, and stomach within MRI scans of the gastrointestinal tract.
The proposed integration of the Swin Transformer and U-Net architectures offers several notable advantages over existing GI tract segmentation methods, primarily by combining the global context-capturing capabilities of the Swin Transformer with the spatial precision of the U-Net. Unlike traditional convolutional neural networks (CNNs) or standalone U-Net models, which focus on local features, the Swin Transformer’s hierarchical structure with shifted windows allows efficient processing of local and global information, enhancing segmentation accuracy, particularly in complex anatomical structures. This combined approach proves robust in handling variations in MRI data, such as differences in organ shape and texture. It is especially effective in distinguishing between similar tissues, where boundaries are often ambiguous. However, the model has limitations, including higher computational requirements due to the transformer layers, which could restrict its applicability in clinical settings with limited resources.
6 Comparison with state of art
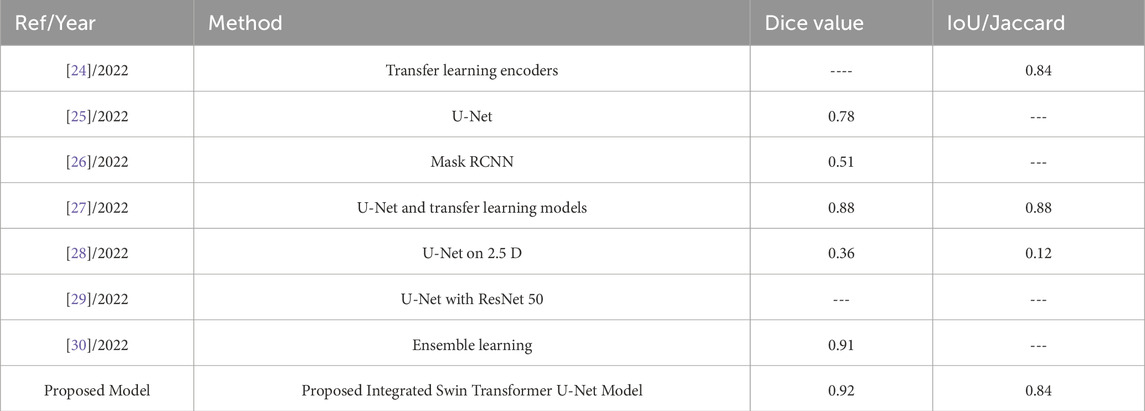
Table 3 provides a comparative overview of several image segmentation approaches assessed for their effectiveness in the context of a given goal, most likely in medical imaging or computer vision, in 2022. The techniques described include transfer learning encoders, U-Net architecture, Mask RCNN, a mix of U-Net and transfer learning models, U-Net applied to 2.5D images, U-Net paired with ResNet 50, and ensemble learning. The associated Dice coefficient and IoU/Jaccard scores serve as performance measures, assessing the quality of segmentation findings. Highlights include the proposed model, which has a Dice value of 0.91 and an IoU/Jaccard of 0.84, and additional algorithms with varied segmentation accuracy. In this case, the superior performance of Swin Transformer-U-Net can be attributed to the combination of global content and spatial accuracy. Swin Transformer’s moving window effectively captures surface irregularities, enabling the model to identify minor differences between similar tissues in the colon. Furthermore, the U-Net model refines region boundaries through cross-linking, essential for accurate segmentation. This combination makes the model more efficient than previous methods by evaluating local details with global context understanding and makes it particularly suitable for complex anatomical segmentation tasks.
7 Conclusion
This study presents an integrated Swin Transformer U-Net model for segmenting intestinal lesions in MRI images, which is an essential task for developing radiology in cancer treatment. The well-designed model combines the global content learning capabilities of Swin Transformer with the detailed feature extraction capabilities of U-Net to provide optimal performance. Experimental results validated in gastrointestinal diseases at the University of Wisconsin-Madison showed that the model has high accuracy with low loss, high Dice coefficient, and IoU scores of 0.0949, 0.9190, and 0.8454, respectively. These results indicate that the proposed model can improve the accuracy of GI cancer treatment and provide radiation oncologists with a powerful tool for better treatment planning and patient care. Integrating these principles into clinical practice will lead to more efficient and effective radiation therapy, ultimately improving patient outcomes. We plan to refine the model’s architecture for future enhancements to reduce computational complexity, allowing for more efficient real-time applications. We also aim to explore further multi-modal data integration, such as combining MRI with CT scans, to improve segmentation accuracy. Beyond GI tract segmentation, this model’s framework could be adapted to other types of cancer and areas of medical imaging by fine-tuning its parameters to accommodate different tissue characteristics and imaging modalities. For instance, it could be adapted for lung or brain tumor segmentation by training on specialized datasets, enabling broader clinical applications across oncology.
Data availability statement
Publicly available datasets were analyzed in this study. This data can be found here: https://www.kaggle.com/competitions/uw-madison-gi-tract-image-segmentation/data.
Author contributions
NS: Conceptualization, Methodology, Software, Writing–original draft, Writing–review and editing. SG: Conceptualization, Methodology, Supervision, Writing–original draft, Writing–review and editing. AA: Conceptualization, Methodology, Project administration, Resources, Writing–original draft, Writing–review and editing. SB: Conceptualization, Formal Analysis, Methodology, Writing–original draft, Writing–review and editing. AA: Funding acquisition, Investigation, Project administration, Resources, Writing–original draft, Writing–review and editing. AR: Conceptualization, Methodology, Writing–original draft, Writing–review and editing.
Funding
The author(s) declare that financial support was received for the research, authorship, and/or publication of this article. This work was supported by King Saud University, Riyadh, Saudi Arabia, through researchers supporting project number RSP2024R498.
Conflict of interest
The authors declare that the research was conducted in the absence of any commercial or financial relationships that could be construed as a potential conflict of interest.
Publisher’s note
All claims expressed in this article are solely those of the authors and do not necessarily represent those of their affiliated organizations, or those of the publisher, the editors and the reviewers. Any product that may be evaluated in this article, or claim that may be made by its manufacturer, is not guaranteed or endorsed by the publisher.
References
1. Rawla P, Barsouk A. Epidemiology of gastric cancer: global trends, risk factors, and prevention. Gastroenterol Review/Przegląd Gastroenterologiczny (2019) 14(1):26–38. doi:10.5114/pg.2018.80001
2. Li B, Meng MQH. Tumor recognition in wireless capsule endoscopy images using textural features and SVM-based feature selection. IEEE Trans Inf Tech Biomed (2012) 16(3):323–9. doi:10.1109/TITB.2012.2185807
3. Zhou M, Bao G, Geng Y, Alkandari B, Li X. Polyp detection and radius measurement in small intestine using video capsule endoscopy. In: 2014 7th International Conference on Biomedical Engineering and Informatics; 14-16 October 2014; Dalian, China. IEEE (2014). p. 237–41.
4. Jaffray DA, Gospodarowicz MK. Radiation therapy for cancer. Cancer Dis Control priorities (2015) 3:239–48. doi:10.1596/978-1-4648-0349-9_ch14
5. Shin Y, Balasingham I Comparison of hand-craft feature based SVM and CNN based deep learning framework for automatic polyp classification. In: 2017 39th annual international conference of the IEEE engineering in medicine and biology society (EMBC); 11-15 July 2017; Jeju, Korea (South). IEEE (2017) p. 3277–80.
6. Li Q, Yang G, Chen Z, Huang B, Chen L, Xu D, et al. Colorectal polyp segmentation using a fully convolutional neural network. In: 2017 10th international congress on image and signal processing, biomedical engineering and informatics (CISP-BMEI); 14-16 October 2017; Shanghai, China. IEEE (2017). p. 1–5.
7. Nguyen Q, Lee SW. Colorectal segmentation using multiple encoder-decoder network in colonoscopy images. In: 2018 IEEE first international conference on artificial intelligence and knowledge engineering (AIKE); 26-28 September 2018; Laguna Hills, CA, USA. IEEE (2018) p. 208–11.
8. Meng W, Zhang S, Yao X, Yang X, Xu C, Huang X Biomedia ACM MM grand challenge 2019: using data enhancement to solve sample unbalance. In: Proceedings of the 27th ACM international conference on multimedia (2019) p. 2588–92.
9. Lilhore UK, Poongodi M, Kaur A, Simaiya S, Algarni AD, Elmannai H, et al. Hybrid model for detection of cervical cancer using causal analysis and machine learning techniques. Comput Math Methods Med (2022) 2022:1–17. doi:10.1155/2022/4688327
10. Kukreja V, Dhiman P. A Deep Neural Network based disease detection scheme for Citrus fruits. In: 2020 International conference on smart electronics and communication (ICOSEC); 10-12 September 2020; Trichy, India. IEEE (2020) p. 97–101.
11. Iqbal I, Younus M, Walayat K, Kakar MU, Ma J. Automated multi-class classification of skin lesions through deep convolutional neural network with dermoscopic images. Comput Med Imaging graphics (2021) 88:101843. doi:10.1016/j.compmedimag.2020.101843
12. Iqbal I, Walayat K, Kakar MU, Ma J. Automated identification of human gastrointestinal tract abnormalities based on deep convolutional neural network with endoscopic images. Intell Syst Appl (2022) 16:200149. doi:10.1016/j.iswa.2022.200149
13. Le NQK. Potential of deep representative learning features to interpret the sequence information in proteomics. Proteomics (2022) 22(1-2):2100232. doi:10.1002/pmic.202100232
14. Kha QH, Tran TO, Nguyen VN, Than K, Le NQK. An interpretable deep learning model for classifying adaptor protein complexes from sequence information. Methods (2022) 207:90–6. doi:10.1016/j.ymeth.2022.09.007
15. Cao H, Wang Y, Chen J, Jiang D, Zhang X, Tian Q, et al. UNet: unet-like pure transformer for medical image segmentation. In: European conference on computer vision. Cham: Springer Nature Switzerland (2022) p. 205–18.
16. Hatamizadeh A, Nath V, Tang Y, Yang D, Roth HR, Xu D. Swin unetr: swin transformers for semantic segmentation of brain tumors in mri images. In: International MICCAI brainlesion workshop. Cham: Springer International Publishing (2021). p. 272–84.
17. Lin A, Chen B, Xu J, Zhang Z, Lu G, Zhang D. Ds-transunet: dual swin transformer u-net for medical image segmentation. IEEE Trans Instrumentation Meas (2022) 71:1–15. doi:10.1109/tim.2022.3178991
18. Ganz M, Yang X, Slabaugh G. Automatic segmentation of polyps in colonoscopic narrow-band imaging data. IEEE Trans Biomed Eng (2012) 59(8):2144–51. doi:10.1109/TBME.2012.2195314
19. Wang Y, Tavanapong W, Wong J, Oh JH, De Groen PC. Polyp-alert: near real-time feedback during colonoscopy. Comp Methods Programs Biomed (2015) 120(3):164–79. doi:10.1016/j.cmpb.2015.04.002
20. Vázquez D, Bernal J, Sánchez FJ, Fernández-Esparrach G, López AM, Romero A, et al. A benchmark for endoluminal scene segmentation of colonoscopy images. J Healthc Eng (2017) 2017:1–9. doi:10.1155/2017/4037190
21. Brandao P, Zisimopoulos O, Mazomenos E, Ciuti G, Bernal J, Visentini-Scarzanella M, et al. Towards a computed-aided diagnosis system in colonoscopy: automatic polyp segmentation using convolution neural networks. J Med Robotics Res (2018) 3(02):1840002. doi:10.1142/s2424905x18400020
22. Dijkstra W, Sobiecki A, Bernal J, Telea AC. Towards a single solution for polyp detection, localization and segmentation in colonoscopy images. VISIGRAPP (2019) 4:616–25. doi:10.5220/0007694906160625
23. Banik D, Bhattacharjee D, Nasipuri M. A multiscale patch-based deep learning system for polyp segmentation. In: Advanced computing and systems for security. Singapore: Springer (2020) p. 109–19.
24. Wang S, Cong Y, Zhu H, Chen X, Qu L, Fan H, et al. Multiscale context-guided deep network for automated lesion segmentation with endoscopy images of gastrointestinal tract. IEEE J Biomed Health Inform (2020) 25(2):514–25. doi:10.1109/jbhi.2020.2997760
25. Galdran A, Carneiro G, Ballester MAG. Double encoder-decoder networks for gastrointestinal polyp segmentation. In: International conference on pattern recognition. Cham: Springer (2021) p. 293–307.
26. Sharma M. Automated GI tract segmentation using deep learning. arXiv preprint arXiv:2206.11048 (2022). doi:10.48550/arXiv.2206.11048
27. Ye R, Wang R, Guo Y, Chen L. SIA-unet: a unet with sequence information for gastrointestinal tract segmentation. In: Pacific rim international conference on artificial intelligence. Cham: Springer (2022) p. 316–26.
29. Sharma N, Gupta S, Koundal D, Alyami S, Alshahrani H, Asiri Y, et al. U-net model with transfer learning model as a backbone for segmentation of gastrointestinal tract. Bioengineering (2023) 10(1):119. doi:10.3390/bioengineering10010119
30. Li H, Liu J. Multi-view unet for automated GI tract segmentation. In: 2022 5th International Conference on Pattern Recognition and Artificial Intelligence (PRAI); 19-21 August 2022; Chengdu, China. IEEE (2022) p. 1067–72.
32. Georgescu MI, Ionescu RT, Miron AI. Diversity-promoting ensemble for medical image segmentation. arXiv preprint arXiv:2210.12388 (2022). doi:10.48550/arXiv.2210.12388
33. Kaggle. UW-madison GI tract image segmentation (2024). Available from: https://www.kaggle.com/competitions/uw-madison-gi-tract-image-segmentation/data (Accessed July 1, 2024).
34. Liu Z, Lin Y, Cao Y, Hu H, Wei Y, Zhang Z, et al. Swin transformer: hierarchical vision transformer using shifted windows. In: Proceedings of the IEEE/CVF international conference on computer vision (2021) p. 10012–22.
Keywords: swin transformer, U-Net model, segmentation, gastrointestinal tract, radiation therapy, UW madison GI tract dataset
Citation: Sharma N, Gupta S, Almogren A, Bharany S, Altameem A and Rehman AU (2024) Advanced gastrointestinal tract organ differentiation using an integrated swin transformer U-Net model for cancer care. Front. Phys. 12:1478750. doi: 10.3389/fphy.2024.1478750
Received: 10 August 2024; Accepted: 02 December 2024;
Published: 12 December 2024.
Edited by:
Wenjun Liu, Beijing University of Posts and Telecommunications (BUPT), ChinaReviewed by:
Nguyen Quoc Khanh Le, Taipei Medical University, TaiwanImran Iqbal, New York University, United States
Copyright © 2024 Sharma, Gupta, Almogren, Bharany, Altameem and Rehman. This is an open-access article distributed under the terms of the Creative Commons Attribution License (CC BY). The use, distribution or reproduction in other forums is permitted, provided the original author(s) and the copyright owner(s) are credited and that the original publication in this journal is cited, in accordance with accepted academic practice. No use, distribution or reproduction is permitted which does not comply with these terms.
*Correspondence: Neha Sharma, c2hhcm1hLm5laGFAY2hpdGthcmEuZWR1Lmlu; Ateeq Ur Rehman, MjAyNDExMTQ0QGdhY2hvbi5hYy5rcg==
 Neha Sharma1*
 Salil Bharany
 Ateeq Ur Rehman