- 1School of Electronics, Peking University, Beijing, China
- 2School of Artificial Intelligence, China University of Mining and Technology-Beijing, Beijing, China
3D point clouds collected by low-channel light detection and ranging (LiDAR) are relatively sparse compared to high-channel LiDAR, which is considered costly. To address this, an outdoor large-scene point cloud reconstruction (LSPCR) technique based on transformer is proposed in this study. The LSPCR approach first projects the original sparse 3D point cloud onto a 2D range image; then, it enhances the resolution in the vertical direction of the 2D range image before converting the high-resolution range image back to a 3D point cloud as the final reconstructed point cloud data. Experiments were performed on the real-world KITTI dataset, and the results show that LSPCR achieves an average accuracy improvement of over 60% compared to non-deep-learning algorithms; it also achieves better performance compared to the latest deep-learning algorithms. Therefore, LSPCR is an effective solution for sparse point cloud reconstruction and addresses the challenges associated with high-resolution LiDAR point clouds.
1 Introduction
Light detection and ranging (LiDAR) entails sensing the environment by emitting pulsed laser beams and receiving the reflected beams using echo detection equipment. The point cloud data obtained thus can provide information on spatial coordinates, shapes, and contours [1]. Given its high measurement accuracy and real-time response speed, LiDAR is widely used in high-precision applications such as autonomous driving and simultaneous localization and mapping (SLAM) [2]. However, the raw 3D point cloud data collected by most low-channel LiDAR are often sparse with high levels of noise and structural differences, whereas high-resolution LiDAR hardware involve significant costs. Therefore, reconstructing high-resolution point clouds from low-resolution point clouds has substantial value in engineering applications [3].
Outdoor large scenes often feature complex 3D point cloud structures, and these point cloud data are characterized by disorder, permutation invariance, and sparsity [4]. Unlike the adjacency relationships present in 2D images, point clouds are discrete and lack spatial continuity among the 3D points, making it impossible to directly apply existing deep-learning methods for point cloud enhancement or reconstruction [5]. Thus, 3D point cloud data must be converted to 2D images, such that 2D deep-learning networks can be used to achieve super-resolution. Range images differ significantly from optical images in terms of the pixel value representations, resolutions, and feature extraction directions [6]. Range image pixels represent depth information and typically have a lower resolution, whereas optical image pixels represent the intensities of red, green, and blue colors as well as have a higher resolution. These differences necessitate unique designs for point cloud super-resolution [7].
Currently, the methods available for reconstructing low-resolution point clouds can be categorized into traditional and deep-learning approaches. Among the traditional methods, interpolation algorithms (such as bilinear interpolation [8] and cubic interpolation [9]) are fast but are prone to overfitting problems in regions with significant curvature changes [10]. Subsequent methods based on Voronoi diagrams [11], locally optimal projections (LOPs) [12], and edge-aware point cloud enhancement [13] have been shown to be effective but require strong assumptions or manual parameter selection, making them unsuitable for most practical applications.
Deep-learning methods are shown to have significant advantages for predictions [14,15] as they do not require manual feature design and can implicitly describe the characteristics of images with different resolutions. Early research efforts on point cloud upsampling were mostly based on convolutional neural network (CNN) architectures, such as SR-ResNet [16], PU-Net [17], ILN [18], and self-supervised learning methods [19,20,21]. These methods primarily use encoder networks with convolutional and deconvolutional layers but are prone to edge-smoothing issues owing to regularization effects when processing range images. Since the proposal of ViT, transformer models have been used to achieve breakthroughs in computer vision applications [22]. The Swin transformer alleviates the computational burden of self-attention by partitioning images [23,24]. Accordingly, numerous works were proposed, such as the height-aware lidar super-resolution (HALS) framework [25], PU-transformer [26], Swin-T-NFC conditional random fields [27], and PU-Dense [28], which have significantly enhanced point cloud reconstruction performances through multihead self-attention structures, position fusion blocks, and sliced Wasserstein distance techniques.
The present work proposes a point cloud reconstruction method specifically designed for LiDAR range images, named large-scene point cloud reconstruction (LSPCR). This method utilizes a U-shaped network structure similar to that of U-Net and skip connections as in ResNet to connect the encoder and decoder parts. Given a low-resolution range image and its features on the vertical information distribution, we used row patches instead of square patches to tokenize the range image. Additionally, by drawing inspiration from the Swin transformer design, we introduced cross-shaped window self-attention (CSwin) to design the core components for LSPCR. CSwin computes the self-attention in cross-shaped windows formed by horizontal and vertical stripes, making it suitable for vertical-direction super-resolution tasks of range images. Experiments were conducted with the KITTI dataset, and the results demonstrate that LSPCR offers the latest advancements for outdoor data.
2 Methods
2.1 Problem statement
Each point
The coordinates
2.2 Network structure overview
The LSPCR method employs a U-shaped network architecture and integrates information from the encoder and decoder modules through skip connections, as shown in Figure 1. The network is composed of multiple CSwin blocks with different parameters. Initially, LSPCR concatenates the input and maps it to a high-dimensional feature space. To accommodate the fact that the width of the range image is much larger than its height, we adopt a row-based patching approach in the tokenization phase using a
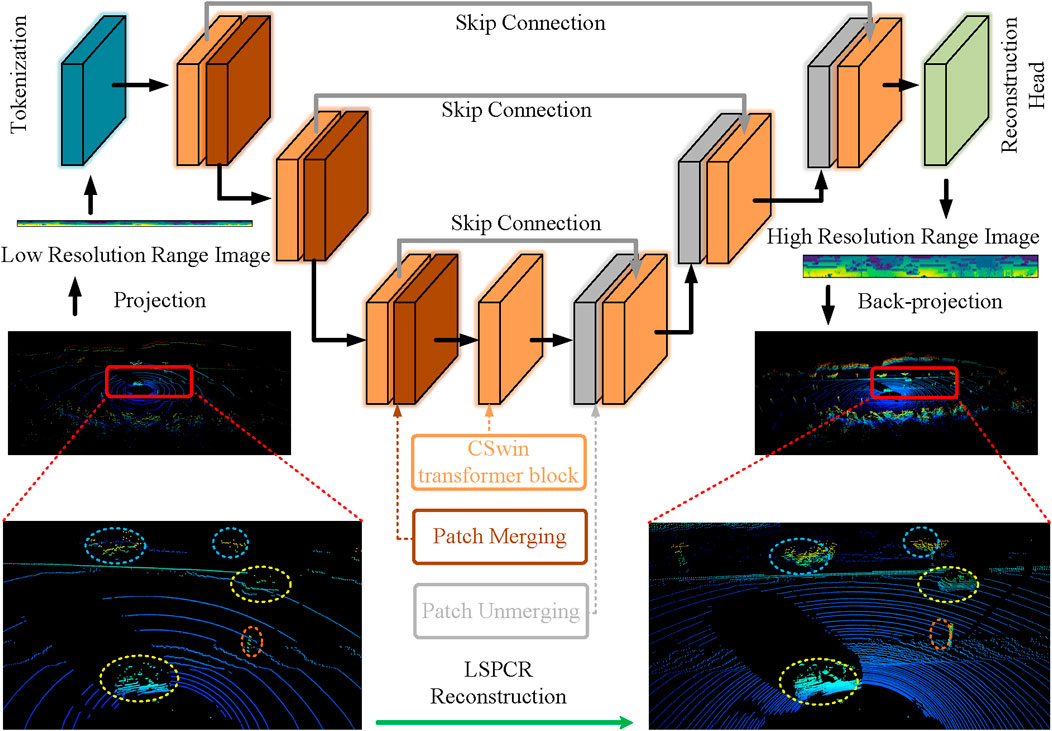
Figure 1. Network architecture details of the proposed LSPCR method employing symmetric designs for the encoder and decoder. The basic unit of the encoder consists of two CSwin transformer blocks and a patch merging layer to reduce the spatial resolution of the feature map. The basic unit of the decoder includes a patch splitting layer and two subsequent blocks to restore the resolution. The image sizes are
The encoder is designed to generate feature maps through a series of stages, each of which includes a CSwin transformer block and a patch merging layer. This configuration reduces the resolution by a factor of 4 while increasing the dimensionality by a factor of 2. At each stage, multiple CSwin instances are executed locally in parallel while being interspersed with two multilayer perceptron layers and residual connections from the input. The decoder, which is responsible for upsampling, operates in reverse to the encoder and is designed symmetrically. Initially, the dimensionality of the feature map is reduced by a factor of 2 and the resolution is expanded; here, skip connections are employed to retain the existing geometric information. At the final stage, a single-channel range image with high resolution is obtained. The final part of the network includes a
2.2.1 CSwin transformer block
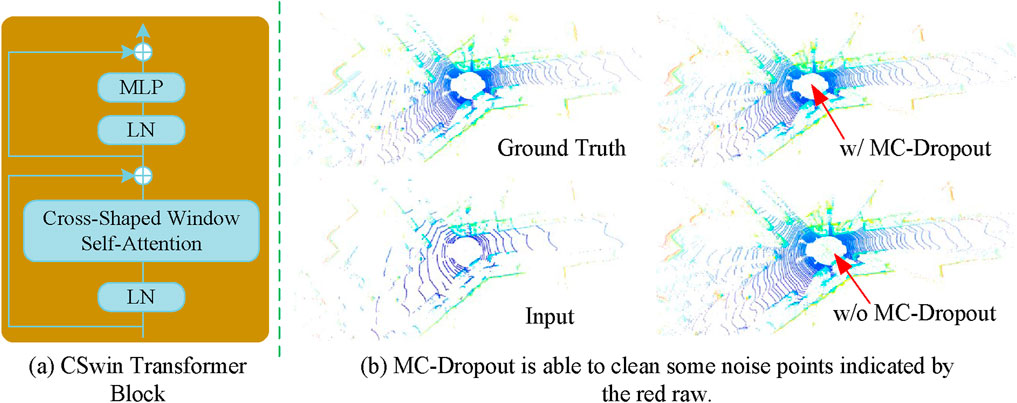
CSwin offers several advantages for processing range images, as depicted in Figure 2A. By calculating the self-attention in both horizontal and vertical directions, CSwin captures the local details and integrates the global information effectively. It is particularly well-suited for range images, which have unique geometric and depth characteristics, as it can extract features in the high-resolution vertical direction finely while maintaining the efficiency in the horizontal direction. CSwin accurately captures the edges of sharp objects while avoiding smoothing issues as well as preserving the fine structures and geometry. Its multiscale feature extraction capability allows handling different depths and distances to enhance the reconstruction accuracy and robustness of complex scenes.
This method involves initial partitioning of the input feature map into horizontal and vertical stripes of equal widths. These vertical and horizontal stripes form cross-shaped windows, from which the self-attention is computed. The computations within these stripes are performed in parallel. Initially, the input features
where
We also use the relative positional encoding (RPE) method, which enhances positional encoding by incorporating relative positional information directly in the self-attention calculation. RPE captures the spatial structure and relative positional relationships among image data, which are crucial for visual tasks. The method entails application of a relative position bias to the attention mechanism to improve the model’s ability to generalize to images of different sizes and resolutions. Given the input features
The relative position bias
2.2.2 Monte Carlo dropout
Monte Carlo (MC) dropout is an uncertainty estimation technique used to simulate different model parameters by retaining the dropout layers during the inference phase and performing the predictions
The uncertainty estimate can be obtained by calculating the variance or standard deviation of these prediction results as given by Equation 6.
For the LiDAR point clouds, we can interpret uncertainty as the noise in the estimation of the 3D coordinates. Therefore, by employing a predefined threshold parameter
3 Experiment
3.1 Setup details
Experiments were conducted on the real-world KITTI dataset to evaluate the performance of the proposed method. The data used for training and testing were generated by creating randomly positioned range images from raw LiDAR data. Here, 30,000 samples were selected for training, and 3,000 samples were used for testing. The 16-line LiDAR point cloud data were extracted uniformly from 64-line LiDAR point clouds to prevent spatial overlap as sequential images were not employed in this study. The experiments were conducted with the PyTorch framework on an NVIDIA GeForce RTX 4090 graphics processing unit. All experiments involved
The mean absolute error (MAE) was evaluated for all pixels in a generated 2D range image using Equation 8. The performance was also assessed on the basis of the 3D points reconstructed by the neural network using the Chamfer distance (CD) to measure the Euclidean distance between two point clouds, as shown in Equation 9. Additionally, the point cloud was voxelized with a voxel size of
where
where
3.2 Experiments
3.2.1 Results
We selected nine state-of-the-art (SOTA) methods for comparison with the proposed approach, and the quantitative results of our experiments are presented in Table 1. It is noted that LSPCR achieves the best performance for all three metrics. Traditional interpolation methods perform worse than deep learning, which also indicates that the non-adjacency in point cloud data is difficult to model directly. In addition, it is worth noting that the MAE for the 2D image does not exactly correlate directly with the 3D metrics; for example, LIDAR-SR has better MAE results but performs worse in terms of the IoU and CD. This suggests that there are a large number of invalid noise points between real objects.
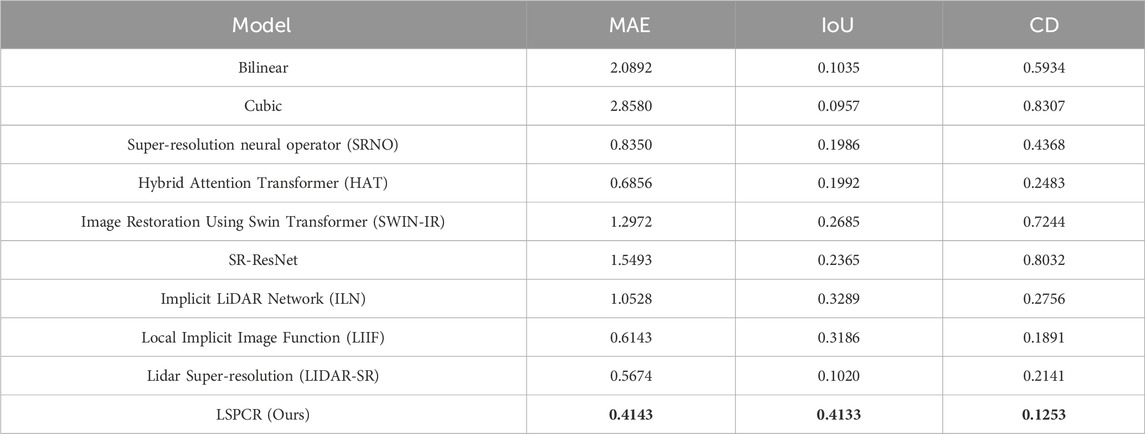
Table 1. Quantitative comparisons between state-of-the-art LiDAR and image super-resolution methods. Identical data splits were used for training and evaluation of all methods.
To evaluate the complexity of the models, we elaborated the model parameter numbers and inference times for single samples. Table 2 summarizes the specific values of the numbers of parameters for the different models and their inference times for a single sample. Swin-IR has fewer parameters as its decoding part is referenced to ResNet. LiDAR-SR’s network design is more similar to that of LSPCR. ILN has the least number of parameters because of the learned interpolation weights. In addition, the inference speeds are as expected, with ILN demonstrating the fastest inference, LiDAR-SR and LSPCR showing similar inference speeds, and Swin-IR having the slowest inference.
3.2.2 Ablation studies
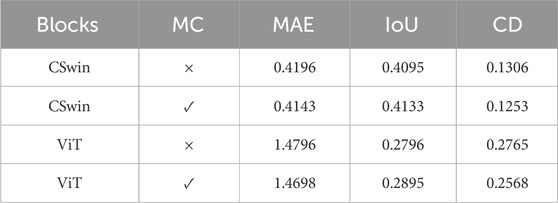
Table 3 shows the results of our ablation experiments. We observed the effects of CSwin by replacing the CSwin module with the ViT module and deleting the MC module. The table clearly shows the superior performance with the CSwin and MC modules, which is in line with our expectation. Compared to RGB datasets, LiDAR datasets usually have low volumes, and ViT lacks the ability to focus on local features; this weakens ViT’s performance on LIDAR datasets. In addition, the use of MC dropout shows some improvements in all metrics, indicating its effectiveness.
3.3 Discussion
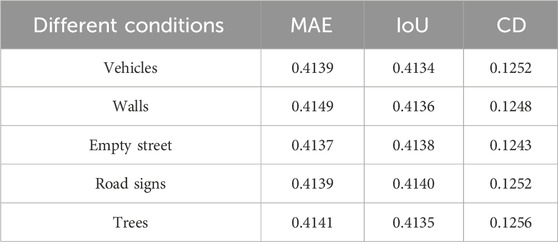
Figure 3 depicts the results of different methods. We selected five types of scenes (vehicles, walls, empty street, road signs, and trees) to demonstrate the performance of the LSPCR method. The red dashed lines show the details that we focus on. For instance, in the case of vehicles, LSPCR significantly restores a better profile, particularly around the A-pillar. It is clear in Figure 3 that the direct interpolation approach of traditional methods leads to large amounts of invalid noise, which are mitigated well by deep-learning methods owing to their implicit modeling capabilities; among the deep-learning methods, LSPCR achieves the best visual effects. Additionally, LSPCR clearly recovers the outline of the vehicle, details of the wall, shape of the road sign, and the tree. Meanwhile, the point cloud noise reconstructed by LSPCR is significantly less than those of other deep-learning methods, which is also consistent with the performance for the 3D evaluation metrics. We counted the point clouds with more distinct features and provide specific evaluation results in Table 4; the data in the table show that the LSPCR method produces stable reconstruction results under different conditions.
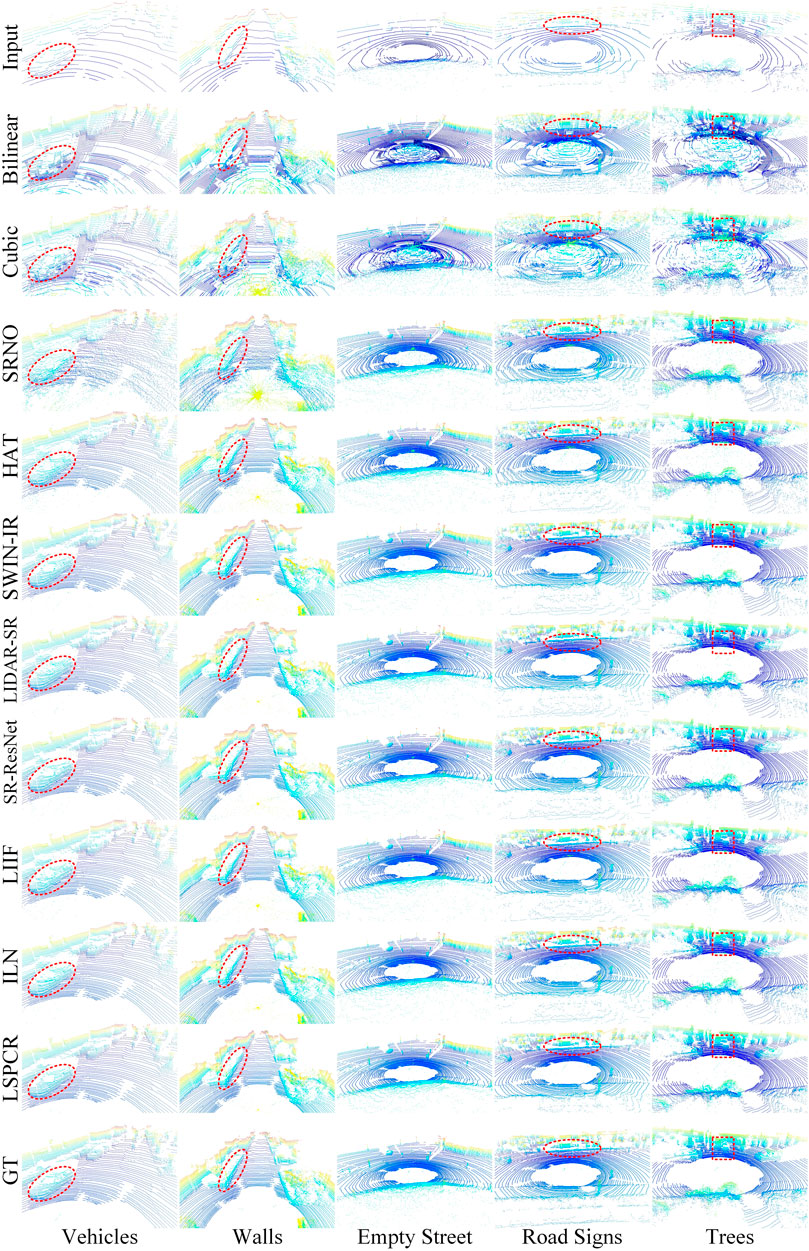
Figure 3. Detailed comparisons with images from the KITTI dataset demonstrate the performances of the LSPCR and state-of-the-art methods. Different types of point cloud details (vehicles, walls, empty street, road signs, and trees) were selected for comparison. The results show that the point clouds obtained through LSPCR are more accurate and have significantly fewer noise points.
4 Conclusion
This work addresses the problem of enhancement of 3D point cloud data by transforming reconstruction into a super-resolution task for 2D range images. A novel LiDAR point cloud reconstruction method called LSPCR is proposed here, which converts 3D point clouds to 2D range images before upsampling them. LSPCR is designed on the basis of the Swin transformer by optimizing the patch partitioning and attention modules to better accommodate the features of range images. Experiments were performed with images from the real-world dataset KITTI, and the results demonstrate that LSPCR outperforms traditional interpolation methods while achieving better performance over extant deep-learning methods.
Data availability statement
The raw data supporting the conclusions of this article will be made available by the authors without undue reservation.
Author contributions
FT: writing–review and editing and writing–original draft. SZ: writing–review and editing, software, investigation, and conceptualization. BZ: writing–review and editing and supervision. JS: writing–review and editing, resources, methodology, and funding acquisition.
Funding
The authors declare that financial support was received for the research, authorship, and/or publication of this article. This work was supported in part by the Basic Science Center Program of the National Natural Science Foundation of China (no. 62388101) and the Fundamental Research Funds for the Central Universities” (2023ZKPYJD06).
Acknowledgments
The authors would like to thank the editors and reviewers for their efforts in supporting the publication of this paper.
Conflict of interest
The authors declare that the research was conducted in the absence of any commercial or financial relationships that could be construed as a potential conflict of interest.
Publisher’s note
All claims expressed in this article are solely those of the authors and do not necessarily represent those of their affiliated organizations or those of the publisher, editors, and reviewers. Any product that may be evaluated in this article or claim that may be made by its manufacturer is not guaranteed or endorsed by the publisher.
References
1. Dinesh C, Cheung G, Bajić IV. 3D point cloud super-resolution via graph total variation on surface normals. In: 2019 IEEE international conference on image processing (ICIP); 22-25 September 2019; Taipei, Taiwan: IEEE (2019). 4390–4. doi:10.1109/ICIP.2019.8803560
2. Triess LT, Peter D, Rist CB, Enzweiler M, Zöllner JM. Cnn-based synthesis of realistic high-resolution lidar data. In: 2019 IEEE intelligent vehicles symposium (IV). IEEE Press (2019). p. 1512–9. doi:10.1109/IVS.2019.8813771
3. Ye S, Chen D, Han S, Wan Z, Liao J. Meta-pu: an arbitrary-scale upsampling network for point cloud. IEEE Trans Visualization Computer Graphics (2021) 28:3206–18. doi:10.1109/tvcg.2021.3058311
4. Savkin A, Wang Y, Wirkert S, Navab N, Tombari F. Lidar upsampling with sliced wasserstein distance. IEEE Robotics Automation Lett (2023) 8:392–9. doi:10.1109/LRA.2022.3214791
5. Chen T-Y, Hsiao C-C, Huang C-C. Density-imbalance-eased lidar point cloud upsampling via feature consistency learning. IEEE Trans Intell Vehicles (2023) 8:2875–87. doi:10.1109/TIV.2022.3162672
6. Sinha A, Bai J, Ramani K. Deep learning 3d shape surfaces using geometry images. In: European conference on computer vision; October 11-14, 2016: Amsterdam, Netherlands: Springer (2016).
7. Su H, Maji S, Kalogerakis E, Learned-Miller E. Multi-view convolutional neural networks for 3d shape recognition. In: Proceedings of the 2015 IEEE international Conference on computer vision (ICCV); (United States: IEEE computer society) (2015). 945–53. doi:10.1109/ICCV.2015.114
8. Mastyło M. Bilinear interpolation theorems and applications. J Funct Anal (2013) 265:185–207. doi:10.1016/j.jfa.2013.05.001
9. Keys R. Cubic convolution interpolation for digital image processing. IEEE Trans Acoust Speech, Signal Process (1981) 29:1153–60. doi:10.1109/TASSP.1981.1163711
10. Tang F, Gui L, Liu J, Chen K, Lang L, Cheng Y. Metal target detection method using passive millimeter-wave polarimetric imagery. Opt Express (2020) 28:13336–51. doi:10.1364/OE.390385
11. Alexa M, Behr J, Cohen-Or D, Fleishman S, Levin D, Silva C. Computing and rendering point set surfaces. IEEE Trans Visualization Computer Graphics (2003) 9:3–15. doi:10.1109/TVCG.2003.1175093
12. Lipman Y, Cohen-Or D, Levin D, Tal-Ezer H. Parameterization-free projection for geometry reconstruction. In: ACM SIGGRAPH 2007 papers. New York, NY, USA: Association for Computing Machinery (2007). p. 22–es. doi:10.1145/1275808.1276405
13. Huang H, Li D, Zhang H, Ascher U, Cohen-Or D. Consolidation of unorganized point clouds for surface reconstruction. ACM Trans Graph (2009) 28:1–7. doi:10.1145/1618452.1618522
14. Wang Y, Yu A, Cheng Y, Qi J. Matrix diffractive deep neural networks merging polarization into meta devices. Laser & Photon Rev (2023b) 18:2300903. doi:10.1002/lpor.202300903
15. Cheng Y, Tian X, Zhu D, Wu L, Zhang L, Qi J, et al. Regional-based object detection using polarization and Fisher vectors in passive millimeter-wave imaging. IEEE Trans Microwave Theor Tech (2023) 71:2702–13. doi:10.1109/TMTT.2022.3230940
16. Ledig C, Theis L, Huszar F, Caballero J, Cunningham A, Acosta A, et al. (2017). Photo-realistic single image super-resolution using a generative adversarial network. In: 2017 IEEE Conference on Computer Vision and Pattern Recognition CVPR; 21-26 July 2017; Honolulu, United States: IEEE.
17. Yu L, Li X, Fu C-W, Cohen-Or D, Heng P-A. Pu-net: point cloud upsampling network. In: 2018 IEEE/CVF conference on computer vision and pattern recognition; 18-23 June 2018; Salt Lake City, UT, USA: IEEE (2018). p. 2790–9. doi:10.1109/CVPR.2018.00295
18. Kwon Y, Sung M, Yoon S. Implicit lidar network: lidar super-resolution via interpolation weight prediction. In: 2022 international conference on robotics and automation (ICRA); 23-27 May 2022; Philadelphia, PA, USA: IEEE Press (2022). p. 8424–30. doi:10.1109/ICRA46639.2022.9811992
19. Zhao W, Liu X, Zhai D, Jiang J, Ji X. Self-supervised arbitrary-scale implicit point clouds upsampling. IEEE Trans Pattern Anal Machine Intelligence (2023) 45:12394–407. doi:10.1109/TPAMI.2023.3287628
20. Zhao Y, Hui L, Xie J. Sspu-net: self-supervised point cloud upsampling via differentiable rendering. In: Proceedings of the 29th ACM international conference on multimedia. New York, NY, USA: Association for Computing Machinery (2021). p. 2214–23. doi:10.1145/3474085.3475381
21. Ma F, Cavalheiro GV, Karaman S. Self-supervised sparse-to-dense: self-supervised depth completion from lidar and monocular camera. In: 2019 international conference on robotics and automation (ICRA); 20-24 May 2019; Montreal, QC, Canada: IEEE Press (2019). p. 3288–95. doi:10.1109/ICRA.2019.8793637
22. Dosovitskiy A, Beyer L, Kolesnikov A, Weissenborn D, Zhai X, Unterthiner T, et al. (2020). An image is worth 16x16 words: transformers for image recognition at scale. ArXiv abs/2010.11929
23. Liu Z, Lin Y, Cao Y, Hu H, Wei Y, Zhang Z, et al. Swin transformer: hierarchical vision transformer using shifted windows. In: 2021 IEEE/CVF international conference on computer vision (ICCV); 10-17 October 2021; Montreal, QC, Canada: IEEE (2021). p. 9992–10002. doi:10.1109/ICCV48922.2021.00986
24. Dong X, Bao J, Chen D, Zhang W, Yu N, Yuan L, et al. Cswin transformer: a general vision transformer backbone with cross-shaped windows. In: 2022 IEEE/CVF conference on computer vision and pattern recognition CVPR; 18-24 June 2022; New Orleans, United States: IEEE (2021). p. 12114–24.
25. Eskandar G, Sudarsan S, Guirguis K, Palaniswamy J, Somashekar B, Yang B (2022). Hals: a height-aware lidar super-resolution framework for autonomous driving. arxiv.org/abs/2202.03901.
26. Qiu S, Anwar S, Barnes N. Pu-transformer: point cloud upsampling transformer. In: L Wang, J Gall, T-J Chin, I Sato, and R Chellappa, editors. Computer vision – ACCV 2022. Cham: Springer Nature Switzerland (2023). p. 326–43.
27. Wang S, Wang H, She S, Zhang Y, Qiu Q, Xiao Z. Swin-t-nfc crfs: an encoder–decoder neural model for high-precision uav positioning via point cloud super resolution and image semantic segmentation. Comput Commun (2023a) 197:52–60. doi:10.1016/j.comcom.2022.10.011
28. Akhtar A, Li Z, Auwera GVd., Li L, Chen J. Pu-dense: sparse tensor-based point cloud geometry upsampling. IEEE Trans Image Process (2022) 31:4133–48. doi:10.1109/TIP.2022.3180904
Keywords: LiDAR, point cloud, transformer, reconstruction, autonomous driving
Citation: Tang F, Zhang S, Zhu B and Sun J (2024) Outdoor large-scene 3D point cloud reconstruction based on transformer. Front. Phys. 12:1474797. doi: 10.3389/fphy.2024.1474797
Received: 02 August 2024; Accepted: 04 September 2024;
Published: 26 September 2024.
Edited by:
Jian Dong, Central South University, ChinaCopyright © 2024 Tang, Zhang, Zhu and Sun. This is an open-access article distributed under the terms of the Creative Commons Attribution License (CC BY). The use, distribution or reproduction in other forums is permitted, provided the original author(s) and the copyright owner(s) are credited and that the original publication in this journal is cited, in accordance with accepted academic practice. No use, distribution or reproduction is permitted which does not comply with these terms.
*Correspondence: Junren Sun, c3VuanVucmVuQGN1bXRiLmVkdS5jbg==
 Fangzhou Tang
 Shuting Zhang1