- 1School of Optoelectronic Engineering, Changchun University of Science and Technology, Changchun, China
- 2Zhongshan Institute of Changchun University of Science and Technology, Zhongshan, China
Thermal protection systems (TPSs) are important components of reusable spacecraft, and their assembly quality has a crucial impact on flight safety. Owing to the complex assembly process and variable states of spacecraft thermal protection systems, assembly parameters may vary under different assembly states. Therefore, to obtain assembly parameters accurately and efficiently under different assembly states, in this study, 3D point cloud data and fiber optic sensor data were fused to develop an assembly parameter update method for assembly process state changes. Firstly, based on the measured data of thermal protection components and load-bearing structure, the gap, flush and matching parameters solution model are proposed. Secondly, to address the deformation problem of the load-bearing structure caused by changes in assembly status, a fusion method based on laser scanning and sensor detection was devised to achieve deformation prediction of the assembly structure during the assembly process. Thirdly, based on the assembly parameter solution model and point cloud prediction model, a constraint-based assembly parameter optimisation model was established, and an improved quantum particle swarm optimisation (LQPSO) algorithm was employed to achieve assembly parameter updates oriented toward changes in assembly status. Finally, an experimental system for array-based thermal protection structure simulation was established to validate the proposed method. The results show that the proposed parameter update method can achieve ideal results for different assembly state simulation components.
1 Introduction
When entering the atmosphere, a reusable spacecraft generates a large amount of heat owing to the friction between the high-speed gas and the outer surface of the spacecraft, resulting in a rapid increase in the surface temperature [1, 2]. To ensure the safety and internal load-bearing structure of a spacecraft, a thermal protection system is required [3, 4]. Array-type thermal protection components are reusable TPS applied to spacecraft. They are laid on the surface of the spacecraft in the form of an array and leave gaps. The surface profile requirements are high, and it is a non-contact fit form. The gaps between components can not only reserve space for the thermal expansion deformation of individual components but also coordinate the load deformation between components. Excessive step differences between components can cause local overheating on the windward surface, thereby increasing the local temperature of the spacecraft surface. Therefore, array-type thermal protection structures require accurate positioning, equal spacing, and continuous curvature during assembly [5].
The traditional assembly and positioning of array thermal protection components are achieved through manual marking and positioning using positioning cards. However, owing to the lack of sufficient positioning benchmarks for array component assembly and the existence of manufacturing deviations in spacecraft bodies and components, traditional manual assembly processes cannot meet the precise assembly and positioning requirements of thermal protection structures, including the requirements for gaps and flush between TPS components, as well as the requirements for the fit between thermal protection components and the body. Kun [6] proposed an automatic gap and flush measurement method for aircraft skin seams based on three-dimensional (3D) point cloud data for the aforementioned assembly positioning parameters. The seam points were obtained from the entire scanning point cloud of the aircraft skin surface, and the designed calculation model was applied to gap and flush measurements. Wang [7] combined laser-tracking and laser-scanning systems to obtain wing wall panel structural data and evaluate the fitting clearance of the assembly model. Hui [8] proposed a gap and flush measurement method based on virtual matching to address the limitations of existing contact and non-contact gap surface difference measurement methods. The method generates measurement points through UG and extracts the gap and flush of the part at the measurement point position, which was used for model measurement of automotive sheet metal parts. Li [9] proposed a nonideal geometric feature model based on measured data for the assembly of parts with complex assembly features, which was applied to the thermal insulation tiles of an aircraft to simplify discrete point set data. The above research solves the gap and flush assembly parameters through different methods. However, most of the current research was focused on the assembled products and verifies the results based on 3D scanning point clouds. There was not much attention paid to the assembly parameters during the assembly process.
Because of the complex structure and numerous components of spacecraft TPS, multiple assembly processes, such as trial assembly, adjustment, disassembly, and reassembly, are often required during the assembly process. Depending on the assembly process and process requirements, a spacecraft may undergo different assembly state changes, such as tool replacement, component assembly, and tool rotation. These situations often cause varying degrees of deformation [10] in the external structure of the spacecraft, making the previous trial assembly process unsuitable and affecting the overall assembly cycle and quality [11–13].
Therefore, to assist in the assembly of TPSs with high efficiency and quality, a method was developed in this study for updating assembly parameters based on changes in the assembly process status, which solves the problem of long assembly cycles and low quality during the assembly of TPSs. First, based on a measured model of thermal protection components [14, 15], a gap order solution model is proposed. For the curved fitting structure between the load-bearing structure and thermal protection components, a fitting degree parameter solution model is used to obtain the assembly parameters of thermal protection components. Second, in response to the problem of assembly structure deformation caused by changes in assembly status, a fusion method based on laser scanning [16] and sensor detection [17] is proposed to obtain changes in the shape of the spacecraft load-bearing structure quickly and accurately and predict the assembly structure deformation. Based on the assembly parameter solution model and the assembly structure deformation prediction model [18], a constraint-based assembly parameter optimization model was established to achieve assembly parameter updates oriented toward changes in the assembly status [19]. Based on an array-type thermal protection structure simulation, the feasibility of the assembly parameter optimisation and update method in this study was verified.
Overall, our contributions are summarized as follows:
1) we are based on the measured data of thermal protection components and load-bearing structure, the gap, flush and matching parameters solution model are proposed.
2) we devise a fusion method based on laser scanning and sensor detection to achieve deformation prediction of the assembly structure during the assembly process.
3) We establish a constraint based on assembly parameter optimisation model based on constraint and an improved quantum particle swarm optimisation (LQPSO) algorithm was employed to achieve assembly parameter updates oriented toward changes in assembly status.
2 Article types
Application of Acquisition and Application of Multimodal Sensing Information - Volume II.
3 General scheme
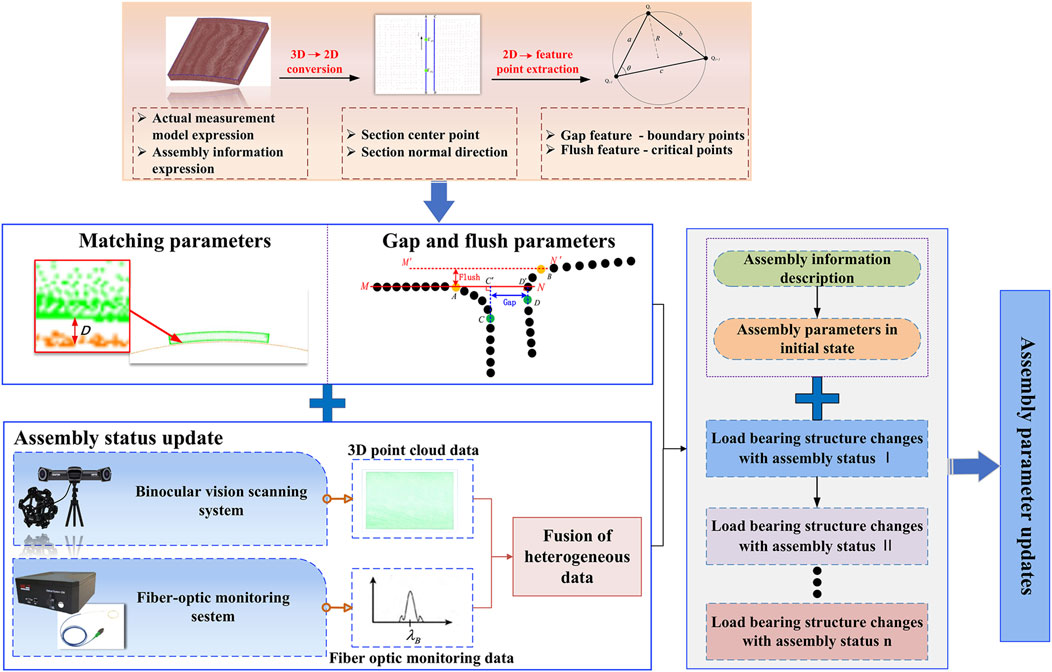
In the assembly process of spacecraft thermal protection structures, there are often situations in which the assembly parameters are not applicable because of changes in the assembly status. To address this issue, a framework for updating the assembly parameters based on changes in the assembly process status is proposed. Its model is shown in Figure 1. The specific implementation steps are as follows. (1) Based on the measured data of the thermal protection components, a gap and flush model is used. The three-dimensional (3D) point cloud is transformed into two-dimensional (2D) point data by inserting a cross section. The boundary points and critical point positions are determined by identifying the curvature mutation points, and the gap and flush parameters are calculated using the solution model. (2) For a typical surface matching structure between the load-carrying structure and thermal protection components, a matching model for curved surfaces is employed to calculate the average distance from the component to the load-carrying structure. (3) To address the problem of assembly structure deformation caused by changes in the assembly status, a fusion method based on laser scanning and sensor detection is proposed. Based on the measured data of the initial state of the load-carrying structure, the surface fiber monitoring data of the load-carrying structure under different assembly states are obtained [20]. The 3D point cloud data and fiber monitoring waveform data are fused to establish a point cloud prediction model for assembly process state changes based on heterogeneous data, and the measured data of the bearing structures in different assembly states are obtained. (4) Based on the assembly parameter solution model and assembly process state point cloud prediction model, a constraint-based assembly parameter optimisation model is used. The multi-objective problem [21] is transformed into a single-objective problem using the weighted-sum method to optimize the component pose. Based on the improved quantum particle swarm optimisation (QPSO) algorithm, the assembly parameters are updated for changes in the assembly state, thereby obtaining the updated assembly parameters.
4 Methods
4.1 Assembly parameter solving
4.1.1 Measured models expression
In the theoretical design and actual manufacturing of spacecraft thermal protection components, deviation information formed in the production process leads to differences between the measured and theoretical models of the thermal protection components. To obtain the assembly parameters of the TPS accurately, an array-type thermal protection component gap and flush solution model was established in this study based on the measured model.
The measured model is a mathematical model that represents the geometric features of parts based on the 3D point cloud data. A discrete point set is used to represent the measured model. The discrete point set can intuitively reflect the geometric contours and external deviations of the parts, and data can be easily obtained. The data-processing technology is mature and lays the foundation for the subsequent calculation of the gap and flush of the array-type thermal protection components. In response to the requirements of the assembly positioning of array thermal protection components for the measured model at the part level, based on the geometric features of complex assembly parts, such as contour information, benchmark information, and assembly matching, the point cloud model matching and benchmark alignment principles of statistical features are applied to improve the iterative closed point algorithm and achieve high-precision and efficient alignment registration. The measured data are matched with the theoretical model through point cloud matching, the manufacturing deviation information of the model is expressed, the measured data are integrated into the partlevel model expression, and high-precision and efficient geometric feature mathematical model expression of array-type thermal protection components is achieved.
4.1.2 Gap and flush model
The main parameters that affect the assembly quality of the array-type thermal protection components are the gap and flush between the point clouds of two adjacent components. Before extracting the gap and flush parameters, one must first establish a mathematical model based on the point cloud data, divide and define the mathematical model into features, design corresponding algorithms to extract the features, and finally substitute them into the mathematical model for calculation. The main parameter-solving process includes such steps as inserting cross sections, selecting feature points, and solving the gap and flush parameters.
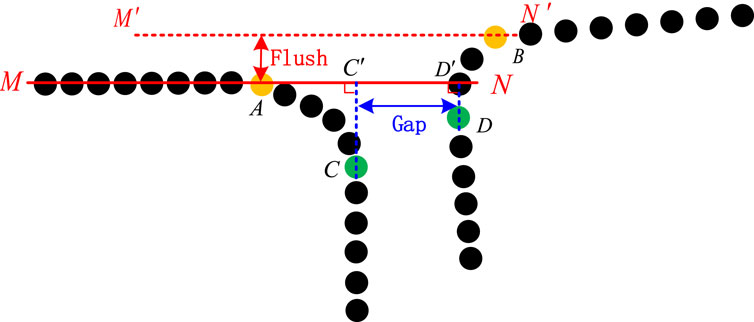
The characteristics of the mathematical model are as follows. Figure 2 shows the point cloud data of adjacent components at a certain section of the seam point cloud. The left side is defined as the reference component point data, and the right side is the moving component point data. Curvature mutation points A, B, C, and D are taken as the feature points of the seam edge, and flush feature points A and B are defined as the critical points. The gap feature points C and D are the boundary points. The straight line MN is the line fitted to the surface of the reference component, and
4.1.2.1 Section selection
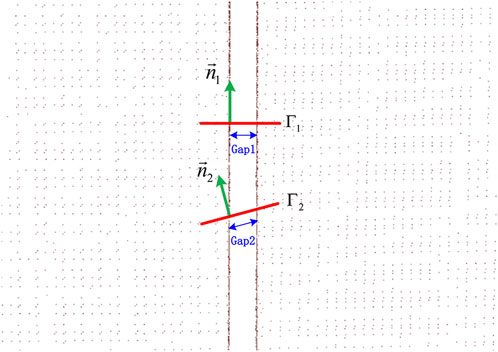
To simplify the process of solving the parameters of thermal protection components, a cross-sectional projection operation is performed to convert the 3D point cloud into 2D point data. In the process of inserting cross sections, the selection of the centre points of the cross section and the definition of the normal direction are particularly important for the accuracy of gap and flush parameter extraction, as shown in Figure 3. The vectors
Based on the expression of the measured model for assembly information fusion described in the previous section, the measured data of the thermal protection component are aligned and registered with the theoretical model. The two are located in the same coordinate system, and, because of the manufacturing process, the manufacturing deviation of the thermal protection component is small. Based on this, a section positioning method based on theoretical features is proposed, and a range of points near the section is projected onto the section to obtain 2D seam point cloud data.
Figure 4A shows a schematic diagram of a discrete point cloud of a single thermal protection component, where the blue characteristic line represents the theoretical model boundary line. The point cloud of two adjacent components facing each other is considered, as shown in Figure 4B. Feature lines AB and CD in the figure represent the theoretical models of the two adjacent components. Using the reference component, the centre-point position of the section is selected based on the length of the adjacent theoretical characteristic lines of the component. As shown in Figure 4B, feature line AB is taken as the reference, and points
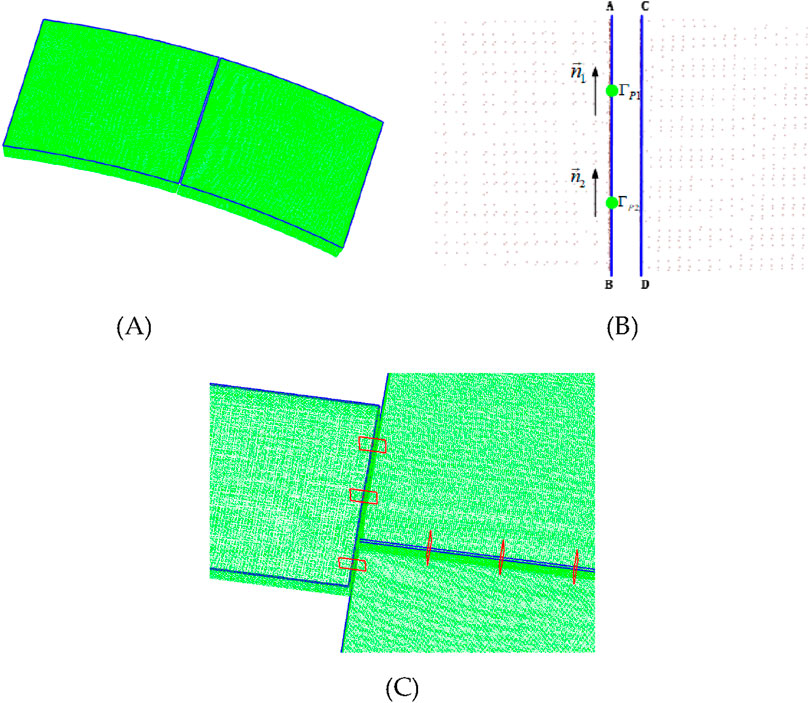
Figure 4. Selection process of cross section for thermal protection components: (A) actual measurement data and theoretical model boundary lines of thermal protection components, (B) section center point and normal direction, and (C) schematic diagram of cross sections between thermal protection components.
4.1.2.2 Feature point selection
After the cross section has been positioned, the discrete points in the vicinity of the cross section are projected onto the cross section, the 3D point cloud is converted into 2D point data, and the discrete point data shown in Figure 2 are obtained. Given a 2D projection point, based on the gap and flush solution model, extract the feature points of the 2D seam point cloud. Owing to the different definitions of gap and flush between adjacent components, the feature points are divided into gap feature points, which called boundary points, and flush feature points, which called critical points. Because of the manufacturing process limitations and component assembly requirements, the boundaries on the upper surface of a single thermal protection component are chamfered. Therefore, the 2D cross-sectional point cloud of a single component contains feature points with sudden curvature changes. According to the definition of the model for determining the gap and flush, the curvature mutation point in the 2D projection point cloud is taken as the feature point, as shown in Figure 2.
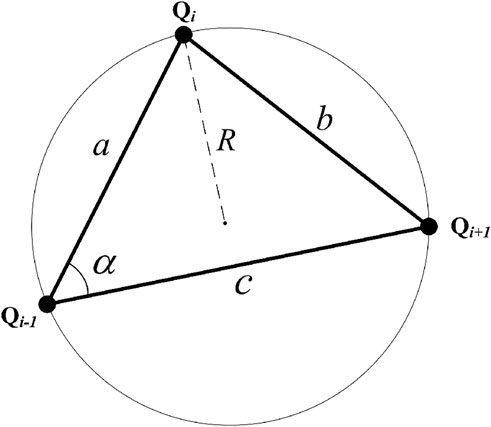
To obtain the curvature mutation point of a 2D discrete point, the first step is to calculate the single point curvature of the discrete point. In this study, the reciprocal of the circumcircle radii of three adjacent discrete points is used as the curvature calculation method for the intermediate point. The specific method is as follows.
The projection points of a single component section are represented as a set of ordered point columns
where R is the radius of the circumscribed circle of the triangle, and
According to the shape characteristics of the thermal protection components and the gap and flush solution model, a single thermal protection component contains two curvature mutation points. The first curvature mutation point is defined as a critical point for defining the flush result, and the second curvature mutation point is defined as a boundary point for defining the gap result. The curvature mutation point divides the gap point cloud into three regions: the surface point set of the component, the transition corner point set, and the component fitting surface point set. The surface point set of the component is fitted as a straight line, which is line MN in Figure 2. At this point, all the above algorithms are applied to the gap and flush solution model to obtain the assembly parameters of the array-type thermal protection components.
4.1.3 Matching model
A matching model is used to describe the fit between the inner surface of the thermal protection components and the spacecraft bearing structure. Based on the bonding method between the array-type TPS and the spacecraft bearing structure, it is known that the matching parameter is an important indicator for TPS assembly. As shown in Figure 6, its size characterizes the thickness of the adhesive layer between the two, and the result directly affects the bonding quality of the spacecraft TPS. Excessive or insufficient matching parameters can cause a series of problems, such as bubbles, holes, and interface debonding, in TPSs. Therefore, accurate characterisation of the fitting parameters is particularly important for the assembly of TPSs.
In terms of its curved structure characteristics, the load-bearing structure can be regarded as a typical curved fitting structure with thermal protection components. For this structure, the distance from the inner surface point of a single thermal protection component to the closest point of the load-bearing surface is typically used to evaluate the matching status. Considering the uneven spacing between the two fitting surfaces, this scheme uniformly selects
where
4.2 Point cloud prediction of assembly process state changes
In response to the structural deformation problem caused by changes in the assembly status of spacecraft, a fusion method using laser scanning and sensor detection was adopted in this study to obtain the initial point cloud data of the spacecraft bearing structure in the early stage of assembly. Fiber-optic sensors were pasted in the deformable area to obtain fiber-optic monitoring data under different assembly states. Through heterogeneous data fusion methods, the bearing structure data under different assembly states can be obtained quickly, accurately, and efficiently, maximising the advantages of their respective sensors. The fusion of 3D point cloud data and fiber-optic waveform data is the focus of this section.
4.2.1 Curvature conversion model
In this study, fiber Bragg grating (FBG) sensors were used for complex surface deformation monitoring. When light with a certain width and frequency is incident on the FBG fiber channel and passes through the grating region, light waves with frequencies near
where
The shift in the grating wavelength has a linear relationship to its axial strain. At the same time, at a constant laboratory temperature, the change in the centre wavelength of the FBG is only affected by strain. Assuming that the environmental temperature of the product remains constant during the assembly process and that the structure is only affected by the assembly stress when the assembly state changes, one can obtain the structural strain information at the FBG bonding point. Therefore, a corresponding relationship is establihsed between the strain information and curvature information.
where
By combining Equations 3, 4, the relationship between the curvature and central wavelength drift can be deduced:
For any determined FBG, its
4.2.2 Coordinating value derivation based on curvature
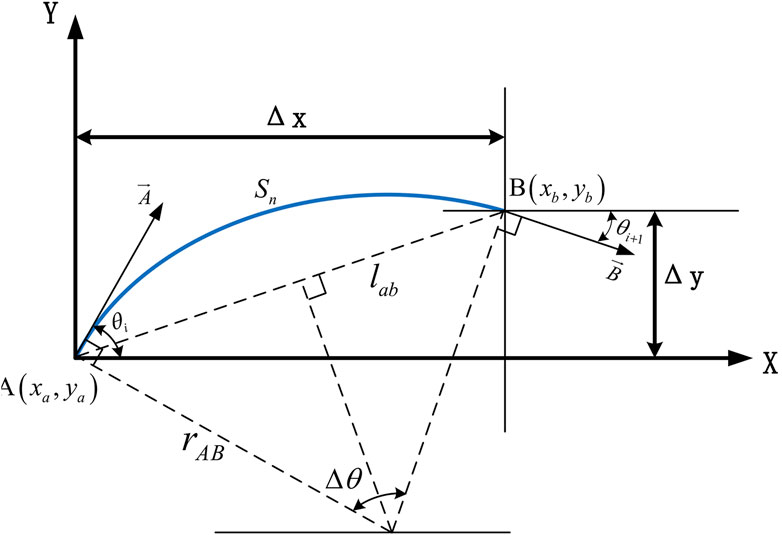
Given the curvature information of multiple points on the bearing structure, it is necessary to increase the number of data points and obtain more curvature data to obtain more-accurate deformation. Therefore, continuity processing is performed on the curvature—that is, the curvature between adjacent measurement points is interpolated. When the two points on the curve are sufficiently close, the curve formed by the two points can be considered to be an arc, and the coordinate points on the curve, i.e., the point coordinates on the deformed surface, can be derived through relevant methods to provide point coordinate data for subsequent data fusion.
A coordinate system is established by taking the
It is known that
In Figure 7,
The chord length
where
Here,
From the above formula,
4.2.3 Optimisation of mesh deformation based on control points
Based on the initial state measurement data obtained previously and the deformation amount of fiber-optic monitoring under different states, fiber-optic monitoring points are used as control points and the Laplace mesh deformation algorithm is utilized to obtain bearing structure data under different assembly states. In the Laplace mesh deformation algorithm, by applying the Laplace operator to the vertices of the discrete mesh model, one can obtain a differential representation called ‘Laplace coordinates’. Compared with traditional Cartesian coordinates, which directly define the spatial position information of each vertex, expressions based on differential coordinates can describe local information, including size and direction. Therefore, the advantage of the Laplace deformation algorithm is that it maintains the details of the 3D model without changing its macroscopic shape.
Generally,
where
In addition, given the differential coordinates of each point, L is introduced as the Laplace matrix to convert the absolute coordinates into relative coordinates.
where
After the deformation of the surface, the new position
where
The equation has a unique least-squares solution:
When the mesh model is deformed, the vertex coordinates of the new model can be obtained by updating the
4.3 Updating assembly parameters for changes in assembly status
4.3.1 Establishment of assembly parameter optimisation model
In response to the difficulty or inability to assemble components caused by changes in the assembly status, the assembly parameters are optimised and updated based on changes in load-bearing structures in different assembly statuses. In this study, the assembly parameters were the gap and flush parameters between the components and the matching parameters between the components and load-bearing structures. Among these, there is a conflict between the flush parameters and the matching parameters, which cannot achieve optimal results simultaneously. Therefore, the parameter update problem in this study is a typical multiobjective optimisation problem that requires coordination and compromise between various objectives to achieve the overall goal as optimally as possible. However, because of the difficulty in solving multiobjective problems in engineering and the complexity of the calculations, multiple constraint conditions are combined, and the multiobjective problem is transformed into a single-objective problem using a weighted-sum method. The specific process is shown in Figure 8.
4.3.1.1 Establishment of objective function
For the problem of updating assembly parameters for changes in assembly status, it is essemtial to focus on updating the pose parameters of various components related to the assembly coordinate system.
First, according to the definition of gap parameters, the objective function is
where:
Second, according to the definition of flush parameters, the objective function is
where
Finally, according to the definition of matching parameters, the objective function is
where
A weight-based fitness function is established by defining the multi-objective parameters mentioned above.
where
4.3.1.2 Establishment of constraint condition model
Owing to the special assembly structure, complex constraint characteristics, large number of coordinated objects, and poor rigidity and brittleness of thermal protection components, it is necessary to establish a constraint condition model based on the assembly optimisation process.
The assembly of thermal protection components is usually done in zones, and different assembly areas have their own assembly boundaries. The boundary constraint condition is
where
The section defined in this study has constraints on the centre point position and normal direction, and the section-related constraints include
where
To satisfy the requirements of the thermal protection assembly, it is necessary to constrain the gap parameters. The constraint condition for the gap parameters is
where
The constraint condition for the flush parameter is
where
The constraint condition for the matching parameter is
where
4.3.2 Improved quantum particle swarm optimisation algorithm
4.3.2.1 Quantum particle swarm optimisation
Quantum Particle Swarm Optimisation (QPSO) is based on particle swarm optimisation (PSO) and combines quantum properties to introduce a local attraction factor. The position of this factor is used as the attraction potential field of the entire quantum system, and other particles search and update their global positions in a bound state. This algorithm increases the diversity of the population during the iteration process, enhances the global optimisation ability of the algorithm, and is more stable than the original PSO algorithm. The process is as follows.
Compared with the PSO algorithm, the QPSO algorithm does not have a velocity vector, and its position iteration formula and local attraction factor formula are
where
where M represents the population size, and D represents the particle dimension.
4.3.2.2 Improved quantum particle swarm optimisation algorithm
The QPSO algorithm performs well in terms of optimisation ability and convergence speed; however, it has shortcomings in terms of the imbalance between global exploration and local development, susceptibility to getting stuck in local optimal solutions, and insufficient global exploration ability. On this article, an improved optimisation algorithm LQPBO is proposed. It is mainly improved in the following three aspects. First, a logistic-sine-cosine chaotic map is used to initialise the population, maintain its diversity, and enhance the optimisation ability of the algorithm. Second, the local and global optimisation capabilities of the adaptive inertia threshold-balancing algorithm are utilized. Finally, the Lévy flight mechanism is adopted to optimise foraging behaviour and improve the global search capability.
• Logistic-sine-cosine chaotic mapping
As a mapping method with real randomness and spatial traversal, chaos functions are applied to the initialisation process of population positions. This is beneficial for reducing particle stacking in the initial particle swarm, improving the diversity of the position distribution, and avoiding the constraints of local optimal solutions. Logistic mapping describes the nonlinear dynamics in one-dimensional dynamic systems with strong randomness and universality. The logistic mapping equation is
where
Sine and cosine mappings utilise the periodicity of the sine and cosine functions to generate chaotic behaviour. The sine- and cosine mapping equations are
where a is the control parameter, usually 4, and the range of the chaotic orbit state values is (0,1).
In response to the problems of uneven particle distribution and easily falling into fixed points in traditional chaotic mapping functions, sine mapping and cosine mapping based on logistic chaotic mapping is employed. The logistic-sine-cosine chaotic map combines the characteristics of logistic, sine, and cosine maps to create a new chaotic system.
where
The population initialization mechanism established based on the proposed logistic-sine-cosine transformation mapping algorithm ensures that the initial solution of the population can be randomly distributed throughout the complete value space, while reducing the constraint of local optima on the initial particles. It can provide a high-quality initial particle swarm with rich diversity and significant particle characteristics for the subsequent update and iteration process of the particle swarm.
• Adaptive inertia weight
The use of fixed inertia weights can easily cause QPSO methods to fall into local optima and can result in the loss of optimal solutions. Appropriate inertia weights help adapt to the global search, enabling the QPSO method to perform global and local searches in the parameter space, thereby obtaining more optimal solutions. Introducing an adaptive inertia weight method to increase the adaptability of the inertia weight as QPSO evolves avoids the problem of decreasing inertia weight as the number of iterations increases and ensures that the adaptability increases as the number of iterations increases through the evolution rate. The adaptive inertia weight is calculated as
where
• Lévy flight mechanism
The Lévy flight mechanism is a random search strategy commonly used in optimisation algorithms that simulates the natural behaviour of certain animals, such as the migration paths of birds, which exhibit a specific type of random walking with a step size following the Lévy distribution. Compared with the Gaussian and Cauchy distributions, the Lévy distribution has heavy tailed characteristics and faster convergence speed, and it provides a wide range of global search capabilities in optimisation. The formula for generating the Lévy flight random step size is
where
where
4.3.2.3 LQPBO performance evaluation
To verify the performance of the improved algorithm, the LQPBO algorithm proposed in this paper was compared with PSO and QPSO on test functions. Six benchmark test functions were selected for the experiment, and the dimensions and search ranges of single peak and multi peak benchmark test functions are shown in Supplementary Table S1. Among them,
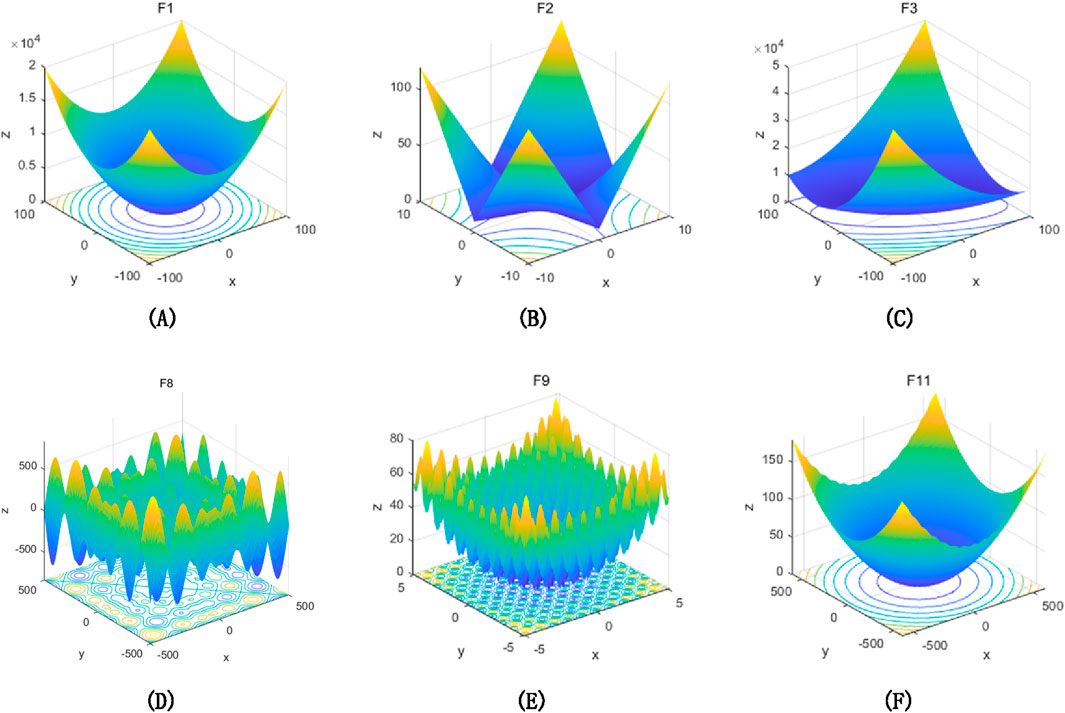
Figure 9. Three dimensional views of unimodal and multimodal functions. (A) 3D view of expression 1, (B) 3D view of expression 2, (C) 3D view of expression 3, (D) 3D view of expression 8, (E) 3D view of expression 9, (F) 3D view of expression 11.
The convergence curves of different optimisation algorithms on 6 benchmark test functions are shown in Figure 10. From the function convergence curve and experimental results, it can be intuitively seen that the LQPBO algorithm has good optimisation ability in different test functions. Compared to the other two algorithms, LQPBO has better solution accuracy and faster convergence speed on the unimodal test function; LQPBO has a stronger ability to jump out of local optima on multi-modal test functions. From this, it can be seen that the improvement strategy proposed in the previous text is effective, and the solving effect and robustness of LQPBO are consistent, better, and more stable than other algorithms, with strong optimisation ability.
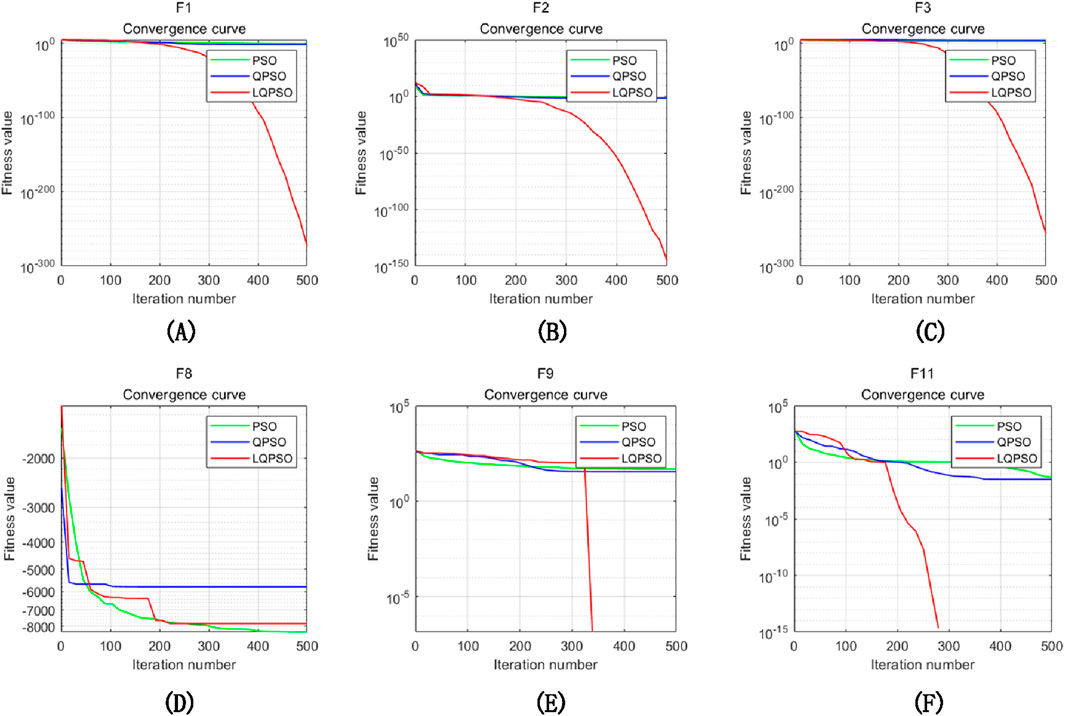
Figure 10. Convergence curves of unimodal and multimodal functions: (A) convergence curve of expression 1, (B) convergence curve of expression 2, (C) convergence curve of expression 3, (D) convergence curve of expression 8, (E) convergence curve of expression 9, (F) convergence curve of expression 11.
5 Results and discussion
5.1 Experimental system and initial parameters
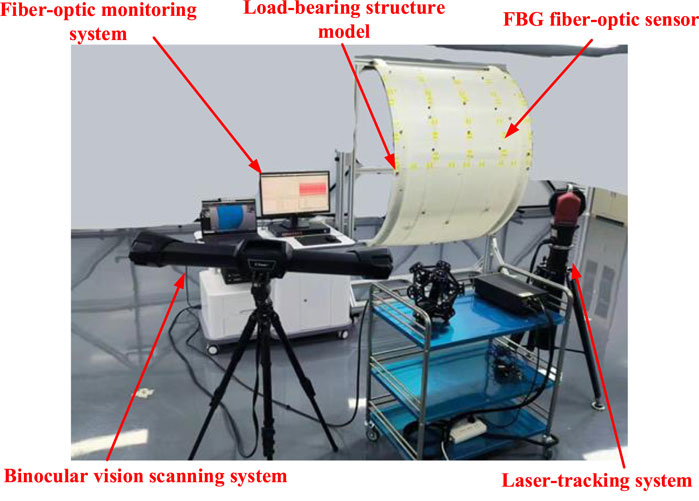
To verify the assembly parameter optimisation and updating model, an array-based thermal protection structure simulation experimental system was constructed. The simulation piece designed in this study consisted of a load-bearing structure model with a curved surface size of approximately 1,200 × 1,300 mm and 52 thermal protection components. All the simulation components were made of acrylonitrile butadiene styrene composite material, which has such characteristics as toughness, hardness, and rigidity. The theoretical gap parameter between the components was 2 mm, the flush parameter was 0 mm, and the gap between the load-bearing structure and the internal surface of the component (matching parameter) was set to 2 mm. As shown in Figure 11, the overall components of the experimental system include array-type thermal protection structure simulation components (including the load-bearing structure and thermal protection components), movable frames, binocular vision scanning systems, fiber-optic monitoring systems, laser-tracking systems, and workstations.
5.1.1 Obtaining 3D point cloud measured data
Taking the upper part of the simulated component as an example, the assembly parameters were optimised based on the characteristics of the partition assembly of the thermal protection structures. After fixing the load-bearing structure, the initial 3D shape point cloud data of the structure and the measured shape data of the thermal protection components were obtained using a binocular vision scanning system. The binocular vision scanning system uses a CREAFORM tracking scanner, consisting of a C-Track optical tracker and an optical coordinate measuring machine 3D scanner, with a scanning accuracy of 0.064 mm (9.1 m3) and a resolution of 0.05 mm. The deviation distribution between the point cloud data of the external surface of the bearing structure and the theoretical data in the initial state ranges from −0.359 to 0.433 mm, and the deviation of the thermal protection components is within ±0.10 mm. A comparison of the deviations between the physical and theoretical surfaces of the bearing structure is shown in Figure 12.
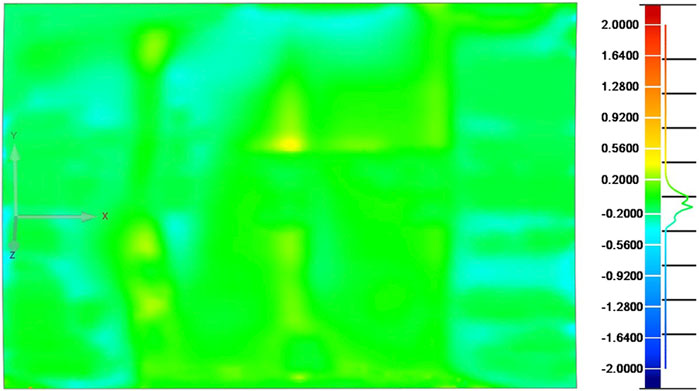
Figure 12. Deviation between measured data and theoretical surface shape of T0 state bearing structure.
After the measured data were obtained, they were simplified to reduce the subsequent parameter optimisation calculations and improve the calculation speed. The results are shown in Figure 13. Figures 13A, B show the measured data of the bearing structure and the simplified point cloud data. The measured data in Figure 13A contain 3,589,808 vertices, and the simplified data in Figure 13B contain 216,028 vertices. Figures 13C, D show the measured data of a single thermal protection component and the simplified point cloud data. The measured data in Figure 13C contain 385,050 vertices, and the simplified data in Figure 13D contain 35,186 vertices. The simplification standards also differed based on the assembly characteristics of the load-bearing structure and thermal protection components. For load-bearing structures that must maintain a certain distance from the thermal protection components, equidistant simplification was performed to facilitate the selection of feature points. For thermal protection components that require gap and flush calculations, a point cloud simplification method based on boundary features was applied to preserve their geometric features.
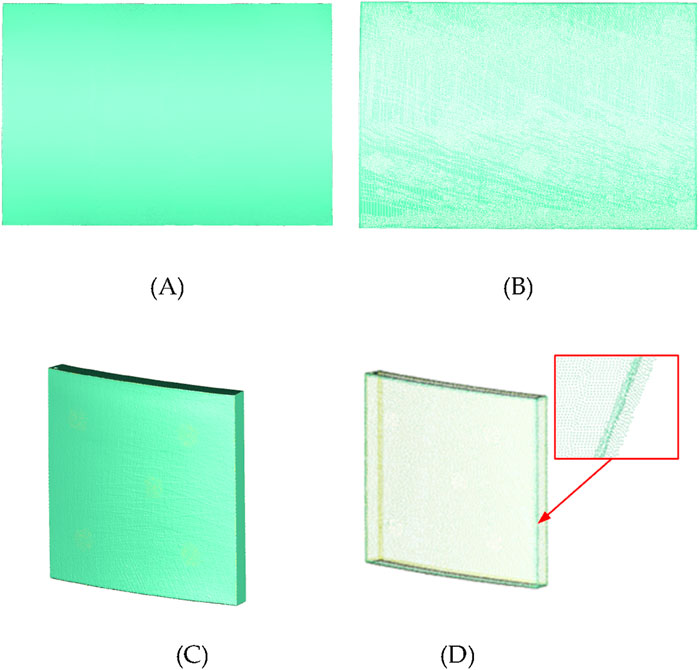
Figure 13. Schematic diagram of simplified measured data before and after simplification: (A) measured data of load-bearing structures, (B) simplified data of load-bearing structures, (C) measured data of thermal protection components, and (D) simplified data of thermal protection components.
5.1.2 Point cloud prediction of assembly status changes
This study focused on optimizing and updating assembly parameters for simulated components in different assembly states. For the overall optimisation and update process, predicting point cloud deformation under different assembly states is a very important step. This study used a fusion of 3D point cloud data and fiber optic wavelength data to obtain the initial state of the load-bearing structure shape point cloud. After obtaining the initial state, a quasi-distributed FBG sensor network is pasted on the simulated component to achieve fast, accurate, and efficient acquisition of load-bearing structure data under different assembly states.
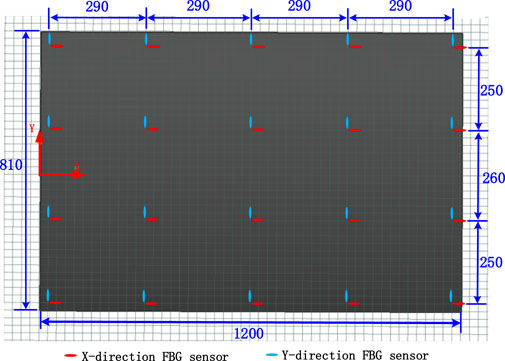
The sensors in this study were arranged in an orthogonal manner, with the sensors in pairs. The sensor network comprised 40 fiber-optic grating strain sensors for a total of 20 measurement nodes. The fiber-optic distributions of the analogue components are shown in Figure 14. The red sensor represents the X-direction strain monitoring point, whereas the blue sensor represents the Y-direction strain monitoring point. Considering the existence of systematic and random errors in the data acquisition process, in this experiment, we selected the Optical System 256 fiber Bragg grating demodulation system from Beijing Xizhuo Information Technology Co., Ltd., which is suitable for signal demodulation of various types of fiber Bragg grating sensors. It has a built-in calibration wavelength reference module and can ensure long-term measurement accuracy of ± 1p.m. in the temperature range of −10°C–55°C. At the same time, due to the significant impact of the accuracy of measuring node positions on the prediction of structural deformation point clouds, we used the laser tracker to assist in the pasting and positioning of optical fibers to ensure the correct positioning of measuring nodes.
5.1.3 Initial parameter definition
In the process of optimising and updating the assembly parameters for an array-based thermal protection structure simulation test system, it is necessary to define the initial parameters. The features that must be defined include changes in the assembly status, the number of thermal protection components, the number of cross sections, the number of feature points for individual component matching parameters, and the theoretical values and constraint tolerances of the assembly parameters. The specific parameter settings are listed in Supplementary Tables S2, S3.
5.2 Result analysis
5.2.1 Accuracy verification of assembly parameter solving model
In this section, in order to verify the effectiveness and accuracy of the gap, flush, and matching parameters, assembly parameter validation was conducted based on the original scanned point cloud, and compared with the measured true values to demonstrate the feasibility of the assembly parameter extraction method proposed in this study. Based on the above experimental setup, 4 thermal protection components were selected for assembly, and the thickness of the adhesive layer was set to 2 mm on the inner surface of the selected 4 thermal protection components. Obtain the external point clouds of the load-bearing structure and the assembled thermal protection components through a visual scanning system, and verify the accuracy of the assembly parameters based on the above point clouds. The specific schematic diagram is shown in Figure 15. As a comparative verification, the gap step values at the corresponding positions were obtained using an external auxiliary material tool (Laser-gauge HS702-F20), and the obtained gap step values were averaged through multiple measurements. The measurement accuracy of the laser gap gun was 0.02 mm.
According to Supplementary Table S4, the difference between the gap flush solving model in this study and the mean measurement of Gap Gun was within ±0.08 mm. The maximum deviation of the gap was 0.08 mm, the average deviation was 0.043 mm, and the maximum deviation of the flush was 0.03 mm, with an average deviation of 0.041 mm. There were two main factors that leaded to the deviation between the two values, the first factors was the deviation between the measured section position and the simulated section position, and the existence of systematic errors also have some impact on the result deviation. The second factors involved the potential inaccuracy of boundary point cloud data, which may arise from format conversion after data processing, ultimately leading to errors. According to Supplementary Table S5, the maximum deviation between the matching solving model in this study and the actual filling layer thickness of thermal protection components is 0.032 mm, and the average deviation is 0.022 mm. According to the constraint tolerance range of the test piece in this study, the assembly parameter solving model can meet the requirements of subsequent assembly optimisation.
5.2.2 Update results of load-bearing structures under different assembly states
This study focused on optimising and updating the assembly parameters for different assembly states of the simulated components. At time T0, the 3D point cloud data of the load-bearing structure were obtained using structured light measurement technology. The results are presented in Section 5.1.1. Subsequently, a quasi-distributed FBG sensor network was pasted onto the simulated component to obtain the deformation results of the load-bearing structure under different assembly states, where T0 is the initial state of the load-bearing structure, T1 is the assembly of the load-bearing structure to the fixture state, and T2 is the state after the installation of the crossbeam and fasteners of the load-bearing structure. The comparison results of the deviation between the load-bearing structure entity and the theoretical surface shape in different assembly states are shown in Figure 16.
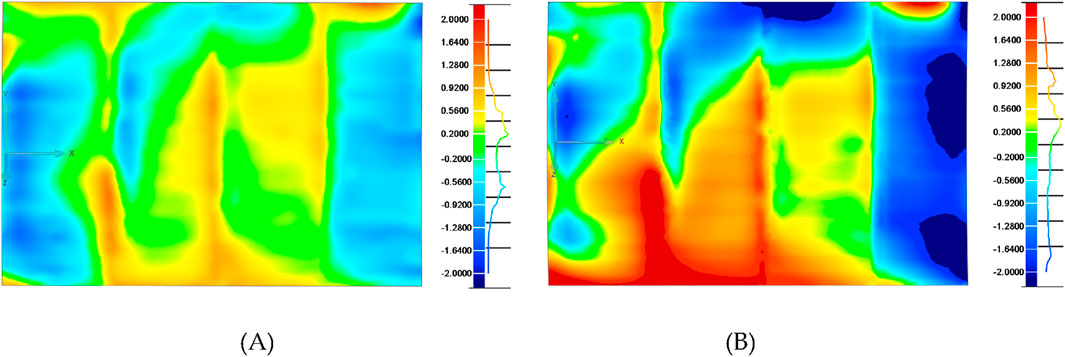
Figure 16. Surface deviations of load-bearing structures in different assembly states: (A) T1 state structure deviation and (B) T2 state structure deviation.
In Figure 16, the right ruler represents the deviation spectrum of the histogram. To clarify the results, the red range indicates that the point cloud data are higher than the theoretical model surface in the normal direction, the blue range indicates that the point cloud data are lower than the theoretical model surface in the normal direction, and the green part indicates that the deviation range is within the range of [−0.2, 0.2]. Figure 16A shows the point cloud deviation of the load-bearing structure at time T1, with a deviation distribution from −1.325 to 1.022 mm. Among them, 94.97% of the point cloud deviation is within the range of [−1, 1]. Figure 16B shows the deviation of the external point cloud of the load-bearing structure at time T2, with a deviation distribution from −2.709 to 2.620 mm. Among them, 85.67% of the point cloud deviations are within the range of [−1, 1].
To evaluate the accuracy of the deformation prediction method for assembly structures, a supplementary experiment was conducted to validate it. By using a binocular vision system to measure the real load-bearing structure surface shape at T1 and T2 respectively, and performing deviation consistency detection with the predicted surface shape, the results were shown in Figure 17. It can be seen that the predicted data of the surface shape at T0 and T1 are highly consistent with the measured data. Among them, 80.97% of the point clouds at T1 are within the range of [-0.1,0.1], and 92.91% of the point clouds at T2 are within the range of [-0.1,0.1].
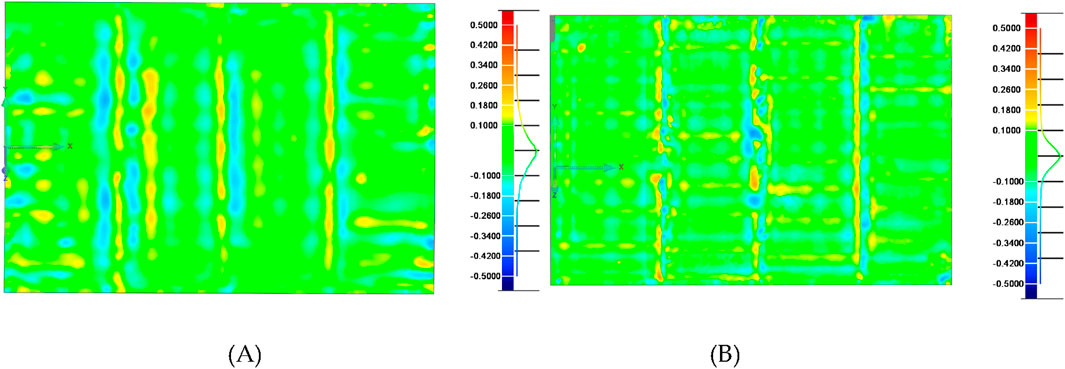
Figure 17. Deviation between predicted and measured point clouds of load-bearing structures in different assembly states: (A) T1 state structure deviation and (B) T2 state structure deviation.
5.2.3 T1 time assembly parameter optimisation update
Based on the initial assembly parameters of the load-bearing structure after the assembly state changes at time T1, including gap, flush, and matching parameters, the maximum, minimum, and mean values of each assembly parameter were calculated. Owing to the large number of thermal protection components, to express the assembly parameters more clearly, the qualification rate was introduced. The qualification rate Level I is half the tolerance for the feature results to satisfy the assembly parameter constraints (i.e., the gap range is 2 ± 0.3 mm), and the qualification rate Level II is the tolerance for the feature results to meet the assembly parameter constraints. Figure 18 shows the relative pose and cross-sectional position of the thermal protection component in the initial state at time T1.
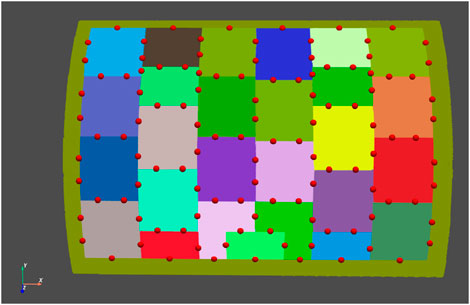
Figure 18. Schematic diagram of the relative position of the simulated component and cross section of the thermal protection structure at time T1.
For the assembly parameters of thermal protection components before optimisation, to facilitate subsequent parameter optimisation and reduce computational complexity, the measured data of thermal protection components are initially matched with their theoretical models. Owing to changes in the assembly status, the load-bearing structure undergoes deformation, and a serious problem occurs in which the majority of the gap and flush parameters are within the constraint tolerance range; however, the matching parameter exceeds the tolerance limit. The results are presented in Table 1.
The assembly parameters are optimised and updated based on the updated bearing structure at time T1. The results are shown in Table 2. After parameter optimisation and updating, the qualification rates for the gap, flush, and matching parameters were 97.41%, 92.24%, and 100%, respectively. To ensure the bonding quality of the thermal protection components, the optimisation weight of the matching parameters was increased such that all the component matching parameters were within the tolerance range.
5.2.4 T2 time assembly parameter optimisation update
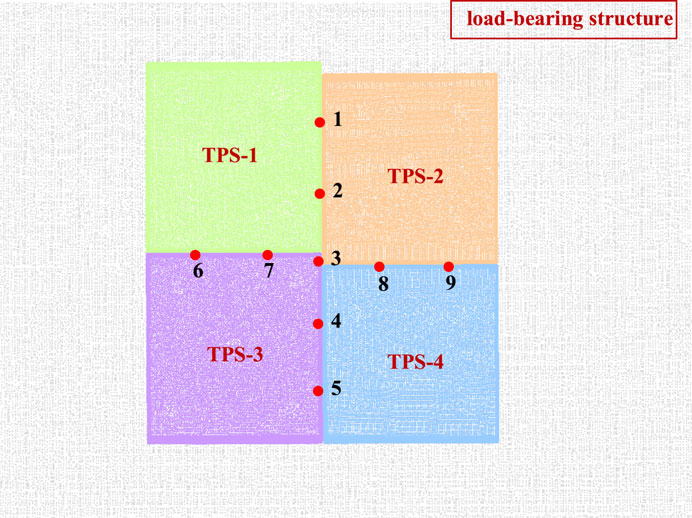
According to the assembly process, seven thermal protection components were assembled after time T1, as shown in Figure 19. Based on the assembled components and load-bearing structure after the state change at time T2 (these seven components were set as fixed components with a cross-sectional quantity of 96), assembly parameter statistics were obtained for the remaining 20 thermal protection components.
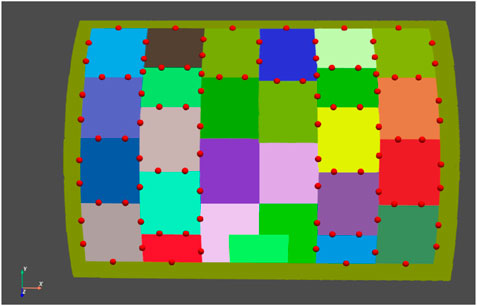
Figure 19. Schematic diagram of the relative position of the simulated component and cross section of the thermal protection structure at moment T2.
Before the assembly parameters at time T2 were optimized, the cross-sectional parameters were the same as those after the T1 optimisation. Because there were already seven fixed components, the total number of sections to be optimised was 96. All the assembly parameters were recalculated, and the results are listed in Table 3. The bearing structure was the updated point cloud data at time T2; therefore, the qualification rate of the matching parameters was only 44.44%.
Based on the updated load-bearing structure at time T2, the assembly parameters were optimised and updated, and the results are listed in Table 4. As the table shows, after parameter optimisation and updating, the qualification rates of the gap, flush, and matching parameters were 95.83%, 88.54%, and 100%, respectively. Owing to the deformation of some areas of the load-bearing structure reaching more than 2.5 mm at time T2, to ensure reasonable fit parameters, the qualification rate of the step difference parameter was lower than that of time T1.
6 Conclusion
A method for updating assembly parameters based on changes in the assembly process state was developed. Based on the measured data of thermal protection components, a solution model for assembly parameters was proposed. To address the deformation problem of the load-bearing structure caused by changes in assembly status, a fusion method based on laser scanning and sensor detection was devused to predict the deformation of the assembly structure during the assembly process. Based on the assembly parameter solution model and the assembly process state change point cloud prediction model, a constraint-based assembly parameter optimisation model was established to achieve assembly parameter updates oriented toward assembly state changes. Finally, an experimental system for array-based thermal protection structure simulation was established to validate the proposed method. The results show that the parameter update method used can achieve ideal states for different assembly state simulation components. For the T1 assembly state, the pass rate of gap parameters was 97.41%, the pass rate of flush parameters was 92.24%, and the pass rate of matching parameters was 100%. For the assembly state at time T2, the pass rate of the gap parameter was 95.83%, the pass rate of the flush parameter was 88.54%, and the pass rate of the matching parameter was 100%. The parameter update method in this study realises the optimisation and update of assembly parameters for thermal protection components, provides auxiliary guidance for the spacecraft thermal protection assembly process, and improves the assembly accuracy and efficiency of spacecraft TPSs.
Data availability statement
The original contributions presented in the study are included in the article/Supplementary Material, further inquiries can be directed to the corresponding author.
Author contributions
YL: Conceptualization, Formal Analysis, Investigation, Methodology, Software, Validation, Writing–original draft, Writing–review and editing. LL: Funding acquisition, Project administration, Resources, Supervision, Writing–review and editing. XL: Conceptualization, Funding acquisition, Methodology, Project administration, Supervision, Writing–review and editing. LG: Conceptualization, Funding acquisition, Methodology, Project administration, Supervision, Writing–review and editing. JS: Validation, Writing–original draft. HW: Software, Writing–original draft.
Funding
The author(s) declare that financial support was received for the research, authorship, and/or publication of this article. This research was funded by Zhongshan Research Institute of Changchun University of Science and Technology introduced innovative research team project (CXTD2023006), Science and Technology Research Project of Education Department of Jilin Province (JJKH20230819KJ), the Key Research and Development Project of the Jilin Province Science and Technology Development Program (No. 20200401019GX) and the Zhongshan Social Public Welfare Science and Technology Research Project (No. 2022B2013).
Conflict of interest
The authors declare that the research was conducted in the absence of any commercial or financial relationships that could be construed as a potential conflict of interest.
Publisher’s note
All claims expressed in this article are solely those of the authors and do not necessarily represent those of their affiliated organizations, or those of the publisher, the editors and the reviewers. Any product that may be evaluated in this article, or claim that may be made by its manufacturer, is not guaranteed or endorsed by the publisher.
Supplementary material
The Supplementary Material for this article can be found online at: https://www.frontiersin.org/articles/10.3389/fphy.2024.1453917/full#supplementary-material
References
1. Sun J, Zhu Q. A physical model for solving the dredging thermal protection system of hypersonic vehicle leading edge. AIP Adv (2019) 9(2):025203. doi:10.1063/1.5083820
2. Hai-Bo X, Kun-Yang F, Jing-Xing Y, Xing-Rong L, Feng-Mei H, Zeng-Yao L. Design and evaluation of variable porosity charring composite for thermal protection system of reentry vehicles. Case Stud Therm Eng (2022) 37. doi:10.1016/J.CSITE.2022.102305
3. Song P, Gao M, Liang Z, Yang G, Wang F, Liu J, et al. Simulations and experimental study on imaging of thick defect in reusable thermal protective system using microwave NDT. Measurement (2024) 233:114713. doi:10.1016/j.measurement.2024.114713
4. Zhou D, Du B, Guo T, Li Q, Lu Z. Application of a gas-kinetic BGK scheme in thermal protection system Analysis for hypersonic vehicles. Entropy (2022) 24:1325. doi:10.3390/E24101325
5. Yakimov AS, Zimin VP, Efimov KN, Ovchinnikov VA, Gaar SA, et al. Mathematical modeling of active thermo-emission thermal protection system of aircraft in high speed air flow. Bristol, United Kingdom: IOP Publishing (2018) 012021. doi:10.1088/1742-6596/1105/1/012021
6. Long K, Xie Q, Lu D, Wu Q, Liu Y, Wang J. Aircraft skin gap and flush measurement based on seam region extraction from 3D point cloud. Measurement (2021) 176(6):109169. doi:10.1016/J.MEASUREMENT.2021.109169
7. Wang Q, Dou Y, Li J, Ke Y, Keogh P, Maropoulos PG. An assembly gap control method based on posture alignment of wing panels in aircraft assembly. Assembly Automation (2017) 37(1):422–33. doi:10.1108/AA-04-2016-031
8. Wang H, Li M, Wei Q. Virtual matching measurement of gap and flush. In: IEEE Xplore. 2021 14th International Symposium on Computational Intelligence and Design (ISCID). Hangzhou, China (11-12 December 2021). 2473–3547. doi:10.1109/ISCID52796.2021.00052
9. Li S, Wang S, Hou G, Huang X, Jiang Y. A method for constructing non-ideal geometric features of thermal insulation tiles based on measured data. Meas Sci Technology (2023) 34:045009. doi:10.1088/1361-6501/ACAF13
10. Li C, Hu J, Kang R, Yang YH, Jin J, Tian W. Structural deformation and clamping force monitoring of reconfigurable tooling motivated by strain data in aircraft assembly. Bristol, United Kingdom: IOP Publishing Ltd (2024) doi:10.1088/1361-665X/ad3eca
11. Gaggero S. An effective mesh deformation approach for hull shape design by optimization. J Mar Sci Eng (2021) 9. doi:10.3390/jmse9101107
12. Zhe C, Fumin Z, Xinghua Q, Liang B. Fast measurement and reconstruction of large workpieces with freeform surfaces by combining local scanning and global position data. Sensors (2015) 15(6):14328–44. doi:10.3390/s150614328
13. Wang C, Wang Z, Wang H, Chen Z, Tian Y, Yang Y, et al. Customized deformation behavior of morphing wing through reversibly assembled multi-stable metamaterials. Bristol, United Kingdom: IOP Publishing Ltd (2024) doi:10.1088/1361-665X/ad2e3a
14. Wang B, Long Z, Chen X, Feng C, Zhao M, Sun D, et al. Research on LiDAR point cloud data transformation method based on weighted altitude difference map. Front Phys (2024) 12:1387717. doi:10.3389/fphy.2024.1387717
15. Jiang Y, Huang X, Li S, Deng Z. A coordination modelling approach for assembly of multi-constrained objects based on measured skin model. Assembly Automation (2019) 39(2):380–91. doi:10.1108/AA-04-2018-058
16. Li D, Liu J, Feng L, Zhou Y, Qi H, Chen Y. Automatic modeling of prefabricated components with laser scanned data for virtual trial assembly. In: Computer aided civil and infrastructure engineering (2020) doi:10.1111/mice.12627
17. Thomas J, Gurusamy S, Rajanna TR, Asokan S. Structural shape estimation by mode shapes using fiber bragg grating sensors: a genetic algorithm approach. IEEE (2020) 20(6):2945–52. doi:10.1109/jsen.2019.2934366
18. Shao C, Ye X, Wang L, Zhang Z, Zhu D, Qian J An assembly process parameters optimization method for precision assembly performance. Bristol, United Kingdom: IOP Publishing (2019) 012136. doi:10.1088/1742-6596/1303/1/012136
19. Liu Y, Yan D, Li L, Lin X, Guo L. Three-dimensional mapping technology for structural deformation during aircraft assembly process. Photonics (2023) 10(3):318. doi:10.3390/PHOTONICS10030318
20. Cheng J, Lu H, Xie FM, Zhu PY. Structural deformation reconstruction of polymer distributed optical fiber sensing tape based on ko theory. J Phys Conf Ser (2022) 2366(1):012016. doi:10.1088/1742-6596/2366/1/012016
Keywords: thermal protection system, fiber optic sensor data, 3D point cloud data, data fusion, state change, assembly parameters, model establishment, optimization algorithm
Citation: Liu Y, Li L, Lin X, Guo L, Sun J and Wang H (2024) Updating assembly parameters for spacecraft assembly process state changes: based on data fusion method. Front. Phys. 12:1453917. doi: 10.3389/fphy.2024.1453917
Received: 24 June 2024; Accepted: 30 September 2024;
Published: 16 October 2024.
Edited by:
Xukun Yin, Xidian University, ChinaReviewed by:
Lei Wang, Beihang University, ChinaWei Ren, Xi’an University of Posts and Telecommunications, China
Copyright © 2024 Liu, Li, Lin, Guo, Sun and Wang. This is an open-access article distributed under the terms of the Creative Commons Attribution License (CC BY). The use, distribution or reproduction in other forums is permitted, provided the original author(s) and the copyright owner(s) are credited and that the original publication in this journal is cited, in accordance with accepted academic practice. No use, distribution or reproduction is permitted which does not comply with these terms.
*Correspondence: Lijuan Li, Y3VzdGp1YW5AMTYzLmNvbQ==
 Yue Liu
 Lijuan Li1,2*