- 1Blockchain and Distributed Ledger Technologies Group, Universität Zürich, Zürich, Switzerland
- 2UZH Blockchain Center, Universität Zürich, Zürich, Switzerland
- 3Institute of Finance and Technology, University College London, London, United Kingdom
- 4DLT Science Foundation, London, United Kingdom
- 5Consiglio Nazionale delle Ricerche, Institute of Complex Systems, Rome, Italy
- 6Department of Molecular Sciences and Nanosystems, “Ca’ Foscari” University of Venice, Venice, Italy
- 7European Centre of Living Technologies, University of Venice “Ca’ Foscari”, Venice, Italy
- 8London Institute for Mathematical Sciences (LIMS), Royal Institution, London, United Kingdom
We explore patterns, regularities, and correlations in the evolving landscape of Ethereum-based tokens, both ERC-20 (fungible) and ERC-721 (non-fungible) to understand the factors contributing to the rise in certain tokens over others. By applying network science methodologies, minimum spanning trees, econometric autoregressive–moving-average (ARMA) models, and the study of accumulation processes, we are able to highlight a rising centralisation process. Not only do “rich” tokens get richer, but past transactions also emerge as more reliable predictors of new transactions. Our findings are validated across different samples of tokens.
1 Introduction
The introduction of the ERC-20 and ERC-721 token standards within the Ethereum blockchain has led to a remarkable ease and flexibility in creating new cryptoassets, all sharing a common technical foundation. This standardisation enables large-scale studies of these assets, which display fascinating complexity and variety. This paper aims to investigate Ethereum-based tokens and cryptoassets through various lenses, including network science, autoregressive methods, and accumulation processes. We consider a comprehensive sample of assets, ranging from established tokens with extensive trading activity to ones that have no off-chain market but are used in a large number of on-chain transactions. Using a combination of correlation filtering via minimum spanning trees and econometric models, we analyse the relations between tokens based on their on-chain transaction records and off-chain market prices. Our findings substantiate the fact that even among tokens, the “rich get richer.”
1.1 An introduction to Ethereum-based cryptoassets
Blockchain is a distributed and decentralised technology that stores a list of transactions, while ensuring their consistency and integrity [1]. Satoshi Nakamoto introduced this technology in 2008 to solve the double-spending problem in digital currencies [2]. Buterin [3] first proposed and soon launched Ethereum, a public blockchain that included a Turing-complete computing platform using smart contracts, i.e., programs that are stored and executed directly on the blockchain. Smart contracts, with their flexibility, gave rise to a myriad of cryptoassets including tokens, both fungible (FTs) and non-fungible (NFTs), which currently underpin many decentralised finance (DeFi) applications.
The Ethereum Request for Comments 20 (ERC-20) [4] sets the standard for fungible (identical and interchangeable) non-native tokens running on top of the Ethereum network. This specification defines an interface including methods to transfer value and visualise the current balance. Subsequently, the Ethereum Request for Comments 721 (ERC-721) [5] defined a similar set of specifications for unique, non-fungible digital assets. These two interfaces, together with new specifications that have further extended them, define a transfer method that records an event on the Ethereum blockchain, which we are then able to capture and analyse. The number of such tokens has been increasing steadily, from 272,600 in May 2021 to 510,211 in July 2022 [6] and 1,178,667 by 4th May 2024, or block 19,800,000, the end date we considered in this study.
Cryptoassets are increasingly regarded as viable investment options, not only by technology-savvy specialists but also by a broader, less specialised audience of investors. Unlike traditional markets, these emerging markets may lack a comprehensive regulatory framework, a condition that presents both risks and opportunities. For instance, NFTs are transforming the digital arts and alternative asset markets, serving diverse purposes from art collection to granting unique titles that claim ownership of real-world assets. Investigation of the interrelationships among various cryptoassets, including cryptocurrencies, tokens, NFTs, and DeFi products, can reveal whether the success of one asset influences the performance of others. Such analyses enable investors to optimise their portfolios and mitigate the cascading effects of shocks and crises. The study of regularity in price fluctuations has attracted not only investors but also scientists, who have frequently drawn inspiration from financial markets to make seminal contributions to hard sciences. For example, the concept of random walks, as in Bachelier [7], and fractal theory, as in Mandelbrot [8], emerged from examining price variations and financial data. Investors typically analyse past correlations to formulate reliable predictions for future trends, with the goal of achieving higher returns.
The scope of this paper is to compare the most relevant Ethereum-based ERC-20 and ERC-721 cryptoassets to extract patterns and regularities.
1.2 Literature and contribution
Numerous studies on cryptoassets have adopted a complex network perspective; for instance, Bovet et al. [9], Kondor et al. [10], and Vallarano et al. [11] focused on Bitcoin transaction networks. Other research studies, such as Campajola et al. [12], Kondor et al. [13], Ferretti et al. [14], and Guo et al. [15], investigated Ethereum but did not specifically address Ethereum-based tokens. In contrast, Somin et al. [16, 17] modelled the entire Ethereum ERC-20 token ecosystem as a dampened oscillator, an approach we find very inspiring. However, the most influential studies for our research are Victor and Lüders [18] and Chen et al. [19], which have pioneered the application of network science framework to the study of tokens. These studies were conducted using data up to 2018 and 2019, respectively; in comparison, our analysis incorporates a richer dataset, including data up to 2024 and additional market data. Moreover, we have explored preferential attachment on a longitudinal level, an aspect not considered in earlier papers. Chen et al. [19] also explored the networks of creators and asset holders to understand the dynamics of individual asset holders, which is an interesting line of research that we do not pursue in this paper. Previous studies from some of the authors of this paper, such as De Collibus et al. [20] and De Collibus et al. [21], also used network science to investigate tokens, but with a more limited scope.
Given the relatively young age of cryptoasset markets, their interdependencies have not been studied to the same extent as those of traditional financial markets. Dependencies, correlations, mechanisms, cycles, booms, and busts in the crypto sector are still under-researched. There have been notable studies, such as Griffin and Shams [22], which analysed the hidden interactions between the USDT Tether market and Bitcoin market prices. In contrast, other research studies, such as Taleb [23], projected extremely pessimistic outcomes for Bitcoin and crypto investments. Although many economic studies, such as Acharya and Schnabl [24], have explored crises and connections between traditional markets, assets, and stock exchanges, these themes are not yet well-explored for cryptoassets. Liu and Liu [25] used the available institutional investment data to construct a co-investment network but did not use transactional data directly from the blockchain. A comprehensive study by Watorek et al. [26] analysed the 100 most capitalised cryptocurrencies, both native and tokens, across different exchanges like Kraken and Binance, employing high-frequency trading data and the minimum spanning tree (MST) methodology. Our contribution focuses more on tokens, analysing a greater number of such cryptoassets and considering token transfer events as well. Tokens are often at the center of “rug pulls”, i.e., fraudulent activities, where a token is offered to the public as an investment in a project, but the proceedings are then cashed out by the scammers rather than being invested in the development. Cernera et al. [27] studied Binance and Ethereum ecosystems and found out that 60% of the tokens have less than 1 day of active life cycle and are used for rug pulls. Similar activities have been observed in the NFT market [28]. For a more general introduction about NFTs, their usage, and future perspectives, Ali et al. [29] provide a good overview.
Regarding market prices, Heinonen et al. [30] constructed a network of ERC-20 tokens based on their cross-correlations for price fluctuations but could not identify any hierarchical structures or groupings. The authors expressed the desire to analyse, in future research, a larger sample than the 458 tokens considered up to 2019. We aim to contribute to this research goal by expanding the sample size and employing different analytical techniques.
Regarding the application of complex networks in finance, Bardoscia et al. [31] provide a good overview and introduces most relevant methodologies. The initial intuition about the correlation matrix between the stocks traded in a financial market and the possibility of deriving a minimal spanning tree was first suggested by Mantegna [32] and further expanded upon by Bonanno et al. [33] and Coronnello et al. [34].
2 Methodology
2.1 Dataset
For this study, we analyse token transfers taking place on the Ethereum blockchain. Transactions that result in a token transfer produce digital records, which can be extracted from Ethereum logs using tools such as Ethereum-ETL [35] and a fully synchronised Ethereum client (such as Go Ethereum, geth, or any other compatible client such as Erigon). This data collection method allows us to efficiently gather all token transfer-related events. From now on, we will refer to such events with the expression “token transactions” as well.
The utilised data have been extracted locally for speed of processing, but are freely available from other sources as well, such as Medvedev [36]. We aggregate all these transactions per token and sort them according to the Ethereum block number, hence obtaining time series with the token transactions.
In this way, we are able to obtain approximately 1,178,667 different tokens up to 4 May 2024. Of course, not all tokens are equally relevant; the vast majority of them do not have enough “traffic” in terms of number of transactions to be deemed relevant. These tokens might be created as experiments, as a temporary collateral asset to lend or stake, or they might have simply failed in gaining further traction. In our study, we set a threshold of significance of 10,000 minimum transactions for a token to be considered relevant; this threshold corresponds to 14,958 tokens or 1.27% of all the existing tokens. The consequences of applying this threshold are discussed more in depth in the Section 4. Transfer events are considered independently from the type of assets transferred. It could be the amount of tokens or the identifiers of unique digital assets. For the computational issues in filtering token and token events in Ethereum, see the study by Cernera et al. [27].
We first build a full, cumulative undirected network formed by unique addresses (represented as nodes taking part in the transaction networks) for each token. Then, given the multilayer nature of these networks sharing their address space on the same Ethereum network, we verify if the networks share addresses or edges. As a complementary criterion, we consider tokens that have been actively traded on public markets, which are tracked by coinmarketcap [37] and coingecko [38], two popular market aggregators, from which we obtain the information about market capitalisation for every token. We use different sources to complement and integrate the range of our available data; from April 2016 to May 2024, we obtain 2,530 Ethereum-based ERC-20 tokens that have or have had in the past a market capitalisation. We do not consider NFTs because of the differences in unique asset prices, which make it difficult to express the daily fluctuations of a whole collection.
For our analysis, we use market capitalisations and their log-return correlations rather than prices as the latter would not be particularly informative, for example, in the case of stablecoins, which are designed to be pegged to a fixed value in time (typically 1 US dollar). Other tokens dynamically increase and burn part of their supply, so employing market capitalisation avoids potential pitfalls caused by the large variety of token designs. We then consider the number of transactions in terms of time series of daily token transfer events, which, contrary to the cumulative network, can occur multiple times. For this time series, we consider once again the 14,958 tokens with more than 10,000 transactions. We need to note that the tokens with a market capitalisation are a fraction (2,530) of the sample considered by number of blockchain transactions (14,958) and that not all the traded tokens have more than 10,000 transfer events, but only 1,744 satisfy the condition.
3 Results
3.1 Token networks
We calculate the undirected cumulative network of transactions for the resulting top 14,958 tokens (in terms of the number of token transfer events) and the overlap in terms of nodes that appear in all the other networks. We can do this because the networks are multilayered, sharing the same address space as in Ma et al. [39]. For every pair of networks, we compute the Jaccard index
The average Jaccard index
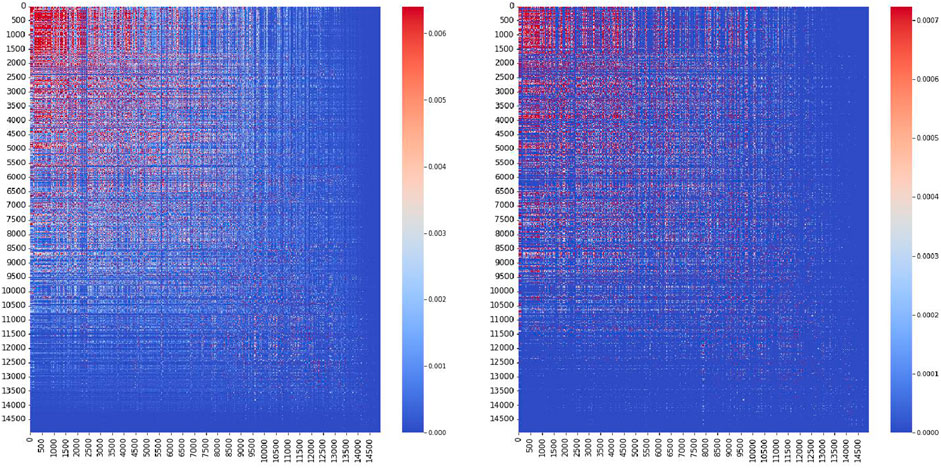
Figure 2. Heatmap of the Jaccard index between the 14,958 token transaction networks with more than 10,000 transactions. Nodes are on the right, and edges (considered undirected) are on the left. For a better visualisation, the tokens are ordered according to the average of the Jaccard index for nodes in both heatmaps. It emerges a cluster of token networks sharing addresses and edges.
We observe a cluster of tokens characterised by a higher average Jaccard index. Tokenfy (TKNFY), with the highest average Jaccard index among nodes, is indeed a legitimate token playing the role of main currency within its own ecosystem. However, the subsequent ten tokens with the highest average Jaccard indices are either fake or have been associated with scams. These include counterfeit tokens purportedly representing brands such as Louis Vuitton, Dolce and Gabbana, and Mercedes Benz. The high Jaccard index of these tokens likely results from sharing a common pool of addresses within dubious networks, which may facilitate the artificial generation of traffic with fraudulent purposes. This result is consistent with what has been observed by Cernera et al. [27].
Among the tokens with the lowest Jaccard indexes, we find instead “authentic” tokens such as Pony Token (PNT), Inanomo Nominum (INOM), BinaCoin (BCO), and POMZ, which appear to be regular projects with their own specific audiences and target communities, probably more isolated from the mainstream ones, which would explain the low Jaccard index.
3.2 Correlation analysis
We now focus on the analysis of market prices. We concentrate our analysis on a total 2,530 ERC-20 tokens with recorded market caps from January 2016 up to May 2024. From the market capitalisation
It is then possible to examine all potential pairs of assets and calculate the correlation between their respective returns
where
By definition, the correlation can vary from −1, where two variables are completely anti-correlated, i.e., an increase in one results in a decrease in the other, to 1, where they are completely correlated. Additionally, we consider the time series of added daily transactions for the same tokens during the corresponding time period so as to render the results comparable. As a precaution, given the long time period considered (8 years), we only consider correlations to be meaningful if we have pair observations for at least 30 days or when the p-values of correlation
In this way, we obtain a
Figures 3, 4 depicts the resulting correlation matrices as heatmaps. For convenience of representation, the ordering of cryptoassets
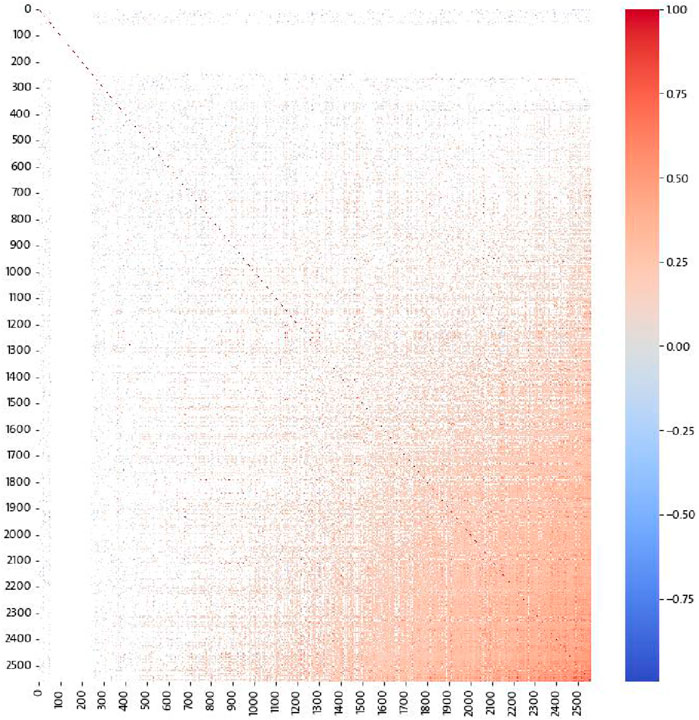
Figure 3. Heatmap of Pearson’s correlation
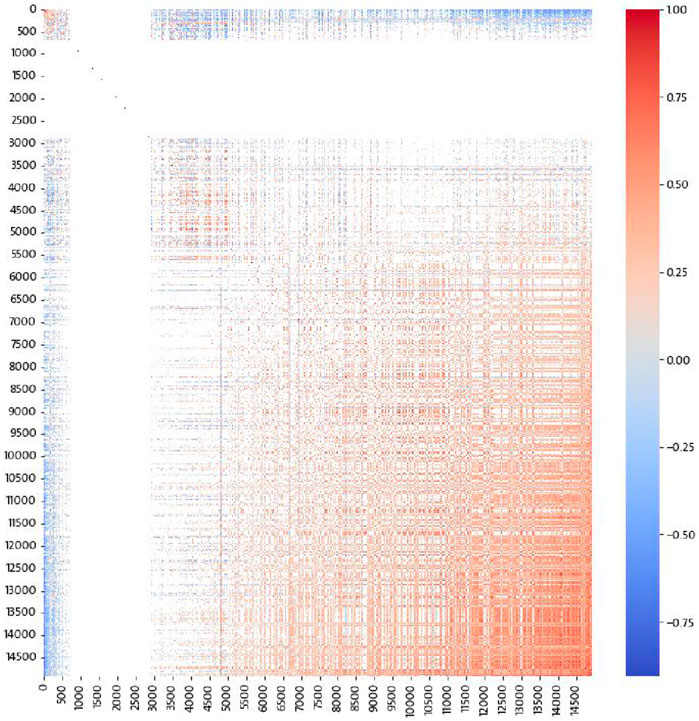
Figure 4. Heatmap of Spearman’s correlation
We observe on average a relatively strong correlation between asset prices, pointing to the fact that ERC-20 cryptoassets behave cohesively as an investment class. The ones whose log returns on average are most correlated to the rest of the market are Gem Exchange and Trading (GXT) token, which, according to Etherscan [40], is a decentralised big data platform, with “the goal to store DApp users’ data as blockchain, and transparently manage and provide the data”. The second token with the largest average correlations is Fei USD (FEI), which “represents a direct incentive stablecoin which is undercollateralised and fully decentralised. FEI employs a stability mechanism known as direct incentives - dynamic mint rewards and burn penalties on DEX trade volume to maintain the peg”, as shown in the study by Etherscan [40]. The third token by average correlation is the Global Rental Token (GRT), which according to Etherscan [40] is “a project that will provide brokerage services for rent vehicle between customers and vehicle rental companies from all over the world”. These three projects appear quite heterogeneous and cover very different aspects of the crypto and token world.
On the opposite side of this spectrum, we find the tokens that have the least average correlation to the rest of the market. These tokens are Ontology (ONT) token, “a project designed to bring trust, privacy, and security to Web3 through decentralized identity and data solutions” [40]; Hashmask (uMASK), a project regarding hashmasks; and GENRE (GENRE) token, the social token of Leaving Records, an independent record label in Los Angeles as in coinmarketcap [37]. For the last two tokens, the information is very scarce, implying that the two projects might not have been very successful.
For daily new token transaction instead, we find the asset with the highest average correlation to be Wrapped Ether (WETH), a tokenised version of the native cryptocurrency Ether. The second token is the SushiSwap Liquidity Provider (SLP), tracking ownership of liquidity positions on the decentralised exchange SushiSwap, and the third token is the relatively obscure token GREENMEM, with scarce information available. On the contrary, the least correlated assets on average are Compound DAI, a version of the algorithmic stablecoin DAO for the compound interest protocol, Sablier, which provides infrastructure for money streaming and token distribution, and lastly, the AIMutant (AIM) is a project related to the Digital Art NFT market (all the descriptions are taken from Etherscan [40]).
We observe DeFi applications at both ends of our analysis, with the top ones apparently more successful than the least correlated ones. However, the results of correlating the number of transactions suggest that they may provide a better indicator of token dynamics, especially over such an extended period.
3.3 Minimum spanning tree and labels
The relationship between tokens can be modelled as a graph, where nodes are linked with weighted edges reflecting their strength of interaction. Trees are a convenient way of representing data because they connect a fixed number of vertices through the minimal number of edges, and they are frequently used to compress information in complex systems. Using the correlation values obtained in the previous steps, we can first form a complete undirected graph, where each edge weight is determined by the correlation value, and then obtain a minimum spanning tree (MST).
The MST (see Battiston et al. [41]) is a subset of the edges of a connected, edge-weighted undirected graph that connects all the vertices together, without any cycles and with the minimum possible total edge weight. Calling the set of vertices
where
The correlation
With this choice,
With our correlation matrix
Following the example from Caldarelli and Chessa [42], we can apply Prim’s algorithm [43] to this complete graph with the metric distances. Starting from the complete graph,
Figure 5 shows plot the MST for the log-return
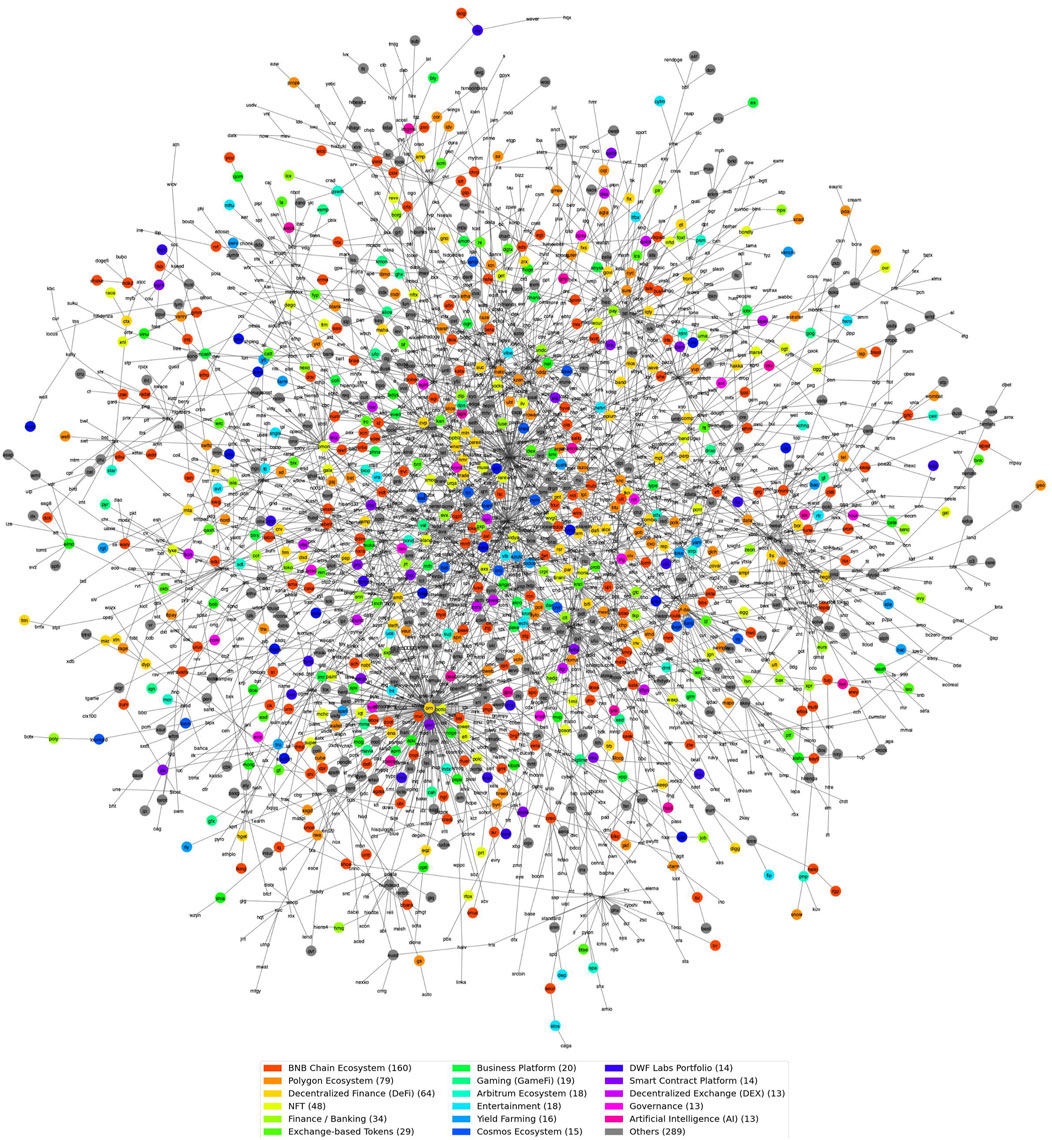
Figure 5. Minimum spanning tree of correlation of log returns on market caps transformed into metric distance with labels for each token.
An insightful analysis that can be done on MSTs is detecting basins of correlation, i.e., nodes that are at the root of a major branch. This is done by traversing the graph from the leaf nodes, following the methodology described in Mastrandrea et al. [44]. For market prices, we identify “Fireball” (FIRE) token as the root of the MST, which claims to be “an autonomous staking rewards and gaming platform […] an ERC20 deflationary token is created to reward stakers on fireball staking platform” [37]. The website pointing to the whitepaper is no longer reachable, and the token appears to be discontinued. We take the same MST approach applied to the correlations between new transactions
To present a more granular idea of the relationships between the tokens, we adopt the classification of tokens from coingecko [38]. This classification is sourced by the community, so it can be error-prone and contains multiple labels for every token, but it is an indicator of how the community perceives different projects and assesses their similarity. Since nodes can have multiple labels, the colouring of nodes on the MST shown in Figure 5 is given by the label of that node that is most common among all tokens in the sample. We obtain labels (7) for only 907 of the 2,530 tokens analysed for log returns (Figure 5) and 1,297 tokens out of 14,958 for daily token transfer events (Figure 6). To keep the visualisation readable, the less frequent labels have been grouped under “Others.” We notice a certain grouping of similar labels. Figures 5, 6 show the MST highlights regularities in token classifications: tokens with the same labels or belonging to the same ecosystem appear to be near each other, suggesting some degree of proximity, though not forming strictly homogeneous clusters. A bar plot with the occurrences of labels can be seen in Figure 7.

Figure 6. Minimal spanning tree of correlation
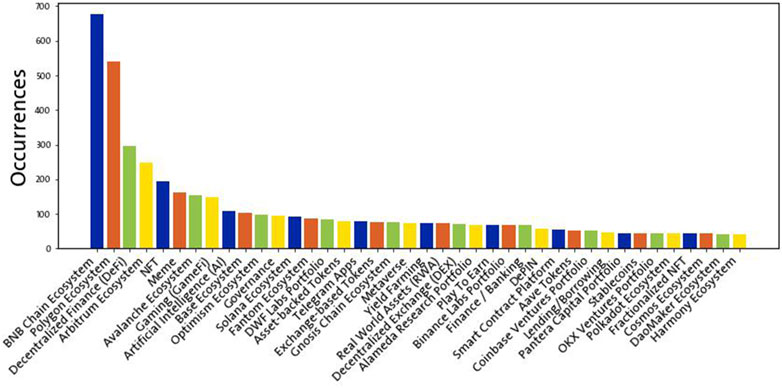
Figure 7. Bar plot of the occurrences of label in addresses, each addresses can have multiple labels, but only the most frequent one per token is showed in the previous MST. The most trivial labels which could make sense for generic cryptoassets but not specifically for our tokens (such as “the Ethereum ecosystem”) have been removed.
To understand possible similarities between the two MST basins, we compute for each node the Jaccard similarity index between node neighbourhoods. Given the different sizes and nodes of MST, the average Jaccard index is 0, so the two MSTs are rather different. We run a multiple linear regression analysis to quantify the relations between the number of new transactions, log-returns, and token labels. However, we find no significant relation at the cross-sectional level. This motivates us to extend the analysis to a time-series framework, using autoregressive–moving-average (ARMA) models.
3.4 ARMA methods for token transfer event time series
The number of token transfer events appears to be a significant indicator of token dynamics. We focus on their temporal evolution to determine if past transactions are an efficient predictor for new transactions. To do so, we consider only time series of daily token transfer events, with a time period up to May 2024; we conducted the augmented Dickey–Fuller test and rejected the null hypothesis of non-stationarity of these time series.
The ARMA model expresses a time series as a linear function of its past values and past white noise residuals. It combines the AR(p) and MA(q) models, and it is denoted as ARMA (p, q), where
Given a time series
where
The
To assess the goodness of fit, we use the computed
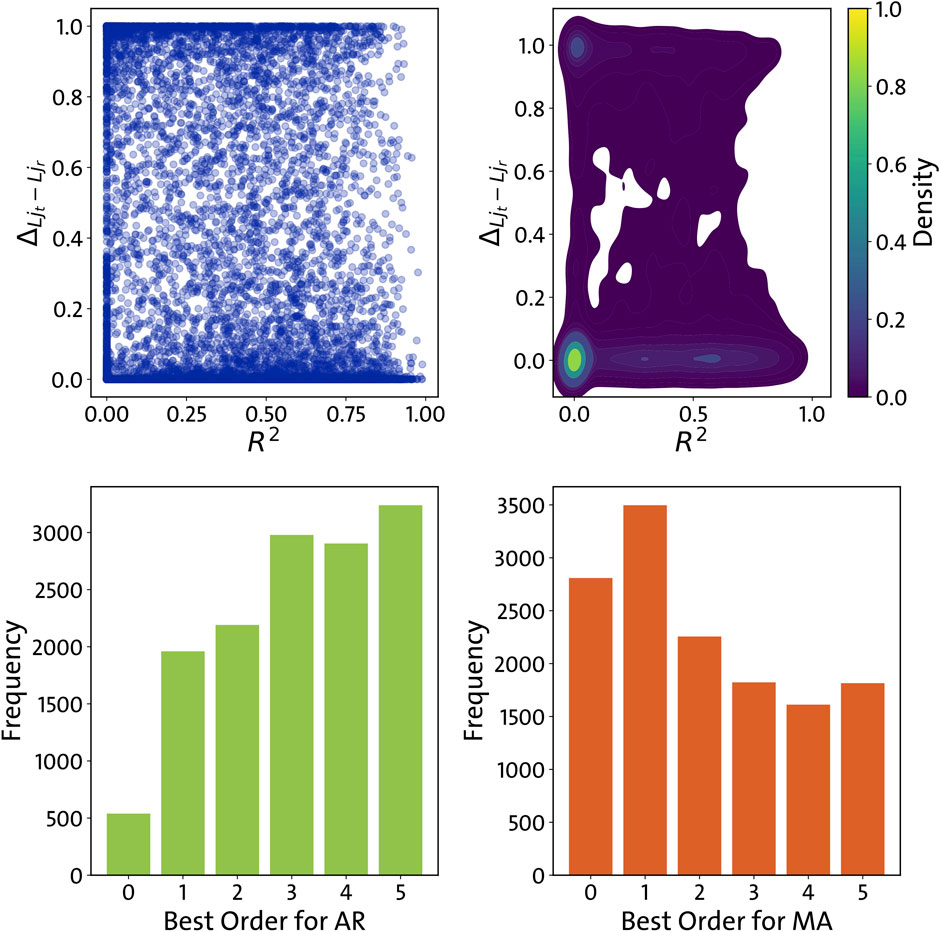
Figure 8. Upper left: the scatter plot
As we see from
Overall, a strong and persistent autocorrelation seems to emerge in the number of transactions that are added to the blockchain every day, which is only partly captured by the linear ARMA models. This leads to one last question: what drives this persistence?
3.5 “Rich” tokens get richer
The distribution of the number of transactions across tokens is very heavy-tailed, with the vast majority having very few transactions and relatively very few tokens having millions of them. We fit the parameters of the distribution with the method shown by Alstott et al. [45]. Using a power law means that the probability
Despite the insights provided by the power law model, the lognormal distribution fits our data more accurately (as in 9), with
We propose that this phenomenon results from a dynamical process. Assuming a flat structure where all tokens are initially equal, we consider the likelihood that a new token transfer transaction occurs within a specific token network. This dynamic process unfolds as follows: when a new token transfer event happens on the Ethereum network, we postulate that the selected token network
This is analogous to the Yule–Simon process, where the likelihood of an entity (e.g., a token) accumulating a particular attribute (e.g., transactions) is proportional to its current count. In other words, entities that already have a high count of attributes are more likely to gain even more, leading to a “rich get richer” scenario. We define
where
In this context, the function
When creating a new transaction, if the probability of choosing a given token is based on Equation 2 for a specific
Therefore, if
To determine
This process could originate dynamically the distribution with a very fat tail shown in Figure 10. These are the consequences of Matthew’s effect, which states that the rich get richer and could explain the observed distribution. The selection of the token where the transfer event will take place is not random, but based on the past number of transactions, so new transactions seem to take place most likely on already ”popular” tokens, by considering the sheer number of transactions. This is consistent with our findings about the autoregressions shown in Section 3.4.
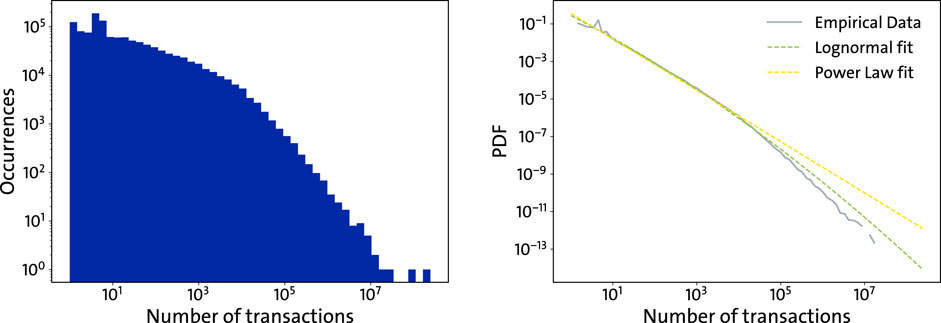
Figure 9. Concentration process of new token transfer events. We show different

Figure 10. To the left, histograms of the overall number of transactions in tokens are given, while on the right, the probability density function with power law and lognormal fit is given.
4 Conclusions and next steps
The open nature of the Ethereum token ecosystem provides an opportunity to examine the dynamics of its adoption. The ERC-20 and ERC-721 token standards, which share a technical foundation, make them easily comparable with each other in terms of their on-chain and off-chain metrics. Our results suggest an increasing concentration, which contradicts the core tenet of decentralisation and has been previously reported in the literature [12]. The rich do get richer, even in Ethereum-based tokens; very few projects are successful, while the majority of them quickly disappear. Past token transfer events, or transactions, still appear as the most reliable predictor of new events. Although fascinating, this result is comparable to a tautology because we do not know the initial and real reasons for the first occurrences of such events: we are successful because we were successful. We face certain limitations while considering all the tokens together. Our analysis of correlation patterns could not point to a single explaining factor, maybe because of the long time period or the large number of tokens analysed. By analysing tokens at scale, we might have missed relevant information about their context and timing that is crucial to their success (see Section 4).
Given how much ERC-20 tokens can differ besides the basic specification (in design, business goal, and technical foundation), our problem could be compared to a research about the inhabitants of a city. We might know how many of them reside in a specific place, their age, or gender, but this would not explain why the city is economically prosperous or not. In the end, we need perhaps a better cryptodemography to properly group and explore these tokens that now share a technical foundation, but might not share their design, purpose, and small but relevant properties.
Extracting the user-defined labels is merely the first step. We need a better classification of tokens; many of them are still virtually unknown, with very scarce public information available. In future research, the approach of this study should be complemented by a more effective information extraction initiative. With the assistance of a machine learning model and/or a large language model, we could analyse white papers and specific social networks at scale and extract relevant keywords for a proper categorisation. Distinguishing the composition of their initial investment pool could prove crucial as well, determining if the investors have had relationships with the existing projects, track records of the key stakeholders, and the identities of the investors and backers, an approach that has already been tried in the literature [19, 25], but could be further extended and complemented. The field of network science keeps evolving, and new methodologies, such as in Li et al. [46], could be, for instance, applied to better investigate clustering in token networks. In conclusion, for the continuation of this study, we return to our first step, the first paper we cited, Tasca and Tessone [1], which discusses the taxonomy of the blockchain. A conclusive taxonomy about tokens, as well as better comparative tokenomics, could be the key for further research in horizontal studies across multiple tokens.
5 Limitations
This study is subject to several limitations that could potentially limit the validity of our findings.
5.1 Internal validity
5.1.1 Data selection bias
One of the core limitations is the decision to focus on tokens with more than 10,000 transactions. We have a very skewed distribution, so the 25, 50, 75, 90, and 95 percentiles, respectively, correspond to 4, 7, 50, 424, and 1,480 transactions, as illustrated in Figure 11. So 10,000 transactions correspond to the 98.73 percentile. This relatively high threshold was chosen to ensure a significant activity level for each token, but it might have excluded tokens that are relevant in other ways, for example, emerging tokens, or tokens with lower activity but high market capitalisation or long-term relevance. Additionally, scam or fake tokens with high activity levels might have skewed the overall results. The user-generated content data we used in our analysis is limited by the amount and quality of data we could gather about individual tokens. A more granular categorisation could have improved the efficacy of our research.
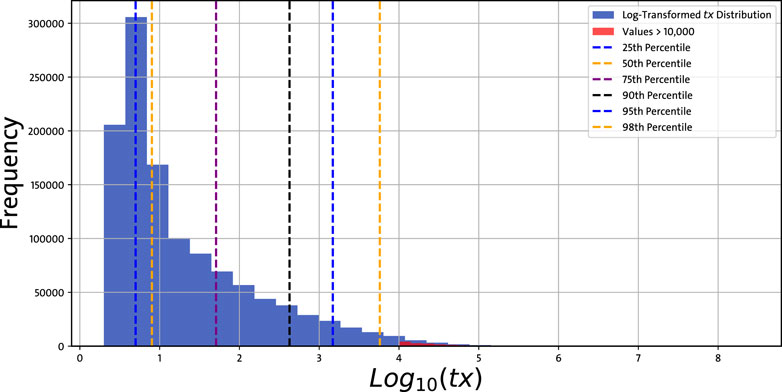
Figure 11. Histogram of log-transformed overall number of transactions
5.1.2 Time-period sensitivity
The time period analysed spans from Ethereum’s inception in July 2015 to May 2024. This would already be a long timeframe for traditional markets, but for crypto markets, it is an exceptional time length, which captures almost the whole life span of the Ethereum ecosystem. We encounter significant market volatility: our findings, especially those related to token centralisation and the market cap correlation, may be sensitive to the chosen timeframe. For example, certain trends we identified may have emerged due to market cycles, technological developments, regulatory and or/political changes within specific windows, and might not generalise well.
5.2 External validity
5.2.1 Generalisability to other blockchain ecosystems
Our study focusses exclusively on the Ethereum blockchain, particularly on ERC-20 and ERC-721 tokens. Although Ethereum represents the largest platform for tokenised assets, other blockchain ecosystems, such as Binance Smart Chain, Solana, or Avalanche, have different architectures, governance models, user bases, and liquidity markets. The trends and network structures observed here may not necessarily apply to those ecosystems, even when they are compatible with Ethereum, or directly a fork of it (such as Binance Smart Chain or Avalanche). The validity of the findings for UTXO based blockchain like Bitcoin, which allows a certain degree of colored coins, is as well a research question we do not examine in the present study.
5.3 Construct validity
5.3.1 Methodological limitations: ARMA model assumptions
The use of ARMA models for analysing transaction time series introduces strong assumptions such as stationarity and linearity, meaning they may not adequately account for sudden market shocks, nonlinear relationships, or long-term dependencies in the data. The ARMA models were applied to the most active tokens, excluding lower-volume or newly minted tokens.
5.3.2 Missing contextual information
Although our study focusses on transactional data and network structure, we acknowledge that on-chain data alone may not capture the full context of token success or failure. For example, external factors such as team reputation, investor backing, marketing strategies, and off-chain activities (e.g., partnerships and trading) also play crucial roles in token dynamics, which are not captured in our analysis, which is limited to the user-generated token labels we could collect. A more contextual analysis with machine learning and natural language processing tools could have helped better contextualise every token.
Data availability statement
The source code for running the experiments has been published under https://github.com/fdecollibus/patterns_in_ethereum_tokens, where part of the data to reproduce the experiment is also made available. For integral reproducibility of our results, missing datasets can be provided by the authors upon request. Ethereum Blockchain data are inherently public: the token transfer data used is available on the Ethereum blockchain. Ethereum client and ethereum-etl tool were used for collecting data. This data set is publicly available on Google Cloud BigQuery https://cloud.google.com/blog/products/data-analytics/ethereum-bigquery-public-dataset-smart-contract-analytics, see the table token_transfers. Additional data are extracted from the public APIs of Coingecko, Coinmarketcaps and Etherscan.
Author contributions
FMDC: conceptualisation, investigation, methodology, writing–original draft, writing–review and editing, validation, visualization CC: conceptualisation, supervision, validation, writing–review and editing. GC: conceptualization, supervision, validation, writing–review and editing. CT: conceptualization, supervision, validation, writing–review and editing.
Funding
The author(s) declare that no financial support was received for the research, authorship, and/or publication of this article.
Conflict of interest
The authors declare that the research was conducted in the absence of any commercial or financial relationships that could be construed as a potential conflict of interest.
Generative AI statement
The author(s) declare that no generative AI was used in the creation of this manuscript.
Publisher’s note
All claims expressed in this article are solely those of the authors and do not necessarily represent those of their affiliated organizations, or those of the publisher, the editors and the reviewers. Any product that may be evaluated in this article, or claim that may be made by its manufacturer, is not guaranteed or endorsed by the publisher.
References
1. Tasca P, Tessone CJ. A taxonomy of blockchain technologies: principles of identification and classification. Ledger (2019) 4. doi:10.5195/ledger.2019.140
2. Nakamoto S. Bitcoin: a peer-to-peer electronic cash system (2008). Available from: https://bitcoin.org/bitcoin.pdf.PublishedonlinebyNakamotoinstitute.org (Accessed April 11, 2016).
3. Buterin V. Ethereum white paper (2013). Available from: https://ethereum.org/en/whitepaper/.Online (Accessed February 28, 2021).
4. Ethereum. ERC-20 specification (2015). Available from: https://ethereum.org/en/developers/docs/standards/tokens/erc-20/.Online (Accessed February 05, 2022).
5. Ethereum. ERC-721 specification (2018). Available from: https://ethereum.org/en/developers/docs/standards/tokens/erc-721/.Online (Accessed February 05, 2022).
6. Etherscan. Tetherscan token tracker (2022). Available from: https://etherscan.io/tokens.Online (Accessed July 25, 2022).
7. Bachelier L. Théorie de la spéculation. In: PH Cootner, editor. The random character of stock market prices. Cambridge, Mass: MIT Press (1900).
8. Mandelbrot B. The variation of certain speculative prices. The J Business (1963) 36:394–419. doi:10.1086/294632
9. Bovet A, Campajola C, Mottes F, Restocchi V, Vallarano N, Squartini T, et al. The evolving liaisons between the transaction networks of bitcoin and its price dynamics. arXiv:1907 (2019):03577. doi:10.48550/arXiv.1907.03577
10. Kondor D, Pósfai M, Csabai I, Vattay G. Do the rich get richer? an empirical analysis of the bitcoin transaction network. PLoS ONE (2014) 9:e86197. doi:10.1371/journal.pone.0086197
11. Vallarano N, Tessone CJ, Squartini T. Bitcoin transaction networks: an overview of recent results. Front Phys (2020) 8:286. doi:10.3389/fphy.2020.00286
12. Campajola C, Cristodaro R, De Collibus FM, Yan T, Vallarano N, Tessone CJ. The evolution of centralisation on cryptocurrency platforms. arXiv preprint (2022). doi:10.48550/ARXIV.2206.05081
13. Kondor D, Bulatovic N, Stéger J, Csabai I, Vattay G. The rich still get richer: empirical comparison of preferential attachment via linking statistics in bitcoin and ethereum. Front Blockchain (2021) 4. doi:10.3389/fbloc.2021.668510
14. Ferretti S, D’Angelo G. On the ethereum blockchain structure: a complex networks theory perspective. Concurrency Comput Pract Experience (2020) 32:e5493. doi:10.1002/cpe.5493
15. Guo D, Dong J, Wang K. Graph structure and statistical properties of ethereum transaction relationships. Inf Sci (2019) 492:58–71. doi:10.1016/j.ins.2019.04.013
16. Somin S, Gordon G, Altshuler Y. Social signals in the ethereum trading network. arXiv:1805 (2018):12097.
17. Somin S, Gordon G, Pentland A, Shmueli E, Altshuler Y. Erc20 transactions over ethereum blockchain: network analysis and predictions. arXiv:2004 (2020):08201. doi:10.48550/arXiv.2004.08201
18. Victor F, Lüders BK. Measuring ethereum-based erc20 token networks. In: Financial cryptography and data security: 23rd international conference, FC 2019, frigate bay, st. Kitts and nevis, february 18–22, 2019, revised selected papers. Berlin, Heidelberg: Springer-Verlag (2019). p. 113–29. doi:10.1007/978-3-030-32101-7\text_8
19. Chen W, Zhang T, Chen Z, Zheng Z, Lu Y. Traveling the token world: a graph analysis of Ethereum ERC20 token ecosystem. New York, NY, USA: Association for Computing Machinery (2020). p. 1411–21.
20. De Collibus FM, Partida A, Piškorec M, Tessone CJ. Heterogeneous preferential attachment in key ethereum-based cryptoassets. Front Phys (2021) 9. doi:10.3389/fphy.2021.720708
21. De Collibus FM, Piškorec M, Partida A, Tessone CJ. The structural role of smart contracts and exchanges in the centralisation of ethereum-based cryptoassets. Entropy (2022) 24:1048. doi:10.3390/e24081048
22. Griffin JM, Shams A. Is bitcoin really untethered?. J Finance (2020) 75:1913–64. doi:10.1111/jofi.12903
23. Taleb NN. Bitcoin, currencies, and fragility. Quantitative Finance (2021) 21:1249–55. doi:10.1080/14697688.2021
24. Acharya VV, Schnabl P. Do global banks spread global imbalances? asset-backed commercial paper during the financial crisis of 2007–09. IMF Econ Rev (2010) 58:37–73. doi:10.1057/imfer.2010.4
25. Liu S-H, Liu XF. Co-investment network of erc-20 tokens: network structure versus market performance. Front Phys (2021) 9. doi:10.3389/fphy.2021.631659
26. Watorek M, Drozdz S, Kwapien J, Minati L, Oswiecimka P, Stanuszek M. Multiscale characteristics of the emerging global cryptocurrency market. Phys Rep (2021) 901:1–82. doi:10.1016/j.physrep.2020.10.005
27. Cernera F, Morgia ML, Mei A, Sassi F. Token spammers, rug pulls, and sniper bots: an analysis of the ecosystem of tokens in ethereum and in the binance smart chain (BNB). In: 32nd USENIX security symposium (USENIX security 23). Anaheim, CA: USENIX Association (2023). p. 3349–66.
28. Tan Y, Wu Z, Liu J, Wu J, Chen T, Lin K. Bubble or not: an analysis of ethereum erc721 and erc1155 non-fungible token ecosystem. In: 2024 IEEE international symposium on circuits and systems (ISCAS) (2024). p. 1–5. doi:10.1109/ISCAS58744.2024.10558166
29. Ali O, Momin M, Shrestha A, Das R, Alhajj F, Dwivedi YK. A review of the key challenges of non-fungible tokens. Technol Forecast Soc Change (2023) 187:122248. doi:10.1016/j.techfore.2022.122248
30. Heinonen HT, Semenov A, Boginski V. Collective behavior of price changes of erc-20 tokens. In: Computational data and social networks: 9th international conference, CSoNet 2020, Dallas, TX, USA, december 11–13, 2020, proceedings. Berlin, Heidelberg: Springer-Verlag (2020). p. 487–98. doi:10.1007/978-3-030-66046-8\text_40
31. Bardoscia M, Barucca P, Battiston S, Caccioli F, Cimini G, Garlaschelli D, et al. The physics of financial networks. Nat Rev Phys (2021) 3:490–507. doi:10.1038/s42254-021-00322-5
32. Mantegna R. Hierarchical structure in financial markets. The Eur Phys J B (1999) 11:193–7. doi:10.1007/s100510050929
33. Bonanno G, Caldarelli G, Lillo F, Micciché S, Vandewalle N, Mantegna R. Networks of equities in financial markets. Eur Phys J B: Condensed Matter Complex Syst (2004) 38:363–71. doi:10.1140/epjb/e2004-00129-6
34. Coronnello C, Tumminello M, Lillo F, Miccichè S, Mantegna RN (2005). Sector identification in a set of stock return time series traded at the london stock exchange
35. Medvedev E. Ethereum etl (2024). Available from: https://github.com/blockchain-etl/ethereum-etl.AsetoftoolforEthereumdatatransformation.
36. Medvedev E. Ethereum-etl data in google cloud (2022). Available from: https://console.cloud.google.com/bigquery?p=bigquery-public-data&d=crypto_ethereum&t=transactions&page=table.GoogleCloudDataset (Accessed August 08, 2023).
37. Coinmarketcap. Today’s cryptocurrency prices by market cap (2024). Available from: https://coinmarketcap.com/.Online (Accessed July 07, 2024).
39. Ma J, Li M, Li H-J. Traffic dynamics on multilayer networks with different speeds. IEEE Trans Circuits Syst Express Briefs (2022) 69:1697–701. doi:10.1109/TCSII.2021.3102577
40. Etherscan. Etherscan (2024). Available from: https://www.etherscan.io/.Online (Accessed July 07, 2024).
41. Battiston S, Glattfelder JB, Garlaschelli D, Lillo F, Caldarelli G. The structure of financial networksIn:Editor E. Estrada, M. Fox, D. Higham, and G. L. Oppo, Netw Sci complexity Nat Technol. London: Springer (2010). doi:10.1007/978-1-84996-396-1_7
42. Caldarelli G, Chessa A (2016). Data science and complex networks. Oxford University Press. doi:10.1093/acprofoso/9780199639601.001.0001
43. Prim RC. Shortest Connection Networks and Some Generalizations. BSTJ (1957). doi:10.1002/j.1538-7305.1957.tb01515.x
44. Mastrandrea R, Piras F, Gabrielli A, Banaj N, Caldarelli G, Spalletta G, et al. The unbalanced reorganization of weaker functional connections induces the altered brain network topology in schizophrenia. Scientific Rep (2021) 11:15400. doi:10.1038/s41598-021-94825-x
45. Alstott J, Bullmore E, Plenz D. Powerlaw: a python package for analysis of heavy-tailed distributions. PLoS ONE (2014) 9:e85777. doi:10.1371/journal.pone.0085777
Keywords: Ethereum, blockchain, cryptocurrencies, ERC-20, ERC-721, token, decentralised finance, network science
Citation: De Collibus FM, Campajola C, Caldarelli G and Tessone CJ (2024) Patterns and centralisation in Ethereum-based token transaction networks. Front. Phys. 12:1305167. doi: 10.3389/fphy.2024.1305167
Received: 30 September 2023; Accepted: 24 October 2024;
Published: 04 December 2024.
Edited by:
Cuneyt G. Akcora, University of Central Florida, United StatesReviewed by:
Hui-Jia Li, Nankai University, ChinaGiuseppe Destefanis, Brunel University London, United Kingdom
Copyright © 2024 De Collibus, Campajola, Caldarelli and Tessone. This is an open-access article distributed under the terms of the Creative Commons Attribution License (CC BY). The use, distribution or reproduction in other forums is permitted, provided the original author(s) and the copyright owner(s) are credited and that the original publication in this journal is cited, in accordance with accepted academic practice. No use, distribution or reproduction is permitted which does not comply with these terms.
*Correspondence: Francesco Maria De Collibus, ZnJhbmNlc2NvLmRlY29sbGlidXNAYnVzaW5lc3MudXpoLmNo
 Francesco Maria De Collibus
 Carlo Campajola
 Guido Caldarelli
 Claudio J. Tessone