- 1Department of Finance, Shandong Technology and Business University, Yantai, China
- 2Navigation College, Dalian Maritime University, Dalian, China
China is a large oil-consuming country, and sharp fluctuations in oil prices are bound to be detrimental to the stable growth of its economy. Therefore, accurately grasping the impact of the oil market on China’s sectors is the key to ensuring its healthy economic development. The article aims to explore the extreme risk transfer link of the oil and China’s sectors system, focusing on uncovering the risk spillover mechanism of the oil and providing early warning on it. We apply the TENET method to discuss risk propagation relationships within the oil and sectors system at three levels. The TVP-VAR model is brought in to recognize the factors affecting risk spillover in the oil market from the network correlation perspective. Finally, early warning of oil risk spillover is provided by incorporating the influencing factors into a machine learning model. The outcomes indicate that the risk connectivity of the oil and China’s sectors system is highly correlated with extreme events. There are variations in the spillover effects of oil market risk on different sectors, with Telecommunication Services, Utilities, Financials and Major Consumer sectors being the main bearers of the oil risk shocks. Overall, oil risk spillovers are mainly driven by economic policy and geopolitics, but oil price uncertainty is found to have a persistent impact on oil market risk spillovers in the dynamic analysis. Random forest model can provide effective early warning of oil risk spillovers. In addition, the significance analysis shows that oil price uncertainty and inflation are important factors affecting oil risk spillovers and are nonlinearly correlated with them.
1 Introduction
As an indispensable strategic energy source in today’s world, oil is an important support for the stable operation and sustainable development of the national economy [1–3]. The oil market is subject to fluctuations resulting from a variety of factors, including international politics, economics and supply and demand. In recent years, successive crises in the oil market have seriously affected the stable growth of the world economy [4]. The oil crisis due to oversupply in 2014, the oil price plunge to negative value caused by the COVID-19 epidemic in 2020, and the soaring oil price caused by the impact of the conflict between Russia and Ukraine have greatly impacted the stability of global economic development. China is the world’s most prominent emerging market, and the smooth operation of its economy is closely related to the global economic system [5, 6]. As one of the countries with the largest demand for oil in the world, China has a relatively high dependence on oil. However, China does not have a high voice in oil pricing, so it often can only passively receive the risk impact brought by oil market fluctuations [7]. Fluctuations in energy prices can affect firms’ output and profits through production costs, which in turn can lead to volatility in share prices. In addition, with the birth of oil derivatives, the continuous improvement of their financial attributes makes the impact of the oil market fluctuations diffuse from the real economy to the capital market [8]. The correlation between energy markets and financial markets has increased significantly, and volatility caused by shocks to energy markets can easily trigger cross-market contagion of financial risks. And the stock market occupies an important position in the financial market, which largely reflects the overall economy of a country. With this background, fluctuations in the oil industry will directly affect the energy costs of various industries in China as well as the country’s inflation level, and even threaten China’s energy security [9, 10]. Therefore, exploring the influence of the oil market on China’s sectors will help to make economic decisions and predict risks, to improve the competitiveness and sustainable development ability of various sectors in China. In this regard, this paper attempts to examine the impact of risk shocks in the oil market from an industry stock market perspective. This leads to a series of thought-provoking questions: What kind of risk transfer exists between the oil and China’s sectors? What factors will affect the risk spillover from oil? Through what mechanism do these factors contribute to the spillover from oil? Can effective early warning of risk spillovers from oil be achieved through monitoring of risk drivers?
Much of the earlier paper has analyzed the role of the oil market shocks on economies around the world [11–14]. The perspectives mainly include the implications of oil volatility on micro-firms [15] and macroeconomic indicators [16]. Notably, the various effects of the oil shocks on the economy can be captured in the stock market as it is an important predictor and indicator of macroeconomic trends. Given this, scholars have gradually shifted their research focus to the relation between oil and the stock market [17, 18]. [19] discuss the implications of oil price volatility on the stock markets of G7 countries from the viewpoint of supply and demand shocks, respectively [20, 21]. Explore the different responses of oil importing and exporting countries to oil price shocks. There is also literature that explores the heterogeneous effects of oil price volatility from the perspective of economies with different levels of development [22]. However, these studies generally focus on the linkages between a region or country and the oil industry, ignoring the role of oil price volatility in specific sectors. Given the different industrial chain locations and cost structure and other factors of different sectors, it is necessary to study the effects of oil movements on various industries [23]. [24] points out that oil price volatility, except for its impact on oil-related sectors, also affects those sectors that hardly use oil. Bouri et al. (2023) considered the impact of crude oil volatility on different sectors of the GCC under different market conditions [25]. It is worth noting that China surpassed the U.S. as the world’s largest oil importer for the first time in 2013. It was also in 2013 that China undertook a reform of refined oil prices, which made the sector’s stock market in China more sensitive to adjustments in international oil prices [26, 27]. In this context, scholars began to concern themselves with the implications of the oil market volatility on the Chinese industrial economy [28]. [9] found variations in the responses of different sectors to the oil industry by exploring the reliance between oil and China’s sectors. Nevertheless, the above studies usually focus their research on the correlation between the two, and considering the complex mechanism of interaction between the oil and China’s sectors, there is a need to fully elucidate the spillover effect. Unlike the literature above, this paper takes the correlation network perspective to fully consider the nonlinear interactions between oil and China’s sectors, capture the extreme risk spillovers, and identify the correlation structure of risk transfer. More importantly, we also discuss the drivers affecting risk spillovers from oil and provide early warnings about them through machine learning methods. The gap between previous research on oil markets and industry stock markets regarding this direction is bridged.
To clarify the link between oil and the stock market, scholars have adopted many approaches to explore the risk correlation between the two [24, 29]. [1] investigated whether there are volatility spillovers between the European and U.S. oil industry and the sector stock markets through a GARCH model. However, these studies only focus on the overall risk between them and neglect to discuss the extreme risk. Nevertheless, extreme risk tends to be a more realistic measure of risk exposure in times of crisis [30]. [31] measured both positive and negative extreme risk spillovers between the stock market and oil through VAR. However, the method is difficult to reveal the complex nonlinear correlation of risk between markets. For this reason [29, 32], introduce the VMD method and Copula function to examine the effect of oil shocks on stock market risk, which makes up for the shortcomings of previous studies that ignored nonlinear correlations [33]. However, the Copula method is sensitive to outliers and limits the flexibility of the marginal distribution [34]. The TENET model (Tail Event-driven Network) presented by [35] effectively bridges the gap between the above approaches. The method considers macro factors in the model and uses semi-parametric quantile regression to calculate the extreme risk. It also combines the LASSO regression method to eliminate redundant variables and construct a directed weighted network. In addition, the impact of various macro market indicators on the risk output of the oil industry has been less mentioned in previous studies. In this paper, the TVP-VAR model (Time-Varying Vector Autoregression) is adopted to determine the factors affecting risk spillover, which has better data fitting ability than the traditional VAR model and has the nature of time-varying parameters to fully capture the dynamic characteristics of the volatility spillover relationship. For risk early warning, we introduced the Random Forest model. Compared to traditional forecasting models, random forests are integrated models and therefore have high accuracy when dealing with complex datasets [36]. In addition, the method can assess the importance of variables and reveal nonlinear associations between variables.
This paper attempts to explore the extreme risk spillovers between the oil market and China’s sectors, and to reveal the risk spillover mechanisms in the oil market in order to provide early warning. It complements studies on extreme risk spillovers from oil to China’s sectors. The main contributions are as follows: 1) Previous studies have tended to ignore extreme risk spillovers between the oil market and sector stock markets [37], or the nonlinear correlations that exist in risk transmission [24, 31]. In contrast, this paper introduces the TENET methodology to construct extreme risk networks of the oil and 13 China’s sectors system to explore the nonlinear risk spillover relationship. In contrast to traditional models, this approach uses a nonparametric mono-exponential model instead of a traditional linear model to model uncertain functional relationships between variables, which satisfies the need for nonlinearity and time-varying nature of the extreme risk contagion between the oil market and the stock market. We discuss the time-varying characteristics of risk spillovers across the system and the risk transfer between the oil and sectors, and further examine the variability in the performance of different sectors concerning oil risk spillovers. Unlike the sectoral heterogeneity derived from a previous study [24], our research found that the oil market’s risk correlation with related energy and commodity sectors is not significant, possibly due to government controls and supply chain stability. Moreover, we account for the effect of extreme event shocks on the system’s risk-transfer relationship, which compensates for the shortcomings of previous studies in this direction. 2) Using the TVP-VAR model, this paper explores the factors affecting oil extreme risk spillover from a network perspective and calculates the contribution of each risk factor to oil risk spillover under static and dynamic conditions. Compared with the conventional measurement methods [7, 18], analyzing the contribution of influencing factors using the network approach does not require assumptions about the intrinsic relationship between variables, and provides a new way of thinking for related research. In addition, the TVP-VAR model has the advantages of avoiding loss of observations and being insensitive to outliers compared to the traditional DY model [38]. Through this research methodology, we found that the influencing factors exhibit different mechanisms of action, with some having short-term effects and others having long-term effects. 3) After analyzing the drivers, we further incorporate these factors into a random forest model for risk warning. The importance of the influencing factors is then explored and the nonlinear relationship between the factors and risk spillovers is discussed. Unlike traditional linear prediction algorithms [39], the Random Forest algorithm has the advantage of avoiding overfitting. The risk warning provided in this paper, along with the analysis of variable importance and demonstration of nonlinear relationships, can aid in identifying critical risk factors. This provides a solid foundation for implementing effective measures to mitigate potential risks posed by oil to various industries in China.
The remainder of the article is organized as follows. Section 2 explains the empirical methodology. Section 3 describes the data sources and statistical descriptions. Section 4 first analyzes the extreme risk spillovers between the oil and China’s sectors at different levels; then explores the risk factors that affect the value of spillovers in the oil market and provides risk warnings; and finally conducts a robustness test. Section 5 contains the conclusions of this paper and makes policy proposals.
2 Methodology
2.1 CoVaR estimation based on TENET
To characterize the risk transfer relationship between oil and China’s sectors, we constructed extreme risk spillover networks using the TENET methodology and estimated the risk spillover level. Unlike previous methods for measuring risk spillovers, this method focuses on the nonlinear characteristics of risk contagion. In addition, it incorporates a mono-exponential model to compute tail risk between the oil market and sector stock markets on a high-dimensional nonparametric basis. Specifically, the TENET method is organized into three steps:
In the first step, VaR for individual i is calculated using linear quantile regression:
where
In the second step, the CoVaR is calculated using a single index model (SIM) to capture the extreme risk spillover effects among the variables. Equations 1 and 2 represent the return rate and risk of individual
where
In the third step, the risk contagion intensity is calculated:
where
where
In the adjacency matrix
In addition, we define two metrics, RI (Risk Input) and RO (Risk Output), to measure the risk incoming and risk outgoing from each node in the system:
2.2 TVP-VAR spillover index model
Having constructed a risk transmission network for the oil and sectors system, a question of interest is which factors may influence the risk spillover from oil. Considering the time-varying effects of the factors, we use the TVP-VAR model to reconstruct a connected network containing oil risk spillover (OUT) and its possible influences in order to study the contribution of each risk driver to the change in OUT. We draw on [40] to construct a time-varying volatility spillover index by combining the TVP-VAR model with the volatility spillover index [41]. Compared with the traditional DY model, this model is able to more accurately measure the nonlinear and heteroskedastic relationship between the influences and OUT. In addition, it does not need to calculate the dynamic results by setting the size of the rolling window, which avoids the loss of observations.
First, the TVP-VAR model is constructed:
where
where
It follows from Eq. 11 that we can calculate the generalized variance decomposition of variable
where
where
Finally, based on the results of the generalized variance decomposition the volatility spillover index of the system can be calculated. The total volatility spillover index for the TVP-VAR system is:
The spillover effect from variable
2.3 Random forest
To achieve effective early warning of oil risk spillover, we incorporate risk drivers into the random forest system and assess important risk factors. The basic idea of the random forest model is to construct combined multiple decision trees using the Bagging algorithm and random sampling. In the model from the training samples and training feature set randomly selected part of the subset for training and construction of decision trees, and finally formed a combination of multiple decision trees. Random forest model can cope with the data fitting of nonlinear relationships, and has the automation ability for feature selection. It remains robust even in the face of problems such as more noise or missing data.
For the regression problem, the output of the random forest is:
where
To judge the prediction accuracy, MAE (Mean Absolute Error) and MSE (Mean Square Error) are selected here as the evaluation indexes. The smaller the value of these two indicators, the closer the prediction result of the model is to the real value, indicating that the prediction effect of the model is more ideal, and the specific calculation formula is as follows:
3 Data sources and description
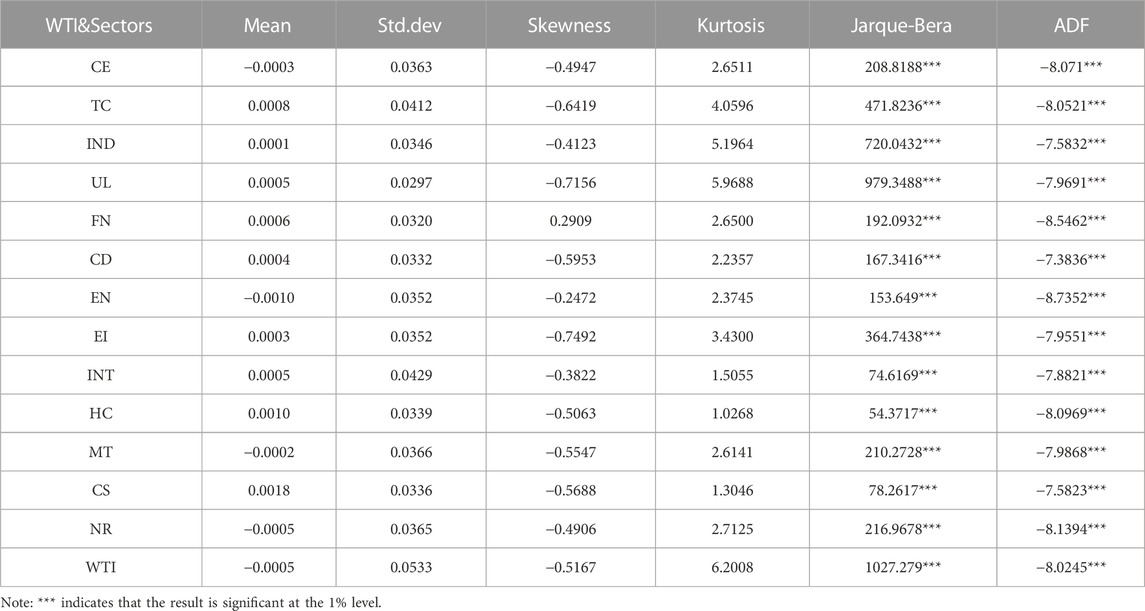
In this paper, the stock indices of 13 Chinese Shanghai Stock Exchange (SSE) sectors, namely, Commodity Equity (CE), Telecommunication Services (TC), Industrials (IND), Utilities (UL), Financials (FN), Consumer Discretionary (CD), Energy (EN), Emerging Industries (EI), Information Technology (INT), Healthcare (HC), Materials (MT), Consumption Staples (CS) and Natural Resources (NR), are selected to be a proxy for China’s sectoral stock markets. We adopt the closing price of the West Texas Light Crude (WTI) futures contract to represent the price of oil. This is because WTI has become the global benchmark for oil pricing, and futures prices are less affected by short-term supply and demand than spot prices [42]. WTI price data are from FRED (Federal Reserve Economic Data). Considering that large economic and public health events such as China’s refined oil price reform, China’s stock market crash, the COVID-19 epidemic and the Russia-Ukraine conflict are highly informative about the extreme risk transmission between oil and China’s sectors, this paper selects a sample interval from 3 July 2011, to 23 July 2023. In addition, this paper adopts weekly yield data as the research object to avoid the problems of unsynchronized trading date of daily data and the time-accumulation effect of monthly data [43]. The sector index data are from Investing, and the WTI price data are from FRED (Federal Reserve Economic Data). Table 1 presents descriptive statistics for the log-returns of the WTI and the 13 sector indices. As can be seen from the table, most of the sectors have positive returns, with the largest sector being CS (0.0018) and the smallest being EN (−0.0010). This indicates a significant difference in returns across sectors. The standard deviation of the oil and sector indices is less volatile. All the series show negatively skewed distributions, and the ADF and Jarque-Bera tests indicate that all the series are smooth and reject the assumption of normal aggregates.
Apart from sectoral and oil data, we have selected several major stock market indices to represent macroeconomic conditions. These are the Hong Kong Hang Seng Index, the Dow Jones Industrial Average, the S&P 500 Index, the German DAX (DAX), the Eurostoxx 50 and the Nikkei 225. When exploring the influences of aggregate spillovers from the sectors and oil system, we selected six variables: 1) CPI (Consumer Price Index) describes the consumer price index, which to some extent reflects the degree of inflation or contraction in China. CPI may affect supply and demand and economic expectations by influencing the energy market and China’s sectors’ risk. 2) OVX (CBOE Crude Oil Volatility) measures the volatility of oil prices and represents uncertainty in the energy market [44]. 3) MSCI China Index is an index of securities compiled by Morgan Stanley Capital International that reflects the volatility of China’s sectors. 4) GPR (Geopolitical Risk Index) stands for the geopolitical risk index, and it has previously been shown in the literature that as geopolitical risk increases, the level of risk in the energy market and the stock market increases [45]. 5) EPU (Economic Policy Uncertainty) describes China’s economic policy uncertainty. It affects economic agents’ expectations of the future and thus the economic situation. 6) TPU (Trade Policy Uncertainty) refers to the uncertainty of China’s trade policy. Its volatility could lead to trade frictions and trade restrictions, which would contribute to pressure on China’s sectors from the oil industry.
4 Results and discussion
Along with China’s rapid economic development, the demand for oil has continued to grow. As a major consumer of oil, China is highly dependent on oil imports. Oil is an indispensable ingredient for modern industrial operations. Drastic fluctuations in oil prices will inevitably have an implication on China’s related sectors. Therefore, measuring the risk transmission path from the oil to China’s sectors can help effectively prevent and control risk contagion. In this paper, the oil market and 13 China’s sector stock indices are included in the same system, and the risk spillover relationships are discussed at three levels, the extreme risk level of the system as a whole, the input and output level and the extreme risk network. Further, we analyze the factors affecting the level of risky outputs in the oil market and build a random forest early warning system to investigate the significance of the factors as well as the nonlinear relationships. Finally, the empirical outcomes are tested for robustness.
4.1 Overall level of extreme risk connectivity
In this paper, we calculate TRSI of the system based on Eq. 7 and adopt the rolling window method to catch the dynamic characteristics of the extreme risk spillover from the oil to China’s sectors. Here, the TRSI of the system is used to measure the overall risk level of the system. Referring to [35], we set the window period as 48 weeks Figure 1 describes the TRSI of the system consisting of the oil market and China’s sectors.
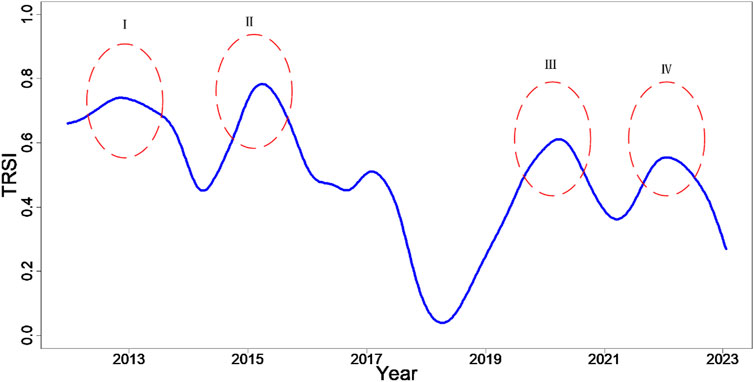
FIGURE 1. The overall connectivity between the oil and sectors. Note: Ⅰ corresponds to the reform of oil product pricing; Ⅱ corresponds to China’s stock market crash; Ⅲ corresponds to the COVID-19 epidemic; Ⅳ corresponds to the Russian-Ukrainian conflict.
It is not difficult to find that the TRSI of the system has a significant time-varying trend and its volatility is highly correlated with the outbreak of major extreme events. This confirms the conclusion that the occurrence of extreme events affects the risk profile of the oil market and China’s sectors [46]. We can see several major peaks in the figure, which occur in 2013, 2015, 2020 and 2022, respectively, corresponding to the four crisis events: China’s refined oil pricing reform, China’s stock market crash, the COVID-19 and the conflict between Russia and Ukraine. Total systemic risk connectivity reached its first peak in 2013, which was mainly influenced by China’s further improvement of refined oil product price reform in 2013 [47]. China is among the world’s major oil importers, and the reform of the refined oil product pricing mechanism has increased the correlation between Chinese oil prices and the oil market. In addition, the reformed pricing mechanism has changed from government-guided pricing to a market-based pricing mechanism. This means that oil price impacts will negatively affect the profitability of related sectors and stock market performance through the impact on China’s oil prices. The next high point in system connectivity occurred in 2015, which may be related to China’s 2015 stock market crash. Our findings are coherent with [48], who also noted that the crisis events in the Chinese stock market in 2015 amplified the risk shift between the oil and China’s sectors. The stock market underwent a “roller-coaster” situation of surges and crashes in 2015. The extreme stock market boom in the first half of the year masked hidden risks such as excess liquidity, so when the Securities and Futures Commission started regulating the stock market in June 2015, the previously accumulated risks hit the fan. Uncertainty about economic growth due to the stock market crash amplified the level of extreme risk of the oil and sectors system [31]. The risk associations for the 2020 system rose again, and our findings support the conclusions of [33]. This trend is highly correlated with the COVID-19 outbreak. The worldwide economic slowdown led by the epidemic had huge implications on oil demand, while at the same time, the breakdown of the OPEC production cut agreement left the oil market with an imbalance between supply and demand, and the price of oil fell into negative values for the first time. The pandemic has also hurt China’s sectors, causing the stock market to experience dramatic volatility. The downturn in the economy and the collapse in oil prices have increased the extreme risk of the system in both directions. The last peak in the sample period occurs in 2022, and the occurrence of this peak can be attributed to the Russia and Ukraine conflict. Global risk aversion due to geopolitical conflicts has led to higher oil prices. As one of the top importers of oil, China’s energy-sensitive sectors, such as petrochemicals, aviation and transportation, will inevitably be affected by rising oil prices. This will result in increased risk connectivity in the system.
4.2 Extreme risk transmission levels
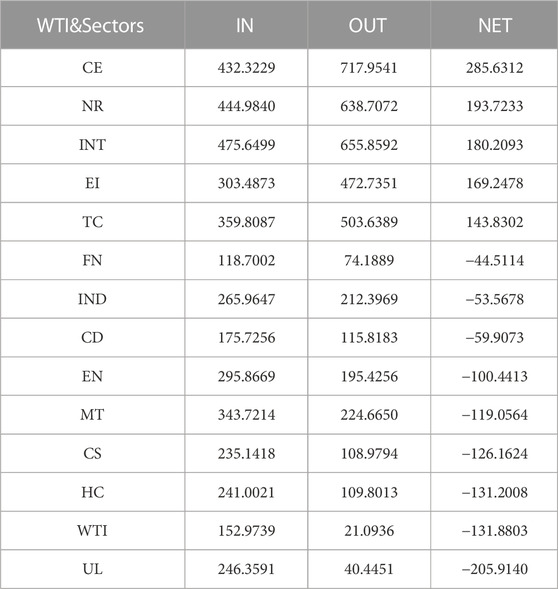
To examine the extreme risk contagion effect between oil and China’s sectors, we calculate the total risk input (IN) and output (OUT) levels of WTI and each sector according to Eqs 8, 9 without considering the time dimension. Further, the net output level (NET) is obtained based on the difference between IN and OUT, and the importance ranking of oil and each sector in the system is derived according to the NET. The results are displayed in Table 2.
From Table 2, three sectors, CE, NR and INT, are in the top three in terms of NET. It is worth noting that these three sectors are among the top three in terms of risk input and output levels. This suggests that these three sectors, as important nodes in the system, are not only sources of risk transmission in the system but also vulnerable to risk spillovers from other sectors or the oil. The CE sector encompasses a large number of commodities such as energy and metals, and China is among the world’s leading importers of oil and consumers of metals, making it more sensitive to the external economic environment [49]. Commodity supply, demand and price fluctuations have a direct implication on China’s economy, and risks are transmitted through the supply chain to other related sectors and markets in China. The NR sector is an essential foundation for China’s economic growth and real industrial production [50]. On the one hand, the real economy depends on the availability of raw materials from the natural resource sector. On the other hand, natural resources may also put pressure on sectors that are more externally dependent, such as trade and logistics, by affecting the cost of imports and exports. As an important driver of China’s economic transformation and innovative development, the INT sector has become more and more prominent as a key position in the entire economic system. It supports the business activities of many traditional sectors through technology analytics, digital transformation and software services, making its risk transmission closely linked to other sectors. It is worth noting that the CE and NR sectors are directly related to the oil market, which makes them closely linked to the oil market in terms of risk transfer. In line with [51], they also pointed to the more pronounced risk transmission in the energy-related sector as a result of instability in the global oil market.
We calculate the dynamic risk transfer value for each sector and sum the input and output levels of the 13 sectors to obtain the dynamic risk transfer relationship between oil and China’s sectors as shown in Figure 2. From the figure, we find that since sectors make up a large fraction of our system, the trend of risk input and output for sectors is roughly the same as the trend of total risk connectivity of the system as described above. Overall, the trend of risk transfer between oil and sectors remains highly correlated with the occurrence of extreme events. In addition to the several extreme event points mentioned above, the risk transfer value of oil also peaked in 2017, suggesting that the impact of oil on China’s sectors at this time cannot be ignored. This may have been influenced by fluctuations in oil supply. OPEC agreed to its first output curbs in 8 years in November 2016 and then extended them in July 2017 when 11 non-OPEC producers led by Russia declared they would cooperate with the cuts. According to [52], they pointed out that fluctuations in the supply side of oil have occurred as a result of the OPEC production cut agreement. This could lead to the operation of China’s macroeconomy and the business conditions of the relevant sectors being affected, and the level of risk from the oil industry to various sectors in China rising.
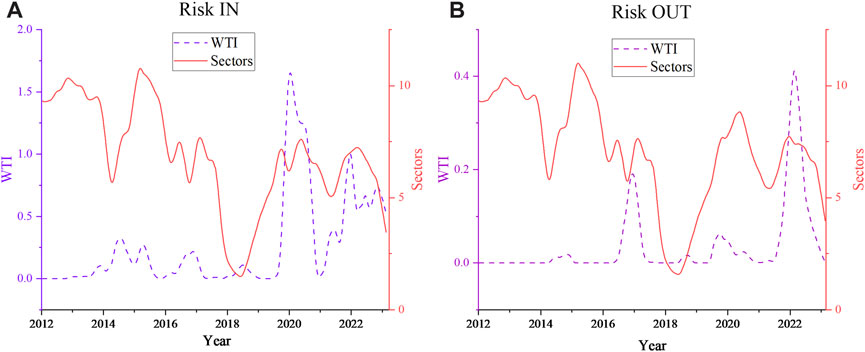
FIGURE 2. Risk transfer relationship for WTI & Sectors. Panel (A) shows the Risk In for WTI and sectors, and panel (B) shows the Risk Out for WTI and sectors.
This paper further analyzes the pairwise risk contagion relationship between oil and each sector, and presents the results of the relationship between oil and each sector in Figure 3. From the figure, it can be seen that there is heterogeneity in the extent of risk spillover from the oil to different sectors. This is consistent with [9], who also pointed out that the impact of volatility in the oil market varied considerably across sectors. Except for TC, UL, FN and CS, oil’s risk spillover to other sectors is relatively small. The telecom business sector requires large energy inputs to power and operate telecom equipment and infrastructure, and therefore has a higher energy demand and is vulnerable to the risk from the oil market [29]. UL is a fundamental sector of society and, equally, a high-energy user. Uncertainty in the oil market could directly increase utility operating costs, which in turn could adversely affect the sector. The emergence of oil derivatives marks the trend of financialization of the oil market, so there is a connection between it and financial real estate that cannot be ignored [53]. The level of risk in oil-related financial products (e.g., hedging products) is bound to change in response to oil price movements. For the CS sector, increased risk in the oil market could lead to higher prices for the chemical raw materials associated with it. Higher raw material costs will further expose the CS sector to market risks. Interestingly, we observe that the risk connection from the oil market to the related EN and CE sectors is not significant. This may be due to the relatively stable supply chain and pricing mechanism of China’s energy sector, which can mitigate the shock of fluctuations in the oil market to some extent. Moreover, the Chinese government has a greater capacity to intervene in the energy market and stronger regulatory tools, and this control capacity can mitigate the negative impact of fluctuations in international energy markets [47]. Similar to the energy sector, China’s commodity sector has been insulated from the adverse effects of large fluctuations in the oil market by government controls. Moreover, China’s commodity market is more diversified, and its risks are influenced by a variety of factors not limited to the oil market.
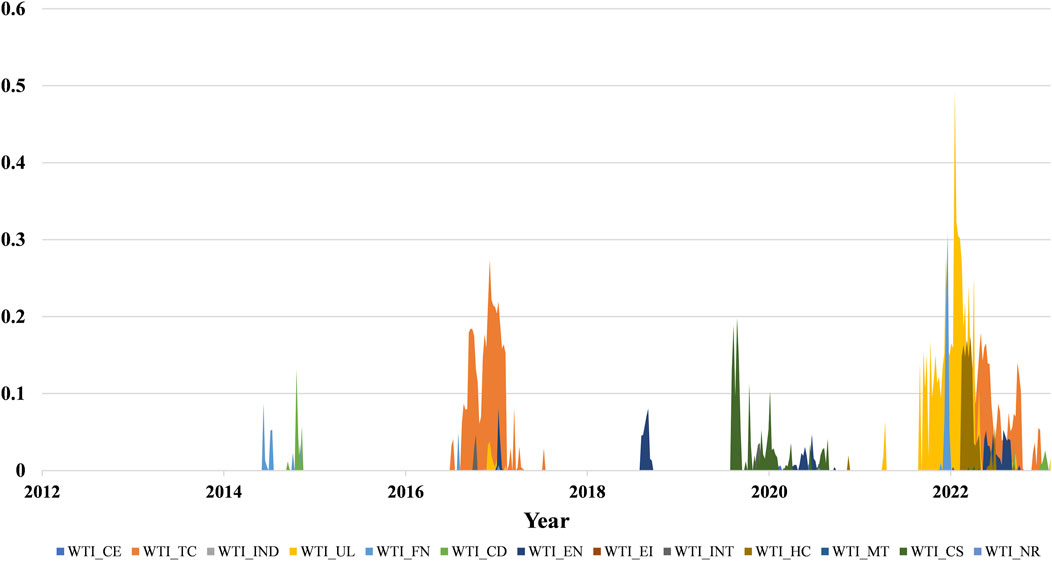
FIGURE 3. Risk spillover from WTI to China’s sectors. The different color areas represent WTI's risk spillover to different sectors.
4.3 Extreme risk spillover networks
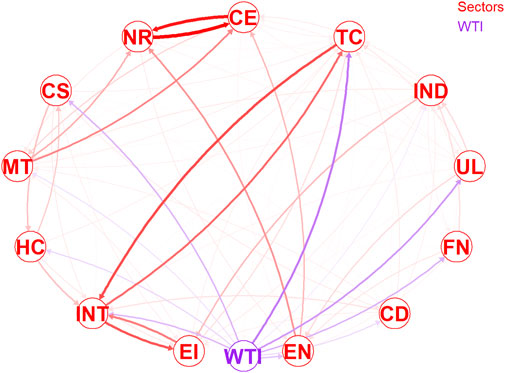
To present a more intuitive picture of the role played by the oil and China’s sectors in the system, we use a network diagram to analyze the individual correlations in the system. The tail risk contagion of individuals in the network is represented by directed weighted connectivity between nodes, with weights representing spillover strength and arrows indicating spillover direction. Figure 4 gives the extreme risk transfer relationships within the system throughout the sample period. We observe that the overall network density of the system is large, suggesting a strong risk transfer relationship between the oil and sectors. Similar to the results above, the network diagram shows that NR, CE and INT, as the core nodes in the overall extreme risk network, are the three most systemically important sectors. Moreover, the figure shows that the two-way spillover between the NR sector and the CE sector is the most pronounced. This suggests a strong correlation between the two sectors, which is consistent with [54]. This is due to the fact that the natural resources sector encompasses areas such as energy, metals and agricultural products, which are also major components of commodities. The two sectors are affected by common factors such as supply and demand and price volatility, and this correlation makes them highly risk-correlated. Similarly, there are TC and INT sectors. Telecommunications and information technology are interdependent, with telecommunications providing the communications infrastructure and network services required by the information technology sector, and the information technology sector providing technical support and innovation to telecommunications [55]. The two operate inextricably, making the two-way spillover between them more pronounced. In addition, the oil exhibits a significant risk premium to the IT, CS, TC, UL, FN and EN sectors over the entire sample interval.
To characterize the risk spillover from oil to each sector at different crisis events in more detail, referring to [30], we select two local risk extreme points based on the risk spillover trend of oil to all sectors in Figure 2, and map the risk spillover network in that period. As shown in Figure 5, these two points are 25 June 2017 and 3 July 2022, respectively. At the 25 June 2017 point in time, we find that the oil has a more pronounced risk transmission mainly to the TC, IND, UL and EN sectors. At the time point of 3 July 2022, the oil mainly affects the CE, TC, UL and EN sectors. Comparing the network graph at both points in time, we can see that the TC, UL and EN sectors are always affected by the oil market. These are also the sectors we identified in the previous section as being vulnerable to the oil market. In addition, comparing the two graphs reveals a significant impact on the CE sector in 2022. The possible reason for this is that the Russian-Ukrainian conflict escalated in 2022, the military conflict and related sanctions exacerbated the global supply chain conflicts in the aftermath of the epidemic, and oil saw a significant price increase. From one aspect, an increase in the price of oil will directly increase the costs of the commodity sector. From another aspect, an increase in oil prices will indirectly reduce the competitiveness of the commodity sector by affecting the cost of Chinese imports. This finding implies that different crisis events lead to changes in sectors affected by risk spillovers from the oil market. Our finding is consistent with [45], who show that the recipient sectors of risk spillovers from the oil market can vary depending on the turbulent environment.
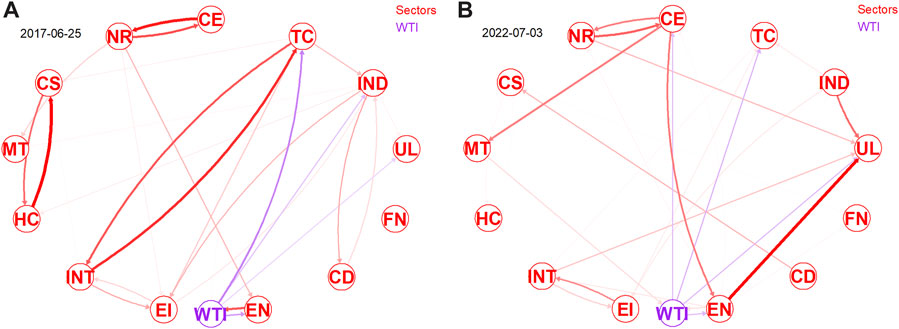
FIGURE 5. Network of the extreme risk spillovers in typical periods. Panel (A) shows the extreme risk network for 2017-06-25 and Panel (B) shows the extreme risk network for 2022-07-03.
4.4 Risk spillover mechanisms in the oil market
After describing the risk spillover relationship between oil and sectors, we further analyze which factors have an impact on this spillover relationship. OUT is used to measure the risk spillover from the oil market. Referring to the studies of [38, 45], we select CPI, OVX, MSCI, GPR, EPU and TPU as the factors that may have an impact on OUT. First, the data is smoothed using logarithmic differencing of the OUT and factors. Next, we incorporate OUT with these factors into the TVP-VAR model to expose the mechanism of each risk driver on OUT.
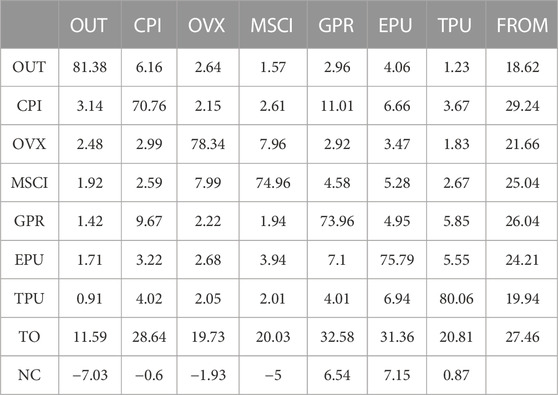
Table 3 reports the association between OUT and each risk-influencing factor. The FROM columns (TO rows) denote the intensity of spillovers that the corresponding variable receives (outputs) from the other variables. The NC value corresponds to the difference between FROM and TO and indicates the level of net spillover for that variable. To visualize the link between the total risk spillover and its influence factors, Figure 6 shows a chord diagram of the linkages based on Table 3, where the width of the bars indicates the level of influence between variables, and the arrows indicate the direction of influence. From the figure, CPI has the largest contribution to OUT in terms of the total contribution, implying that OUT is more sensitive to changes in CPI. This finding supports [56], who stated that a rise in CPI expands risk from the oil market. The possible reason for this is that fluctuations in the CPI often imply price instability. Oil is a necessary part of production in many sectors, and volatility in its price level can put pressure on the cost of production in many sectors, which increases the risk for each sector. Apart from CPI, EPU and GPR are the main factors that influence the variation of OUT. This result ties well with previous studies wherein [57], who argued that shocks from these two indicators have time-varying effects on oil market risk. In contrast, OUT has almost negligible interference with the drivers in the system. Combined with the NC line in Table 3, OUT is the net affected party in the system, while EPU is the main net spillover, followed by GPR and then TPU [58]. Also pointed out that changes in EPU can have an impact on risk spillovers in the oil market. Changes in China’s EPU could affect Chinese oil demand, resulting in supply and demand imbalances and oil price volatility in the oil market. This would affect the production costs of the related sectors, affecting their profitability and share prices. For GPR, its increase may represent an increase in geopolitical tensions, and the spread of such tensions may affect the stable supply of oil-producing countries, triggering concerns about energy security and supply disruptions [45]. As a major importer of oil, China relies on steady supplies from the oil industry for a number of sectors, including EN and UL. Therefore, the instability of geopolitical risks can contribute to the risk transfer from oil to China’s sectors. Changes in TPU can drive risk spillovers from oil by altering China’s import and export policies [59].
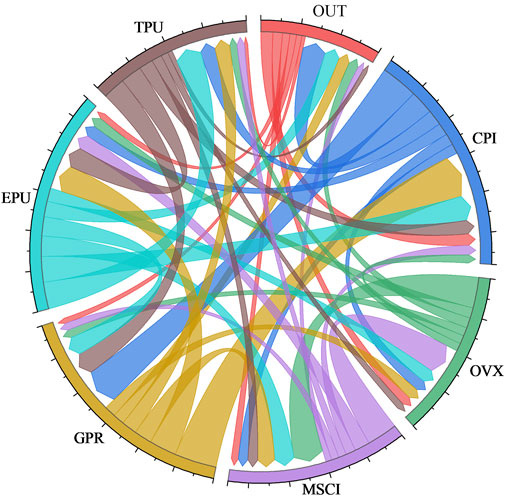
FIGURE 6. Relationship between OUT and risk factors. The different colored arrows represent the impact of different indicators on other indicators, and the thickness of the arrows refers to the size of the impact.
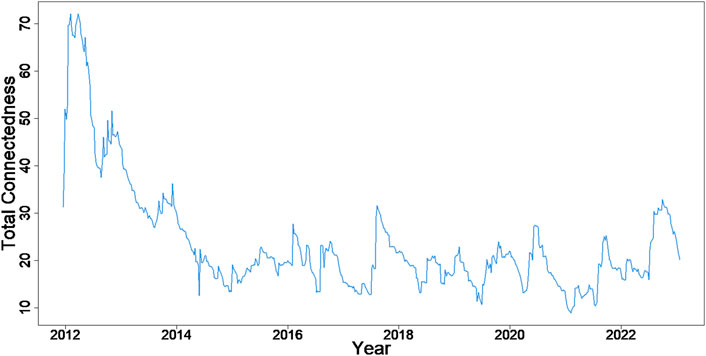
Considering that a static analysis would ignore extreme trends of factors during crisis events, we adopt the rolling window method to obtain the dynamic total connectivity of the system to examine the dynamic link between OUT and its driving factors. Figure 7 shows the trend of the total connectivity of the system consisting of OUT and factors. From the figure, it can be noticed that the total connectivity of the system fluctuates widely, with a range of [8.87%, 72.09%], which indicates that the impact of each risk driver on the OUT is characterized by time-varying characteristics. It is not difficult to find that the up and down trend of the volatility spillover index is closely related to the occurrence of extreme events. This suggests that OUT is more sensitive to the impact of each driver during periods of turbulence. This is in accordance with [53], who stated that crises significantly increase the driving effect of the factors on risk spillover in the oil market. There are several distinct peaks in the chart, corresponding to the European debt crisis in 2012, the oil price crisis in 2014, the trade dispute in 2018, the COVID-19 pandemic in 2020, and the Russia-Ukraine conflict in 2022. Crises such as financial market crises, major public health events and geopolitical conflicts affect risk spillovers in international oil markets in a number of ways, including their impact on energy markets and economic stability.
To explore the dynamic link between each driver and OUT, we further calculate the dynamic trend of the contribution of each factor to the OUT through the rolling window method, as shown in Figure 8. From the figure, we can see that the contribution value of each driver to OUT is characterized by time-varying characteristics. It is worth noting that the main influencing factors CPI, EPU and GPR, as pointed out earlier, played a major driving role for OUT in 2012–2014. This may be due to the impact of the European debt crisis on global economic stability during 2012–2014, and the significant volatility of the CPI index in the face of high economic uncertainty, adding to the uncertainty in the oil market. At the same time, the volatile political situation in the Middle East and North Africa region affected the stability and oil supply of some oil-producing countries, also exacerbating risk spillovers in the oil market [45]. While in the previous section, we identified EPU as having the largest impact on oil market risk production, in the dynamic trend analysis it is found that EPU does not always play the role of a major contributor. In contrast, OVX, although found to be the second lowest contributor to OUT in the static analysis, in the dynamic analysis it contributes to OUT for most of the sample period. The findings support those of [56], who also pointed out that changes in OVX amplify the risk contagion effect in the oil market. On the one hand, the risk aversion of investors can contribute to the transmission of extreme risk from the oil market to the Chinese sub-index. On the other hand, investors’ pessimistic expectations about oil price volatility could raise the risk of supply disruptions, which in turn could negatively impact stocks in crude-related sectors.
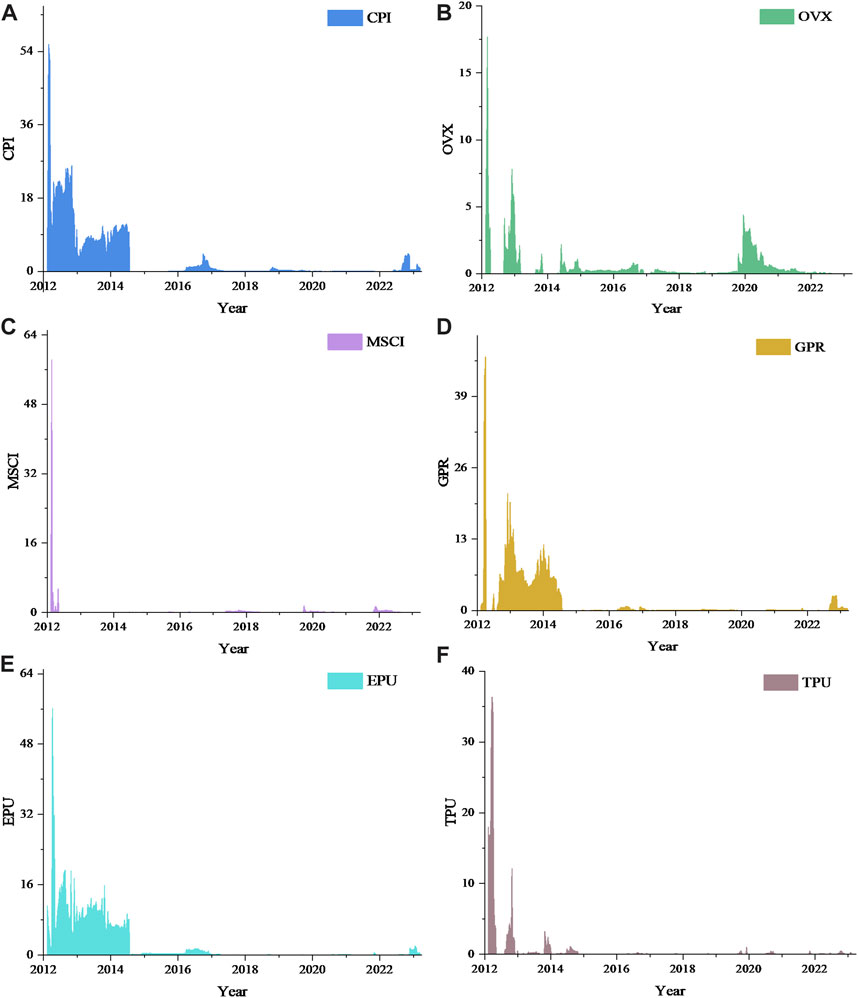
FIGURE 8. Dynamic contribution relationship of drivers to OUT. Panels (A–F) represent the dynamic contribution of CPI, OVX, MSCI, GPR, EPU & TPU to OUT, respectively.
4.5 Early warning of oil risk spillovers
We have confirmed above that the risk transmission from oil to China’s sectors cannot be ignored. Risk early warning is an effective means of preventing and resolving major risks. Compared to traditional econometric models, machine learning models have significantly improved predictive capabilities [60]. Among them, the random forest model has the advantages of a low probability of overfitting, strong out-of-sample predictive power, and the ability to reveal nonlinear correlations among variables. Against this background, in this section, we combine the previously selected risk indicators with the Random Forest algorithm to construct an early warning model of risk transmission from oil to China’s sectors.
In the previous section, we have confirmed the driving relationship of each risk indicator on oil risk spillover (OUT). Here we construct an early warning system by using risk factors as input indicators to the early warning system and OUT as output indicators to be warned, and incorporating them into a random forest model. We set the ratio of the training set to the test set to 5:1 after debugging. Considering the large sample size, we select 25 sample results as a demonstration. Figure 9 shows the learning results for the training and test sets. It can be seen that the Random Forest Early Warning System fits the training set well, but nearly 10 out of 25 samples in the test set show deviations from the true values. Considering that this may be due to the influence of sample randomness, it was decided to further examine the accuracy of the early warning system. We calculated the learning errors MAE and MSE, which are shown in Table 4. As shown in the table, both MAE and MSE are relatively small in both the training and test sets. This suggests that the risk drivers we choose can be used as early warning indicators for extreme risk in the global energy system, and also indicates that the random forest model constructed in this paper has strong generalization and prediction capabilities.
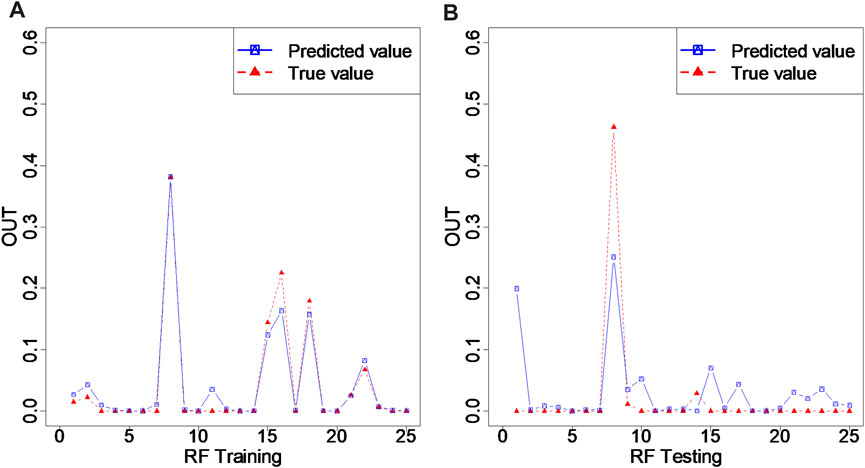
FIGURE 9. Learning results of random forest model. Panel (A) represents the fit of the training set of the random forest model and panel (B) represents the fit of the test set of the random forest model.
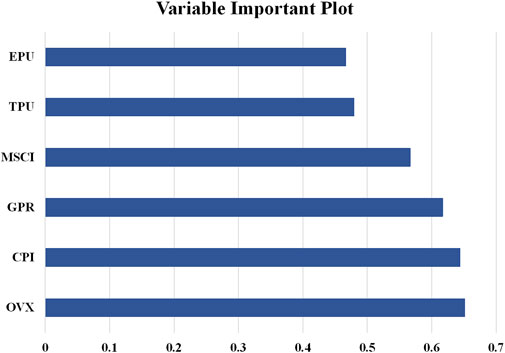
After assessing the accuracy of the random forest model, we next calculated the importance of each indicator to examine the explanatory power of different variables in the risk warning system. The importance of the variables is shown in Figure 10. Consistent with the previous results, OVX and CPI are confirmed to be important indicators affecting OUT. This implies that OVX and CPI play an important role in risky output warning in the oil market. Our findings are consistent with those of [61, 62], who argued that changes in OVX and CPI affect the risk profile of the oil market to some extent. For OVX it may be due to the fact that changes in OVX, as a measure of oil price volatility expectations, can reflect the uncertainty of future risks in the oil market. Fluctuations in the CPI, on the other hand, can trigger market concerns about future inflation, which in turn affects the oil market.
To gain insight into how these factors affect OUT, we discuss the association between predictor variables and OUT using partial dependency plot analysis. Figure 11 shows the partial dependency plot constructed based on the random forest model. It can be found that the nonlinear effects of all variables are very obvious, which verifies the nonlinear relationship between each variable and OUT. Combining the results of variable importance, we focus on analyzing OVX and CPI. There is a complex nonlinear relationship between OVX and OUT until a critical value (around 40) is reached. After reaching the critical value, the positive effect of OVX on OUT starts to come to the fore and eventually tends to a steady state. Overall, OVX has a promoting effect on OUT. This finding supports [63] that an increase in OVX enhances risk transmission in the oil market. The rise in OVX reflects increased market concerns and uncertainty about the oil industry, which could lead to higher oil prices and thus increase risk spillovers by affecting costs in China’s sectors. Unlike OVX, we find a first negative and then positive relationship between CPI and OUT. When CPI increases are small, they may reflect economic growth and increased consumer demand. In this case, market concerns about oil would diminish, the oil market would stabilize and its risk spillover impact would be reduced. However, when the CPI grows to a certain level (about 2), the OUT increases as the CPI continues to rise. The possible reason for this is that when the CPI is too high, the country adopts a tight monetary policy to curb inflation, which may have a negative impact on the oil market, thus leading to an increase in its risk spillover.
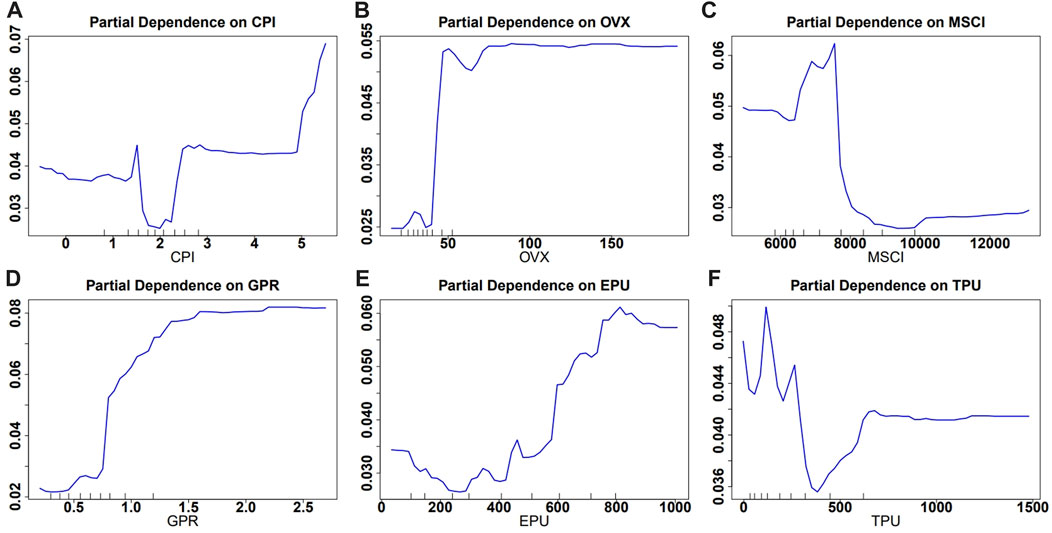
FIGURE 11. Variable partial dependency results. Panels (A–F) represent the partial dependencies between CPI, OVX, MSCI, GPR, EPU and TPU and OUT, respectively.
4.6 Robustness analysis
In the above, we have used WTI to represent the oil market to portray the extreme risk of the oil and China’s sector system. We replace the oil price data with the Brent oil price data to check the robustness of the empirical results. The overall connectivity of the Brent and sectors system is shown in Figure 12. We find little change in the trend of the total system connectivity after replacing WTI with Brent. We further recalculate the risk incoming and outgoing values of Brent with China’s sectors, and Figure 13 shows the risk input and output plots. From the figure, we can see that the trend of risk transfer after replacing oil data is more consistent with the original results, which indicates that the empirical results of this paper are robust.
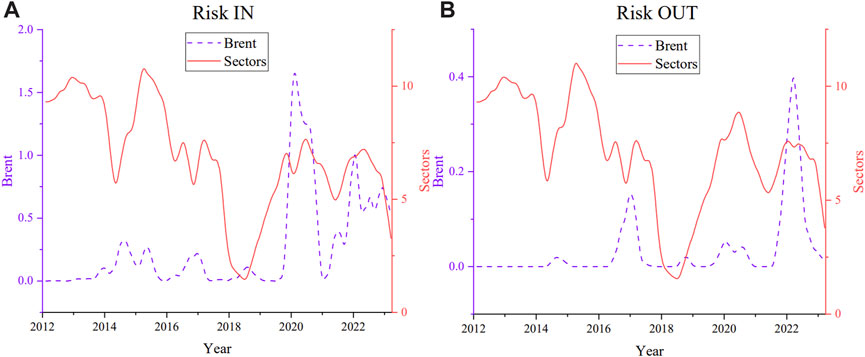
FIGURE 13. Risk transfer relationship for Brent & Sectors. Panel (A) shows the Risk In for Brent and sectors, and panel (B) shows the Risk Out for Brent and sectors.
5 Conclusion and suggestions
The aim of this paper is to examine the extreme risk contagion effect of oil on China’s sectors. We select WTI and 13 China’s sectors as the research objects and use the TENET model, a high-dimensional network analysis method, to portray the risk contagion relationship between the oil and sectors. We analyze the overall risk, input and output levels, and network relationships at three levels to identify sectors in the system that are susceptible to oil market risks. We then further explore the factors affecting spillover risk in the oil market through the TVP-VAR model under both static and dynamic conditions. Next, the Random Forest model is used to construct an early warning system for oil market risk spillover and analyze the nonlinear correlation between variables. Finally, the robustness test is performed by replacing the oil representing the oil market.
Our empirical results show that: 1) Changes in the connectivity between the oil and China’s sectors are highly correlated with the occurrence of major extreme events. China’s refined product pricing reform, the Chinese stock market crash, the COVID-19 pandemic and the Russia-Ukraine conflict have significantly increased the extreme risk spillover between oil and the sector’s equity markets. 2) Commodity Equity, Natural Resources and Information Technology are important nodes in the system. There is heterogeneity in the risk spillovers from the oil to different sectors, with Telecommunication Services, Utilities, Financials and Consumption Staples being more affected by oil market shocks. Sectors exposed to market risks vary depending on the crisis event. 3) Risk spillover from the oil market is influenced by a set of drivers. The static analysis reveals that EPU and GPR are the main drivers, while the dynamic analysis shows that OVX has a continuous impact on risk spillover from the oil market. 4) The Random Forest model can effectively achieve early warning of risk spillover in the oil market. Importance analysis shows that OVX and CPI are the main indicators affecting oil risk output, in which OVX has a positive impact on oil risk spillover, while CPI shows a first negative and then positive effect.
Based on the results of the empirical study, we offer the following proposals for reference. First, the risk correlation between the oil and sectors is high and closely related to the occurrence of extreme events. International oil futures price movements should be considered as an important risk factor for investors. Risk regulators need to pay close attention to the international situation as well as the price trend in the oil market. They can guide investors to invest rationally by publicly releasing risk assessment reports and other means to avoid the uncontrollable impact of risk spillover from the oil industry during the crisis. Second, considering the heterogeneity of the impact of oil price fluctuations on different sectors, the government and related departments can timely introduce supportive policies to prevent excessive fluctuations in the stock market of oil-related industries. And by optimizing the industrial structure, the linkage impact of oil-sensitive industries can be reduced. For investors, it is appropriate to include some stocks in sectors with a low correlation to the oil market when building a portfolio, or to use oil-related derivatives when investing for the purpose of reducing portfolio risk. Finally, our empirical results show that risk spillover in the oil market is affected by changes in EPU, GPR, OVX and CPI. Relevant departments should establish a monitoring and early warning platform to capture the changes in the relevant macroeconomic variables in the oil market and the risk events that may have an impact on time, and issue risk monitoring reports on a regular basis. At the same time, relevant organizations need to establish a scientific and reasonable risk early warning system, set up a case base of risk plans, and formulate contingency plans for corresponding risk events.
Data availability statement
Publicly available datasets were analyzed in this study. This data can be found here: https://cn.investing.com/?__cf_chl_jschl_tk__=pmd_3v13Y9zRY58zX9WrNkLPj4ehu35QCJLt30QzqcCQtRY-1635564281-0-gqNtZGzNAjujcnBszQil.
Author contributions
TF: Conceptualization, Data curation, Formal Analysis, Funding acquisition, Methodology, Visualization, Writing–original draft. DW: Conceptualization, Investigation, Project administration, Resources, Supervision, Writing–review and editing. ZL: Conceptualization, Software, Validation, Writing–review and editing. XW: Formal Analysis, Methodology, Project administration, Supervision, Writing–review and editing.
Funding
The author(s) declare financial support was received for the research, authorship, and/or publication of this article. This research was funded by General Program of the National Social Science Foundation, grant number 21BJL083.
Acknowledgments
This research received technical support from Qichang Xie, DW and Dingchuan Bai.
Conflict of interest
The authors declare that the research was conducted in the absence of any commercial or financial relationships that could be construed as a potential conflict of interest.
Publisher’s note
All claims expressed in this article are solely those of the authors and do not necessarily represent those of their affiliated organizations, or those of the publisher, the editors and the reviewers. Any product that may be evaluated in this article, or claim that may be made by its manufacturer, is not guaranteed or endorsed by the publisher.
References
1. Arouri MEH, Jouini J, Nguyen DK. Volatility spillovers between oil prices and stock sector returns: implications for portfolio management. J Int Money Financ (2011) 30(7):1387–405. doi:10.1016/j.jimonfin.2011.07.008
2. Boubaker H, Raza SA. A wavelet analysis of mean and volatility spillovers between oil and brics stock markets. Energ Econ (2017) 64:105–17. doi:10.1016/j.eneco.2017.01.026
3. Lin AJ, Chang H-Y. Volatility transmission from equity, bulk shipping, and commodity markets to oil etf and energy fund—a garch-midas model. Mathematics (2020) 8(9):1534. doi:10.3390/math8091534
4. Wei Y, Guo X. An empirical analysis of the relationship between oil prices and the Chinese macro-economy. Energ Econ (2016) 56:88–100. doi:10.1016/j.eneco.2016.02.023
5. Hou L, Pan Y. Evaluating the connectedness of commodity future markets via the cross-correlation network. Front Phys (2022) 10:874. doi:10.3389/fphy.2022.1017009
6. Wang Z, Zhao Q, Qiu L. Multi-dimensional factor correlation, multiple interbank network contagion, and conditional var of banks. Front Phys (2022) 10:895603. doi:10.3389/fphy.2022.895603
7. Broadstock DC, Cao H, Zhang D. Oil shocks and their impact on energy related stocks in China. Energ Econ (2012) 34(6):1888–95. doi:10.1016/j.eneco.2012.08.008
8. Du L, Yanan H, Wei C. The relationship between oil price shocks and China’s macro-economy: an empirical analysis. Energ Policy (2010) 38(8):4142–51. doi:10.1016/j.enpol.2010.03.042
9. Zhu H, Guo Y, You W, Xu Y. The heterogeneity dependence between crude oil price changes and industry stock market returns in China: evidence from a quantile regression approach. Energ Econ (2016) 55:30–41. doi:10.1016/j.eneco.2015.12.027
10. An S. Dynamic multiscale information spillover among crude oil time series. Entropy (2022) 24(9):1248. doi:10.3390/e24091248
11. Ali I, Harvie C. Oil and economic development: Libya in the post-gaddafi era. Econ Model (2013) 32:273–85. doi:10.1016/j.econmod.2013.01.022
12. Gong X-L, Liu J-M, Xiong X, Zhang W. The dynamic effects of international oil price shocks on economic fluctuation. Resour Pol (2021) 74:102304. doi:10.1016/j.resourpol.2021.102304
13. Nan Y, Sun R, Zhen Z, Fangjing C. Measurement of international crude oil price cyclical fluctuations and correlation with the world economic cyclical changes. Energy (2022) 260:124946. doi:10.1016/j.energy.2022.124946
14. Mo B, Meng J, Wang G. Risk dependence and risk spillovers effect from crude oil on the Chinese stock market and gold market: implications on portfolio management. Energies (2023) 16(5):2141. doi:10.3390/en16052141
15. Hsiao CY-L, Lin W, Wei X, Yan G, Li S, Sheng N. The impact of international oil prices on the stock price fluctuations of China’s renewable energy enterprises. Energies (2019) 12(24):4630. doi:10.3390/en12244630
16. Chang Y, Wong JF. Oil price fluctuations and Singapore economy. Energ Policy (2003) 31(11):1151–65. doi:10.1016/s0301-4215(02)00212-4
17. Choi K, Hammoudeh S. Volatility behavior of oil, industrial commodity and stock markets in a regime-switching environment. Energ Policy (2010) 38(8):4388–99. doi:10.1016/j.enpol.2010.03.067
18. Masih R, Peters S, De Mello L. Oil price volatility and stock price fluctuations in an emerging market: evidence from South Korea. Energ Econ (2011) 33(5):975–86. doi:10.1016/j.eneco.2011.03.015
19. Bastianin A, Conti F, Manera M. The impacts of oil price shocks on stock market volatility: evidence from the G7 countries. Energ Policy (2016) 98:160–9. doi:10.1016/j.enpol.2016.08.020
20. Khalfaoui R, Sarwar S, Tiwari AK. Analysing volatility spillover between the oil market and the stock market in oil-importing and oil-exporting countries: implications on portfolio management. Resour Pol (2019) 62:22–32. doi:10.1016/j.resourpol.2019.03.004
21. Heinlein R, Legrenzi GD, Mahadeo SM. Crude oil and stock markets in the covid-19 crisis: evidence from oil exporters and importers. Q Rev Econ Financ (2021) 82:223–9. doi:10.1016/j.qref.2021.09.007
22. Syed QR, Bouri E. Spillovers from global economic policy uncertainty and oil price volatility to the volatility of stock markets of oil importers and exporters. Environ Sci Pollut R (2022) 29:15603–13. doi:10.1007/s11356-021-16722-0
23. Shahzad SJH, Naeem MA, Peng Z, Bouri E. Asymmetric volatility spillover among Chinese sectors during covid-19. Int Rev Financ Anal (2021) 75:101754. doi:10.1016/j.irfa.2021.101754
24. Gogineni S. Oil and the stock market: an industry level analysis. Financ Rev (2010) 45(4):995–1010. doi:10.1111/j.1540-6288.2010.00282.x
25. Bouri E, Hammoud R, Abou Kassm C. The effect of oil implied volatility and geopolitical risk on gcc stock sectors under various market conditions. Energ Econ (2023) 120:106617. doi:10.1016/j.eneco.2023.106617
26. Bouri E, Chen Q, Lien D, Lv X. Causality between oil prices and the stock market in China: the relevance of the reformed oil product pricing mechanism. Int Rev Econ Financ (2017) 48:34–48. doi:10.1016/j.iref.2016.11.004
27. Wen X, Bouri E, Roubaud D. Does oil product pricing reform increase returns and uncertainty in the Chinese stock market? Q Rev Econ Financ (2018) 68:23–30. doi:10.1016/j.qref.2017.08.003
28. Huang S, An H, Gao X, Huang X. Identifying the multiscale impacts of crude oil price shocks on the stock market in China at the sector level. Physica A (2015) 434:13–24. doi:10.1016/j.physa.2015.03.059
29. Mensi W, Hammoudeh S, Shahzad SJH, Shahbaz M. Modeling systemic risk and dependence structure between oil and stock markets using a variational mode decomposition-based Copula method. J Bank Financ (2017) 75:258–79. doi:10.1016/j.jbankfin.2016.11.017
30. Zhao WL, Fan Y, Ji Q. Extreme risk spillover between crude oil price and financial factors. Financ Res Lett (2022) 46:102317. doi:10.1016/j.frl.2021.102317
31. Du L, He Y. Extreme risk spillovers between crude oil and stock markets. Energ Econ (2015) 51:455–65. doi:10.1016/j.eneco.2015.08.007
32. Wen X, Bouri E, Cheng H. The crude oil–stock market dependence and its determinants: evidence from emerging economies. Emerg Mark Financ Tr (2019) 55(10):2254–74. doi:10.1080/1540496x.2018.1522247
33. Zhao J, Cui L, Liu W, Zhang Q. Extreme risk spillover effects of international oil prices on the Chinese stock market: a garch-evt-copula-covar approach. Resour Pol (2023) 86:104142. doi:10.1016/j.resourpol.2023.104142
34. Yang Y, Ma Y-R, Hu M, Zhang D, Ji Q. Extreme risk spillover between Chinese and global crude oil futures. Financ Res Lett (2021) 40:101743. doi:10.1016/j.frl.2020.101743
35. Härdle WK, Wang W, Yu L. Tenet: tail-event driven network risk. J Econom (2016) 192(2):499–513. doi:10.1016/j.jeconom.2016.02.013
36. Tanaka K, Kinkyo T, Hamori S. Random forests-based early warning system for bank failures. Econ Lett (2016) 148:118–21. doi:10.1016/j.econlet.2016.09.024
37. Shahzad SJH, Bouri E, Rehman MU, Naeem MA, Saeed T. Oil price risk exposure of bric stock markets and hedging effectiveness. Ann Oper Res (2021) 313:145–70. doi:10.1007/s10479-021-04078-0
38. Wu F, Zhang D, Ji Q. Systemic risk and financial contagion across top global energy companies. Energ Econ (2021) 97:105221. doi:10.1016/j.eneco.2021.105221
39. Koyuncugil AS, Ozgulbas N. Financial early warning system model and data mining application for risk detection. Expert Syst Appl (2012) 39(6):6238–53. doi:10.1016/j.eswa.2011.12.021
40. Antonakakis N, Chatziantoniou I, Gabauer D. Refined measures of dynamic connectedness based on time-varying parameter vector autoregressions. J Risk Financ Manag (2020) 13(4):84. doi:10.3390/jrfm13040084
41. Diebold FX, Yılmaz K. On the network topology of variance decompositions: measuring the connectedness of financial firms. J Econom (2014) 182(1):119–34. doi:10.1016/j.jeconom.2014.04.012
42. Sadorsky P. Risk factors in stock returns of Canadian oil and gas companies. Energ Econ (2001) 23(1):17–28. doi:10.1016/s0140-9883(00)00072-4
43. Kang SH, McIver R, Yoon S-M. Dynamic spillover effects among crude oil, precious metal, and agricultural commodity futures markets. Energ Econ (2017) 62:19–32. doi:10.1016/j.eneco.2016.12.011
44. Qadan M, Nama H. Investor sentiment and the price of oil. Energ Econ (2018) 69:42–58. doi:10.1016/j.eneco.2017.10.035
45. Li M, Lin Q, Lan F, Zhan Z, He Z. Trade policy uncertainty and financial investment: evidence from Chinese energy firms. Energ Econ (2023) 117:106424. doi:10.1016/j.eneco.2022.106424
46. Zhu P, Tang Y, Wei Y, Lu T. Multidimensional risk spillovers among crude oil, the us and Chinese stock markets: evidence during the covid-19 epidemic. Energy (2021) 231:120949. doi:10.1016/j.energy.2021.120949
47. Sheng J, Li J, Yang J. Tail dependency and risk spillover between oil market and Chinese sectoral stock markets—an assessment of the 2013 refined oil pricing reform. Energies (2022) 15(16):6070. doi:10.3390/en15166070
48. Martín-Barragán B, Ramos SB, Veiga H. Correlations between oil and stock markets: a wavelet-based approach. Econ Model (2015) 50:212–27. doi:10.1016/j.econmod.2015.06.010
49. Chen L, Wen F, Li W, Yin H, Zhao L. Extreme risk spillover of the oil, Exchange rate to Chinese stock market: evidence from implied volatility indexes. Energ Econ (2022) 107:105857. doi:10.1016/j.eneco.2022.105857
50. Sun Z, Wang Q. The asymmetric effect of natural resource abundance on economic growth and environmental pollution: evidence from resource-rich economy. Resour Pol (2021) 72:102085. doi:10.1016/j.resourpol.2021.102085
51. Meng J, Nie H, Mo B, Jiang Y. Risk spillover effects from global crude oil market to China’s commodity sectors. Energy (2020) 202:117208. doi:10.1016/j.energy.2020.117208
52. Liu Y, Dong H, Failler P. The oil market reactions to opec’s announcements. Energies (2019) 12(17):3238. doi:10.3390/en12173238
53. Dai Z, Zhu H. Dynamic risk spillover among crude oil, economic policy uncertainty and Chinese financial sectors. Int Rev Econ Financ (2023) 83:421–50. doi:10.1016/j.iref.2022.09.005
54. Tiwari AK, Abakah EJA, Adewuyi AO, Lee C-C. Quantile risk spillovers between energy and agricultural commodity markets: evidence from pre and during covid-19 outbreak. Energ Econ (2022) 113:106235. doi:10.1016/j.eneco.2022.106235
55. Wu H, Xie Q. Volatility spillovers and asymmetric effects of Chinese A-share markets—enterprise-Level data based on high-dimensional social network models. Appl. Econ. (2023):1–25. doi:10.1080/00036846.2023.2288051
56. Ji Q, Liu B-Y, Nehler H, Uddin GS. Uncertainties and extreme risk spillover in the energy markets: a time-varying copula-based covar approach. Energ Econ (2018) 76:115–26. doi:10.1016/j.eneco.2018.10.010
57. Gu X, Zhu Z, Yu M. The macro effects of gpr and epu indexes over the global oil market—are the two types of uncertainty shock alike? Energ Econ (2021) 100:105394. doi:10.1016/j.eneco.2021.105394
58. Gao R, Zhao Y, Zhang B. The spillover effects of economic policy uncertainty on the oil, gold, and stock markets: evidence from China. Int J Financ Econ (2021) 26(2):2134–41. doi:10.1002/ijfe.1898
59. Li H, Zheng Q, Zhang B, Sun C. Trade policy uncertainty and improvement in energy efficiency: empirical evidence from prefecture-level cities in China. Energ Econ (2021) 104:105691. doi:10.1016/j.eneco.2021.105691
60. Gu S, Kelly B, Xiu D. Empirical asset pricing via machine learning. Rev Financ Stud (2020) 33(5):2223–73. doi:10.1093/rfs/hhaa009
61. Liu BY, Ji Q, Fan Y. Dynamic return-volatility dependence and risk measure of covar in the oil market: a time-varying mixed Copula model. Energ Econ (2017) 68:53–65. doi:10.1016/j.eneco.2017.09.011
62. Ji Q, Liu B-Y, Zhao W-L, Fan Y. Modelling dynamic dependence and risk spillover between all oil price shocks and stock market returns in the brics. Int Rev Financ Anal (2020) 68:101238. doi:10.1016/j.irfa.2018.08.002
Keywords: the oil and sectors system, extreme risk spillover, TENET, TVP-VAR, random forest model
Citation: Fang T, Wang D, Lin Z and Wang X (2023) Extreme risk measurement for the oil and China’s sectors system—network-based approach and machine learning methods. Front. Phys. 11:1292418. doi: 10.3389/fphy.2023.1292418
Received: 11 September 2023; Accepted: 29 November 2023;
Published: 15 December 2023.
Edited by:
Marcin Wątorek, Cracow University of Technology, PolandReviewed by:
Elie Bouri, Lebanese American University, LebanonJarosław Kwapień, Polish Academy of Sciences, Poland
Copyright © 2023 Fang, Wang, Lin and Wang. This is an open-access article distributed under the terms of the Creative Commons Attribution License (CC BY). The use, distribution or reproduction in other forums is permitted, provided the original author(s) and the copyright owner(s) are credited and that the original publication in this journal is cited, in accordance with accepted academic practice. No use, distribution or reproduction is permitted which does not comply with these terms.
*Correspondence: Xiaofan Wang, d3hmOTA4OEAxMjYuY29t
 Tingwei Fang
 Dong Wang
 Zhijia Lin2