- 1School of Electronic and Information Engineering, Beihang University, Beijing, China
- 2Beijing Key Laboratory for Network-based Cooperative Air Traffic Management, Beijing, China
The resilience of an air transport network represents its ability to adapt and stay operational at the required level of safety and efficiency during the impact of various disturbances. These disturbances, which can compromise the resilience of a given air transport network, include inclement weather conditions, human-intended interruptions (such as terrorist attacks, air traffic controller strikes, or pilots strikes), or unexpected mechanical failures (such as aircraft component breakdown or runway system failures). The mitigating actions such as delaying, canceling, and rerouting affected flights aim at maintaining both the network’s resilience and safety at the acceptable level under given conditions. It is of great significance to understand and quantify resilience in the complex socio-technical air transport network, which has attracted extensive attentions. In this study, statistical analysis of China air traffic data is applied to investigate the emergence of resilience in the air transport network. The Granger causality test is adopted to evaluate the causality relationship between different elements of a complex system. We construct the hourly delay propagation networks and analyze the resilience of the air transport system through the evolution of delay propagation networks. The useful measurement metric of resilience is proposed, and evolution patterns of generation and recovery of flight delays are also investigated. In addition, the relationship between initial delay, scheduled flights, and resilience loss is studied to reveal further understanding of resilience in the air transport system.
1 Introduction
In recent years, with the rapid development of aerospace technology and economy, the civil aviation transportation has made considerable progress across the world [1]. The China air transport system, which is fast-growing and plays an increasingly important role in the world, has attracted extensive attentions due to its distinctive characteristics and challenges. Due to a sharp increase in the air traffic flow and a limited availability of civil airspace resources, the China air transport system has reached the limits of airspace capacity, which results in serious flight delay problems. Flight delays have a negative impact on passengers, airlines, and air traffic managements. Passengers are experiencing significant delays and are dissatisfied with the airlines [2]. The airlines also suffer from the aircraft resource waste. Based on the recent report on flight delays by the Civil Aviation Administration of China (CAAC), flight delays result in economic loss, security hazards, and environmental pollution by decreasing operation safety and efficiency.
A primary flight delay results from various disturbances, including inclement weather conditions, human-intended interruptions (such as terrorist attacks, air traffic controller strikes, or pilot strikes) or unexpected mechanical failures (such as aircraft component breakdown or runway system failures). A considerable effort has been made to investigate the sources of primary delays. However, the primary delays can be transferred and amplified by consequent operations across the system, the so-called delay propagation, through connected resources, such as aircraft, passengers, and flight crew members [3–5].
The concept of resilience is defined as “its ability to recoil or spring back into shape after bending, stretching, or being compressed,” according to the Oxford Dictionary. The definition of resilience has been investigated in many disciplines ranging from ecology and engineering to economics. The definition of engineering resilience proposed by Holling [6] and Hollnagel et al. [7] is described as the time required for a system to return to an equilibrium or steady state following a perturbation. Specific to an air transport system, which is composed of networked airports and ruled by pre-established schedules, the resilience represents its ability to adapt and stay operational at the required level of safety and efficiency during the impact of various disturbances. The delay propagation due to the impact of various disturbances is commonly considered. The mitigating actions such as delaying, canceling, and rerouting affected flights aim at maintaining both the network’s resilience and safety at the acceptable level under given conditions.
Accordingly, the delay propagation and recovery process in the air transport system have attracted considerable attention recently. Pyrgiotis et al. [8] improved the traditional approximate network delays (AND) model, which was originally proposed by Malone [9] in the case of three airport networks, and found that delay propagation usually mitigates daily airport-scheduled flights and pushes more flights into late evening hours through investigating the case of delay propagation in 34 United States airports. Fleurquin et al. [10] studied the performance of the United States air transportation system in terms of delays and proposed a data-driven model to reproduce the observed delay propagation patterns. It is found that passenger and crew connectivity as the most relevant internal factor plays a significant role in delay spreading. In terms of resilience, Janic [11] developed a methodology for quantifying the resilience, friability, and costs of an air transport network affected by a large-scale disruptive event. Also, this methodology was applied to the case study of the United States air transport network whose north–east coast airports were affected by Hurricane Sandy in October 2012. Belkoura et al. [12] presented an algorithm to detect delay-generating events based on the comparison of planned and real trajectories. Through studying the historical data of European airspace, during 2011, it revealed the mechanisms governing the generation and recovery of delays while airborne.
Despite the advances in understanding the flight delay propagation and recovery process [13–16], few studies have investigated the resilience of the air transport system through studying the evolution of the delay propagation network considering the causality relationship of delay time-series. The well-known Granger causality (GC) test [17,18] is an effective method for determining the causality relation between the dynamics of two airports, such as the delay time series. The GC test has extensively been applied in various fields, including biology, ecology, social sciences, economics, and physics, to evaluate the causality relationship between different elements of a complex system. The air transport system is also a classic large-scale complex socio-technical system. Du et al. [19] applied the GC test to reveal delay causality relations between airports and studied the delay propagation through the topological and temporal analysis of the delay causality network. Zanin et al. [20] proposed modeling the process of delay propagation by using complex networks. Also, the delay propagation is detected by the GC test. Cook et al. [21] investigated new perspectives for air transport performance. Delay propagation is characterized under the scenarios using inter-alia and GC test techniques. Although great efforts have been made to the analysis of the air transport network with the GC test, the mechanisms of delay propagation and recovery are not fully understood. It can be studied from a complex network point of view, where airports are modeled as nodes and a link between two airports will denote direct delay propagation. It means that the flights delaying at one airport can partly explain the delay observed at a second airport. Then, the evolution of the delay propagation network captures a full image of the resilience of the air transport system. Here, statistical analysis of China air traffic data is applied to investigate the emergence of resilience in the air transport network. The useful measurement metric of resilience is proposed, and evolution patterns of generation and recovery of flight delays are also investigated.
The remainder of this article is organized as follows: Section 2 presents the detailed methodology applied, including a review of the Granger causality (Section 2.1) and the resilience metrics (Section 2.2). Section 3 reports the results obtained through a case study of the China air transport system. Finally, Section 4 summarizes our major conclusions.
2 Methodology
2.1 Granger causality
The Granger causality test is proposed and developed by the Economics Nobel Prize winner Clive Granger. It is a statistical hypothesis test based on an intuitive concept to quantify the interaction between two time series. The effect can be better predicted using the historical information related to both the cause and the effect than when just using the effect alone. The Granger causality test of delay time series in airports is described in the following section.
2.1.1 Delay time series pre-processing
The on-schedule performance dynamics of each airport can be evaluated by the delay time series. For airport i, the delay time series can be constructed by splitting 1 h into 12 time intervals. Therefore, we can construct hourly delay propagation networks and analyze the resilience of the air transport system through the evolution of delay propagation networks. The average delay of airport i is defined as the proportion of the total delay of departure flights to the total number of scheduled departure flights at airport i in 5 min. According to the regulations of the FAA, the departure delay time is the actual takeoff time minus the scheduled time of closing vessel hatches and scheduled airport taxi time. The scheduled airport taxi time is 15 min in general. With this method, we can construct the hourly delay time series for each airport.
In order to decrease the non-stationarity of delay time series, which may result in a biased evaluation of the Granger causality metric, the Z-score detrend procedure and delay time series difference are applied. The detrend procedure is calculated as follows:
where D′(h, t) represents the detrend delay for hour h and time t; D(h, t) is the original average delay; and ⟨D(., t)⟩ and σ(D(., t)) are the average and standard deviations of the delay time series, respectively. Then, an augmented Dickey–Fuller test (ADF) [22] is applied to verify whether the delay time series is stationary. The delay time series difference procedure is applied until the time series is stationary. The time series difference is presented as follows:
2.1.2 Causality test
The Granger causality (GC) will help understand the existence and direction of the influence between two airports based on the delay time series. In our study of delay propagation in the air transport system, an airport B “Granger-causes” another airport A if the utilization of historical data of the delay time series of B contributes to the prediction of the delay time series of A. This would indicate that there is direct delay propagation from airport B to A.
In mathematical terms, suppose that the stationary time series in airport A and B are A and B, respectively. Then, B Granger-causes A if,
where σ2(A∣U) represents the error in forecasting the time series A based on the historical information of entire Universe U. Also, σ2(A∣(U − B)) represents the error when the information of time series B is removed. Specifically, the Granger causality test uses an unrestricted regression equation to obtain the residual sum of squares RSSUR and a restricted regression equation to obtain the residual sum of squares RSSR. The equations are presented as follows:
where e(T) is the error term and am and bm are coefficients. pij represents the time lag. The null hypothesis that B does not Granger-cause A is defined as
An F-test is then conducted to assess the statistical significance of this null hypothesis.
where w is the sample size of each time series. When the p-value is less than the chosen significance level 5% by default, the null hypothesis is rejected.
2.2 Resilience
2.2.1 Definition
System resilience has been investigated in various traffic systems, including highways, railways, freight transportation, and aviation networks. Also, different quantifying methods have been proposed to evaluate and measure the resilience of complex transportation systems [23–26]. In the previous study, Chang and Shinozuka [27] introduced a classic resilience measurement that relates expected losses in future disasters to a community seismic performance objective. The well-known resilience triangle is defined to quantify the earthquake resilience as the change in system performance over time. The calculation of resilience loss (RL) is presented as follows:
where Q(t) presents the service quality of the community, which starts to decrease at t0 and returns to its normal state at t1. The resilience duration time is t1 minus t0. According to this definition of earthquakes, the concept can be widely applied to various complex social and technical systems suffering different disturbances.
In this study, the resilience of an air transport network is defined as its ability to withstand and stay operational at the required level of delay propagation during the impact of disturbances. With the Granger causality test, we can construct the hourly delay propagation networks and analyze the resilience of the air transport system through the evolution of delay propagation networks. Q(t) in this study, which quantifying the seriousness of delay propagation, can be the metrics developed in network science, which is described in the following section.
2.2.2 Network science metrics
Over the past decades, network science has significantly advanced our understanding of real complex systems since the beginning of the last century, ranging from physics, chemistry, and economy to human social science. Based on different topological metrics developed in network science, we can characterize some specific structural properties of the delay propagation network related to seriousness. In this study, the following network science metrics which are relevant to delay propagation are considered.
1) Link density [28] is calculated as the proportion of existing links with respect to the total number of potential links:
where N and l denote the number of nodes and links in the network, respectively. The higher the ld, the denser is the network: delays are easily propagated through it. Also, the delay propagation is more serious.
2) A degree [28] of an airport denotes the number of delay propagation links with it. The airport has two types of in-degree and out-degree links, representing the number of airports affected by or affecting by this airport, respectively. It is defined as follows:
3) Reciprocity [29] of an airport reflects the bidirectional nature of delay propagation links between airport pairs. The reciprocity means that airport i affects airport j, whereas airport j also affects airport i. It is defined as,
The parameter R is used to measure the overall symmetry of a directed network.
4) Efficiency [30] of a network represents how easily delays can spread between two airports, that is, how many intermediated airports one has to go through in order to reach the destination. The efficiency is defined by considering the inverse of the harmonic mean of the distances between pairs of nodes,
where dij denotes the distance between nodes i and j.
5) The largest connected component [31] is generally introduced to reflect the seriousness of delay propagation. The largest connected component is a group in which airports are connected by existed propagation links. It also has two different definitions with a strong connected component in a directed network and a weak connected component in an undirected network. The metrics can be defined as follows:
where N is the total number of airports and NLCC denotes the number of airports in the largest connected component.
3 Case study of China air transport systems
3.1 Data description
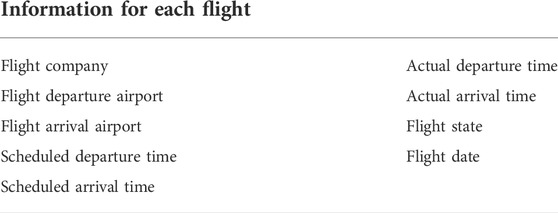
The dataset studied in this study was collected from the VeryZhun website, comprising all flight information in March 2019 in China. The database contained 251, 183 domestic scheduled flights connecting 160 airports. The average delay of all flights during the investigation period is 23.06 min. March 4 is the worst day of flight delay. The details of the dataset are shown in Table 1.
3.2 Analysis of China air transport systems
3.2.1 The resilience of daily China air transport systems
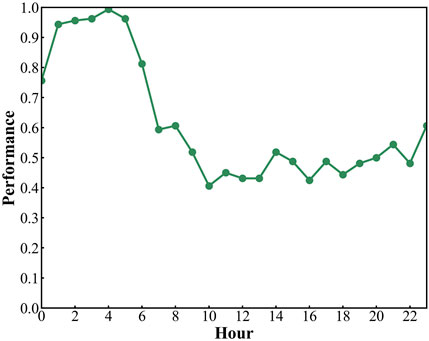
To perform a system-level analysis of resilience of China air transport systems, we construct an hourly delay propagation network using the Granger causality test for March 4, which is the worst day of flight delay. For each delay propagation network, 25, 600 (160*160) GC tests are performed. Through the entire day, we can obtain a time-ordered list of 24 delay propagation networks. Based on the metrics described in Section 2.2, we can quantify the resilience of air transport systems through the definition of resilience loss. In this study, we calculate every day resilience loss in March based on the largest strong connected component. The resilience loss on March 4 is shown in Figure 1. The definition of air transport system performance is 1 minus the proportion of airports in the largest strongly connected component. According to the definition, the resilience loss is 9.2 of 24 in total.
All these 24 time-ordered delay propagation networks can be considered a temporal network. Also, its macroscopic properties can be analyzed through the aggregated static network, which disregards the time. The links of aggregated network are the union set of all delay propagation networks, while the weight of the link is defined as the frequency of occurrence. Investigating properties of this aggregate network can have a system-level sight on the resilience of air transport systems as mentioned previously. In this aggregated network, the average degree is 75.10, which represents serious delay propagation on March 4, and the maximum weight of the propagation link is 7, which is from airport SJW to WUX, CGQ to WUX, XNN to LJG, and KHH to INC.
3.2.2 Evolution patterns
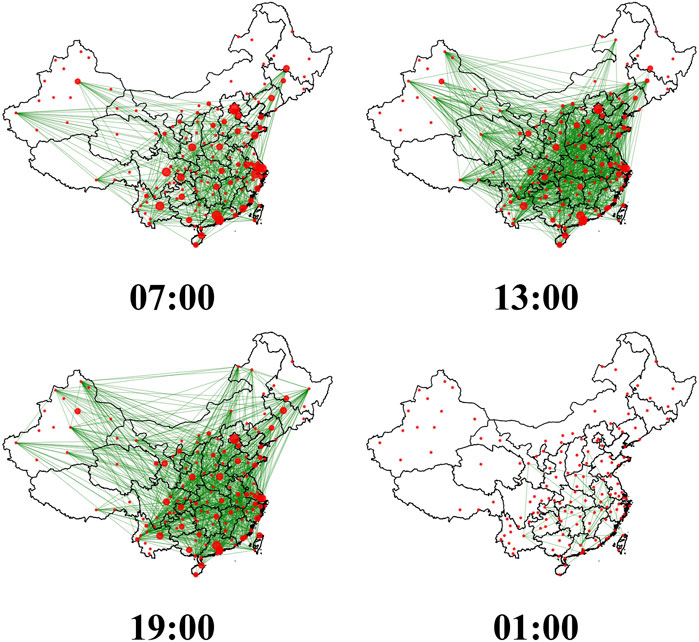
In order to capture the full image of resilience performance of air transport systems, it is necessary to investigate how the delay propagation generates, amplifies, and extinguishes throughout a day. Therefore, in this section, the snapshot of four delay propagation networks is shown in Figure 2. From the figure, we can find an obvious and visualized evolution of the delay propagation network, from densely connected in midday to sparsely connected at midnight.
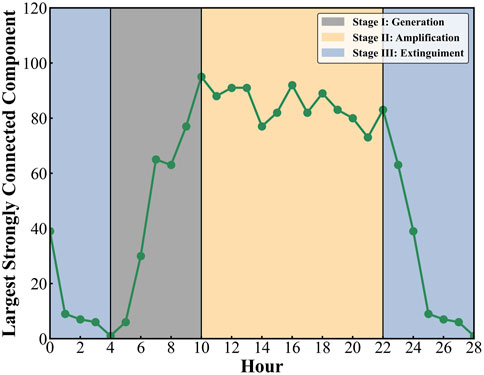
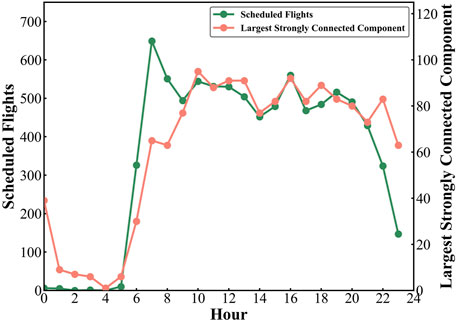
The delay propagation exhibits a cyclical fluctuation due to the daily schedules. Across a day, the delay propagation and dissipation rates are variable at different stages. Similar to the spread of a disease, the process of delay propagation can be divided into three stages: generation, amplification, and extinguishment. These three stages are shown in Figure 3. In the generation stage, due to a sharp growth in scheduled flights, most busy airports generate the initial delays under various disturbances, referred to as “morning rush” or “early rush.” Also, in the amplification stage, through the connection of resources, the delay propagation of airports becomes severe, with the increasing scheduled flights. In addition, accumulated through the early stage, the delay propagation may reach the peak value of the whole day or a steady state, while in the extinguishment stage, the delay propagation decreases sharply with less scheduled flights. As the itinerary accomplishment of an aircraft, the air transport network will recover from delay propagation due to the removal of the flight from the system.
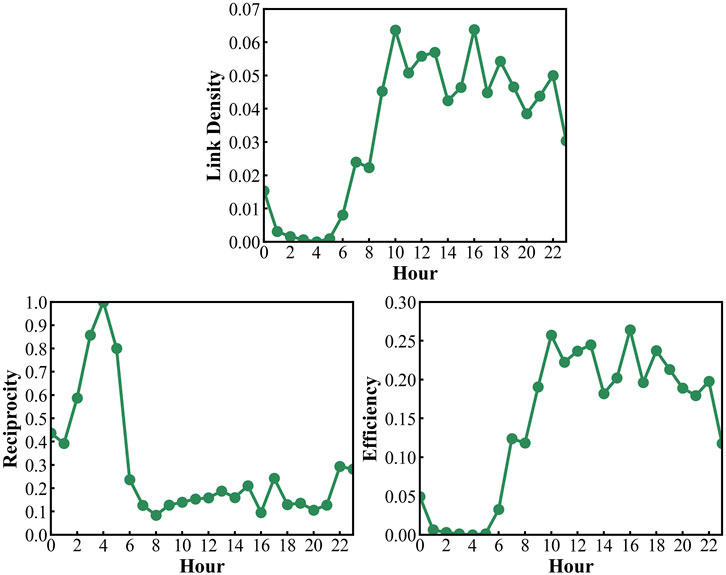
In addition, the evolution of different network science metrics is also investigated for a deep understanding of delay propagation evolution, such as the link density, reciprocity, and efficiency. In Figure 4, the evolution trend of link density and efficiency is similar to the resilience performance, while the reciprocity is different. The low reciprocity in generation and extinguishment stages reveals that the single-direction propagation plays a significant role.
3.2.3 Factors related to resilience
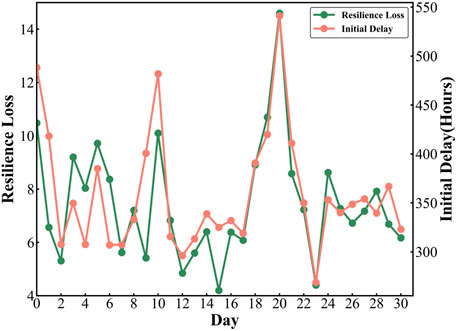
The resilience loss of air transport networks is influenced by many factors, such as severe climates, air traffic control, and malfunction of equipment. In this section, we investigate the relationship between resilience loss and external factors including initial delay of the day and scheduled flights. In order to quantify the relation between different factors, the Pearson correlation coefficient is calculated. It is defined as the ratio between the covariance of two variables and the product of their standard deviations. In Figure 5, the relationship between the resilience loss and initial delay for different days has been investigated. The initial delay is defined as the total departure delay in the delay propagation generation stage described in Section 3.2.2. From Figure 5, the Pearson correlation coefficient between the resilience loss and initial delay is 0.791 and shows a strong correlation visually. Therefore, the initial delay has a significant impact on the resilience of the air transport system. In addition, the relationship between the scheduled flights and largest strongly connected component is also studied in Figure 6. The Pearson correlation coefficient between the scheduled flights and largest strongly connected component is 0.883 and also presents a strong correlation. Therefore, we can conclude that the flight schedule is the main factor that influences flight delay propagation.
4 Conclusion
In this study, we adopt a well-known Granger causality test to detect the causality relationship between different elements of the air transport system. The resilience of an air transport network is defined as its ability to withstand and stay operational at the required level of delay propagation during the impact of disturbances. With the Granger causality test, we can construct the hourly delay propagation networks and analyze the resilience of the air transport system through the evolution of delay propagation networks. Also, based on different topological metrics developed in network science, we can characterize some specific structural properties of the delay propagation network related to seriousness. In the case study of the China air transport system, we first quantify the resilience loss in a particular day. Through analyzing the evolution patterns of metrics, the process of delay propagation can be divided into three stages: generation, amplification, and extinguishment. Finally, the strong relationship between initial delay, scheduled flights, and resilience loss is observed to reveal that initial delay and scheduled flights have a significant impact on the resilience of the air transport system.
The air transport system is a complex socio-technical system composed of many components which may interact with each other. Its behavior is intrinsically difficult to model due to the dependencies, relationships, human factors, and so on. The Granger causality test made it possible to evaluate the causality relationship between different airports. Apart from resilience, future research on the analysis of the delay causality network can be carried out to further reveal the complexity of the air transport system.
Data availability statement
The original contributions presented in the study are included in the article/Supplementary Material; further inquiries can be directed to the corresponding author.
Author contributions
GX: conceptualization, methodology, experiments and analysis, and writing—original draft preparation. XZ: supervision, reviewing, and editing.
Funding
This work was supported by the State Key Program of National Natural Science of China (No. 71731001) and the Fundamental Research Funds for the Central Universities (No. 2021RC 262).
Acknowledgments
The authors would like to thank the National Key Laboratory of CNS/ATM, Beijing Key Laboratory for Network-based Cooperative Air Traffic Management, for providing data and computational resources.
Conflict of interest
The authors declare that the research was conducted in the absence of any commercial or financial relationships that could be construed as a potential conflict of interest.
Publisher’s note
All claims expressed in this article are solely those of the authors and do not necessarily represent those of their affiliated organizations, or those of the publisher, the editors, and the reviewers. Any product that may be evaluated in this article, or claim that may be made by its manufacturer, is not guaranteed or endorsed by the publisher.
References
1. Belobaba P, Odoni A, Barnhart C. The global airline industry. Hoboken, NJ, USA: John Wiley & Sons (2015).
2. Zou B, Hansen M. Flight delay impact on airfare and flight frequency: A comprehensive assessment. Transportation Res E: logistics transportation Rev (2014) 69:54–74. doi:10.1016/j.tre.2014.05.016
3. Beatty R, Hsu R, Berry L, Rome J. Preliminary evaluation of flight delay propagation through an airline schedule. Air Traffic Control Q (1999) 7:259–70. doi:10.2514/atcq.7.4.259
4. Kafle N, Zou B. Modeling flight delay propagation: A new analytical-econometric approach. Transportation Res B: Methodological (2016) 93:520–42. doi:10.1016/j.trb.2016.08.012
5. Lan S, Clarke J-P, Barnhart C. Planning for robust airline operations: Optimizing aircraft routings and flight departure times to minimize passenger disruptions. Transportation Sci (2006) 40:15–28. doi:10.1287/trsc.1050.0134
6. Holling CS. Engineering resilience versus ecological resilience. Eng within Ecol constraints (1996) 31:32.
7. Hollnagel E, Woods DD, Leveson N. Resilience engineering: Concepts and precepts. Farnham, UK: Ashgate Publishing, Ltd. (2006).
8. Pyrgiotis N, Malone KM, Odoni A. Modelling delay propagation within an airport network. Transportation Res C: Emerging Tech (2013) 27:60–75. doi:10.1016/j.trc.2011.05.017
9. Malone KM. Dynamic queueing systems: Behavior and approximations for individual queues and for networks. Ph.D. thesis. Cambridge, MA, USA: Massachusetts Institute of Technology (1995).
10. Fleurquin P, Ramasco JJ, Eguiluz VM. Systemic delay propagation in the us airport network. Sci Rep (2013) 3:1159–6. doi:10.1038/srep01159
11. Janić M. Reprint of “modelling the resilience, friability and costs of an air transport network affected by a large-scale disruptive event”. Transportation Res A: Pol Pract (2015) 81:77–92. doi:10.1016/j.tra.2015.07.012
12. Belkoura S, Peña JM, Zanin M. Generation and recovery of airborne delays in air transport. Transportation Res Part C: Emerging Tech (2016) 69:436–50. doi:10.1016/j.trc.2016.06.018
13. Zhang L, Zeng G, Li D, Huang H-J, Stanley HE, Havlin S. Scale-free resilience of real traffic jams. Proc Natl Acad Sci U S A (2019) 116:8673–8. doi:10.1073/pnas.1814982116
14. Cardillo A, Zanin M, Gómez-Gardenes J, Romance M, Garcia del Amo AJ, Boccaletti S, et al. Modeling the multi-layer nature of the European air transport network: Resilience and passengers re-scheduling under random failures. Eur Phys J Spec Top (2013) 215:23–33. doi:10.1140/epjst/e2013-01712-8
15. Cook A, Rivas D. Complexity science in air traffic management. Oxfordshire, England, UK: Routledge (2016).
16. Monechi B, Servedio VD, Loreto V. Congestion transition in air traffic networks. PloS one (2015) 10:e0125546. doi:10.1371/journal.pone.0125546
17. Granger CW. Some recent development in a concept of causality. J Econom (1988) 39:199–211. doi:10.1016/0304-4076(88)90045-0
18. Granger CW. Causality, cointegration, and control. J Econ Dyn Control (1988) 12:551–9. doi:10.1016/0165-1889(88)90055-3
19. Du W-B, Zhang M-Y, Zhang Y, Cao X-B, Zhang J. Delay causality network in air transport systems. Transportation Res part E: logistics transportation Rev (2018) 118:466–76. doi:10.1016/j.tre.2018.08.014
20. Zanin M, Belkoura S, Zhu Y. Network analysis of Chinese air transport delay propagation. Chin J Aeronautics (2017) 30:491–9. doi:10.1016/j.cja.2017.01.012
21. Cook A, Tanner G, Cristóbal S, Zanin M. New perspectives for air transport performance. Third SESAR Innovation Days (2013).
22. Cheung Y-W, Lai KS. Lag order and critical values of the augmented dickey–fuller test. J Business Econ Stat (1995) 13:277–80. doi:10.2307/1392187
23. Khaled AA, Jin M, Clarke DB, Hoque MA. Train design and routing optimization for evaluating criticality of freight railroad infrastructures. Transportation Res Part B: Methodological (2015) 71:71–84. doi:10.1016/j.trb.2014.10.002
24. Bruyelle J-L, O’Neill C, El-Koursi E-M, Hamelin F, Sartori N, Khoudour L. Improving the resilience of metro vehicle and passengers for an effective emergency response to terrorist attacks. Saf Sci (2014) 62:37–45. doi:10.1016/j.ssci.2013.07.022
25. Faturechi R, Miller-Hooks E. Travel time resilience of roadway networks under disaster. Transportation Res B: methodological (2014) 70:47–64. doi:10.1016/j.trb.2014.08.007
26. Ip WH, Wang D. Resilience and friability of transportation networks: Evaluation, analysis and optimization. IEEE Syst J (2011) 5:189–98. doi:10.1109/jsyst.2010.2096670
27. Chang SE, Shinozuka M. Measuring improvements in the disaster resilience of communities. Earthquake spectra (2004) 20:739–55. doi:10.1193/1.1775796
29. Garlaschelli D, Loffredo MI. Patterns of link reciprocity in directed networks. Phys Rev Lett (2004) 93:268701. doi:10.1103/physrevlett.93.268701
30. Latora V, Marchiori M. Efficient behavior of small-world networks. Phys Rev Lett (2001) 87:198701. doi:10.1103/physrevlett.87.198701
Keywords: air transport network, resilience, complex network theory, statistical analysis, Granger causality
Citation: Xu G and Zhang X (2022) Statistical analysis of resilience in an air transport network. Front. Phys. 10:969311. doi: 10.3389/fphy.2022.969311
Received: 14 June 2022; Accepted: 01 September 2022;
Published: 04 October 2022.
Edited by:
Zhong-Ke Gao, Tianjin University, ChinaReviewed by:
Paolo Grigolini, University of North Texas, United StatesChengyi Xia, Tiangong University, China
Copyright © 2022 Xu and Zhang. This is an open-access article distributed under the terms of the Creative Commons Attribution License (CC BY). The use, distribution or reproduction in other forums is permitted, provided the original author(s) and the copyright owner(s) are credited and that the original publication in this journal is cited, in accordance with accepted academic practice. No use, distribution or reproduction is permitted which does not comply with these terms.
*Correspondence: Xuejun Zhang, emh4amJoQDE2My5jb20=
 Guoqiang Xu
 Xuejun Zhang1,2*