- Research Section of Environment Design, School of Architecture and Fine Art, Dalian University of Technology, Dalian, China
Coronavirus disease 2019 (COVID-19) has exposed the public safety issues. Obtaining inter-individual contact and transmission in the underground spaces is an important issue for simulating and mitigating the spread of the pandemic. Taking the underground shopping streets as an example, this study aimed to verify commercial facilities’ influence on the spatiotemporal distribution of inter-individual contact in the underground space. Based on actual surveillance data, machine learning techniques are adopted to obtain utilizers’ dynamics in underground pedestrian system and shops. Firstly, an entropy maximization approach is adopted to estimate pedestrians’ origin-destination (OD) information. Commercial utilization behaviors at different shops are modeled based on utilizers’ entering frequency and staying duration, which are obtained by re-identifying individuals’ disappearances and appearances at storefronts. Based on observed results, a simulation method is proposed to estimate utilizers’ spatiotemporal contact by recreating their space-time paths in the underground system. Inter-individual contact events and exposure duration are obtained in view of their space-time vectors in passages and shops. A social contact network is established to describe the contact relations between all individuals in the whole system. The exposure duration and weighted clustering coefficients were defined as indicators to measure the contact degree of individual and the social contact network. The simulation results show that the individual and contact graph indicators are similar across time, while the spatial distribution of inter-individual contact within shops and passages are time-varying. Through simulation experiments, the study verified the effects of self-protection and commercial type adjustment measures.
1 Introduction
The outbreak and worldwide prevalence of COVID-19 has exposed the public health issues in urban built environment [1–3]. Urban underground space has become a risk dissemination channel for the spread of the disease due to its closed environment and high utilizer mobility [4]. Utilizers in the underground spaces are more vulnerable to the spread of airborne bacteria [5] and fungi [6]. Driven by the traffic-oriented development mode, the underground streets have gradually developed into the underground pedestrian system playing important roles in pedestrian traffic, passenger transfer, shopping, and disaster prevention [7]. The huge number of utilizers and dynamic pedestrian flows in the underground streets make the spatiotemporal contact between individuals more frequent and complex. Obtaining the contact patterns and transmission risk in underground pedestrian system is an essential issue for public health risk assessment, epidemic spread prediction and public management decision-making [8, 9].
Most of the existing studies have focused on the impact of the physical environment [10] and the individual behaviors [11] on the epidemic spreading in the limited spaces. Few attentions have been paid to the transmission risk in the large-scale indoor environment. Studies on underground streets mostly focused on the pedestrian flow volume [12] and the level of service [13] in the pedestrian space. Few studies have paid attention to the influence of underground commercial facilities on the inter-individual social exposure in the underground system. For large underground facilities with high utilizer mobility, obtaining the risk areas and risk periods where transmission occurs is important for decision makers to take the effective and targeted measures. Aiming on the spatiotemporal distribution of the inter-individual exposure risk in underground shopping streets, this study is to examine the influential factors of transmission in the aspects of pedestrian network, commercial distribution and individual behavior.
Existing studies generally used the number of infections as the indicators for evaluating the risk of transmission in the public space [14]. As the prediction results were significantly influenced by the probability of transmission and the proportion of asymptomatic people, a large number of simulations are required to determine the risk of the study area under a wide range of parameters [15]. As the motion path and spatiotemporal distribution of people in the underground shopping street are time varying, the social contact and exposure duration of individuals in the underground system are significantly different [16]. The undetermined distribution of asymptomatic individuals in the social contact network makes the prediction results highly random. Therefore, we need new risk evaluation indicators independent of the transmission probability and asymptomatic proportion.
After the outbreak of the Covid-19 epidemic, more attentions have been paid to the impact of residents’ travel behavior and spatiotemporal contact on the development of epidemic situation [17]. In previous studies, some scholars have proposed non-drug intervention methods based on urban big data and population mobility [18]. Reducing public exposure and exposure time is considered an effective way to mitigate the spread of the outbreak [19]. The cumulative number of close contact and exposure duration between individuals in the indoor space are also used as indicators to evaluate the epidemic transmission risk in the public facilities [20]. This study adopts the contact count and the exposure duration as the intermediate indicators of inter-individual transmission. The cumulative contact counts and exposure duration in each road section and shops are used to examine the spatiotemporal variabilities of risk regions in the underground system. However, these indicators cannot fully represent the characteristics of the social contact network between all individuals in the underground streets. The clustering confidents of the social contact network weighted by inter-individual exposure are used to describe the global transmission risk of the underground system.
As a prerequisite for assessing the risk of inter-individual exposure, obtaining all utilizers’ space-time paths in underground shopping streets is challenging. The spatiotemporal variabilities in the number and spatial movement of utilizers cannot be ignored in the data collection process [5]. Tracing surveys are difficult to obtain a sufficient number of path samples. LBS and GPS data cannot be received in underground spaces. Wi-Fi positioning is not accurate enough to clarify inter-individual contact in the micro spatial scale [21]. Monitoring data can capture spatial and temporal contact of all individuals within a limited observation area in different time intervals [22]. It is hard to access to the exposure risk of individuals across the whole system, because the contact network for each observation area is independent of each other. Besides that, different trip purposes in the underground shopping streets requires us to consider both the spatiotemporal distribution of the utilizers in the pedestrian space and in the commercial facilities. It is generally difficult to directly obtain utilizers’ staying in the underground shops through observation methods. If pedestrians’ Origin-Destination (OD) information is known, we can access their space-time paths by recreating their spatial movements in the underground pedestrian system [23].
Based on the actual observation data, this paper proposes an agent-based simulation method to estimate the transmission risk in the underground shopping streets. This method considers the impact of commercial facility distribution and pedestrians’ behavior patterns in the underground space. A topological network was proposed for the model to express the utilizer’s state in the underground space. Combined with computer-vision (CV) tools, OD estimation model is adopted to obtain pedestrians’ space-time paths in the pedestrian space based on monitoring data. Shop utilization behaviors are modelled to describe utilizers’ spatiotemporal distribution in underground shops based on object re-identification algorism. The inter-individual contact and exposure duration are estimated through simulating agents’ motion and staying in the pedestrian and commercial facilities. With estimated results, spatiotemporal distribution of inter-individual contact degree is visualized to clarify the time-specific risk regions of epidemic transmission. A weighted social contact network is constructed based on the inter-individual indicators. Graph indicators are proposed to represents the transmission risk of the social network system. Applying proposed method, this paper examined the influence of facility distribution and utilization mode on the contact degree in the underground commercial space. Then this paper further verified the effect of two non-medical interventions on mitigating exposure risks in underground commercial spaces.
2 Methods
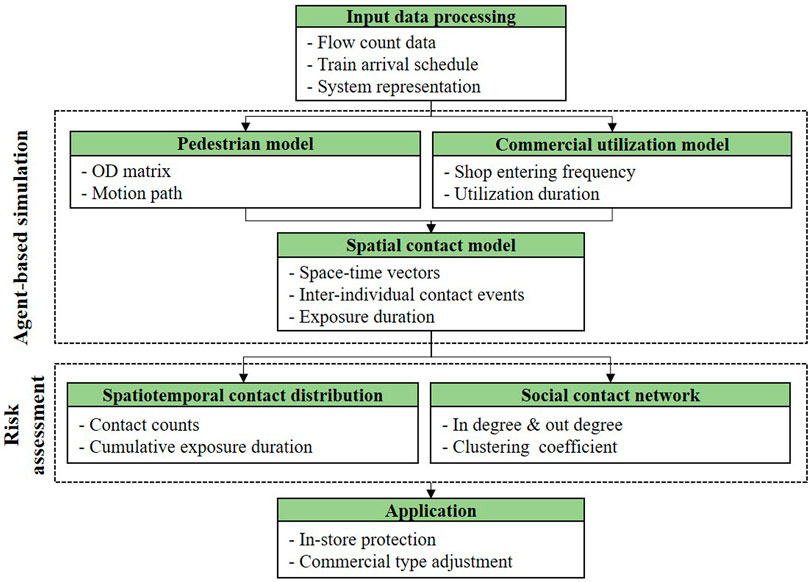
The framework of the proposed method was presented in Figure 1. Section 2.1 introduces the study area and data collection methods. 2.2 introduces the process and related methods of setting up the simulation program in this paper. 2.3 introduces the models used in the simulation and contact evaluation. 2.4 introduces the contact indicators for assessing the transmission risk.
2.1 Study Area and Data Preprocessing
2.1.1 Study Area
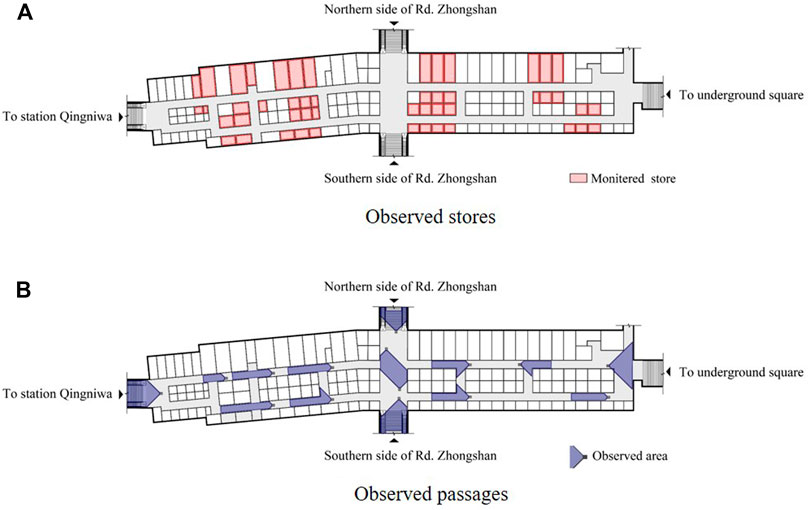
Shengli Underground Commercial Street was selected as the study area in this study. There are two parallel corridors, with three rows of shops and four entrances and exits in the study area. It is an underground pedestrian network that includes traffic and commercial functions. The Shengli Underground Commercial Street is located below Zhongshan Road. It connects two subway stations, an intercity railway station, and several surrounding commercial shopping centers. Since there is no cross-street sidewalk in Zhongshan Road, pedestrians destining to the other side of the road have to pass through the cross-street sidewalk in the underground street. Therefore, there is a large number of transfer and cross-street traffic demands in the area. As shown in Figure 2, there are 166 stores in this area, including 108 clothing stores, 17 cosmetic stores, four grocery stores and 33 other types of stores.
2.1.2 Original Data: Monitoring Video Data
In this study, surveillance video is used as the basic data obtained in individual space-time paths. There are 15 surveillance cameras in the study area, covering the four main entrances and exits, 49 shops and 12 intersections (Figure 2). The video data was collected in December 24th and 26th, 2019, including the data of 15 observation areas from 9:30 a.m. to 8:00 p.m. According to the common experience, this paper selects 1-h data at opening (10:00–11:00), noon (13:00–14:00) and evening commuting (17:00–18:00) hour in a weekday (24th, December) as examples. Underground utilizers are considered have different purpose and behavior patterns in these time intervals. This study infers that there are less utilization with the purposes of commuting and dining in the opening hour (10:00–11:00). Dining and shopping are considered as the main utilization activities at noon (13:00–14:00). Evening commuting (17:00–18:00) hour mainly focuses on the behavior patterns of commuters and consumers in the study area.
2.1.3 CV Observation Data: Link Flow Counts Data
Firstly, we use yolov5 [24], an object detection algorithm to extract image frames from the video with two frames per second, and use machine learning algorithms to extract all pedestrian objects present in the observed images of each scene. The personal attributes (e. g. gender and age) are not obtained in this study. Over 1.6 million images of pedestrians were extracted after our analysis of the data of all observed areas in the three periods. According to the verification method of yolov5 [24], there are no target loss in 10 frames randomly selected. It shows that the accuracy of the algorithm is within an acceptable range.
Next, the Reid method was used to combine the discrete images into a sequence [25]. Through the re-identification algorithm, we can obtain the time-series position trajectories of all targets in the observation area in the camera coordinate system of the observation video. Considering computation speed and accuracy, we selected Resnet-50 as our Reid network from all available networks [10]. The Resnet-50 network converts a pedestrian image into a 512-dimensional vector as its feature. The similarity of two images is represented by calculating their distance in the 512-dimensional space. Images of the same target in the neighboring frames are matched and sorted in a series according to their similarities. Compared with traditional object tracking algorithms, the Reid method has advantages in terms of performance and computational speed on the pedestrian overlap problem.
The bidirectional pedestrian flow counts of observed passages in different time intervals are estimated through proposed method. The accuracy of the computer vision method was verified by manual verification. The loss of the computer vision method is 14.4%, which is within the acceptable limit.
2.1.4 Artificial Observation Data: Store Utilization Data
Based on the observed images, we selected 49 stores with visible entrances as data collection area. In this study, store usage is defined as the event in which pedestrians are attracted to enter the store. The time interval between a pedestrian’s entering and leaving a store is defined as the utilization duration. Since CV-based results were not accurate enough for modelling, we developed an auxiliary program to build the dataset manually. The dataset contains the entry and exit time data of 784 samples in three time intervals.
2.1.5 Numerical Estimation Data: OD Matrix
In order to simulate pedestrians’ motion traces in the study area, we estimated their OD matrix based on the flow counts at observed passages. This study assumed that all utilizers move in the shortest path. Then, the trip assignment proportion at each link can be obtained by calculating the link sequence of the shortest path between each OD pair. Taking the bidirectional flow counts of the observed passages as the constraints, we can estimate the trip counts between entrances and exits by entropy maximization approach [23].
2.2 Simulation Settings
2.2.1 System Represent
As shown in Figure 3 (b), each store is represented by a node and connected with the pedestrian networks at road nodes on the same corridor. The underground space can be preliminarily simplified as a link-node network. However, it divides the corridor section into several segments which may increase the computation cost. Treating the road nodes between two intersections with no difference, the store nodes distributed along the same corridor section are connected to a road node representing the state of walking along the corridor Figure 3 (c). Notably, these edges have no attributes, such as length. The edges between the nodes presents the transition between staying and walking states. Finally, the entire underground space was converted to the graph shown in Figure 3 (d).
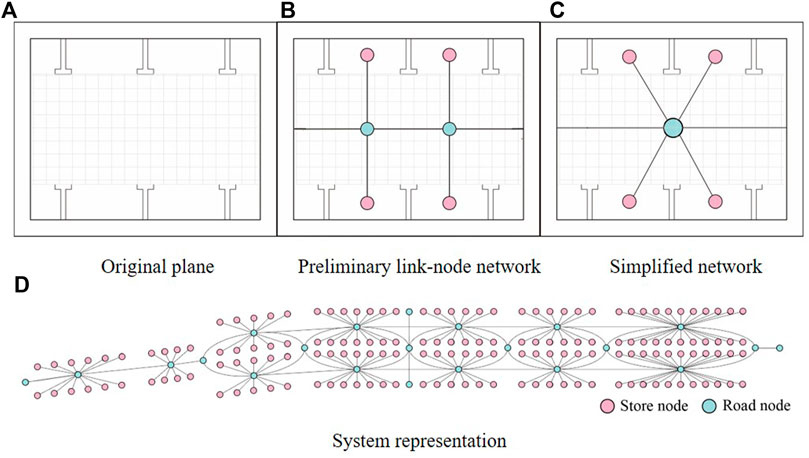
FIGURE 3. System representation of study area: (A) original plane; (B) preliminary link-node network; (C) simplified network; (D) system representation.
2.2.2 Basic Settings
A subway station is connected to the underground commercial street on west side which periodically generates passengers from the arrival train. For an entrance, the impact of aggregate pedestrian crowds on the inter-individual contact were considered by setting the agent generation velocity according to the video observation data. After the agent is generated, the agent moves between nodes according to its pre-assigned path and walking speed. For the non-entrance nodes, the arrival time of the agents are not set to match the real observation data.
The generated agents in the simulation are set to transit from node to node along their pre-determined path, and keep updating their positions until their destination. All agents’ node sequences and the start and the end time of each node are recorded for the subsequent analysis.
2.2.3 Additional Simulation Rules
To simplify the calculations and get closer to reality, several additional rules were imported into the simulation process.
A) This study assumed that store utilizers tend to enter another store in their subsequent path. Each agent is set with the same probability at the beginning. With the progress of simulation, agents with store usage records are set with a higher probability of entering a next store. This rule is operated as follows. All agents are set the initial weight of entering by 1. When a store node triggers a store entry event, all agents in the connected road node will be added to a candidate pool. The probability of each agent being selected to enter the store is defined with the ratio of the agent’s entry weight to the sum of the entry weights of all candidate agents. After an agent has entered a store, its weight is increased by 1.
B) We set the agent’s walking speed to satisfy normal distributions. The mean values μ of the purpose-specific normal distributions are set by 1.49 m/s and 1.16 m/s, respectively [26]. The standard deviation σ is set by 1. The proportions of agents in each walking speed group are set the same.
C) Store utilizers only move to the stores in the shortest paths.
D) The waiting area of a store is located inside the store.
E) All agents move at a constant speed.
2.2.4 Simulation Process
The simulation treats 10 s as one loop. In each loop, the simulation performs the following steps in sequence.
A) Agent generation. For each entrance, the entrance node determines how many agents enter based on the estimated OD data. When an agent is generated, its walking speed and space-time path is predetermined according to the spatiotemporal path generation model. The agent’s speed is randomly set according to the additional rule B in section 2.2.3.
B) Store entry events. Each store node determines the number of agents that has entered the node during this time period based on the store entry probability model. In addition, all pedestrians in the neighboring road nodes are considered as possible candidates for entering the store. The entering agent is random selected from the candidates based on the weights mentioned in the previous section. The store usage time of selected agent is set according to the store usage time model.
C) Movement of agents. The state of each agent in a road node is updated according to the results of store entry events. For each agent within a store node, the simulation updates their store usage countdown and removes agents with a countdown to zero to the neighboring road node.
D) Destroying agents. The agent that has reached its destination is excluded from the simulation.
2.3 Models
2.3.1 Commercial Utilization Models
The store entry events are modeled in view of the shop types. The commercial facilities in the Shengli Underground Commercial Street are divided into service stores and non-service stores according to different utilizer patterns. Service stores are those commercial facilities, which have an upper limit of guests. Non-service stores have no upper limit.
This model treats pedestrian entering the store as a random event. The probability of a pass-by pedestrian entering a specific store is described by the frequency distribution of the time interval between two sequential entry events. It is assumed that entry intervals satisfy exponential distribution as follows.
In order to avoid the numerical problem caused by too small λ, 10 s was taken as a time unit in this study. Unknown parameters λ in different hours are calibrated according to observation data accordingly.
The performance of a simulation with an exponential distribution is not an efficient method, because variables obtained with an exponential distribution are continuous, while the simulation is discrete. In our study, we turned continuous variables into discrete ones by treating the number of events as a random variable. As the interval time corresponds to an exponential distribution, the process of pedestrian entry can be considered as a Poisson process [21]. For a Poisson process, the probability of an event occurring k times in the period of 10 s can be calculated by:
where λ is the unknown parameter calibrated through exponential regression. Probability distribution based on regression results are shown in Figure 4 (a). It is found that shops receives more customers during the lunch hour (13:00–14:00). Customer frequencies of service and non-service shop are significant different in the morning hour (10:00–11:00).
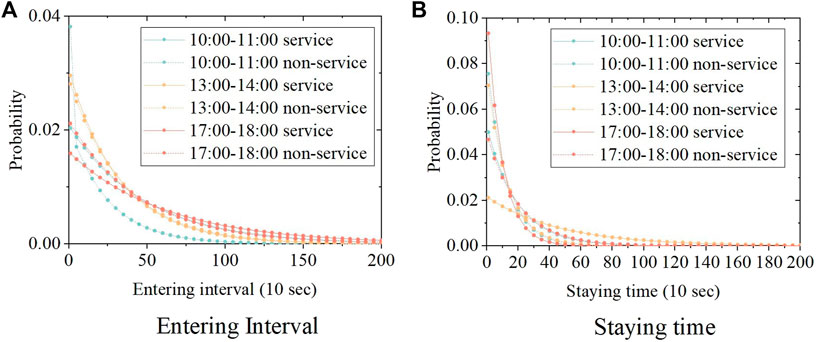
FIGURE 4. Frequency of interval time between store entry events: (A) entering interval model; (B) staying time model.
The usage time of non-service stores is not affected by the number of staff and the waiting time in a queue. Therefore, each customer’s usage time is an independent variable. For service shops, it is necessary to take the waiting behaviors into account. To exclude the additional waiting time, the data collection only took the utilization behaviors without waiting into account. Based on observation data, the duration of agents staying in a specific store is modeled by the probability distribution. Similar to the store entry probability model, the time-specific parameters of service stores and non-service stores was calibrated respectively based on the observed data.
It is found that the staying time of agents in two types of stores both satisfy the exponential distribution. Model parameters in different hours are calibrated through exponential regression accordingly. The regression results are shown in Figure 4 (b). Table 1 shows the time-specific utilization duration in different shops. It is found that the utilization duration of service shop are obviously longer in the noon hour (13:00–14:00), while non-service shop customers prefers to stay longer during the evening commuting hour (17:00–18:00).
2.3.2 Spatiotemporal Path Generation Model
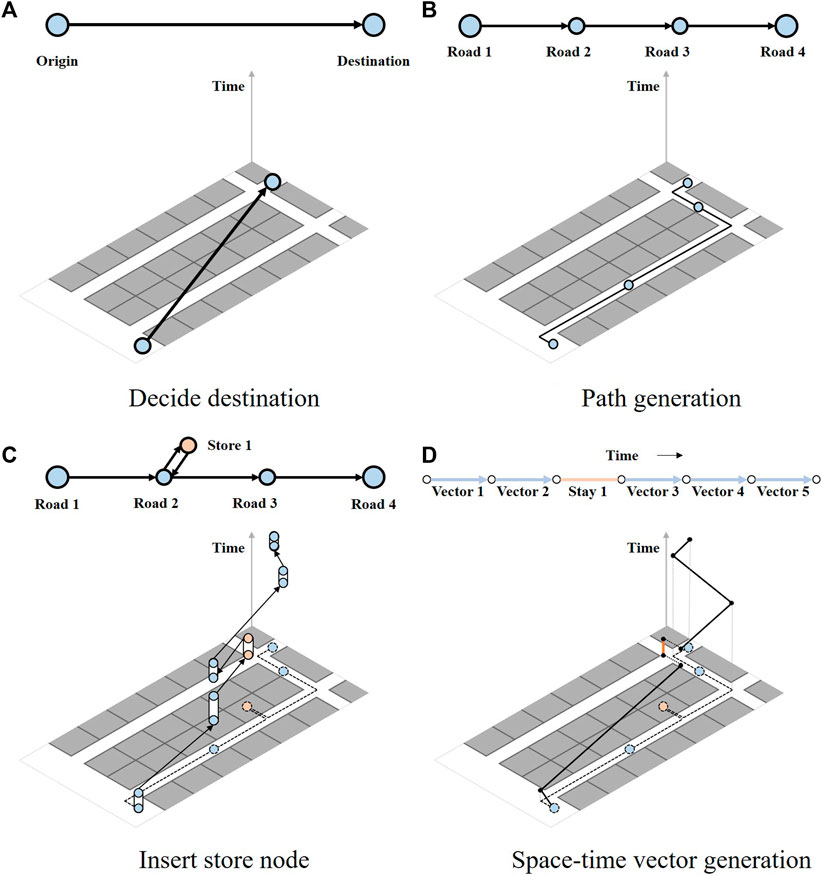
For an agent generated at the origin node, its destination node is set based on OD matrix (Figure 5 (a)). This study uses the Dijkstra algorithm to obtain the shortest path between each OD pair. A sequence of road nodes in the simplified network is generated based on agent’s spatial path (Figure 5 (b)). For agents with store entry records, store nodes are inserted into the node sequence. As shown in Figure 5 (c), the start and end time of the states responding to the road nodes in the generated sequence are assigned according to agents’ walking speed and the length of passages. Stay duration within the store nodes were set through store utilization model. With the agents’ space-time vectors within the node sequences, their space-time paths within in the actual pedestrian network are generated accordingly (Figure 5 (d)).
2.3.3 Spatiotemporal Contact Model
The close contacts of utilizers in the study area are divided into two parts, the contacts in the pedestrian space and the contacts in the shop space. The pedestrian space in a corridor section corresponding to a road node is represented by a directed segment. The space-time path of an agent g can be represented by a series of space-time vectors in the 2-dimensional space-time coordinate system. As shown in Figure 6 (a), the vertical axis represents time, and the horizontal axis represents the location of the road segment. Agents are assumed to continuously leave dissemination, for example, exhale on their motion trace, which generates a space–time impact area in the space–time coordinates (Figure 6 (a)). In case agent b’s time-space path goes through the time-space area of individual a, it is considered that b has been indirectly affected by a through dissemination media. The exposure duration can be obtained by the time difference between the points where the path of b intersects the area edges of a (Figure 6 (a)).
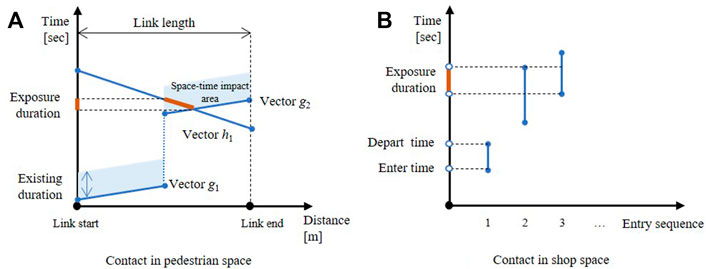
FIGURE 6. Inter-individual contact in the space-time coordinate system: (A) contact in pedestrian space; (B) contact in shop space.
The shop space is represented by a store node with no dimension. The agents’ space-time paths in the shop space are 1-dimensional vectors determined by their entry and departure time. The exposure duration between two agents are obtained by the length of their overlapped segment (Figure 6 (b)). In the simulation, we set each non-service store with one staff. For service stores, we assumed that there are three staff in each service store in view of the actual situation. During the whole simulation process, staff agents are set to stay in the store nodes all the time. The agents who have entered the store node are considered to have close contact with all the agents in the store node.
2.4 Indicators
2.4.1 Individual Indicators
The individual contact indictors are defined by the cumulative count counts and cumulative exposure duration of each agent, which are obtained by summation of the contact results in all nodes in the underground system. These indicators are used to assess the transmission risk in the personal perspective.
2.4.2 Spatiotemporal Indicators
For managers of underground commercial streets, they are more concerned about the spatial distribution of the regions with frequent contact. In this part, according to the different locations of close contact, close contacts are also divided into contacts in pedestrian space and shop space. The risk of inter-individual contact in the pedestrian space is indicated by the accumulative exposure duration of all agents passed through a specific passage. For the contact degree in a shop was described the accumulative exposure duration of arriving customers. The mean value the contact degrees of all shops located on the same link is adopted as the indicator of the contact risk in the shop space. With the time-specific spatial distribution of cumulative contacts in the pedestrian and shop space, we can obtain the spatiotemporal distribution of inter-individual contact in study area. Links in the pedestrian network are used the spatial unit for visualization in this study.
2.4.3 Contact Graph Indicators
It is difficult for us to assess the overall contact degree of a complex contact system through ordinary statistical methods. Therefore, we use a graph to represent the contact relations between different agents in the complex system. When there are multiple agents in the whole time and space, the close contact relationship between the agents becomes the edge of the nodes.
A directed graph is constructed based on an adjacency matrix Kab with the elements of 1 and 0, where one means that agent a has been exposure to contact region of agent b. As mentioned in section 2.3.3, the edge between nodes of a and b is directed. To distinguish the contact degree between individuals, a weighted graph is constructed in view of the estimated exposure duration between individuals [27]. The edges in the weighted graph are also directed.
A) Clustering coefficient
The contact graph is considered as an irregular network. The connected agent number of each node in the graph is not always uniform. To describe this issue, the clustering coefficient of the graph is adopted to indicate the closeness of agent nodes in the whole network [11].
The clustering coefficient indicates the degree to which these agents cluster together spatiotemporally. It refers to the probability that any two neighbors of a node are adjacent to each other. The larger clustering coefficients indicate there are the more triangular structures are in the graph. According to the previous studies [28], the clustering coefficient for a unweighted and directed graph is defined by
where Kab is an adjacency matrix with the elements of one and 0.
where W is the adjacency matrix of the weighted graph. The matrix element Wab, which stands for the weight of edge
where
B) Degree distribution
In the graph, the number of edges connected to a node is defined as the degree of the node, and the degree distribution refers to each node degree in the graph. The degree of a node shows how much it is influenced by other nodes and how much it influences other nodes. In a contact graph, since close contact is directional for two agents, the degree distribution in the contact graph can be divided into out-degree and in-degree parts. The out-degree shows how much the agent influences other individuals in the simulation, while the in-degree shows how much the agent is influenced by other individuals. For the whole graph, there is no difference between out-degree and in-degree. Because for a directed edge, the in-degree and out-degree of the entire graph are identical. More attention is paid to the degree distribution of the nodes of contact graph in this study.
3 Results
3.1 Individual Contact Indicators
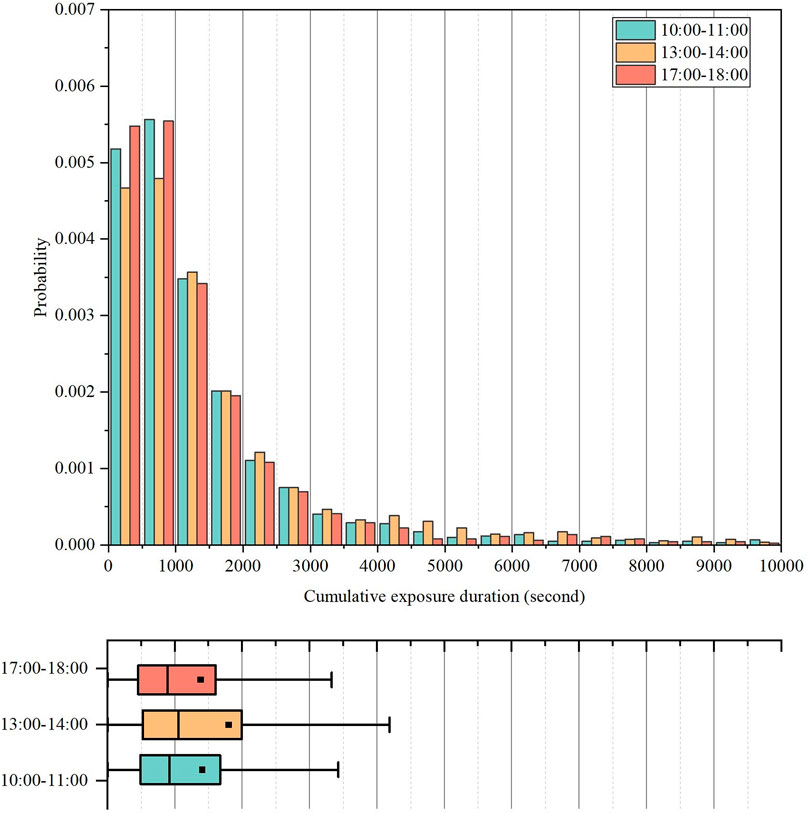
Table 2 shows the estimated indicators in the three time periods. The contact indicators at noon (13:00–14:00) are higher than other hours. Compared with the morning (10:00–11:00), the cumulative contact counts in the evening hour (17:00–18:00) are larger, because there are more people commuters destining to the metro station. However, the cumulative and inter-individual duration people exposed to others’ influence are smaller due to the more utilizers in the system.
As shown in Figure 7, the cumulative exposure duration between individuals satisfy the Poisson distribution tendency in three time intervals. The peaks of distributions appear in the range from 500 to 1000 s. Compared with other periods, individuals in the evening hour (17:00–18:00) are more likely to have short contact with others. On the other hand, individuals in the noon hour (13:00–14:00) showed higher tendency in the long duration ranges. It is because there are more shop utilization events after lunchbreak in view of Figure 4 (a).
3.2 Spatiotemporal Contact Indicators
Figure 8 visualized the spatiotemporal distribution of contact in the study area. Links’ height and color represent the cumulative exposure duration of all agents passing through. It is found that the cumulative exposure duration in the pedestrian space are significant longer than in the shop space. As show in Figure 8 (a), close contacts in pedestrian space mostly occur near the two ends of underground streets. The contacts’ distribution tendencies in the two parallel corridors are not uniform. Contacts are more likely to occur in the north side with higher pedestrian flow counts. A link near the underground square are significant higher in the noon hour (13:00 to 14:00). It is because the dining facilities in the neighboring underground square generate and attract large amount pedestrians during the lunch hour. Pedestrian flow is the considered as the main reason causing longer exposure duration in the underground pedestrian space.
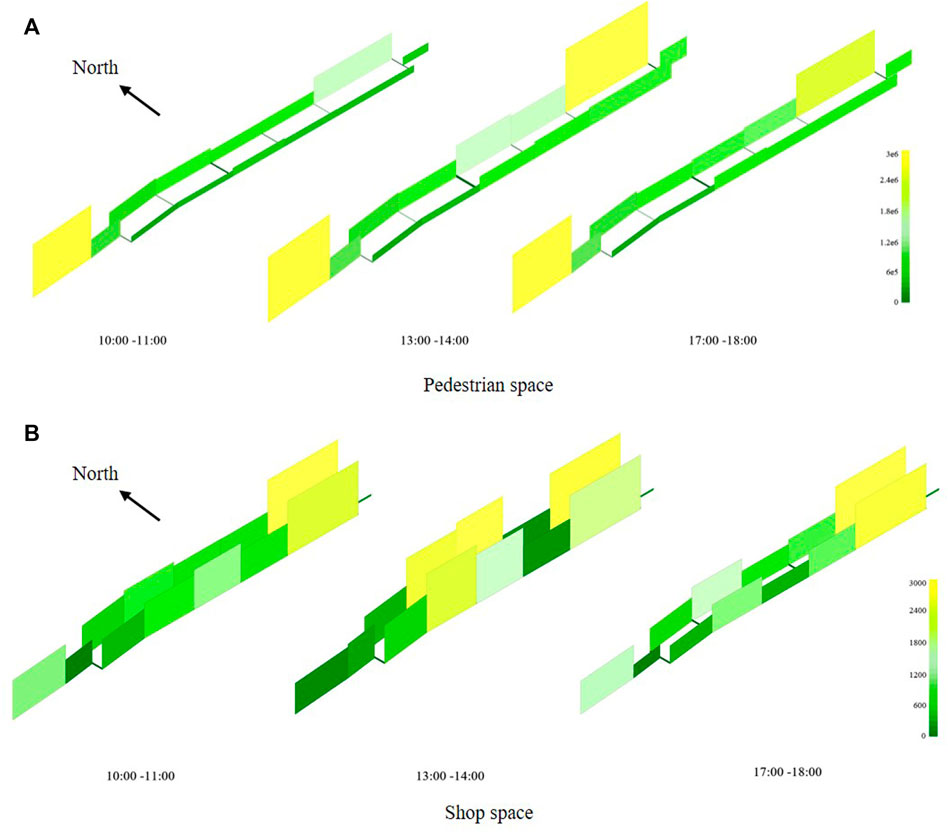
FIGURE 8. Spatiotemporal distribution of cumulative exposure duration in the study area: (A) pedestrian space; (B) shop space.
As show in Figure 8 (b), there are longer exposure duration in the eastern end of the underground streets. The stores located the middle of the streets show higher distribution tendency in the noon hour (13:00 to 14:00). It is because there are more service-type (e.g., café and dessert Shop) commercial facilities located near these parts, which cause long staying behaviors during the lunch time.
3.3 Contact Graph Indicators
Table 3 shows the mean values of estimated graph indicators in a weighted and an unweighted network. It is found that the average out/in degrees in an unweighted network is constant to with result of inter-individual contact counts. It represents inter-individual relation in the network. The unweighted clustering coefficient is used to describe the probability of the triangular structures in the whole contact graph and assess the contact between individuals. The estimated results follows the rules of the clustering coefficient of many real-world systems [29]. Among the contact graphs of three different periods, the clustering coefficient is smaller in the period from 10:00 to 11:00. The contact graph is sparser and it is more difficult for virus to transmit from one agent to another duration this period. The average clustering coefficients in the noon and the evening are constant. Even through there are more agents in the system in the lunch hour (13:00–14:00), the average connectivity is not significantly increased because shop utilizers contact fewer people in the shop. Considering the positive correlation between exposure duration and the inter-individual transmission, this study adopts the weighted clustering coefficient to measure the local connectivity in a social network. Compared to the results of unweighted network, significant differences have been found between noon (0.003) and evening (0.002) hours. As shown in Table 3, even the probability of the triangular structures are similar in the noon (13:00–14:00) and evening hour (17:00–18:00), the transmission risk is higher in the noon hour due to the long commercial utilization after lunch (Table 1).
Figure 9 shows the degree distribution of the unweighted networks. Significant positive correlation are found in three time intervals. The slopes of the linear regression show that agents are more tend to be affected by others. Samples upwards away from diagonals indicates that these agents greatly affect others, but they are seldom exposed to others’ influence. The box graphs show that the in-degree tends to distribute on the larger range in the noon hour, which indicates individuals are more frequent to be contacted during this period.
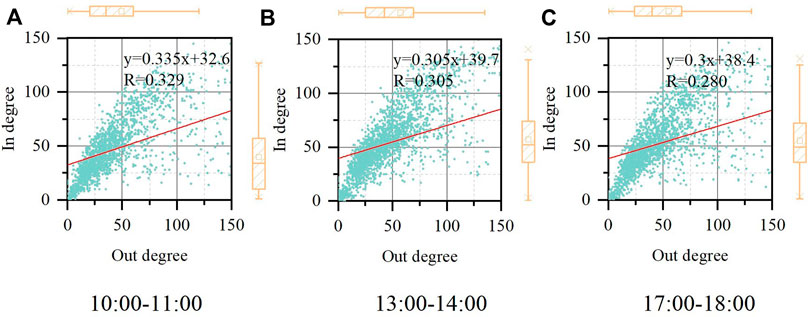
FIGURE 9. Degree distribution of unweighted social contact networks in different time intervals: (A) 10:00–11:00; (B) 13:00–14:00; (C) 17:00–18:00.
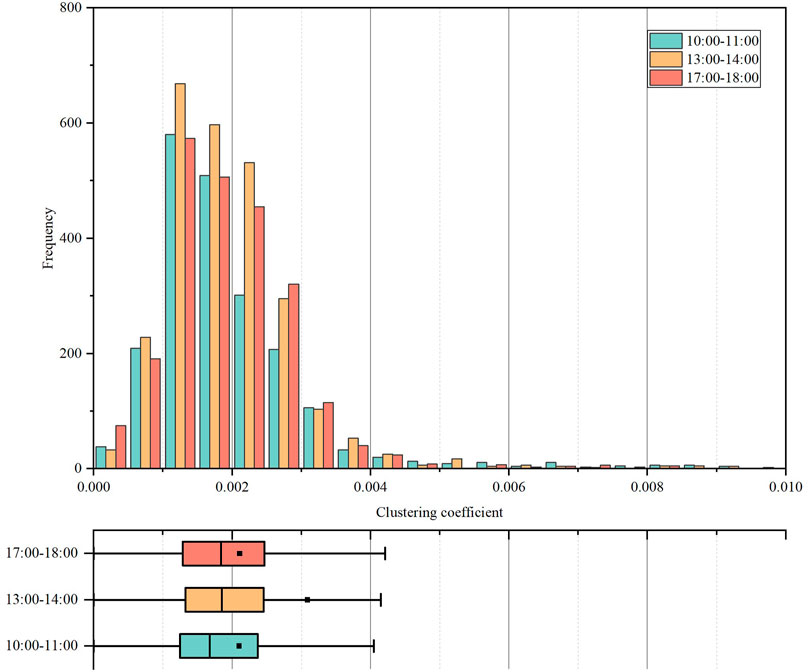
Figure 10 shows the frequency distribution of the clustering coefficients in the weighted networks. Clustering coefficients in three time intervals show the normal distribution tendency. It is found that even through the box plots of the noon (13:00–14:00) and evening hours (17:00–18:00) are quite similar, the mean value in the noon is higher than the evening. In view of the results shown in Table 1, one possible reason is that there are a certain number of customers staying extreme long duration in the service shops in the noon hour. This issue cannot be reflected in the unweighted contact networks.
4 Applications
This study took the noon hour (13:00–14:00) as an example to verify the influence of the commercial facilities on the contact indicators through simulation experiments. We also simulated the effect of two possible non-pharmaceutical interventions on the weighted clustering coefficients in the study area.
4.1 Influence of Commercial Facilities on Contact Indicators
According to the field survey data, there are 33 service stores and 127 non-service stores in the study area. Two types of stores are evenly distributed in the study area. In the commercial type adjustment plan-1 and plan-2, the number of service stores are increased to 80 and 120. Plan 3 decreases staff number in the service shops to 1.
The simulation results under different settings are shown in Table 4. The individual contact counts have not significantly varied with the growth of service-type proportion. It is because most of contact events happen in the pedestrian space. The cumulative/inter-individual exposure duration increased obviously. The service shops limit the number of people inside the stores which indirectly enhances the exposure duration between the waiting customers.
It is found that the clustering coefficients in the networks with commercial type adjustment increased significantly. The increase of service stores proportion is considered to make local connectivity changes in a weighted contact network. It is because service-type stores would attracted utilizers with longer staying duration inside the shop space. Besides that, the number of customers inside the service-type stores is limited, which may lead to more waiting queues in the study area.
Plan-3 simulates the condition with the reduction of staffs in the service stores. The clustering coefficients still increased in this condition. Though, the customers meet contact fewer staffs in the store, this measure may also enhance customers’ waiting time in the queue. Reducing staff at service stores may not be a good measure for transmission mitigation.
4.2 Evaluation of Self-Protective Measures
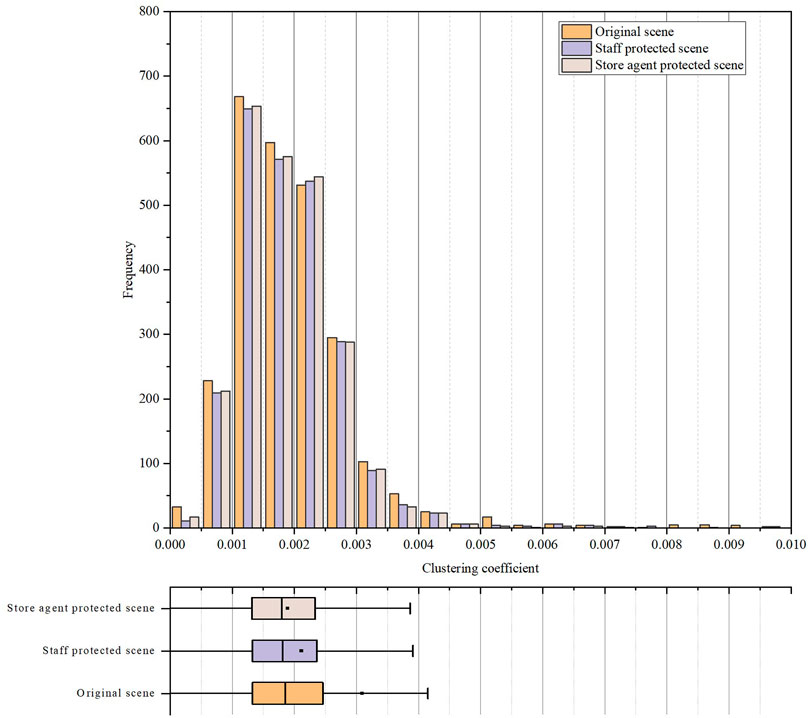
Two possible personal protective measures are proposed. In the staff protect measure, staffs in the study area are required wear a mask. Protected staffs are treated as invalid nodes in the contact graph, and are eliminated during the clustering coefficient calculation. Customer protect measure requires agents to wear mask in the stores which cuts downs the contact between individuals staying in the same shop. Taking the noon hour (13:00–14:00) as an examples, proposed measures are examined through simulation experiments.
Figure 11 shows the estimate clustering coefficients in the original and proposed scenes. It is found that the effects of proposed measures are not significantly in view of the frequency distribution. Compared with contacts in the shops, agents would establish more connection with others in the pedestrian space. However, the mean values in two proposed scenes decreased obviously. It is because self-protect cuts down the strong connection between agents staying long time service shops and queues. These measures works well in mitigating the local transmission risk in the clustering groups in the networks.
5 Conclusion
Considering the underground commercial street as a complex system, this paper presented a method to simulate utilizers’ dynamics and interactions in the large-scale indoor space. Based on monitoring data, CV and Re-identification techniques are adopted to collect utilization behavior data. With observed data, three models are constructed to describe underground utilizations’ time-specific walking and shopping behaviors in the system. Utilizations’ space-time paths and inter-individual contacts are simulated by recreating their spatial movement and staying in a simplified network.
Three types of indicators are presented to assess the risk of inter-individual contacts in different aspects. This paper examined the proposed indicators by simulating individuals’ spatiotemporal contacts in three typical time intervals. The results showed that contact counts of individuals are closely related with utilizer amount in the system, while inter-individual exposure durations are affected by behavior patterns such as the commercial utilization. Contact risk regions are found to vary according to time in view of the cumulative duration of contact events within the link-node network. High pedestrian flow counts are considered to increase the contact risk in the pedestrian space, while long staying duration in the service-type shop are thought to relate with contact risk in the shop space.
A contact graph is proposed to indicate the impact relations of all individuals in the whole system. Clustering coefficient is defined to represent the local connectivity in the social contact network. Weighting the edges between nodes in the social network are proved to reflect effect of the long exposure duration on inter-individual transmission. The time-varying contact degrees of the complex system are assessed based on the clustering coefficients’ distribution in different time intervals. Clustering coefficients in a weighted contact graph are proved to reflect more characteristics of the interaction in the social network. Appling proposed methods, commercial facilities’ influence on inter-individual contact was examined through simulation experiments. The results showed that increasing the proportion of service-type shops and reducing staffs would enlarges the clustering coefficients in the noon hour. Self-protection of customers are more effective than that of staffs in the evaluation of the transmission mitigation measures.
In the weighted network proposed in this study, connection strength between agents in the contact graph is directly weighted by the exposure duration. The correlation between exposure duration and transmission probability would be fully considered in the future work. This study only examined influential factors in the aspect of shopping behaviors. The possible reasons lead to high contacts in the pedestrian space would be further studied in the next paper.
Data Availability Statement
The raw data supporting the conclusions of this article will be made available by the authors, without undue reservation.
Author Contributions
Z-CG and S-HS: conceptualization, methodology, software. Z-CG and WL: investigation, resources, and data curation. S-HS and Y-SY: original draft. WL and S-HS: visualization. WL: supervision. All authors contributed to manuscript revision, read, and approved the submitted version.
Funding
It is supported by the National Natural Science Foundation of China (Grant No. 51808094).
Conflict of Interest
The authors declare that the research was conducted in the absence of any commercial or financial relationships that could be construed as a potential conflict of interest.
Publisher’s Note
All claims expressed in this article are solely those of the authors and do not necessarily represent those of their affiliated organizations, or those of the publisher, the editors and the reviewers. Any product that may be evaluated in this article, or claim that may be made by its manufacturer, is not guaranteed or endorsed by the publisher.
Acknowledgments
Thanks to Yang Liu for his technical support in the model training.
Supplementary Material
The Supplementary Material for this article can be found online at: https://www.frontiersin.org/articles/10.3389/fphy.2022.882904/full#supplementary-material
References
1. Ao Y, Zhu H, Meng F, Wang Y, Ye G, Yang L, et al. The Impact of Social Support on Public Anxiety amidst the Covid-19 Pandemic in China. Int J Environ Res Public Health (2020) 17(23):9097–14. doi:10.3390/ijerph17239097
2. Yang Y, Lu Y, Yang L, Gou Z, Liu Y. Urban Greenery Cushions the Decrease in Leisure-Time Physical Activity during the Covid-19 Pandemic: A Natural Experimental Study. Urban For Urban Green (2021) 62:127136. doi:10.1016/j.ufug.2021.127136
3. Yang L, Liu Y, Han L, Ao Y, Yang H. Impact of Covid-19 on Mental Health of Chinese Residents in its Initial Stage. Front Psychol (2021) 12:722093. doi:10.3389/fpsyg.2021.722093
4. Wen Y, Leng J, Shen X, Han G, Sun L, Yu F. Environmental and Health Effects of Ventilation in Subway Stations: A Literature Review. Int J Environ Res Public Health (2020) 17(3):1084. doi:10.3390/ijerph17031084
5. Seino K, Takano T, Nakamura K, Watanabe M. An Evidential Example of Airborne Bacteria in a Crowded, Underground Public Concourse in Tokyo. Atmos Environ (2005) 39(2):337–41. doi:10.1016/j.atmosenv.2004.09.030
6. Hwang SH, Cho JH. Evaluation of Airborne Fungi and the Effects of a Platform Screen Door and Station Depth in 25 Underground Subway Stations in Seoul, South Korea. Air Qual Atmos Health (2016) 9(5):561–8. doi:10.1007/s11869-015-0361-4
7. Cui J, Lin D. Utilisation of Underground Pedestrian Systems for Urban Sustainability. Tunnelling Underground Space Tech (2016) 55:194–204. doi:10.1016/j.tust.2015.11.004
8. Zhang J, Litvinova M, Liang Y, Wang Y, Wang W, Zhao S, et al. Changes in Contact Patterns Shape the Dynamics of the Covid-19 Outbreak in China. Science (2020) 368(6498):1481–6. Epub 2020/05/01. doi:10.1126/science.abb8001
9. Ali ST, Wang L, Lau EHY, Xu X-K, Du Z, Wu Y, et al. Serial Interval of Sars-Cov-2 Was Shortened over Time by Nonpharmaceutical Interventions. Science (2020) 369(6507):1106–9. doi:10.1126/science.abc9004
10. Li Y, Qian H, Hang J, Chen X, Cheng P, Ling H, et al. Probable Airborne Transmission of Sars-Cov-2 in a Poorly Ventilated Restaurant. Building Environ (2021) 196:107788. Epub 2021/03/23. doi:10.1016/j.buildenv.2021.107788
11. Wang W, Wang F, Lai D, Chen Q. Evaluation of SARS-COV-2 Transmission and Infection in Airliner Cabins. Indoor Air (2022) 32:e12979. doi:10.1111/ina.12979
12. Zacharias J, He J. Hong Kong's Urban Planning experiment in Enhancing Pedestrian Movement from Underground Space to the Surface. Tunnelling Underground Space Tech (2018) 82:1–8. doi:10.1016/j.tust.2018.07.025
13. Lu K, Han B. Congestion Risk Evaluation and Precaution of Passenger Flow in Metro Stations. Open Civil Eng J (2016) 10:93–104. doi:10.2174/1874149501610010093
14. Lei B, Liu X, Cao Z, Hao Y, Zhang Y, Chen X. Modeling and Forecasting of COVID-19 Spread in Urban Rail Transit System. J Traffic Transportation Eng (2020) 20(3):139–49. doi:10.19818/j.cnki.1671-1637.2020.03.013
15. Johansson A, Batty M, Hayashi K, Al Bar O, Marcozzi D, Memish ZA. Crowd and Environmental Management during Mass Gatherings. Lancet Infect Dis (2012) 12(2):150–6. Epub 2012/01/19. doi:10.1016/S1473-3099(11)70287-0
16. Gu Z, Osaragi T, Lu W. Simulating Pedestrians' Spatio-Temporal Distribution in Underground Spaces. Sust Cities Soc (2019) 48:101552. doi:10.1016/j.scs.2019.101552
17. Huang B, Wang J, Cai J, Yao S, Chan PKS, Tam TH-w., et al. Integrated Vaccination and Physical Distancing Interventions to Prevent Future Covid-19 Waves in Chinese Cities. Nat Hum Behav (2021) 5(6):695–705. Epub 2021/02/20. doi:10.1038/s41562-021-01063-2
18. Hu S, Xiong C, Yang M, Younes H, Luo W, Zhang L. A Big-Data Driven Approach to Analyzing and Modeling Human Mobility Trend under Non-pharmaceutical Interventions during Covid-19 Pandemic. Transportation Res C: Emerging Tech (2021) 124:102955. doi:10.1016/j.trc.2020.102955
19. Sun K, Wang W, Gao L, Wang Y, Luo K, Ren L, et al. Transmission Heterogeneities, Kinetics, and Controllability of Sars-Cov-2. Science (2021) 371(6526):eabe2424. Epub 2020/11/26. doi:10.1126/science.abe2424
20. Xiao Y, Yang M, Zhu Z, Yang H, Zhang L, Ghader S. Modeling Indoor-Level Non-pharmaceutical Interventions during the Covid-19 Pandemic: A Pedestrian Dynamics-Based Microscopic Simulation Approach. Transport Policy (2021) 109:12–23. Epub 2021/05/25. doi:10.1016/j.tranpol.2021.05.004
21. Huang W, Lin Y, Mingbo W. Spatial-Temporal Behavior Analysis Using Big Data Acquired by Wi-Fi Indoor Positioning System (2017).
22. Zhang N, Tang JW, Li Y. Human Behavior during Close Contact in a Graduate Student Office. Indoor Air (2019) 29(4):577–90. Epub 2019/03/26. doi:10.1111/ina.12554
23. Gu Z, Osaragi T. Estimating Pedestrians' Movement in Underground Space Based on Flow Count Data. Trans AIJ (2016) 81:2625–34. doi:10.3130/aija.81.2625
24. Redmon J, Divvala S, Girshick R, Farhadi A. You Only Look once: Unified, Real-Time Object Detection. In: Proceeding of the 2016 IEEE Conference on Computer Vision and Pattern Recognition (CVPR); June 2016; Las Vegas, NV, USA. IEEE (2015).
25. Wang H, Du H, Zhao Y, Yan J. A Comprehensive Overview of Person Re-identification Approaches. Ieee Access (2020) 8:45556–83. doi:10.1109/ACCESS.2020.2978344
26. Willis A, Gjersoe N, Havard C, Kerridge J, Kukla R. Human Movement Behaviour in Urban Spaces: Implications for the Design and Modelling of Effective Pedestrian Environments. Environ Plann B Plann Des (2004) 31(6):805–28. doi:10.1068/b3060
27. Saramäki J, Kivelä M, Onnela J-P, Kaski K, Kertész J. Generalizations of the Clustering Coefficient to Weighted Complex Networks. Phys Rev E (2007) 75(2):027105. doi:10.1103/PhysRevE.75.027105
28. Fagiolo G. Clustering in Complex Directed Networks. Phys Rev E (2007) 76(2 Pt 2):026107. doi:10.1103/PhysRevE.76.026107
Keywords: COVID-19, underground space, agent-based simulation, social network analysis, spatiotemporal contact, shop utilization
Citation: Gu Z, Su S, Lu W and Yao Y (2022) Estimating Spatiotemporal Contacts Between Individuals in Underground Shopping Streets Based on Multi-Agent Simulation. Front. Phys. 10:882904. doi: 10.3389/fphy.2022.882904
Received: 05 March 2022; Accepted: 28 April 2022;
Published: 13 May 2022.
Edited by:
Huijia Li, Beijing University of Posts and Telecommunications, ChinaReviewed by:
Lin Wang, University of Cambridge, United KingdomYilun Shang, Northumbria University, United Kingdom
Copyright © 2022 Gu, Su, Lu and Yao. This is an open-access article distributed under the terms of the Creative Commons Attribution License (CC BY). The use, distribution or reproduction in other forums is permitted, provided the original author(s) and the copyright owner(s) are credited and that the original publication in this journal is cited, in accordance with accepted academic practice. No use, distribution or reproduction is permitted which does not comply with these terms.
*Correspondence: Wei Lu, bHV3ZWllZHNAZGx1dC5lZHUuY24=
 Zongchao Gu
 Sunhao Su
 Wei Lu
 Yishu Yao