- 1School of Optics and Photonics, Beijing Institute of Technology, Beijing, China
- 2Beijing Key Laboratory for Precision Optoelectronic Measurement Instrument and Technology, Beijing, China
- 3Yangtze Delta Region Academy of Beijing Institute of Technology, Jiaxing, China
- 4National Astronomical Observatories, Chinese Academy of Science, Beijing, China
We proposed a diffuse imaging approach for universal noninvasive blood glucose measurements based on visible light, which can predict the blood glucose concentration without personal calibration. The proposed approach used a CCD to obtain diffuse images from human index finger pulp. The denoising autoencoder algorithm adopted effectively extracted the scattering information highly related to blood glucose concentration from the diffuse images, and the gradient boosting regression algorithm enabled an accurate calculation of blood glucose concentration without prior personalized calibration. In vivo experimental results showed that the proposed approach had a mean absolute error of 19.44 mg/dl, with all the predicted results observed within the clinically acceptable region (Region A: 78.9%) in the Clarke error grid analysis. Compared to other blood glucose concentration measurement methods of scattering coefficient, this new method does not require individual calibration, therefore it is easier to implement and popularize, which is critical for the noninvasive monitoring of blood glucose concentration.
1 Introduction
Diabetes mellitus (DM) is a metabolic endocrine disease characterized by hyperglycaemia, which may cause many complications, such as heart disease, disability, and even death. DM has become the third serious threat to human health after cardio cerebrovascular disease and cancer in the world [1, 2]. According to the International Diabetes Federation, there were approximately 463 million adults with DM worldwide in 2019, with this number expected to increase to 700 million by 2045 [3]. The blood glucose concentration measurement method used clinically is to draw blood from a patient’s vein or fingertips, and then a chemical test paper is used to determine the blood glucose concentration from the blood. This method not only makes the patient susceptible to infection, but also increases the economic burden and causes mental pain. In recent years, lots of efforts have been put into research and development in noninvasive measurement methods of blood glucose based on optical methods to solve these issues [4–7]. These optical methods specifically include near-infrared spectroscopy, Raman spectroscopy, bioimpedance spectroscopy [5, 6], thermal emission spectroscopy, and blood glucose measurement sensors based on cutting-edge tapered [9] optical fiber sensors [8–10].
The strong scattering property of skin tissue makes the scattered light more sensitive to the change of blood glucose concentration. Researchers have found that blood glucose levels may be predicted using the variation of scattering coefficient [11, 12]. Bruulsema et al [13] found a strong correlation between blood glucose concentration and scattering coefficient in DM patients. They provided a new idea that the scattering coefficient was estimated noninvasively based on measurements of the diffuse reflectance on the skin. This study was performed to evaluate the sensitivity of the tissue scattering coefficient in response to step changes in the blood glucose levels, and further verified the study in 41 DM patients. Heinemann et al. [14] demonstrated that in the visible and near-infrared light region, the effect of scattering was much higher than that of absorption in tissue. An increase in blood glucose concentration led to a decrease in the scattering coefficient of turbid suspension in both phantom studies and type I diabetic patients. Tianjin University’s research [15] further demonstrated that the effect of the scattering coefficient on the diffuse reflectance was greater than that of the absorption coefficient. In their study, they separated the absorption coefficient and scattering coefficient of human tissue [16, 17]. However, although the relationship between blood glucose concentration and scattering coefficient has been studied to a certain extent, the accurate measurement model of blood glucose concentration by using scattering coefficient has not been further promoted [19, 20].
Deep learning algorithm shows strong computing power in the medical field, the optical method combing the deep learning algorithms is considered as one of the most promising measurement methods to set up a blood glucose model and has received extensive attention and research [18–21]. Bob Zhang [22] addressed a noninvasive method to detect DM patients based on facial block color features by using an image sensor with a collaborative representation classifier. In the collaborative representation classifier, the healthy facial color feature and the diabetic facial color feature were used to establish the relationship to determine whether the patient had DM. However, this classifier just classified the healthy people and the DM patients, which belonged to quantitative analysis, and did not measure the blood glucose concentration. Segman [23] employed a personal calibration procedure to associate blood glucose concentration and multiple optical signals which were derived from a fingertip response to light emission in the range of visible to infrared light. However, this model obtained the blood glucose concentration value in an invasive way to establish the personal calibration procedure. The model was only suitable for the individual of blood glucose measurement and did not have a universal application. Therefore, establishing a universal model for the measurement of blood glucose concentrations remains challenging. As for how to establish a universal model for the prediction of blood glucose concentration by using scattering information from human tissue has not been well understood.
In this paper, we presented a noninvasive blood glucose concentration measurement approach based on diffuse imaging. We used the denoising autoencoder (DAE) [24] to extract the weak blood glucose signal from the diffuse images of human fingertips, and a universal blood glucose calibration model was established between the diffuse images and scattering coefficient by gradient boosting regression (GBR) [25]. The experimental results showed consistency with the existing invasive device measurements.
2 Methods
Compared with the absorption coefficient, the scattering coefficient is not susceptible to interference from other components in the tissue fluid, so it is more likely to establish a general model by using the relationship between the scattering coefficient and blood glucose concentration. Theoretical and in vitro studies [13, 26] also showed that visible light absorbed very little blood glucose. Heinemann [27] investigated changes of blood glucose concentration induced by an oral glucose experiment that can be monitored by registration of scattering coefficient changes. The scattering coefficient of biological tissue is mainly caused by the mismatch between the refractive index of the scattering particle ns in the tissue fluid and the refractive index of the tissue fluid nm. Under the assumption that the scattering condition is approximately consistent with the Rayleigh-Gans theory [26], the scattering coefficient can be expressed as
where k is a proportionality factor related to particle size, wavelength, particle density, and scattering angle. The change value of the scattering coefficient caused by the change of blood glucose concentration is written as
where nmc is the refractive index of the tissue fluid when blood glucose concentration is cg, nm0 is the refractive index of the tissue fluid when blood glucose concentration is 0. The change of tissue fluid refractive index caused by the change of blood glucose concentration is small, we can consider as
Assuming that the scattering coefficient is μs0 when the concentration of blood glucose is 0, we can deduce that
According to the [28], the refractive index of the scatter particle ns is 1.46 and when the concentration of blood glucose is 0, the refractive index of the tissue fluid nm0 is 1.35, respectively. The refractive index of the scattering tissue fluid changes
Equation 5 indicates that the change of scattering coefficient caused by the change of blood glucose concentration is still slight. Therefore, the accuracy of the instrument is not enough to obtain the changing relationship of blood glucose concentration from the scattering coefficient by the diffuse reflectance spectroscopy method. Compared with the one-dimensional diffuse reflectance spectroscopy information, the two-dimensional diffuse images contain more features related to the scattering information from the change of blood glucose concentration.
Extracting useful information from the diffuse images and eliminating the interference factors independent of the blood glucose concentration, which are critical to build an accurate model. In this paper, we adopted the DAE network to extract the weak scattering information caused by the change of blood glucose concentration in two-dimensional diffuse images, and estimated the blood glucose concentration by combining with the GBR algorithm. The network structure of the autoencoder is shown in Figure 1. The autoencoder consists of an encoder and a decoder. The encoder converts an input signal into a coded signal, and the decoder converts the coded signal into an output signal. The output signal reproduces the input signal as much as possible.
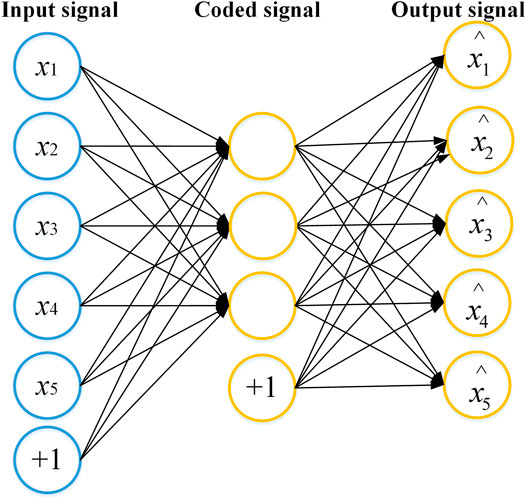
FIGURE 1. The network structure of the autoencoder. The autoencoder consists of an encoder and a decoder. The encoder converts an input signal into a coded signal, and the decoder converts the coded signal into an output signal. The output signal reproduces the raw input signal as much as possible.
The DAE randomly adds noise to the input signal of the autoencoder, so that features extracted from the whole DAE network structure occupies the robustness. The core idea of DAE is to select the best feature, which is extracted from the raw data by using the autoencoder. The best feature refers to the feature that can be used to recover the raw data when the raw data is corrupted. The network structure of the DAE is shown in Figure 2A, where input x (the ROIs of the raw diffuse images) is corrupted according to the stochastic mapping distribution to get
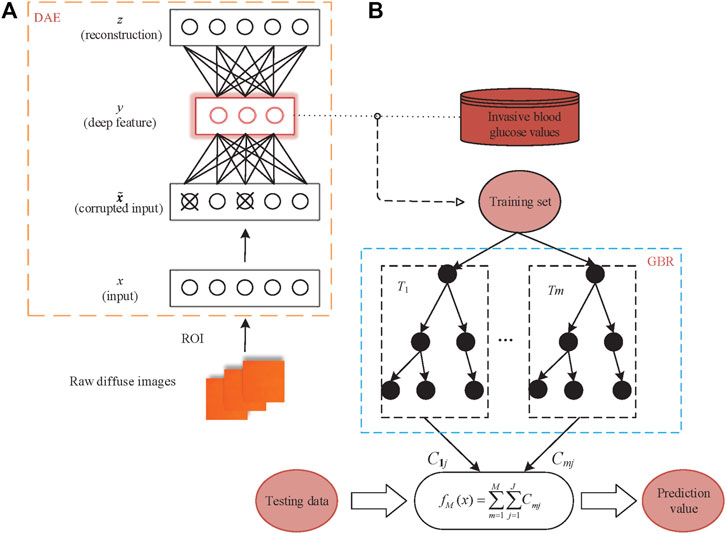
FIGURE 2. Detailed network structure of the proposed algorithm (A) the DAE model; (B) the GBR model.
After training N epochs, the loss function on the training set converged to less than the threshold we set. Then, we extracted the vector s from the DAE middle layer as the deep features of the diffuse images. Specifically, the dimension of the deep feature is the scattering information of the raw diffuse images extracted in the middle layer of the DAE network. Finally, we used the deep features as the input x of the regression model to establish a universal GBR model connecting the deep features and blood glucose concentration. The GBR algorithm uses regression trees as weak learners with its structure shown in Figure 2B.
The basic function of the GBR algorithm is a binary regression tree. First initialize a regression tree, and then learn the next regression tree according to the residual of the previous regression tree. The regression tree was learned to obtain the final model by fitting the residual of the current model. Let us denote Q = (s1, y1), (s2, y2), …, (sn, yn), where si is the input composed of the deep features extracted from diffuse images by DAE, and yi is the reference values of the blood glucose concentration from the invasive method. We suppose T1, T2, ... TM as the M regression trees, C1j, C2j, ..., Cmj is the corresponding output of mth (m = 1, 2... M) regression trees, where j is the number of leaf nodes (j = 1,2... J) and Rjm is leaf node area. The final fitting regression tree is as follows:
The negative gradient of the loss function is used as an approximation of the residual in the GBR algorithm. The negative gradient the loss function of the ith subject in mth regression tress can be expressed as:
where L (y, f(s)) represents the loss function, f(s) is the prediction values of the blood glucose concentration, respectively.
The fit residual error of jth leaf node (j = 1, 2, ..., J) is as follow:
By updating fm−1(x), we can eventually calculate the blood glucose prediction f(s).
3 Experimental System
Figure 3 shows the experimental system for obtaining the diffuse images of fingers. The experimental system is composed of an imaging system, a light-emitting diode (LED) red light source, a specially designed shell and a computer. The imaging system includes a 1/1.2″ CCD sensor (FLIR co. BFLY-U3-23S6C-C), and a lens (ZLKC. VM0812MP) with an 8 mm focal length, and a 1.4 F-number. The frame rate captured by the CCD sensor is set to 25 frames/s and pixel resolution is 640 × 480 pixels. The size of the LED light source is 20 mm × 20 mm, which is integrated by four monochromatic lights with a wavelength of 625 nm. The angle between the light path of the illumination and imaging is 45°. The rated current is 700 mA and the voltage is 9–10 V. The imaging accuracy is 50 db and the speed of exposure is 30 ms. This specially designed shell reduces the interference from the external ambient light, measurement location, and image capture angle, and fixes the CCD and light source while retaining the collection hole of the test site. To avoid variation caused by the inconsistent measurement positions of different individuals, we collect diffuse images from the index finger pulp with a relatively stable surface and abundant blood vessels. The light, emitted from the LED red light source, which is irradiated to the index finger. Then, the light is diffused by the index finger. Finally, the diffuse images of the index fingers are obtained by the CCD target surface and transmitted to the computer to process.
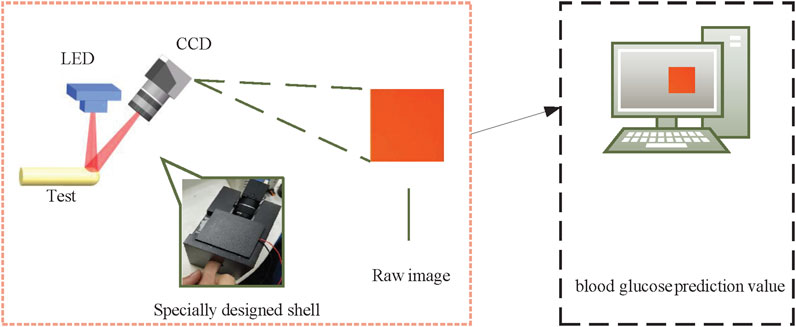
FIGURE 3. Diagram of the system. A specially designed shell is used to fix the LED, CCD and a position for the test.
4 Data Processing and Analysis
The research protocol was approved by the Medical Ethics Committee of Medical and Laboratory Animal of Beijing Institute of Technology with approval code 2021-004. We obtained 188 image data from different subjects including 49 healthy people and 139 DM patients. The healthy people were from the Beijing Key Laboratory for Precision Optoelectronic Measurement Instrument and Technology with an average age of 25.0, and the DM patients were from the Xian Tao First People’s Hospital Diabetes Center and Taiyuan Central Hospital Diabetes Center with an average age of 43.3. The healthy were verified via hospital examinations. The 139 DM patients included 54 early-stage patients with an average duration of 2.1 years and 85 long-term patients with an average duration of 4.9 years. The detailed information of the subjects was shown in Table 1. During in vivo experiment, every subject was required to place the left-hand index finger in the collection hole of the specially designed shell to capture a diffuse image, while the right index finger was used to collect reference blood glucose concentration value by invasive blood glucose measurement instrument. The reference blood glucose concentration value for in vivo subjects was obtained by using a commercial device (Rightest glucometer GM300).
The most intuitive and basic information representation method of diffuse images is the gray value and gradient. High gray value (high energy) and high gradients (high energy changes) in the diffuse images can remove most of the redundant information. The following factors are crucial considerations for the selection of ROI size for diffuse images. First, the specular reflection in the captured diffuse images occupied a larger proportion and was an important factor affecting the accuracy of this proposed method. The specular reflection area almost did not carry tissue optical information, which interfered with our choice of ROI area. Thus, we chose the ROI with a special size from the rest region of the diffuse images instead of the specular reflection region. In addition, every subject also had different finger sizes, so we need to keep the same selection size in all diffuse images from subjects’ fingers. Finally, we considered that the ROI had a certain brightness but did not involve specular reflection, and also took into account the size of the subject’s finger. So we selected a region with a size of 28 × 28 pixels centered on the maximum gray value of the diffuse image as the ROI region after removing the specular reflection information. The diffuse image obtained by a subject’s finger and the ROI were shown in Figure 4. We got the ROIs with 28 × 28 pixels of diffuse images from 188 subjects.
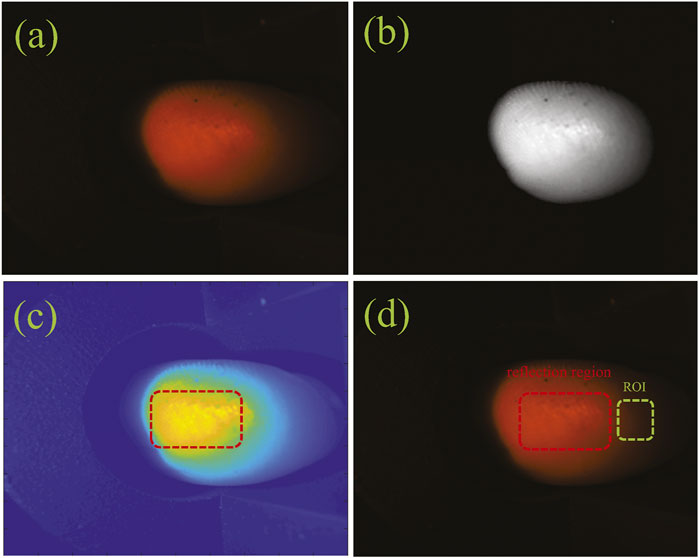
FIGURE 4. The ROI of a diffuse image: (A) the original diffuse image; (B) the gray image; (C) the reflection image; (D) the ROI image.
We approximately adopted the 4:1 ratio when dividing into the training set and testing set from those ROIs. To train the DAE, we selected an ROI with the size of 28 × 28 pixels as the input, then extracted different dimensions from the DAE middle layer as the deep features of diffuse images. We extracted the deep features of 150 training subjects in different dimensions and adopted the GBR algorithm to establish the models of different dimension deep features, the results from the 38 testing subjects were as shown in Figure 5. The results showed that when the 1 × 16 dimensional vectors were selected as the deep features, the difference between the predicted value and the reference value was the smallest. Simultaneously, the prediction accuracy of the prediction model corresponding to the deep features of different dimensions were shown in Table 2. The results were evaluated in terms of the mean absolute error (MAE), root mean squared error (RMSE), and mean squared error (MSE).
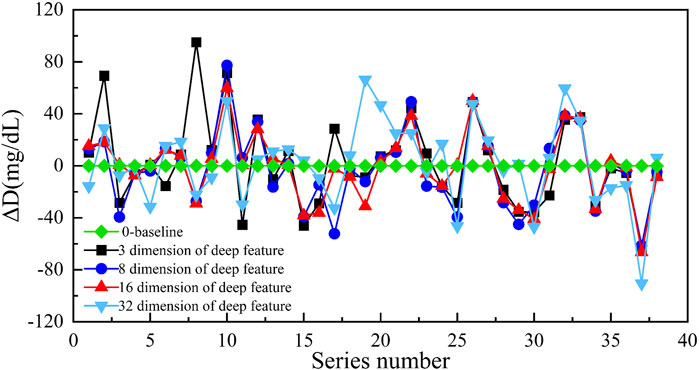
FIGURE 5. The prediction result of different dimensional deep features (the ordinate is the difference between the predicted value and reference value, and the abscissa is the number of samples).
The results of Table 2 indicated that when we chose the 1 × 16 dimensional deep features, the MAE was the smallest (19.44 mg/dl). Hence, we selected the 1 × 16 dimensional deep features as the input to establish the GBR model to predict the blood glucose concentration in this paper. We believed that the reason was the uneven distribution of subjects’ blood glucose concentration. The most range of the blood glucose concentration from the subjects was concentrated in 90 mg/dl–234 mg/dl with a proportion of 87.5%. In addition, the number of subjects also limited the dimensionality of the deep features extracted. Indeed, the dimension of deep features depends on the number of blood glucose samples used for training and the range of concentration values of blood glucose samples. Due to the limitation of sample size and concentration range, when the dimension of the deep features is too small, the scattering information of the diffuse images cannot be fully carried. When the dimension of deep features is too abundant, the DAE network will appear overfitting. These will lead to an increase in the prediction error of blood glucose concentration.
We compared the performance of the proposed method with several different multivariate calibration methods in different testing subjects. The results were still evaluated in terms of MAE, RMSE, and MSE. In addition, we added the Pearson correlation coefficient (R) as an evaluation indicator. Previous studies [29] had shown that the prediction results of the support vector regression (SVR) model were more accurate than the partial least squares regression (PLSR) method. Our experimental results also confirmed this conclusion. The comparative results of 38 testing subjects were shown in Table 3. The values of MAE, RMSE, and MSE indicated that the proposed method achieved highly improved results as compared with the other commonly used multivariate correction methods. Furthermore, the results from the proposed model were consistent with the invasive results with an R of 0.73. The 38 testing subjects were from different individuals (including healthy and DM patients), which also demonstrated the universal applicability of the proposed model.
To further verify the accuracy, we used Clarke error grid (CEG) analysis to compare the results from the predicted blood glucose concentration values of 38 subjects with the invasive reference blood glucose concentration. Figure 6 presents the CEG analysis, where the scatter plot can be divided into five regions. These regions quantify the accuracy of the blood glucose concentration reference values as compared to the predicted blood glucose concentration values in terms of the different types of errors. The CEG analysis results showed 78.9% of the estimated blood glucose concentration values fell in zone A and 100% in the clinically acceptable zones A and B, demonstrating the efficacy of the proposed noninvasive blood glucose concentration measurement method. Our method adopted significantly improved the prediction accuracy as compared with the other commonly used multivariate correction methods.
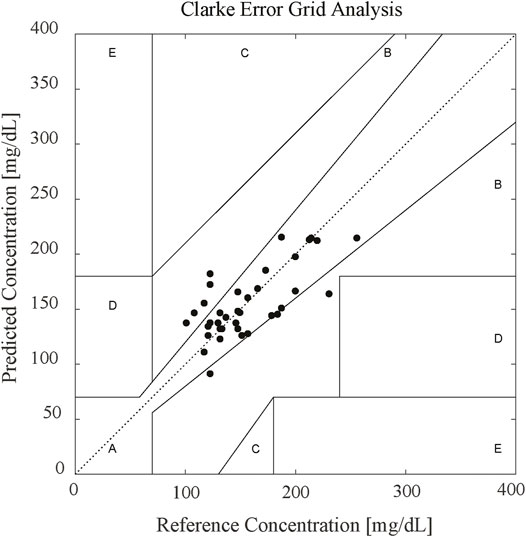
FIGURE 6. CEG result of 38 in vivo subjects. 78.9% of the estimated blood glucose values fell in zone A and 100% in the clinically acceptable zones A and B.
In fact, the number and the distribution of blood glucose concentration values from subjects affected the accuracy of the prediction model. The blood glucose concentrations obtained from different subjects were densely distributed in the 90 mg/dl–234 mg/dl range, sparsely distributed near the upper and lower limits of the range. Therefore, the prediction concentrations of the blood glucose had a larger error near the upper and lower limits of 90 mg/dl–234 mg/dl range, which increased the average error of the GBR model. By increasing the number of subjects near the upper and lower limits of blood glucose concentration values, the accuracy of the prediction model can be further improved. Moreover, the number of subject samples affected the selection of the optimal dimension of the deep features extracted by the DAE network, which determined the prediction accuracy of the blood glucose concentration. Expanding the number of the subject samples can obtain a more reliable dimension selection of the deep features.
5 Conclusion
In this paper, a universal calibration model for the noninvasive measurement of blood glucose concentration based on diffuse images was presented. This model connecting the scattering information and blood glucose concentration was established by extracting the deep features of the acquired diffuse images. First, a diffuse image of the left-hand index finger pulp from each subject was collected via a special shell and recorded by the CCD. After that, the deep features DAE network extracted from the diffuse images were used in the GBR model to establish the relationship between blood glucose concentration and scattering information. Finally, in vivo experimental results indicated the feasibility of the proposed method for the noninvasive prediction value of blood glucose concentration with an MAE of 19.44 mg/dl and an R of 0.73 in 1 × 16 dimensional deep features.
In this case, ambient temperature-controlled at 26řC and relative humidity is 33%. The room temperature and humidity during the measurement are in a controlled manner. Indeed, there still has a limitation of our study that the recruited subjects were all Asian. For future works, we should be combined with other physiological parameters (such as skin color, hydration, temperature, and humidity, etc.) to improve accuracy and correlation with blood glucose levels. We will also aim to collect more diffuse images of subjects’ fingers, enrich the distribution of blood glucose concentration values from DM patients and healthy individuals to further improve the prediction accuracy of the model. In addition, we will select the more reliable dimension of deep features due to the increased number of subject samples.
Data Availability Statement
The raw data supporting the conclusion of this article will be made available by the authors, without undue reservation.
Ethics Statement
The studies involving human participants were reviewed and approved by the Medical Ethics Committee of Medical and Laboratory Animal of Beijing Institute of Technology with approval code 2021-004. The patients/participants provided their written informed consent to participate in this study. Written informed consent was obtained from the individual(s) for the publication of any potentially identifiable images or data included in this article.
Author Contributions
All authors listed have made a substantial, direct, and intellectual contribution to the work and approved it for publication.
Funding
This work was supported by the National Natural Science Foundation of China (No. 61705010, No. 11774031, No. 61935001).
Conflict of Interest
The authors declare that the research was conducted in the absence of any commercial or financial relationships that could be construed as a potential conflict of interest.
Publisher’s Note
All claims expressed in this article are solely those of the authors and do not necessarily represent those of their affiliated organizations, or those of the publisher, the editors and the reviewers. Any product that may be evaluated in this article, or claim that may be made by its manufacturer, is not guaranteed or endorsed by the publisher.
Acknowledgments
The authors thank Xian Tao First People’s Hospital Diabetes Center and Taiyuan Central Hospital Diabetes Center for providing the Statistical dataset support.
References
1.American Diabetes Association. Diagnosis and Classification of Diabetes Mellitus. Diabetes Care (2014) 37(1):81–90. doi:10.2337/dc10-S062
2. Ogurtsova K, da Rocha Fernandes JD, Huang Y, Linnenkamp U, Guariguata L, Cho NH, et al. IDF Diabetes Atlas: Global Estimates for the Prevalence of Diabetes for 2015 and 2040. Diabetes Res Clin Pract (2017) 128:40–50. doi:10.1016/j.diabres.2017.03.024
3.IDF, Diabetes Atlas. International Diabetes Federation (2019). AvaliableAt: https://www.idf.org/aboutdiabetes/what-is-diabetes/facts-fifigures.html.
4. Hull EL, Matter NI, Olson BP, Ediger MN, Magee AJ, Way JF, et al. Noninvasive Skin Fluorescence Spectroscopy for Detection of Abnormal Glucose Tolerance. J Clin Translational Endocrinol (2014) 1(3):92–9. doi:10.1016/j.jcte.2014.06.003
5. Delbeck S, Vahlsing T, Leonhardt S, Steiner G, Heise HM. Non-invasive Monitoring of Blood Glucose Using Optical Methods for Skin Spectroscopy-Opportunities and Recent Advances. Anal Bioanal Chem (2019) 411(1):63–77. doi:10.1007/s00216-018-1395-x
6. He R, Wei H, Gu H, Zhu Z, Zhang Y, Guo X, et al. Effects of Optical Clearing Agents on Noninvasive Blood Glucose Monitoring with Optical Coherence Tomography: a Pilot Study. J Biomed Opt (2012) 17(10):101513. doi:10.1117/1.JBO.17.10.101513
7. So CF, Chung JWY, Siu MSM, Wong KS. Improved Stability of Blood Glucose Measurement in Humans Using Near Infrared Spectroscopy. Spectroscopy (2011) 25(3-4):137–45. doi:10.3233/SPE-2011-050710.1155/2011/542790
8. Yang Q, Zhu G, Singh L, Wang Y, Singh R, Zhang B, et al. Highly Sensitive and Selective Sensor Probe Using Glucose Oxidase/gold Nanoparticles/graphene Oxide Functionalized Tapered Optical Fiber Structure for Detection of Glucose. Optik (2020) 208:164536. doi:10.1016/j.ijleo.2020.164536
9. Gong P, Li X, Zhou X, Zhang Y, Chen N, Wang S, et al. Optical Fiber Sensors for Glucose Concentration Measurement: A Review. Opt Laser Tech (2021) 139:106981. doi:10.1016/j.optlastec.2021.106981
10. Cano Perez JL, Gutiérrez-Gutiérrez J, Perezcampos Mayoral C, Pérez-Campos EL, Pina Canseco Md. S, Tepech Carrillo L, et al. Fiber Optic Sensors: A Review for Glucose Measurement. Biosensors (2021) 11(3):61. doi:10.3390/bios11030061
11. Kohl M, Essenpreis M, Böcker D, Cope M. Influence of Glucose Concentration on Light Scattering in Tissue-Simulating Phantoms. Opt Lett (1994) 19(24):2170–2. doi:10.1364/OL.19.002170
12. Yu L-P, Wu J-S, Chang S-Y, Chou C. Glucose Detection in a Highly Scattering Medium with Diffuse Photon-Pair Density Wave. J Innov Opt Health Sci (2017) 10(01):1650032. doi:10.1142/S1793545816500322
13. Bruulsema JT, Hayward JE, Farrell TJ, Patterson MS, Heinemann L, Berger M, et al. Correlation between Blood Glucose Concentration in Diabetics and Noninvasively Measured Tissue Optical Scattering Coefficient. Opt Lett (1997) 22(3):190–2. doi:10.1364/OL.22.000190
14. Heinemann L, Schmelzeisen-Redeker G. Non-invasive Continuous Glucose Monitoring in Type I Diabetic Patients with Optical Glucose Sensors. Diabetologia (1998) 41(7):848–54. doi:10.1007/s001250050998
15. Chen W, Liu R, Luo Y, Han Y, Xu K. Preliminary Study of Mechanism of Non-invasive Blood Glucose Measurement Based on Near-Infrared Diffuse Reflectance Spectroscopy. In: Proc. SPIE 5696, Complex Dynamics and Fluctuations in Biomedical Photonics II. 29 March 2005; San Jose, CA, 5696. (SPIE: United States) (2005). p. 91–100. doi:10.1117/12.589597
16. Liu J, Han T, Han G, Cai Z, Zhang Z, Liu B, et al. Optimum Source-Detector Separators for Diffuse Light in Noninvasive Tissue Constituent Sensing. JM3A (2016) 11. doi:10.1364/CANCER.2016.JM3A.11
17. Liu J, Han T, Jiang J, Xu K. Specialized Source-Detector Separations in Near-Infrared Reflectance Spectroscopy Platform Enable Effective Separation of Diffusion and Absorption for Glucose Sensing. Biomed Opt Express (2019) 10(9):4839–58. doi:10.1364/BOE.10.004839
18. Geng Z, Tang F, Ding Y, Li S, Wang X. Noninvasive Continuous Glucose Monitoring Using a Multisensor-Based Glucometer and Time Series Analysis. Sci Rep (2017) 7(1):1–10. doi:10.1038/s41598-017-13018-7
19. Sen Gupta S, Kwon T-H, Hossain S, Kim K-D. Towards Non-invasive Blood Glucose Measurement Using Machine Learning: An All-Purpose PPG System Design. Biomed Signal Process Control (2021) 68:102706. doi:10.1016/j.bspc.2021.102706
20. Zhang G, Mei Z, Zhang Y, Ma X, Lo B, Chen D, et al. A Noninvasive Blood Glucose Monitoring System Based on Smartphone PPG Signal Processing and Machine Learning. IEEE Trans Ind Inf (2020) 16(11):7209–18. doi:10.1109/TII.2020.2975222
21. Gusev M, Poposka L, Spasevski G, Kostoska M, Koteska B, Simjanoska M, et al. Noninvasive Glucose Measurement Using Machine Learning and Neural Network Methods and Correlation with Heart Rate Variability. J Sensors (2020) 2020:1–13. doi:10.1155/2020/9628281
22. Zhang B, Kumar BVKV, Zhang D. Noninvasive Diabetes Mellitus Detection Using Facial Block Color with a Sparse Representation Classifier. IEEE Trans Biomed Eng (2014) 61(4):1027–33. doi:10.1109/TBME.2013.2292936
23. Segman Y. Device and Method for Noninvasive Glucose Assessment. J Diabetes Sci Technol (2018) 12(6):1159–68. doi:10.1177/1932296818763457
24. Vincent P, Larochelle H, Bengio Y, Manzagol P-A. Extracting and Composing Robust Features with Denoising Autoencoders. In: Proceedings of the 25th International Conference on Machine Learning (ICML ’08) New York, NY:Association for Computing Machinery. (2008). p. 1096–1103. doi:10.1145/1390156.1390294
25. Friedman J, Hastie T, Tibshirani R. Additive Logistic Regression: a Statistical View of Boosting (With Discussion and a Rejoinder by the Authors). Ann Stat (2000) 28(2):337–407. doi:10.1214/aos/101612046310.1214/aos/1016218223
26. Maier JS, Walker SA, Fantini S, Franceschini MA, Gratton E. Possible Correlation between Blood Glucose Concentration and the Reduced Scattering Coefficient of Tissues in the Near Infrared. Opt Lett (1994) 19(24):2062–4. doi:10.1364/OL.19.002062
27. Heinemann L, Krämer U, Klötzer H-M, Hein M, Volz D, Hermann M, et al. Noninvasive Glucose Measurement by Monitoring of Scattering Coefficient during Oral Glucose Tolerance Tests. Diabetes Tech Ther (2000) 2(2):211–20. doi:10.1089/15209150050025168
28. Jacques SL. Origins of Tissue Optical Properties in the UVA, Visible, and NIR Regions. OSA TOPS Advances Optical Imaging Photon Migration (1996) 2:364–9.
Keywords: noninvasive blood glucose concentration monitoring, diffuse image, scattering coefficient, gradient boosting regression, deep feature
Citation: Liu M, Xu G, Zhao Y, Kong L, Dong L, Li F and Hui M (2022) Diffuse Imaging Approach for Universal Noninvasive Blood Glucose Measurements. Front. Phys. 10:853266. doi: 10.3389/fphy.2022.853266
Received: 12 January 2022; Accepted: 28 February 2022;
Published: 25 March 2022.
Edited by:
Karol Krzempek, Wrocław University of Science and Technology, PolandReviewed by:
Xiaojun Yu, Northwestern Polytechnical University, ChinaSantosh Kumar, Liaocheng University, China
Copyright © 2022 Liu, Xu, Zhao, Kong, Dong, Li and Hui. This is an open-access article distributed under the terms of the Creative Commons Attribution License (CC BY). The use, distribution or reproduction in other forums is permitted, provided the original author(s) and the copyright owner(s) are credited and that the original publication in this journal is cited, in accordance with accepted academic practice. No use, distribution or reproduction is permitted which does not comply with these terms.
*Correspondence: Yuejin Zhao, eWp6aGFvQGJpdC5lZHUuY24=; Lingqin Kong, a29uZ2xpbmdxaW4zMDI1QGJpdC5lZHUuY24=; Fen Li, ZmVueTIwMDRAc2luYS5jb20=
†These authors have contributed equally to this work
 Ming Liu
 Ge Xu
Ge Xu Yuejin Zhao1,2,3*
 Liquan Dong
 Fen Li

